
South African University Staff and Students’ Perspectives, Preferences, and Drivers of Hesitancy Regarding COVID-19 Vaccines: A Multi-Methods Study

 , ,
, ,  ,
,
Abstract
:1. Introduction
2. Materials and Methods
2.1. Study Design and Setting
2.2. Sample Size
2.3. Recruitment and Data Collection
2.4. Data Analysis
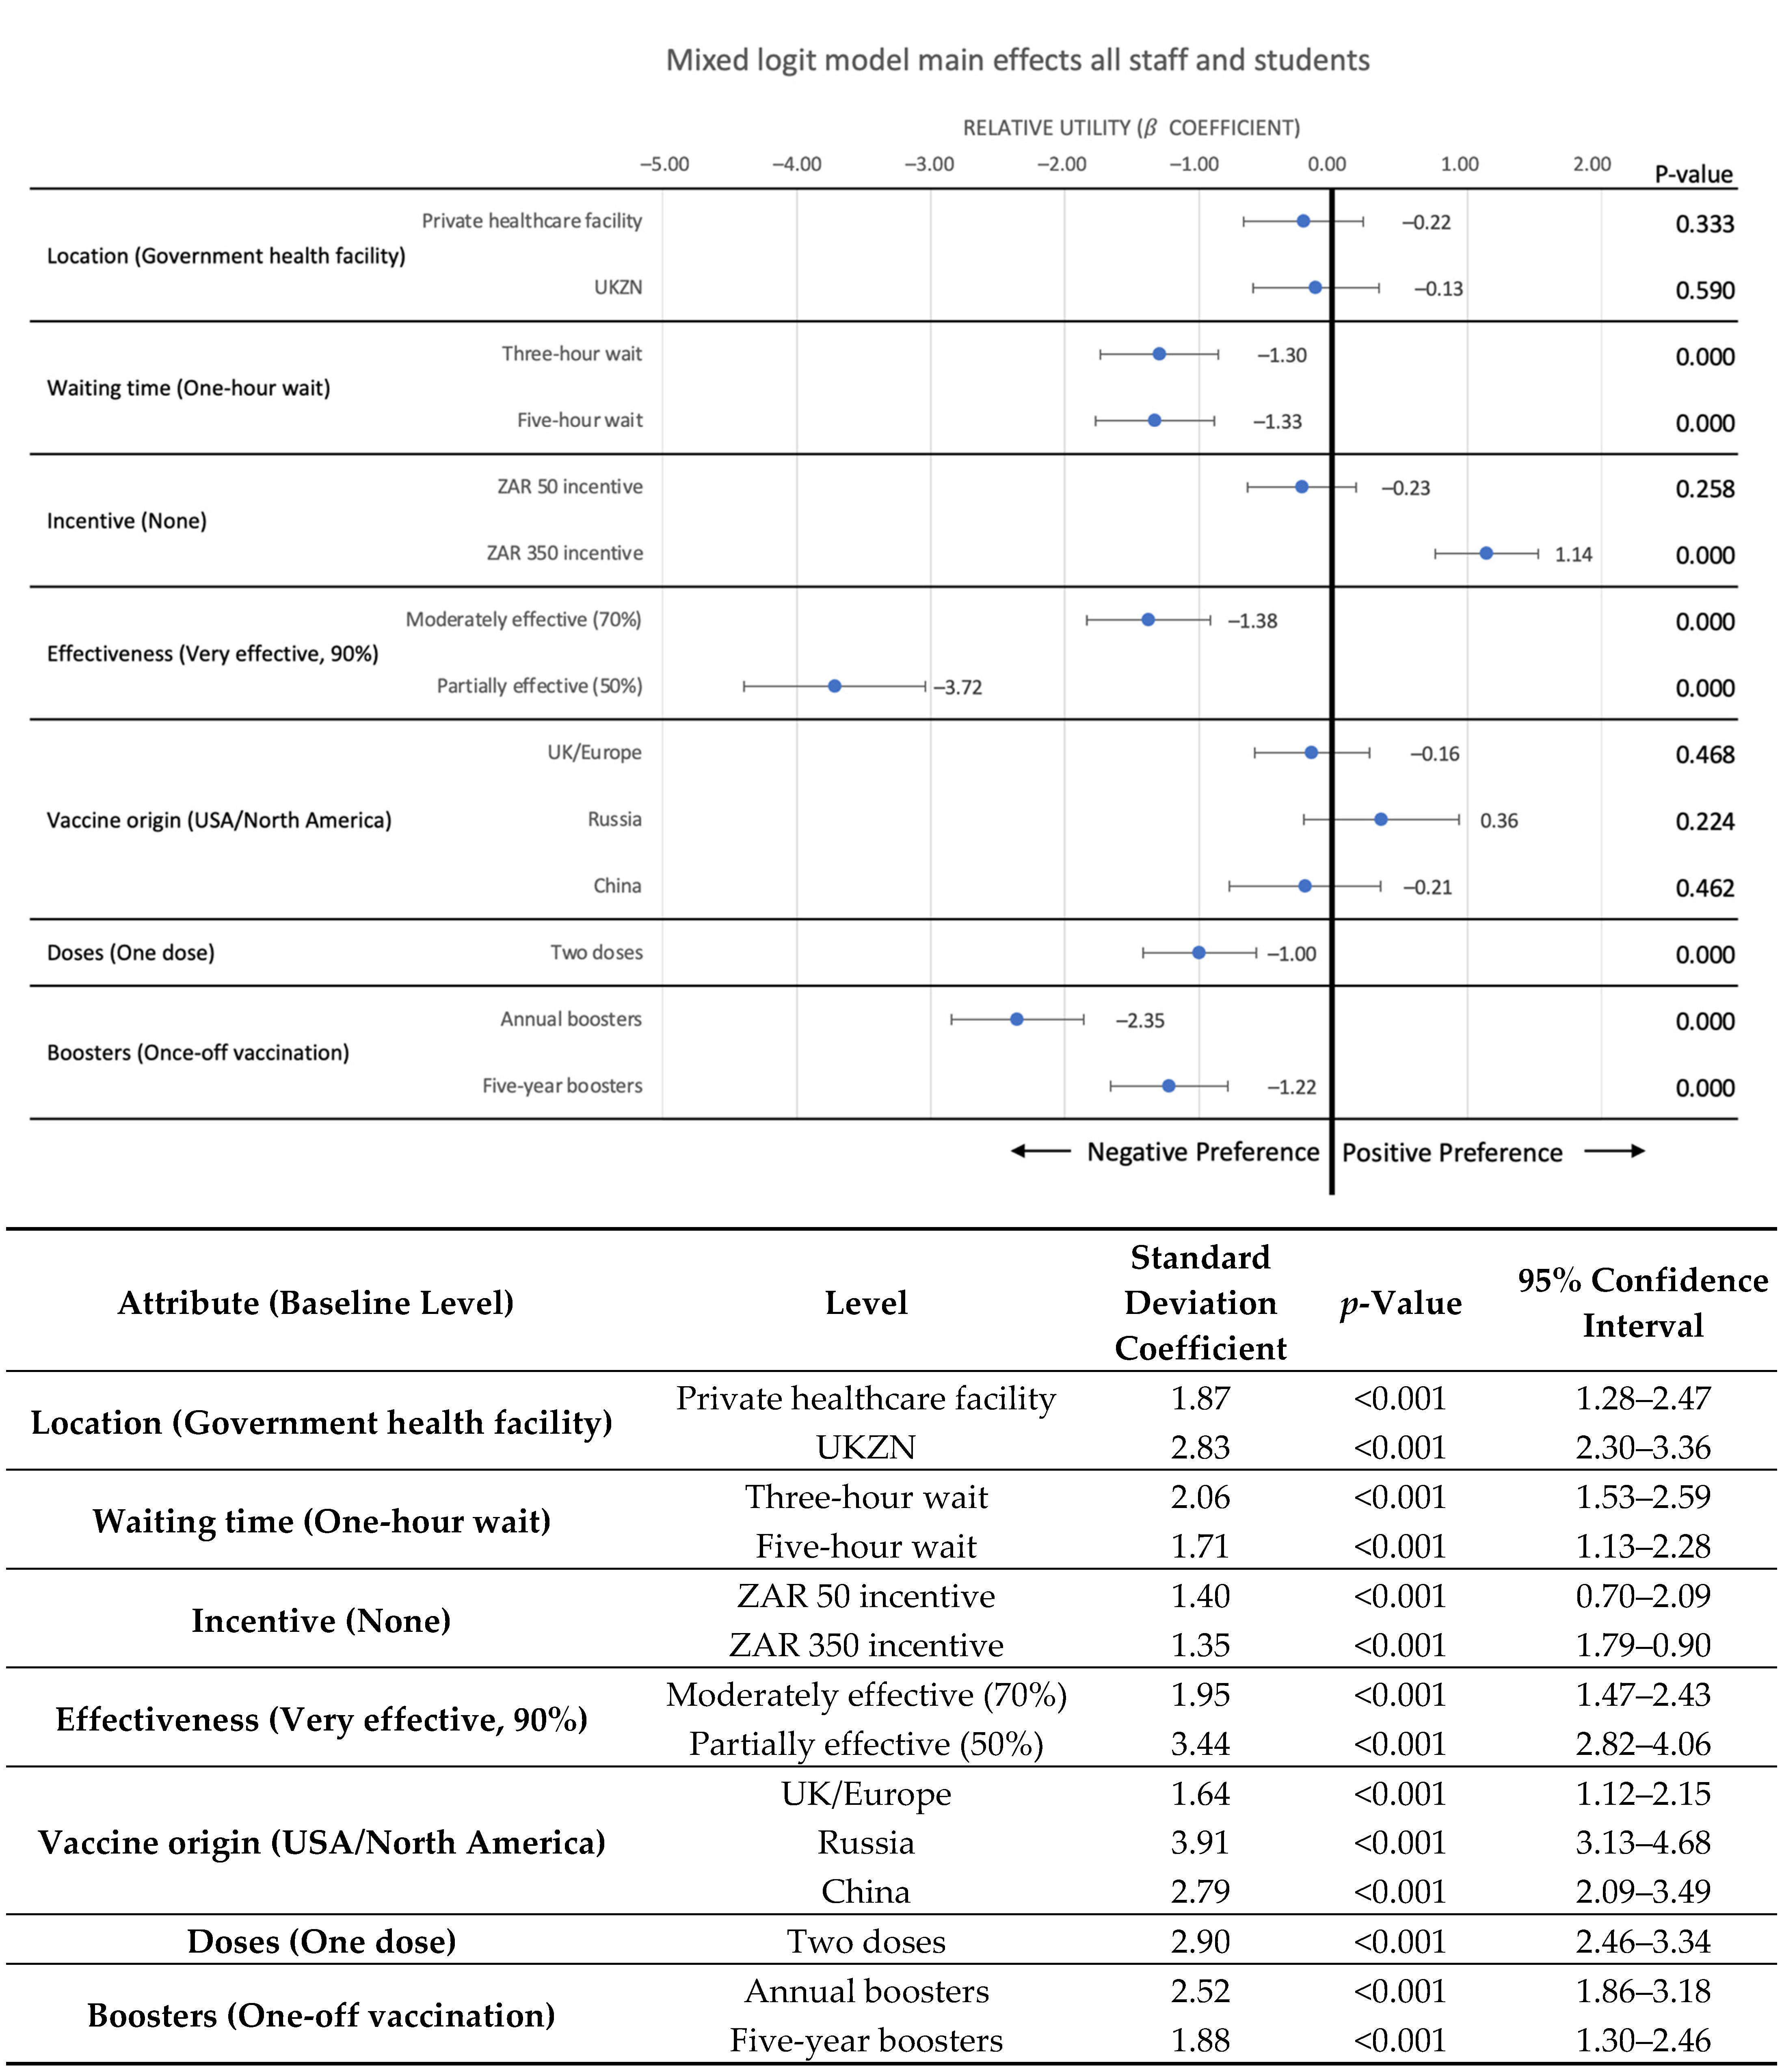
3. Results
4. Discussion
Strengths and Limitations
5. Conclusions
Supplementary Materials
Author Contributions
Funding
Institutional Review Board Statement
Informed Consent Statement
Data Availability Statement
Acknowledgments
Conflicts of Interest
References
- WHO. Coronavirus (COVID-19) Dashboard. Available online: https://covid19.who.int/ (accessed on 26 June 2021).
- Rumain, B.; Schneiderman, M.; Geliebter, A. Prevalence of COVID-19 in adolescents and youth compared with older adults in states experiencing surges. PLoS ONE 2021, 16, e0242587. [Google Scholar] [CrossRef]
- Lu, H.; Weintz, C.; Pace, J.; Indana, D.; Linka, K.; Kuhl, E. Are college campuses super spreaders? A data-driven modeling study. Comput. Methods Biomech. Biomed. Eng. 2021, 24, 1136–1145. [Google Scholar] [CrossRef]
- Ivory, D.; Gebeloff, R.; Mervosh, S. Young People Have Less Covid-19 Risk, but in College Towns, Deaths Rose Fast. Available online: https://www.nytimes.com/2020/12/12/us/covid-colleges-nursing-homes.html (accessed on 26 June 2022).
- WHO. Seventy-Third World Health Assembly: COVID-19 Response; World Health Organization: Switzerland, Geneva, 2020.
- Frederiksen, L.; Zhang, Y.; Foged, C.; Thakur, A. The long road toward COVID-19 herd immunity: Vaccine platform technologies and mass immunization strategies. Front Immunol. 2020, 11, 1817. [Google Scholar] [CrossRef]
- Mant, M.; Aslemand, A.; Prine, A.; Holland, A.J. University students’ perspectives, planned uptake, and hesitancy regarding the COVID-19 vaccine: A multi-methods study. PLoS ONE 2021, 16, e0255447. [Google Scholar] [CrossRef]
- Barello, S.; Nania, T.; Dellafiore, F.; Graffigna, G.; Caruso, R. ‘Vaccine hesitancy’ among university students in Italy during the COVID-19 pandemic. Eur. J. Epidemiol. 2020, 35, 781–783. [Google Scholar] [CrossRef]
- Riad, A.; Pokorná, A.; Antalová, N.; Krobot, M.; Zviadadze, N.; Serdiuk, I.; Koščík, M.; Klugar, M. Prevalence and drivers of COVID-19 vaccine hesitancy among Czech university students: National cross-sectional study. Vaccines 2021, 9, 948. [Google Scholar] [CrossRef] [PubMed]
- Baccolini, V.; Renzi, E.; Isonne, C.; Migliara, G.; Massimi, A.; De Vito, C.; Marzuillo, C.; Villari, P. COVID-19 Vaccine Hesitancy among Italian University Students: A Cross-Sectional Survey during the First Months of the Vaccination Campaign. Vaccines 2021, 9, 1292. [Google Scholar] [CrossRef]
- Hamdan, M.B.; Singh, S.; Polavarapu, M.; Jordan, T.R.; Melhem, N. COVID-19 vaccine hesitancy among university students in Lebanon. Epidemiol. Infect. 2021, 149, e242. [Google Scholar] [CrossRef]
- Sadaqat, W.; Habib, S.; Tauseef, A.; Akhtar, S.; Hayat, M.; Shujaat, S.A.; Mahmood, A. Determination of COVID-19 Vaccine Hesitancy Among University Students. Cureus 2021, 13, e17283. [Google Scholar] [CrossRef]
- University of KwaZulu-Natal (UKZN). Institutional Planning Reports; UKZN: Durban, South Africa, 2021. [Google Scholar]
- Roldan de Jong, T. Rapid Review: Perceptions of COVID-19 Vaccines in South Africa; Social Science in Humanitarian Action (SSHAP): Brighton, UK, 2021. [Google Scholar] [CrossRef]
- Runciman, C.; Roberts, B.; Alexander, K.; Bohler-Muller, N.; Bekker, M. Willingness to take a COVID-19 vaccine: A research briefing. UJ-HSRC COVID-19 Democr. Surv. 2021, 25, 1–18. [Google Scholar]
- University of KwaZulu-Natal (UKZN). Official UKZN Staff Statistics, Institutional Intelligence Planning and Governance Division; University of KwaZulu-Natal: Durban, South Africa, 2022. [Google Scholar]
- El-Elimat, T.; AbuAlSamen, M.M.; Almomani, B.A.; Al-Sawalha, N.A.; Alali, F.Q. Acceptance and attitudes toward COVID-19 vaccines: A cross-sectional study from Jordan. PLoS ONE 2021, 16, e0250555. [Google Scholar] [CrossRef]
- Mangham, L.J.; Hanson, K.; McPake, B. How to do (or not to do) … Designing a discrete choice experiment for application in a low-income country. Health Policy Plan. 2009, 24, 151–158. [Google Scholar] [CrossRef] [PubMed] [Green Version]
- Ryan, M.; Kolstad, J.R.; Rockers, P.C.; Dolea, C. How to Conduct a Discrete Choice Experiment for Health Workforce Recruitment and Retention in Remote and Rural Areas: A User Guide with Case Studies; The World Bank: Washington, DC, USA, 2012. [Google Scholar]
- Ryan, M.; Scott, D.A.; Reeves, C.; Bate, A.; Van Teijlingen, E.R.; Russell, E.M.; Napper, M.; Robb, C. Eliciting public preferences for healthcare: A systematic review of techniques. Health Technol. Assess. 2001, 5, 1–186. [Google Scholar] [CrossRef] [PubMed]
- Lancaster, K.J. A new approach to consumer theory. J. Political Econ. 1966, 74, 132–157. [Google Scholar] [CrossRef]
- McFadden, D. Measuring willingness-to-pay for transportation improvements. Theor. Found. Travel Choice Model. 1998, 339, 364. [Google Scholar]
- Thurstone, L.L. A law of comparative judgment. Psychol. Rev. 1994, 101, 266. [Google Scholar] [CrossRef]
- Kreps, S.; Prasad, S.; Brownstein, J.S.; Hswen, Y.; Garibaldi, B.T.; Zhang, B.; Kriner, D.L. Factors associated with US adults’ likelihood of accepting COVID-19 vaccination. JAMA Netw. Open 2020, 3, e2025594. [Google Scholar] [CrossRef]
- Craig, B.M. United States COVID-19 vaccination preferences (CVP): 2020 hindsight. Patient-Patient-Cent. Outcomes Res. 2021, 14, 309–318. [Google Scholar] [CrossRef]
- McPhedran, R.; Toombs, B. Efficacy or delivery? An online Discrete Choice Experiment to explore preferences for COVID-19 vaccines in the UK. Econ. Lett. 2021, 200, 109747. [Google Scholar] [CrossRef]
- Motta, M. Can a COVID-19 vaccine live up to Americans’ expectations? A conjoint analysis of how vaccine characteristics influence vaccination intentions. Soc. Sci. Med. 2021, 272, 113642. [Google Scholar] [CrossRef] [PubMed]
- Schwarzinger, M.; Watson, V.; Arwidson, P.; Alla, F.; Luchini, S. COVID-19 vaccine hesitancy in a representative working-age population in France: A survey experiment based on vaccine characteristics. Lancet Public Health 2021, 6, e210–e221. [Google Scholar] [CrossRef]
- Dong, D.; Xu, R.H.; Wong, E.L.; Hung, C.; Feng, D.; Feng, Z.; Yeoh, E.; Wong, S.Y. Public preference for COVID-19 vaccines in China: A discrete choice experiment. Health Expect. 2020, 23, 1543–1578. [Google Scholar] [CrossRef]
- Cook, R.D.; Nachtrheim, C.J. A comparison of algorithms for constructing exact D-optimal designs. Technometrics 1980, 22, 315–324. [Google Scholar] [CrossRef]
- Carlsson, F.; Martinsson, P. Design techniques for stated preference methods in health economics. Health Econ. 2003, 12, 281–294. [Google Scholar] [CrossRef]
- Zwerina, K.; Huber, J.; Kuhfeld, W.F. A General Method for Constructing Efficient Choice Designs; Fuqua School of Business, Duke University: Durham, NC, USA, 1996; Volume 7, pp. 265–279. [Google Scholar]
- Mele, N.L. Conjoint analysis: Using a market-based research model for healthcare decision making. Nurs. Res. 2008, 57, 220–224. [Google Scholar] [CrossRef] [PubMed]
- Tavakol, M.; Dennick, R. Making sense of Cronbach’s alpha. Int. J. Med. Educ. 2011, 2, 53. [Google Scholar] [CrossRef] [PubMed]
- Department of Health (DoH). Latest Vaccine Statistics. Available online: https://sacoronavirus.co.za/latest-vaccine-statistics/ (accessed on 13 May 2022).
- Afifi, T.O.; Salmon, S.; Taillieu, T.; Stewart-Tufescu, A.; Fortier, J.; Driedger, S.M. Older adolescents and young adults willingness to receive the COVID-19 vaccine: Implications for informing public health strategies. Vaccine 2021, 39, 3473–3479. [Google Scholar] [CrossRef]
- Leigh, S.; Vaccine Hesitancy in Young Adults May Hamper Herd Immunity. University of California San Francisco. Available online: https://www.ucsf.edu/news/2021/07/420991/vaccine-hesitancy-young-adults-may-hamper-herd-immunity (accessed on 26 June 2022).
- Gantiva, C.; Jiménez-Leal, W.; Urriago-Rayo, J. Framing messages to deal with the COVID-19 crisis: The role of loss/gain frames and content. Front. Psychol. 2021, 12, 29. [Google Scholar] [CrossRef] [PubMed]
- Earnshaw, V.A.; Eaton, L.A.; Kalichman, S.C.; Brousseau, N.M.; Hill, E.C.; Fox, A.B. COVID-19 conspiracy beliefs, health behaviors, and policy support. Transl. Behav. Med. 2020, 10, 850–856. [Google Scholar] [CrossRef]
- Purvis, R.S.; Hallgren, E.; Moore, R.A.; Willis, D.E.; Hall, S.; Gurel-Headley, M.; McElfish, P.A. Trusted Sources of COVID-19 Vaccine Information among Hesitant Adopters in the United States. Vaccines 2021, 9, 1418. [Google Scholar] [CrossRef] [PubMed]
- Campos-Mercade, P.; Meier, A.N.; Schneider, F.H.; Meier, S.; Pope, D.; Wengström, E. Monetary incentives increase COVID-19 vaccinations. Science 2021, 374, 879–882. [Google Scholar] [CrossRef] [PubMed]
- Klüver, H.; Hartmann, F.; Humphreys, M.; Geissler, F.; Giesecke, J. Incentives can spur COVID-19 vaccination uptake. Proc. Natl. Acad. Sci. USA 2021, 118, e2109543118. [Google Scholar] [CrossRef]
- Volpp, K.G.; Cannuscio, C.C. Incentives for immunity—Strategies for increasing Covid-19 vaccine uptake. N. Engl. J. Med. 2021, 385, e1. [Google Scholar] [CrossRef] [PubMed]
- Salali, G.D.; Uysal, M.S. Effective incentives for increasing COVID-19 vaccine uptake. Psychol. Med. 2021, 1–3. [Google Scholar] [CrossRef] [PubMed]
- Cheng, S.-Y.; Wang, C.J.; Shen, A.C.-T.; Chang, S.-C. How to safely reopen colleges and universities during COVID-19: Experiences from Taiwan. Ann. Intern. Med. 2020, 173, 638–641. [Google Scholar] [CrossRef]
- Thorp, H.H. Colleges need vaccine mandates. Science 2021, 373, 369. [Google Scholar] [CrossRef]
- Wolf, S.M.; Hodge, J.G., Jr. Designing COVID-19 vaccine mandates in colleges and universities: A roadmap to the 10 key questions. J. Law Biosci. 2022, 9, lsab035. [Google Scholar] [CrossRef]


| Attribute | Definition | Attribute Levels |
|---|---|---|
| Vaccination location | Location/venues where vaccine services are provided | Government–local clinic or hospital, mobile clinics |
| Private hospital, family doctor, or pharmacy | ||
| At a UKZN vaccination site | ||
| Waiting time at vaccination site | Length of time taken to complete the vaccination process | 1 h |
| 3 h | ||
| 5 h | ||
| Incentive for vaccination | An amount provided as reward for getting vaccinated | No fee or incentive |
| ZAR 50 (USD 3.33) | ||
| ZAR 350 (USD 23.28) | ||
| Protection against serious infection (resulting in hospitalization, ICU admission, or death) | Percentage reduction in serious disease cases in a vaccinated group of people | Very effective (90%) |
| Moderately Effective (70%) | ||
| Partially Effective (50%) | ||
| Vaccine origin | Country/Region where the vaccine was developed | USA/North America |
| UK/Europe | ||
| Russia | ||
| China | ||
| Number of doses | Number of vaccine shots required in order to complete the regimen | One dose |
| Two doses | ||
| Boosters required | Frequency of additional vaccine booster shots required | One vaccination provides life-long immunity (no boosters) |
| A booster required every 5 years | ||
| Annual booster vaccinations required |
| Characteristic Measures | Staff (N) | Students (N) | Prefer Not to Answer (N) | |
|---|---|---|---|---|
| Gender | Male | 188 (34.8%) | 438 (34.7%) | 13 (39.4%) |
| Female | 351 (64.9%) | 812 (64.3%) | 14 (42.4%) | |
| Other | 1 (0.2%) | 5 (0.4%) | 1 (3%) | |
| Prefer not to answer | 1 (0.2%) | 7 (0.6%) | 5 (15.2%) | |
| Age | <35 years | 106 (19.6%) | 1140 (90.3%) | 15 (45.5%) |
| 35–49 years | 230 (42.5%) | 104 (8.2%) | 9 (27.3%) | |
| 50 years or older | 204 (37.7%) | 14 (1.1%) | 5 (15.2%) | |
| Prefer not to answer | 1 (0.2%) | 4 (0.3%) | 4 (12.1%) | |
| Race | African | 215 (39.7%) | 969 (76.8%) | 16 (48.5%) |
| Coloured | 26 (4.8%) | 25 (1.9%) | 0 | |
| Indian | 131 (24.2%) | 210 (16.6%) | 3 (9.1%) | |
| White | 137 (25.3%) | 28 (2.2%) | 7 (21.2%) | |
| Other | 6 (1.1%) | 9 (0.7%) | 1 (3%) | |
| Prefer not to answer | 26 (4.8%) | 21 (1.7%) | 6 (18.2%) | |
| Nationality | South African | 495 (91.5%) | 1,176 (93.2%) | 24 (72.7%) |
| Non-South African | 44 (8.1%) | 78 (6.2%) | 3 (9.1%) | |
| Prefer not to answer | 2 (0.4%) | 8 (0.6%) | 6 (18.2%) | |
| Characteristic Measures | Have You Ever Tested Positive for COVID-19? | Have You Been Vaccinated for COVID-19? | |||||
|---|---|---|---|---|---|---|---|
| Yes | No | Prefer Not to Answer | Yes | No | Prefer Not to Answer | ||
| Staff/student | Staff | 80 (16.4%) | 403 (82.8%) | 4 (0.8%) | 429 (79.3%) | 94 (17.4%) | 17 (3.1%) |
| Student | 126 (11.9%) | 923 (86.8%) | 14 (1.3%) | 716 (56.7%) | 455 (36.1%) | 71 (5.6%) | |
| Prefer not to answer | 1 (3.6%) | 27 (96.4%) | 0 | 18 (54.6%) | 6 (18.2%) | 7 (21.2%) | |
| Gender | Male | 69 (12.5%) | 476 (86.2%) | 7 (1.3%) | 385 (60.3%) | 208 (32.6%) | 36 (5.6%) |
| Female | 137 (13.6%) | 862 (85.4%) | 11 (1.1%) | 767 (65.2%) | 343 (29.1%) | 55 (4.7%) | |
| Other | 0 | 6 (100%) | 0 | 4 (57.1%) | 2 (28.6%) | 1 (14.3%) | |
| Prefer not to answer | 1 (10%) | 9 (90%) | 0 | 7 (53.9%) | 2 (15.4%) | 3 (23.1%) | |
| Age | <35 years | 119 (11.2%) | 928 (87.6%) | 13 (1.2%) | 708 (56.2%) | 458 (36.3%) | 78 (6.2%) |
| 35-49 years | 59 (18.9%) | 251 (80.2%) | 3 (100%) | 250 (72.9%) | 77 (22.5%) | 11 (3.2%) | |
| 50 years or older | 29 (14.5%) | 170 (85%) | 1 (0.5%) | 202 (90.6%) | 18 (8.1%) | 3 (1.4%) | |
| Prefer not to answer | 0 | 4 (80%) | 1 (2%) | 3 (33.3%) | 2 (22.2%) | 3 (33.3%) | |
| COVID-19 Perspective | M | SD | p-Value | r | |
|---|---|---|---|---|---|
| If I get COVID-19, I could get severe symptoms | Staff | 3.28 | 1.14 | 0.157 | −0.05 |
| Student | 3.18 | 1.17 | |||
| If I get severe symptoms, healthcare providers will take care of me | Staff | 3.78 | 0.92 | 0.139 | −0.17 |
| Student | 3.69 | 1.04 | |||
| I am worried about getting COVID-19 | Staff | 3.63 | 1.15 | 0.256 | 0.08 |
| Student | 3.55 | 1.27 | |||
| If I get COVID-19, I will die | Staff | 2.29 | 0.96 | 0.008 * | 0.08 |
| Student | 2.14 | 0.97 | |||
| I am happy with the measures implemented by the government to prevent the spread of COVID-19 | Staff | 3.20 | 1.16 | 0.286 | 0.06 |
| Student | 3.27 | 1.19 | |||
| I am happy with the measures implemented by UKZN to prevent the spread of COVID-19 | Staff | 3.66 | 1.08 | 0.001 * | 0.15 |
| Student | 3.84 | 1.04 | |||
| I can easily wear a mask when in public | Staff | 4.40 | 0.97 | 0.010 * | −0.14 |
| Student | 4.52 | 0.82 | |||
| I can easily socially distance when in public | Staff | 4.04 | 1.08 | 0.433 | −0.04 |
| Student | 4.09 | 1.11 | |||
| COVID-19 Vaccine Attitude | Mean | SD | p-Value | r | |
|---|---|---|---|---|---|
| Getting vaccinated could save my life | Staff | 4.04 | 1.20 | 0.001 * | 0.20 |
| Student | 3.79 | 1.19 | |||
| COVID-19 vaccines are effective | Staff | 3.90 | 1.11 | 0.001 * | 0.28 |
| Student | 3.58 | 1.10 | |||
| Pharmaceutical companies have developed safe and effective COVID-19 vaccines | Staff | 3.70 | 1.11 | 0.001 * | 0.17 |
| Student | 3.51 | 1.07 | |||
| Vaccines made in Europe or America are safer than those made in other countries | Staff | 2.67 | 0.97 | 0.237 | 0.06 |
| Student | 2.60 | 0.97 | |||
| COVID-19 vaccines carry more risks than other vaccines | Staff | 2.67 | 1.09 | 0.002 * | −0.17 |
| Student | 2.85 | 1.04 | |||
| The information I receive about COVID-19 vaccines from Government is reliable and trustworthy | Staff | 3.28 | 1.12 | 0.593 | −0.02 |
| Student | 3.31 | 1.09 | |||
| Getting vaccinated is a good way to protect my family from COVID-19 | Staff | 4.05 | 1.18 | 0.001 * | 0.17 |
| Student | 3.84 | 1.18 | |||
| I would do what my doctor or health care provider recommended about the COVID-19 | Staff | 4.04 | 1.00 | 0.295 | 0.05 |
| Student | 3.98 | 1.01 | |||
| I am concerned about serious adverse effects of the COVID-19 vaccine | Staff | 3.14 | 1.26 | 0.001 * | −0.46 |
| Student | 3.69 | 1.13 | |||
| People should not be forced to get vaccinated | Staff | 3.02 | 1.45 | 0.001 * | −0.66 |
| Student | 3.91 | 1.28 | |||
Publisher’s Note: MDPI stays neutral with regard to jurisdictional claims in published maps and institutional affiliations. |
© 2022 by the authors. Licensee MDPI, Basel, Switzerland. This article is an open access article distributed under the terms and conditions of the Creative Commons Attribution (CC BY) license (https://creativecommons.org/licenses/by/4.0/).
Share and Cite
George, G.; Strauss, M.; Lansdell, E.; Nadesan-Reddy, N.; Moroe, N.; Reddy, T.; Eshun-Wilsonova, I.; Moshabela, M. South African University Staff and Students’ Perspectives, Preferences, and Drivers of Hesitancy Regarding COVID-19 Vaccines: A Multi-Methods Study. Vaccines 2022, 10, 1250. https://doi.org/10.3390/vaccines10081250
George G, Strauss M, Lansdell E, Nadesan-Reddy N, Moroe N, Reddy T, Eshun-Wilsonova I, Moshabela M. South African University Staff and Students’ Perspectives, Preferences, and Drivers of Hesitancy Regarding COVID-19 Vaccines: A Multi-Methods Study. Vaccines. 2022; 10(8):1250. https://doi.org/10.3390/vaccines10081250
Chicago/Turabian StyleGeorge, Gavin, Michael Strauss, Emma Lansdell, Nisha Nadesan-Reddy, Nomfundo Moroe, Tarylee Reddy, Ingrid Eshun-Wilsonova, and Mosa Moshabela. 2022. "South African University Staff and Students’ Perspectives, Preferences, and Drivers of Hesitancy Regarding COVID-19 Vaccines: A Multi-Methods Study" Vaccines 10, no. 8: 1250. https://doi.org/10.3390/vaccines10081250