
Predictive Analysis of COVID-19 Symptoms in Social Networks through Machine Learning


1
Department of Computing, Campus Medianeira, Federal University of Technology-Parana, Medianeira, Curitiba 85884-000, Brazil
2
Research Center in Digitalization and Intelligent Robotics, Instituto Politécnico de Bragança, 5300-253 Braganca, Portugal
*
Author to whom correspondence should be addressed.
†
These authors contributed equally to this work.
Electronics 2022, 11(4), 580; https://doi.org/10.3390/electronics11040580
Submission received: 31 December 2021
/
Revised: 2 February 2022
/
Accepted: 6 February 2022
/
Published: 15 February 2022
(This article belongs to the Special Issue 10th Anniversary of Electronics: Recent Advances in Computer Science & Engineering)
Abstract
:Social media is a great source of data for analyses, since they provide ways for people to share emotions, feelings, ideas, and even symptoms of diseases. By the end of 2019, a global pandemic alert was raised, relative to a virus that had a high contamination rate and could cause respiratory complications. To help identify those who may have the symptoms of this disease or to detect who is already infected, this paper analyzed the performance of eight machine learning algorithms (KNN, Naive Bayes, Decision Tree, Random Forest, SVM, simple Multilayer Perceptron, Convolutional Neural Networks and BERT) in the search and classification of tweets that mention self-report of COVID-19 symptoms. The dataset was labeled using a set of disease symptom keywords provided by the World Health Organization. The tests showed that Random Forest algorithm had the best results, closely followed by BERT and Convolution Neural Network, although traditional machine learning algorithms also have can also provide good results. This work could also aid in the selection of algorithms in the identification of diseases symptoms in social media content.
1. Introduction
The year 2020 posed to organizations, governments, and even the population a great challenge in the face of a virus that was spreading at a very high speed and that required urgent and accurate information. The delay in obtaining concrete information and mass testing were some of the challenges in the effort to control the spread of the virus in the population [1].
Over time, new information about the behavior of the virus and the mapping of its transmissibility has been obtained. These data emerged from several sources, such as population health surveys, group studies or mathematical models, where investigations of causes, and relationship between risk factors and health consequences are made [2,3].
Since their advent, social networks have been widely used as a way for people to express emotions, feelings, opinions and information, as well as health concerns and symptoms, making these communication media potential sources for collecting and building a database of self-reported symptoms [4,5].
The term social network refers to a person’s connections to other people. In fact, creating and maintaining social networks provide opportunities to connect with others who have similar interests. Although initially applied in the context of “real-world” or physical, the concept expanded to also include platforms that support online communication, such as Instagram, Twitter or Reddit, that further enhance these opportunities, allowing the creation of relationships with people who have never met in person. The possibility to write, participate or communicate without restrictions also provides a means to unburden or receive emotional support. Some people resort to social networks to talk about their state of mind, their feelings, distresses and other problems.
In contrast to verbal and direct communication, the content available in the social networks is persistent, allowing asynchronous access data and providing a good means for psychological and health related studies and analysis [6,7,8].
Twitter is a popular social network and, because of its characteristics, it is a promising source of data for analysis and possible detection of disease symptoms. It is a virtual platform for social interaction of the microblog type, where users can send and receive updates from other contacts, with a limit of 280 characters per message. To analyze the texts posted and classify tweets with self-declared symptom content, Natural Language Processing (NLP) techniques can be applied.
NLP is a research and application area that explores the use of computers to understand and manipulate natural language from text or speech and, although it is not a recent area of study, it has been gaining more and more relevance in several fields [9,10]. NLP can be used to extract relevant, and in some cases, unknown information about characteristics or symptoms of some diseases, such as COVID-19 infections [11].
Coronaviruses are positive-sense simple-stranded Ribonucleic Acid (RNA) viruses. They are enveloped in a coat of fat and protein, ranging in diameter from 60 to 140 nanometers. The presence of the Spike Protein on its surface, which binds to the ACE2 enzyme, makes infection easier [12].
COVID-19 has its known origin from the Chinese province of Wuhan, where a wave of infections began in late 2019. Several tests were done to detect the possible causes of these infections which, until then, were being treated as pneumonia. Later, it was discovered that a new coronavirus was in action. Some of the symptoms that these viruses have in common are respiratory complications, which can range from mild to more severe complications, possibly leading to death.
Some sources claim that the virus began circulating from a wild animal sales market and began to spread across the country and soon took over the whole world, leading to the death of approximately 5.42 million people, in December 2021 (Our World In Data: https://ourworldindata.org/grapher/cumulative-deaths-and-cases-covid-19?country=~OWID_WRL (accessed on 27 December 2021)).
According to the World Health Organization (WHO), on average, it takes approximately one week for the symptoms to set in, which may include some of the following (most common first): fever, dry cough, tiredness, aches and pains, sore throat, diarrhea, conjunctivitis, headache, loss of taste or smell, skin rashes, or discoloration of fingers or toes. Some serious symptoms include: difficulty breathing or shortness of breath, chest pain or pressure, loss of speech or movement [13].
NLP is a sub-field of Artificial Intelligence that studies the understanding of natural language by machines. Some of the goals of NLP is to automate the analysis and production of written or spoken texts, recognizing their context and being able to perform processes such as phonetic, phonological, morphological, lexical, syntactic, semantic and pragmatic analysis [14]. More specifically, it studies the acoustic processes of speech, that is how a word actually sounds when spoken by someone, the phonemes, or acoustic units of a language, that may or may not have a concrete meaning, and the way they are organized. Also, the structure, formation, and classification of words, the set of words that belongs to a language, the words within sentences or clauses and the relationship they create with each other to make up meaning. Ultimately, the meaning and interpretation of the words, sentences, phrases, or expressions in a given context, and the influence and use of context in the interactions between speaker and listener [15].
NLP can also be used for text or audio classification, where the algorithm is fed with a document and tries to assign a value to it [16,17,18,19,20].
Having this in mind, this paper addresses the use of machine learning techniques and algorithms for analysing posts on Twitter seeking mention of self-report of symptoms. Several algorithms are compared and the accuracy is compared, to build an idea of the potential effectiveness in understanding the physical condition of the general public.
The paper is organized as follows: Section 2 presents the methodology and associated concepts, and Section 3 presents the results obtained in the test dataset. Section 4 discusses the results obtained, and, finally, Section 5 rounds up the paper with the conclusions, particularly analyzing the challenges associated to the implementation of such systems, and points out the future work.
2. Methodology
The identification of self-report of symptoms in social networks was approached through text classification in NLP. For that, a training and testing dataset were collected, using the Twarc library (https://twarc-project.readthedocs.io/en/latest/ (accessed on 30 December 2021)), cleaned and annotated. Next, the classification models were implemented in Python, using Tensorflow (https://www.tensorflow.org/ (accessed on 30 December 2021)), NLTK (https://www.nltk.org/ (accessed on 30 December 2021)) and scikit-learn (https://scikit-learn.org/stable/ (accessed on 30 December 2021)). The training was performed in Google Colab. To collect the dataset, implement the models and run the tests, several tools were used. After training, the models were evaluated and their performance compared.
2.1. Text Classification
Data classification is a core task in many machine learning and Artificial Intelligence (AI) applications, including object identification in images, facial expression detection, handwriting recognition, among many others. Text classification is used frequently in information retrieval, spam detection, or sentiment analysis. Its goal is to assign documents to one or more categories. For that, classifiers are built, usually through supervised machine learning, where classification rules are learned from examples, composed of annotated data.
The development of the examples for training is a fundamental step in the text classification process. The amount, quality and careful annotation of the examples have a significant impact on the training process. This process, of paramount importance and requiring a disproportional large amount of time, consists of data acquisition, data labeling, and improvement of existing data or models. It usually starts by gathering raw data, through data scrapping, web scrapping or others. Alternatively (or in complement), data can also be synthetically generated according to several heuristics, or augmented, to allow the multiplication of the size of the dataset. Finally, the importance of high quality data has been driving the emergence of pre-built, publicly available datasets on the internet.
To simplify the training process and to improve the chance of getting better results in the classification process, data is usually preprocessed. First, it is cleaned and filtered, to remove unwanted features or noise. Second, a simplified version is built, removing elements that are not meaningful or redundant. Finally, data is vectorized and, eventually, saved for future analysis.
Although this process is valid for all types of data, text preprocessing is even more important, due to the morphological variations that words have. As an example, “works”, “worked” and “workers” have different shape, although the root is common and related to “work”. Thus, these variations can, in some situations, be reduced, simplifying the training dataset.
With the dataset properly collected, preprocessed and annotated, the training process can start.
2.2. Classification Algorithms
Classification algorithms are usually trained to assign categories to a sample of data. There are several possibilities, from the traditional linear-classifiers such as Naive Bayes or logistic regression to the most recent proposals based on word embeddings and deep learning.
K-Nearest Neighbors (KNN) is a supervised algorithm used in machine learning that verifies how similar the data is to each other. The training data consists of vectors of n dimensions. The KNN algorithm calculates the similarity of a new data with other data that have already been classified, and tries to find the K nearest neighbors of that new data [21]. The similarity between the data can be calculated using either Euclidean distance, Manhattan, Minkowski, weighted distance, or other.
In the classification process, the algorithm receives unclassified data, that will have its distance to other, previously classified data, calculated. After the calculation of the distances, the K smallest distances will be obtained and it will verify how many classes are in the neighborhood. From the quantity measured by the algorithm, the class that appears the most is the one that should be assigned to the new data [22,23].
Naive Bayes, in machine learning, is used as a classifier that is based on the probability of an event to occur. The algorithm is inspired by Bayes’ theorem that describes the probability of an event, based on a priori knowledge that can be related to the event [24]. The adjective naive, that composes the name of the algorithm, is due to the mutual independence assumption between features [25].
The Naive Bayes algorithm is widely used in text classification, for example, classifying e-mail as spam, or perform document separation, among other tasks [26].
Decision Trees are a type of classifier that sorts the attributes of an instance from the root of the tree. Attributes will compose internal nodes of the tree while classes will compose the leaves. Random Forest Classifier is a machine learning algorithm used in various classification and regression tasks. It is built by creating a large number of decision trees where each tree relies on the values of a random vector with similar distribution and independent samples. Each of the trees returns a classification that will be “voted” by the algorithm. The class with the most votes will be the chosen one [27].
Support Vector Machine (SVM) is a machine learning algorithm that usually gathers good results in classification or regression tasks. SVM aims to find the best hyperplane in an N-dimensional space, being N the number of features, to classify discretely the data [28]. Given a set of training examples, the objective of the hyperplane is to separate the set in a way that every instance with the same labels stays on the same side. SVM has shown to be more accurate in some tasks than decision trees or neural network based approaches [29].
The perceptron network, introduced by Frank Rosenblat is a representation of the artificial neuron model [30]. It is built around McCulloch-Pitts’ model of a neuron [31]. It can be viewed as the simplest type of feedforward neural network, in which information flows only from the input layer to the output layer. It can be seen as a classifier for linearly separable problems.
The perceptron is fed with a vector of inputs which is multiplied by a vector of weights corresponding to each input and then combined with the bias, b, as represented in Equation (1), adapted from the work of Leite [32].
The output v of Equation (1) produces a value that is passed to an activation function , such as the step function can be used. It evaluates whether the activation threshold is greater than zero, returning 1 in this case and representing that the neuron is active. Otherwise, there will be no activation, as seen in Equation (2).
Multilayer Perceptron (MLP)s are usually trained using the algorithms Backpropagation and Gradient Descent (or variations). In fully connected networks, a neuron in any layer of the network is connected to all nodes/neurons in neighboring layers. In the feedforward networks, the signal flows from the input layer to the output layer without loops. The Backpropagation algorithm is based on the error correction learning rule. It is a supervised training algorithm, where a training set with a correct labeling of the outputs is used [7].
Activation functions determine how the neuron will activate. There are several types of activation functions, such as the Sigmoid, Hyperbolic Tangent and Rectified Linear Unit (ReLU) functions. The choice of activation function depends on the type of network or problem being studied, since it can influence the performance and complexity of the network [33].
The Sigmoid function uses a real input value, x, and returns a value in the range between 0 and 1 [34]. This function is continuous, and differentiable [31] and its formula is represented by Equation (3).
The Hyperbolic Tangent function, , is defined by the division of hyperbolic sine by hyperbolic cosine, which can also be represented by the division between the difference of two exponential functions at points x and , and the sum of these same functions, according to Equation. The function is similar to the logistic sigmoid, but its range is from −1 to 1.
The ReLU is a piecewise activation function very used in deep learning models like Convolutional Neural Networks (CNN), for instance [35]. One of the advantages of ReLU is that it will only deactivate the neurons if their result is less than 0. In this case, the negative values will be equal to 0 as disposed on Equation (5) in which the maximum value between 0 and the input value is returned, thus when the value is smaller than 0 it should return 0.
The CNN is a type of Artificial Neural Network oriented towards processing grid type data. Despite great developments in other types of neural networks, CNNs have provided an even greater leap forward in several areas involving pattern recognition, with tasks ranging from image processing to speech recognition [36]. Eventually, CNNs also came to be used for tasks involving text, such as text classification or sentence modeling, where the process throughout the classification task, for instance, is similar to the image classification. The only difference is that the input of the text will be a matrix of word vectors [37,38].
Bidirectional Encoder Representations from Transformers (BERT) is a recent approach developed by Google researchers. From the moment of its release, in 2018, this model stands as a state-of-art technique for tasks involving Natural Language Processing [39].
The technique involving BERT consists of a deeper pre-training of the Transformer model when trying to find the sentence context by processing the input in two directions, from the beginning to the end and from the end to the beginning, as opposed to other models that usually process the input only in one direction [40]. During pre-training, the Masked Language Model (MLM) technique is used in which an input token is masked and the model aims to predict this token. The bidirectional processing of the input helps in predicting the masked token, since it has a finer understanding of the sentence context. The Next Sentence Prediction (NSP) technique is used along with these [41]. This technique uses sentence pair representations, where two input sentences separated by the token [SEP] will be provided. The goal is to find a relationship between sentences A and B. The sentences can be generated from a monolingual corpus where, in the selection of each pair sentence A and B, half of the time B will be the real sentence that succeeds A and is, labeled as IsNext. When the sentence B is not the one that actually succeeds A it should be labeled as NotNext.
Using the BERT model is typically done in two stages. The first one, discussed previously, is pre-training the model using unlabeled data. The second is the called fine-tuning, where the model should be initialized with parameters used in the pre-training stage and then fine-tuned during the training of the task to which it is being applied.
2.3. Dataset
The training and testing dataset were obtained from a collection of Tweets made available by Lamsal [42]. In Lamsal’s work, millions of Tweets were collected to perform sentiment classification task regarding the COVID-19 and used several keywords related to the virus in the selection of tweets. The usage terms, according to the author, assume the agreement to “(i) use the content of this dataset and the data generated from the content of this dataset for non-commercial research only, (ii) remain in compliance with Twitter’s Policy, and (iii) cite the paper [42]”, which are fulfilled in full in this work, according to the academic nature. Moreover, the Twitter Policy mentions that the tweets cannot be used for commercial purposes, and that, for research purposes, the number of tweets used can be unlimited and the way of sharing the dataset/tweets must be done through their IDs and only by them.
So, following Twitter’s privacy policy, the available dataset provide only the IDs of tweets, requiring additional operations to retrieve the text. The “hydration” process, as it is called, is the process in which information is retrieved from the Twitter platform using its ID. To “hydrate” the Twarc tool was used.
One of the challenges of this work was to find a dataset that was already labeled for the task of finding symptoms or self-report tweets of COVID-19, but until the implementation of this work we were not able to find one. Therefore, it was necessary to label the data before the implementation of the models and the training. The dataset that we obtained from Lamsal contained annotations for sentiment analysis. These annotations were not useful for our work. To annotate the dataset we used the work of Sarker as reference to label the tweets, using regular expressions and keywords to filter it [43].
At first, we used keywords like Positive, that is a heuristics indicating a “positive” COVID test result, in combination with one or more of the symptoms of COVID-19, according to WHO [13]. These tweets were labeled as positive (value 1). We labeled the negative class by selecting the tweets that did not contain mentions of COVID-19 symptoms, or contained symptoms but explicitly reported “negative” test result, and also that did not contained keywords like Tested Positive or Positive. Further manual verification was made in attempt to ensure that the data labels were correct and minimize the errors in labeling.
Before the training and testing phase, it was necessary to perform a cleaning on tweets to remove unknown and special characters from the text, like hashtags (#), or at signs (@). In order to clean the dataset, the following steps were performed:
- Emoticon removal;
- Decapitalization of the text: (Tomorrow → tomorrow);
- Removing user tagging: (@someUser);
- URL Removal: (http://www.somedomain.com, accessed on 30 December 2021);
- Extra spacing removal;
- Stop Words Removal;
- Lematization: (Plays, playing, plays → play).
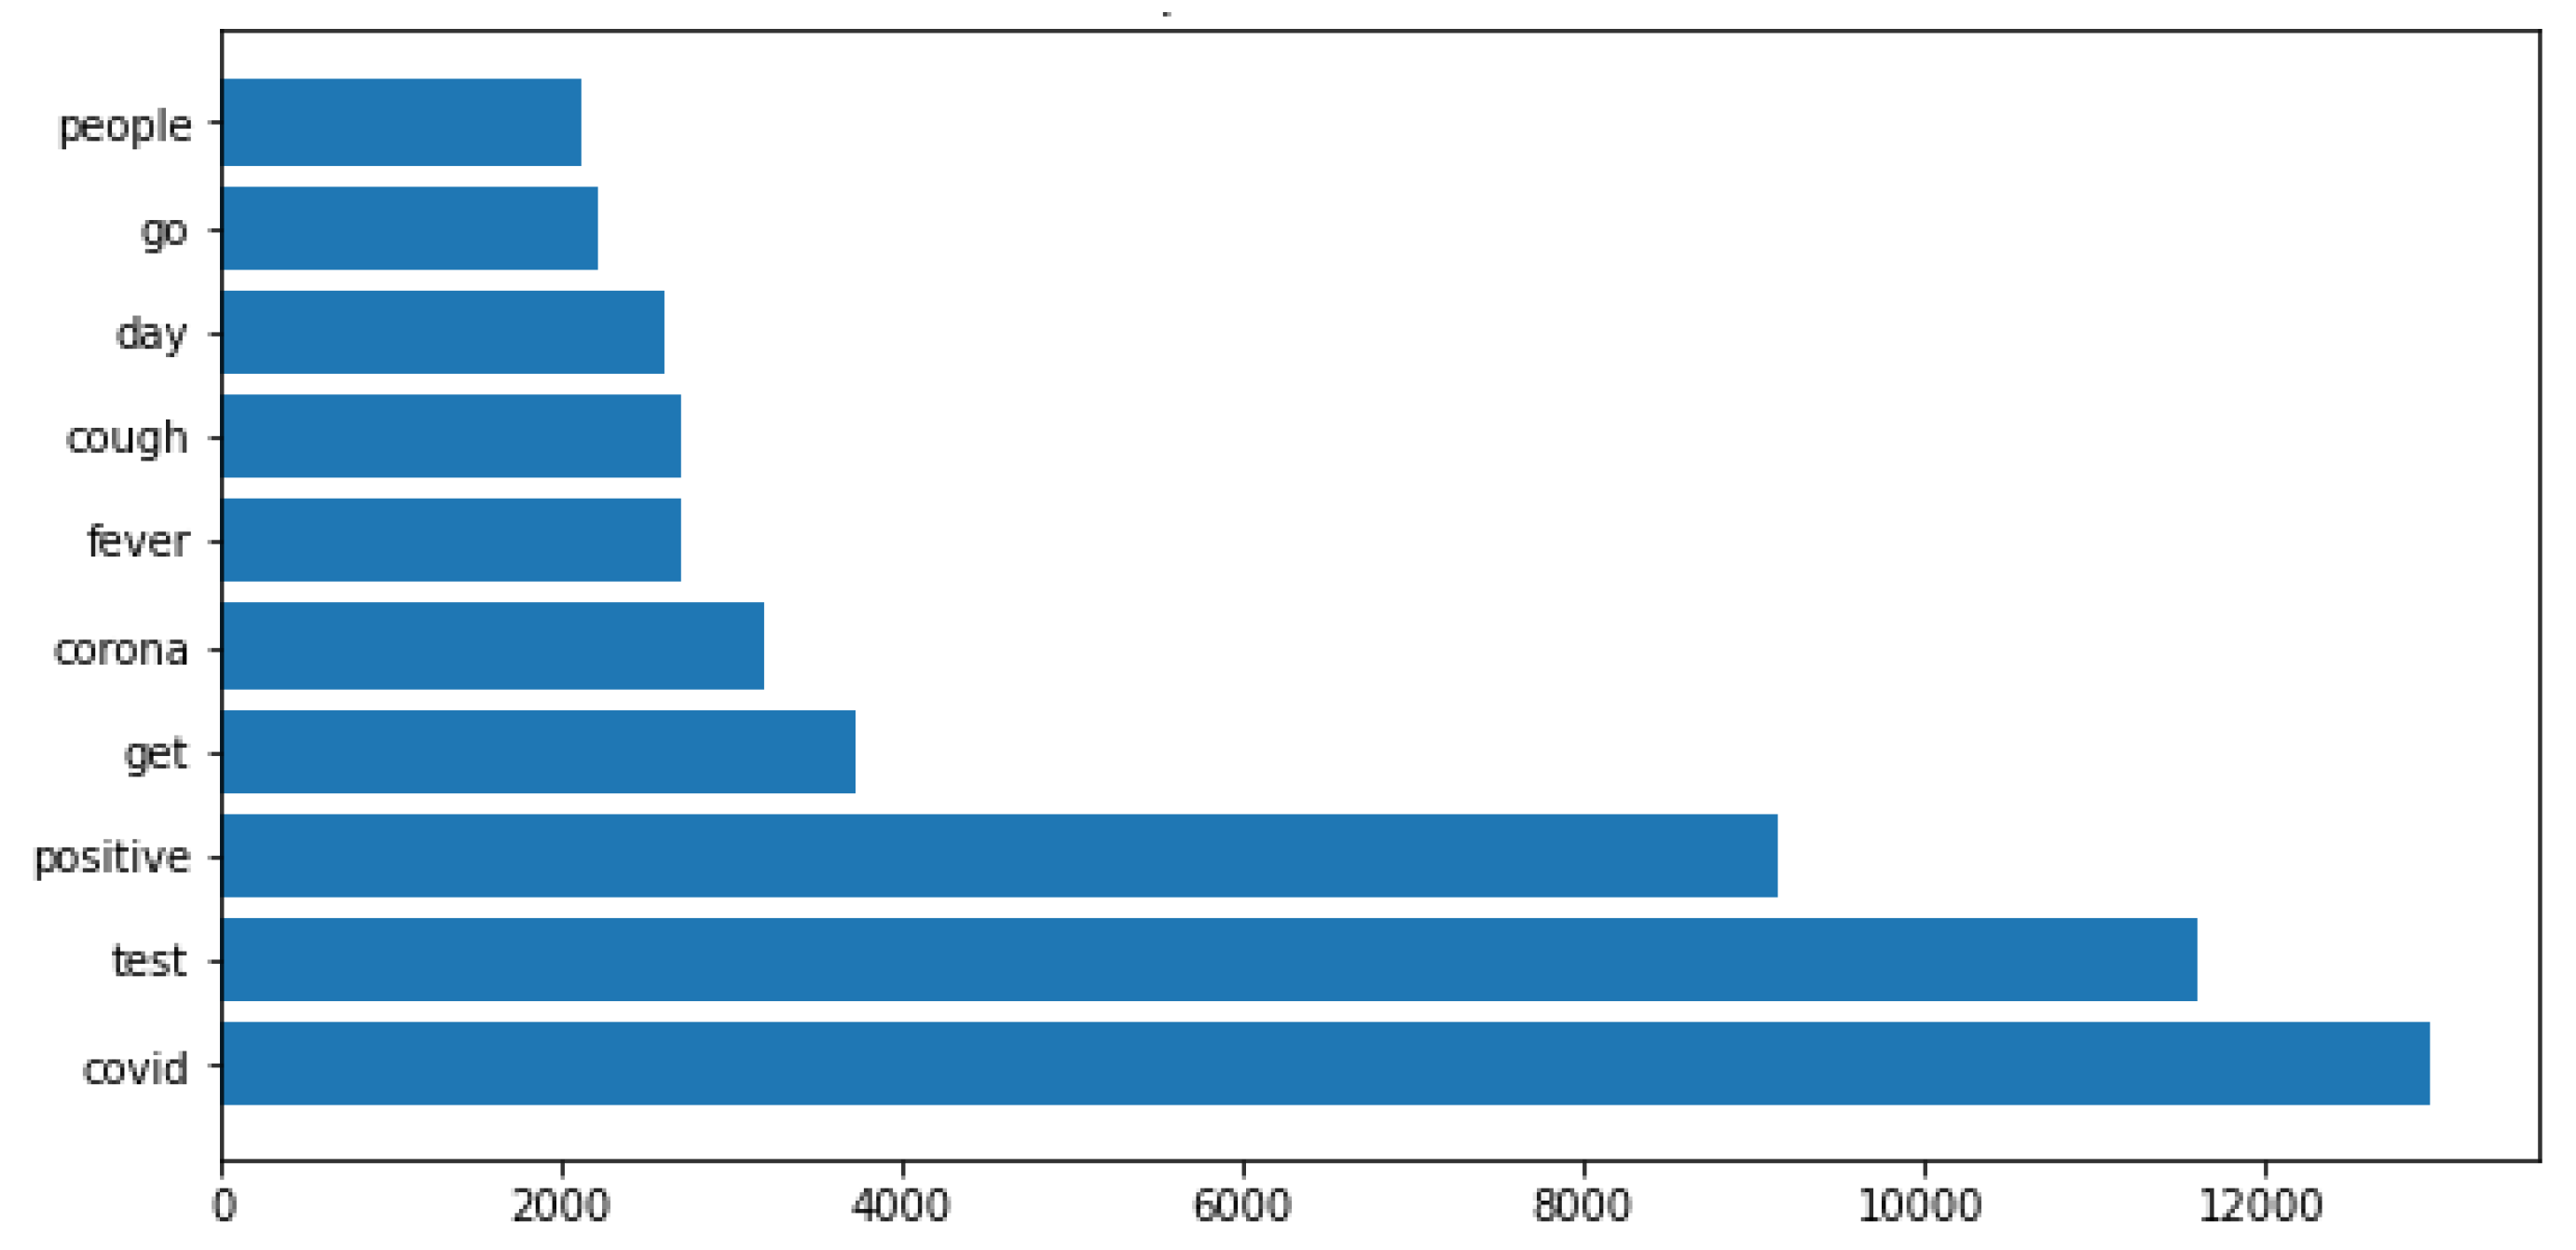
The total size of the dataset collected were of 22,991 tweets and from this total, 9680 tweets were classified as negative and 13,311 as positive. From the whole dataset, the 10 most frequently words that appeared in tweets were covid, test, positive, get, corona, etc, as show in Figure 1.
The python library for topic modeling in NLP, Gensim (https://radimrehurek.com/gensim/ (accessed on 30 December 2021)), was used to find the terms that were most similar to the covid, in the dataset (Table 1).
On the tweets labeled as positive, the words that appeared the most were covid, test, positive, get, cough, among others (Figure 2).
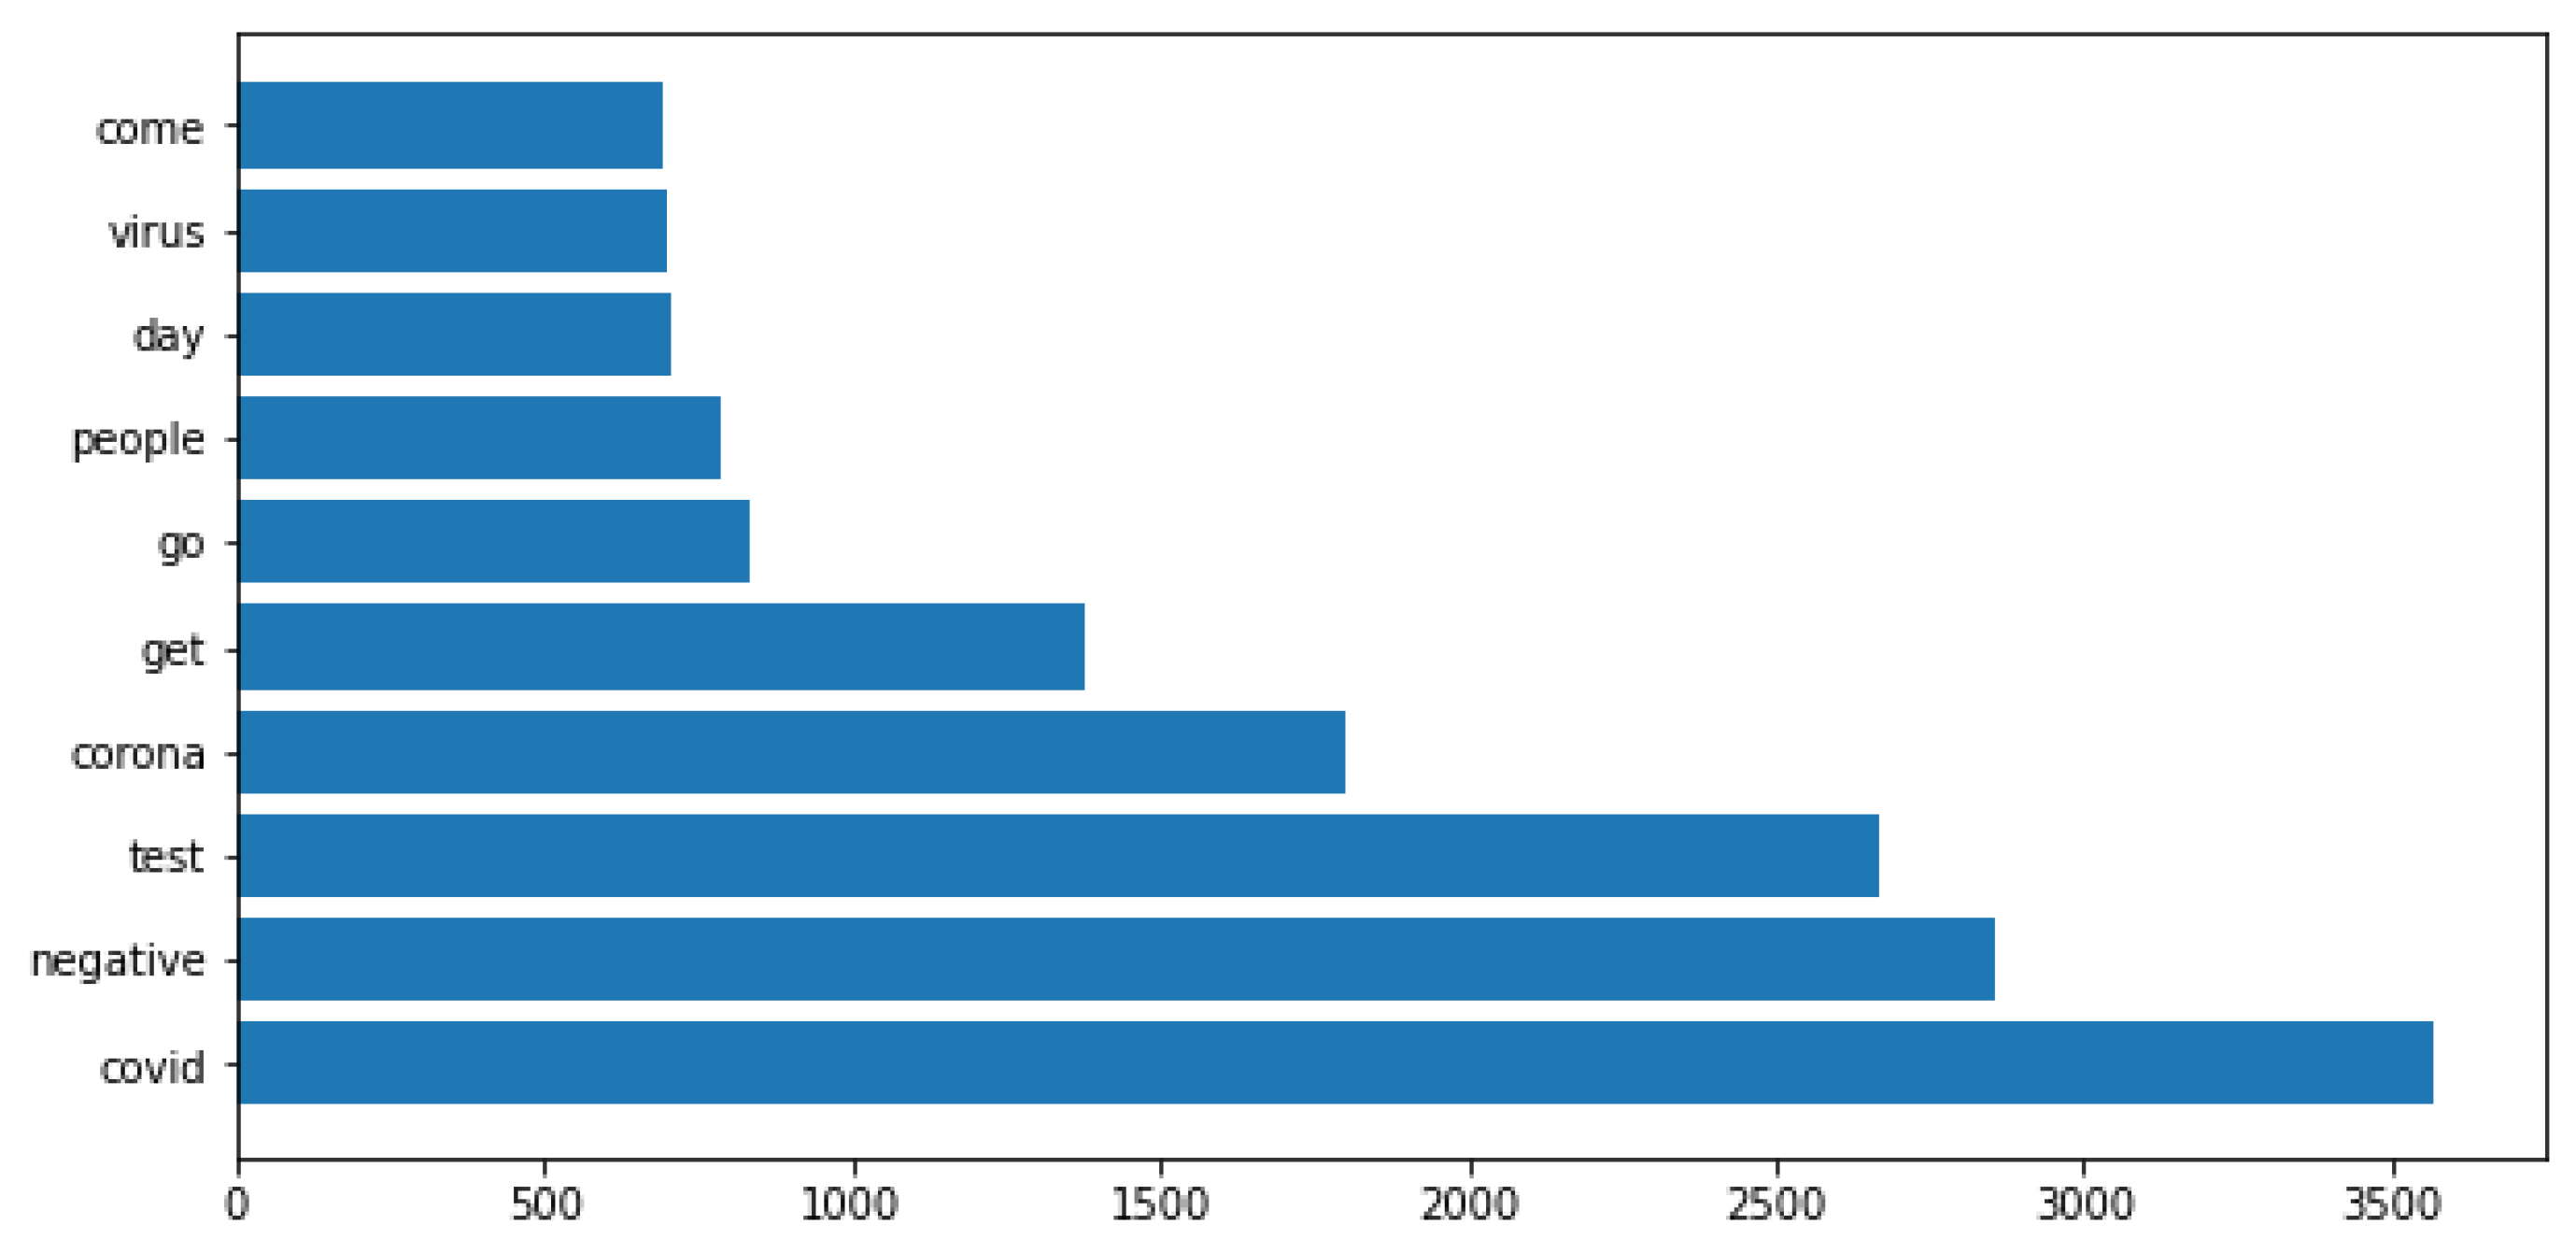
On the tweets labeled as negative, the words that appeared the most in the dataset were covid, negative, test, corona, get, among others (Figure 3).
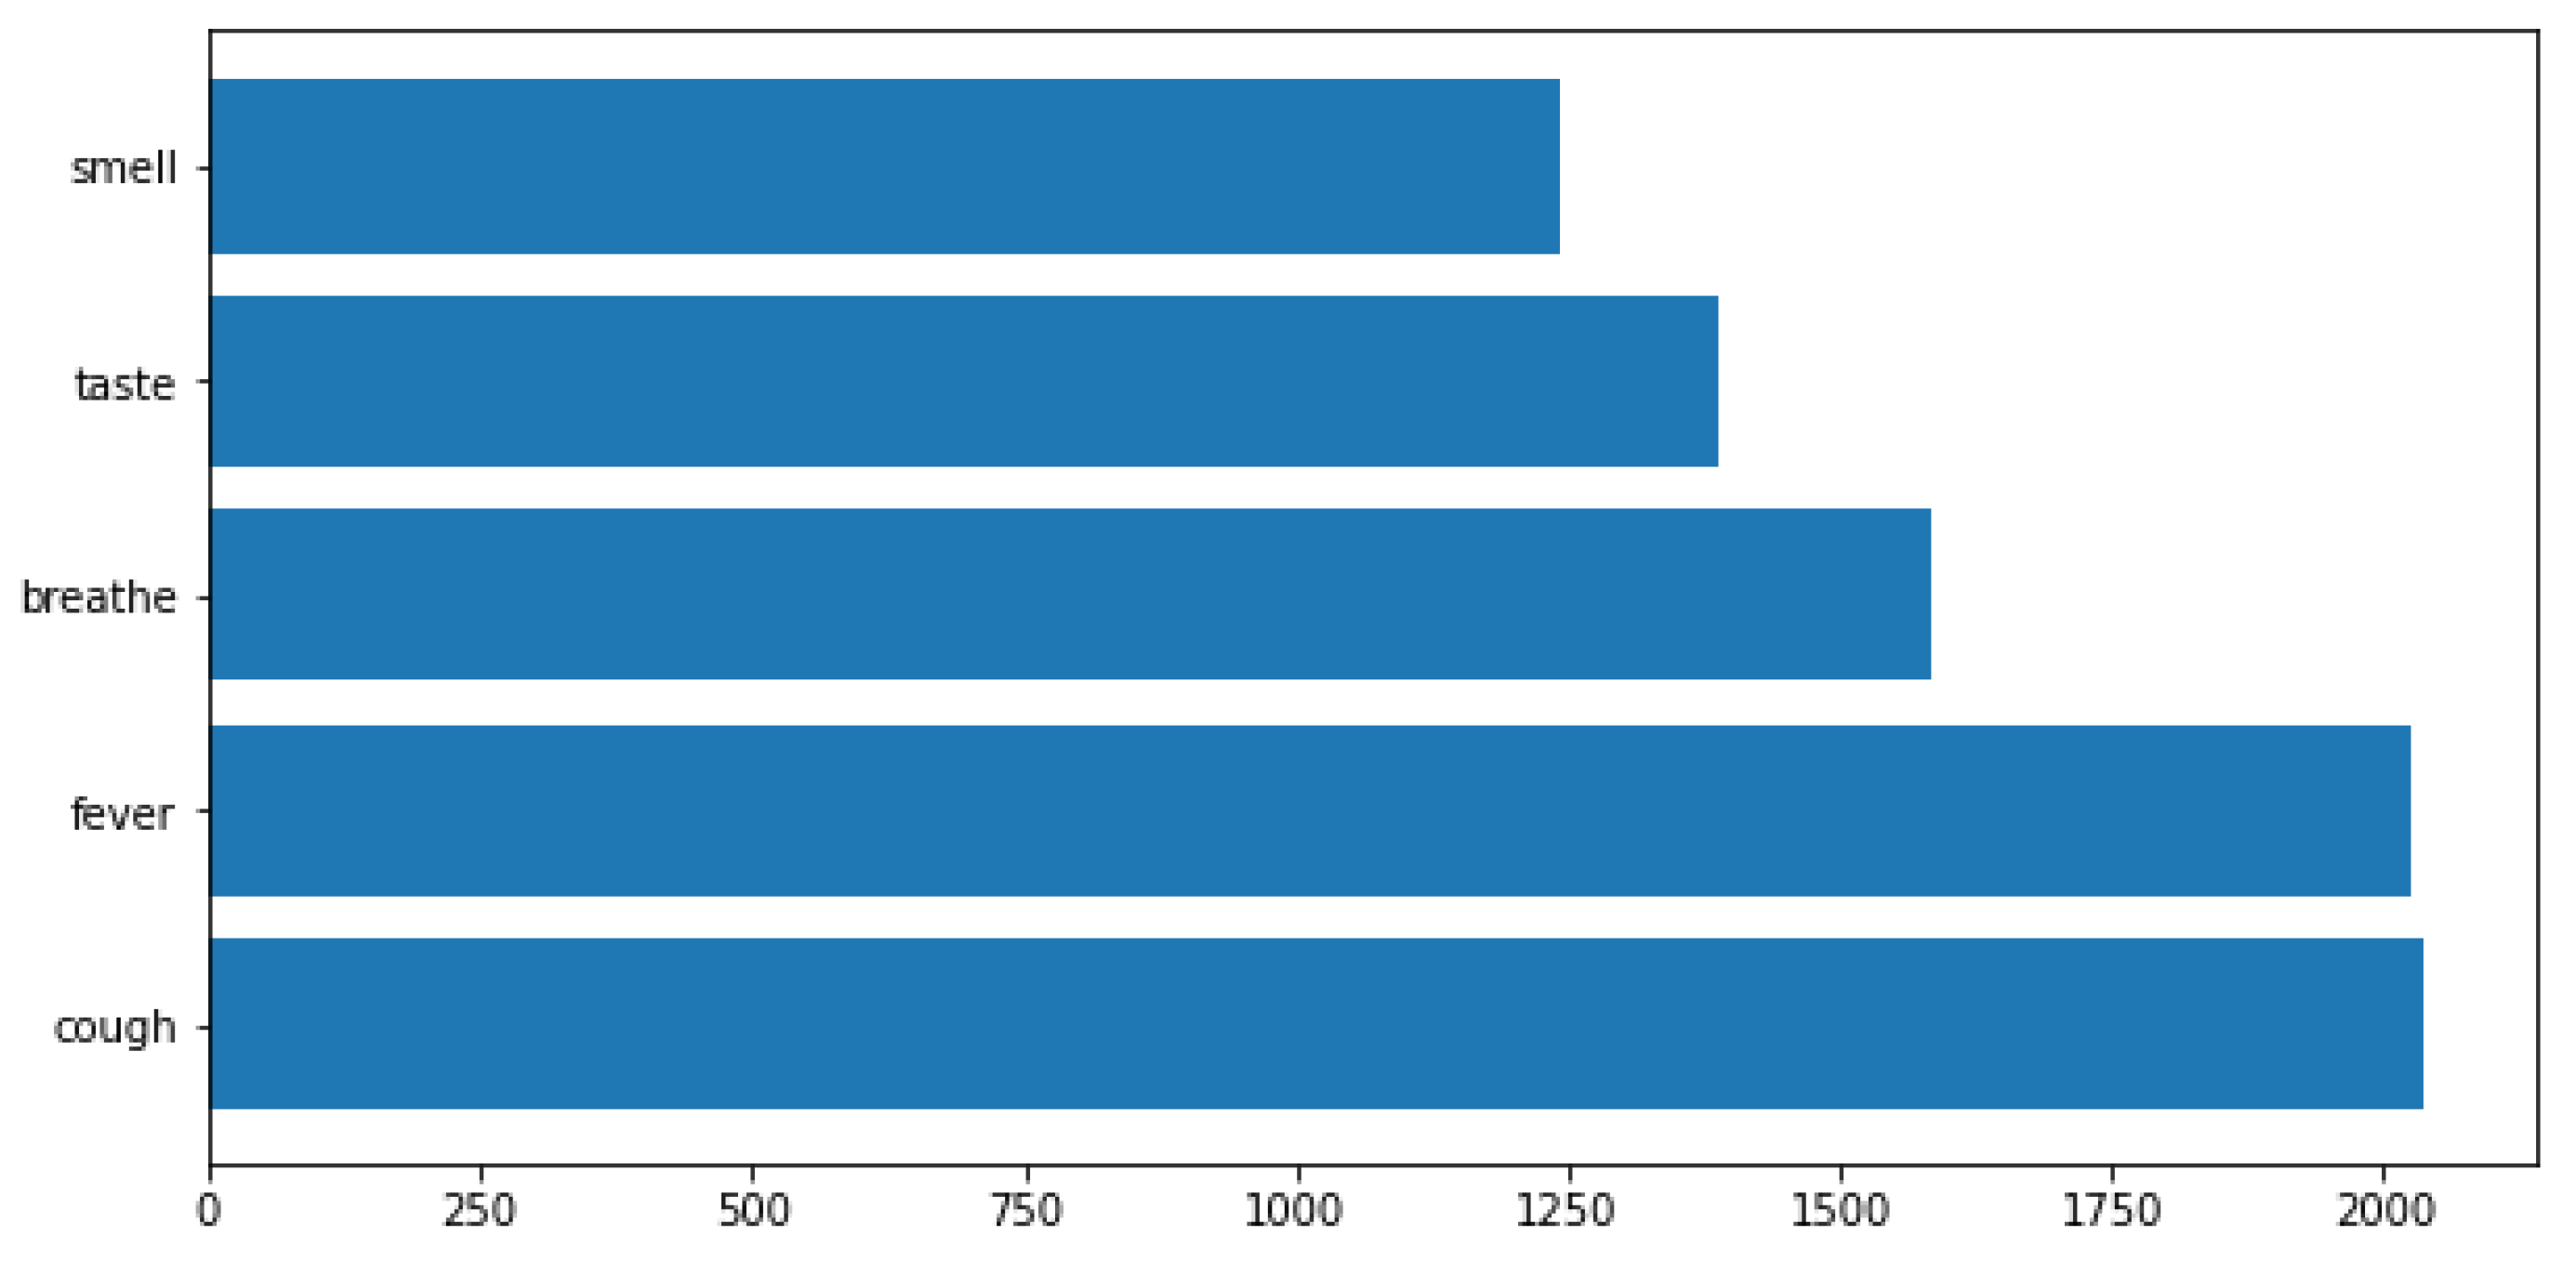
The 5 symptoms that appeared the most on the tweets were fever, cough, breathe, taste and smell (Figure 4).
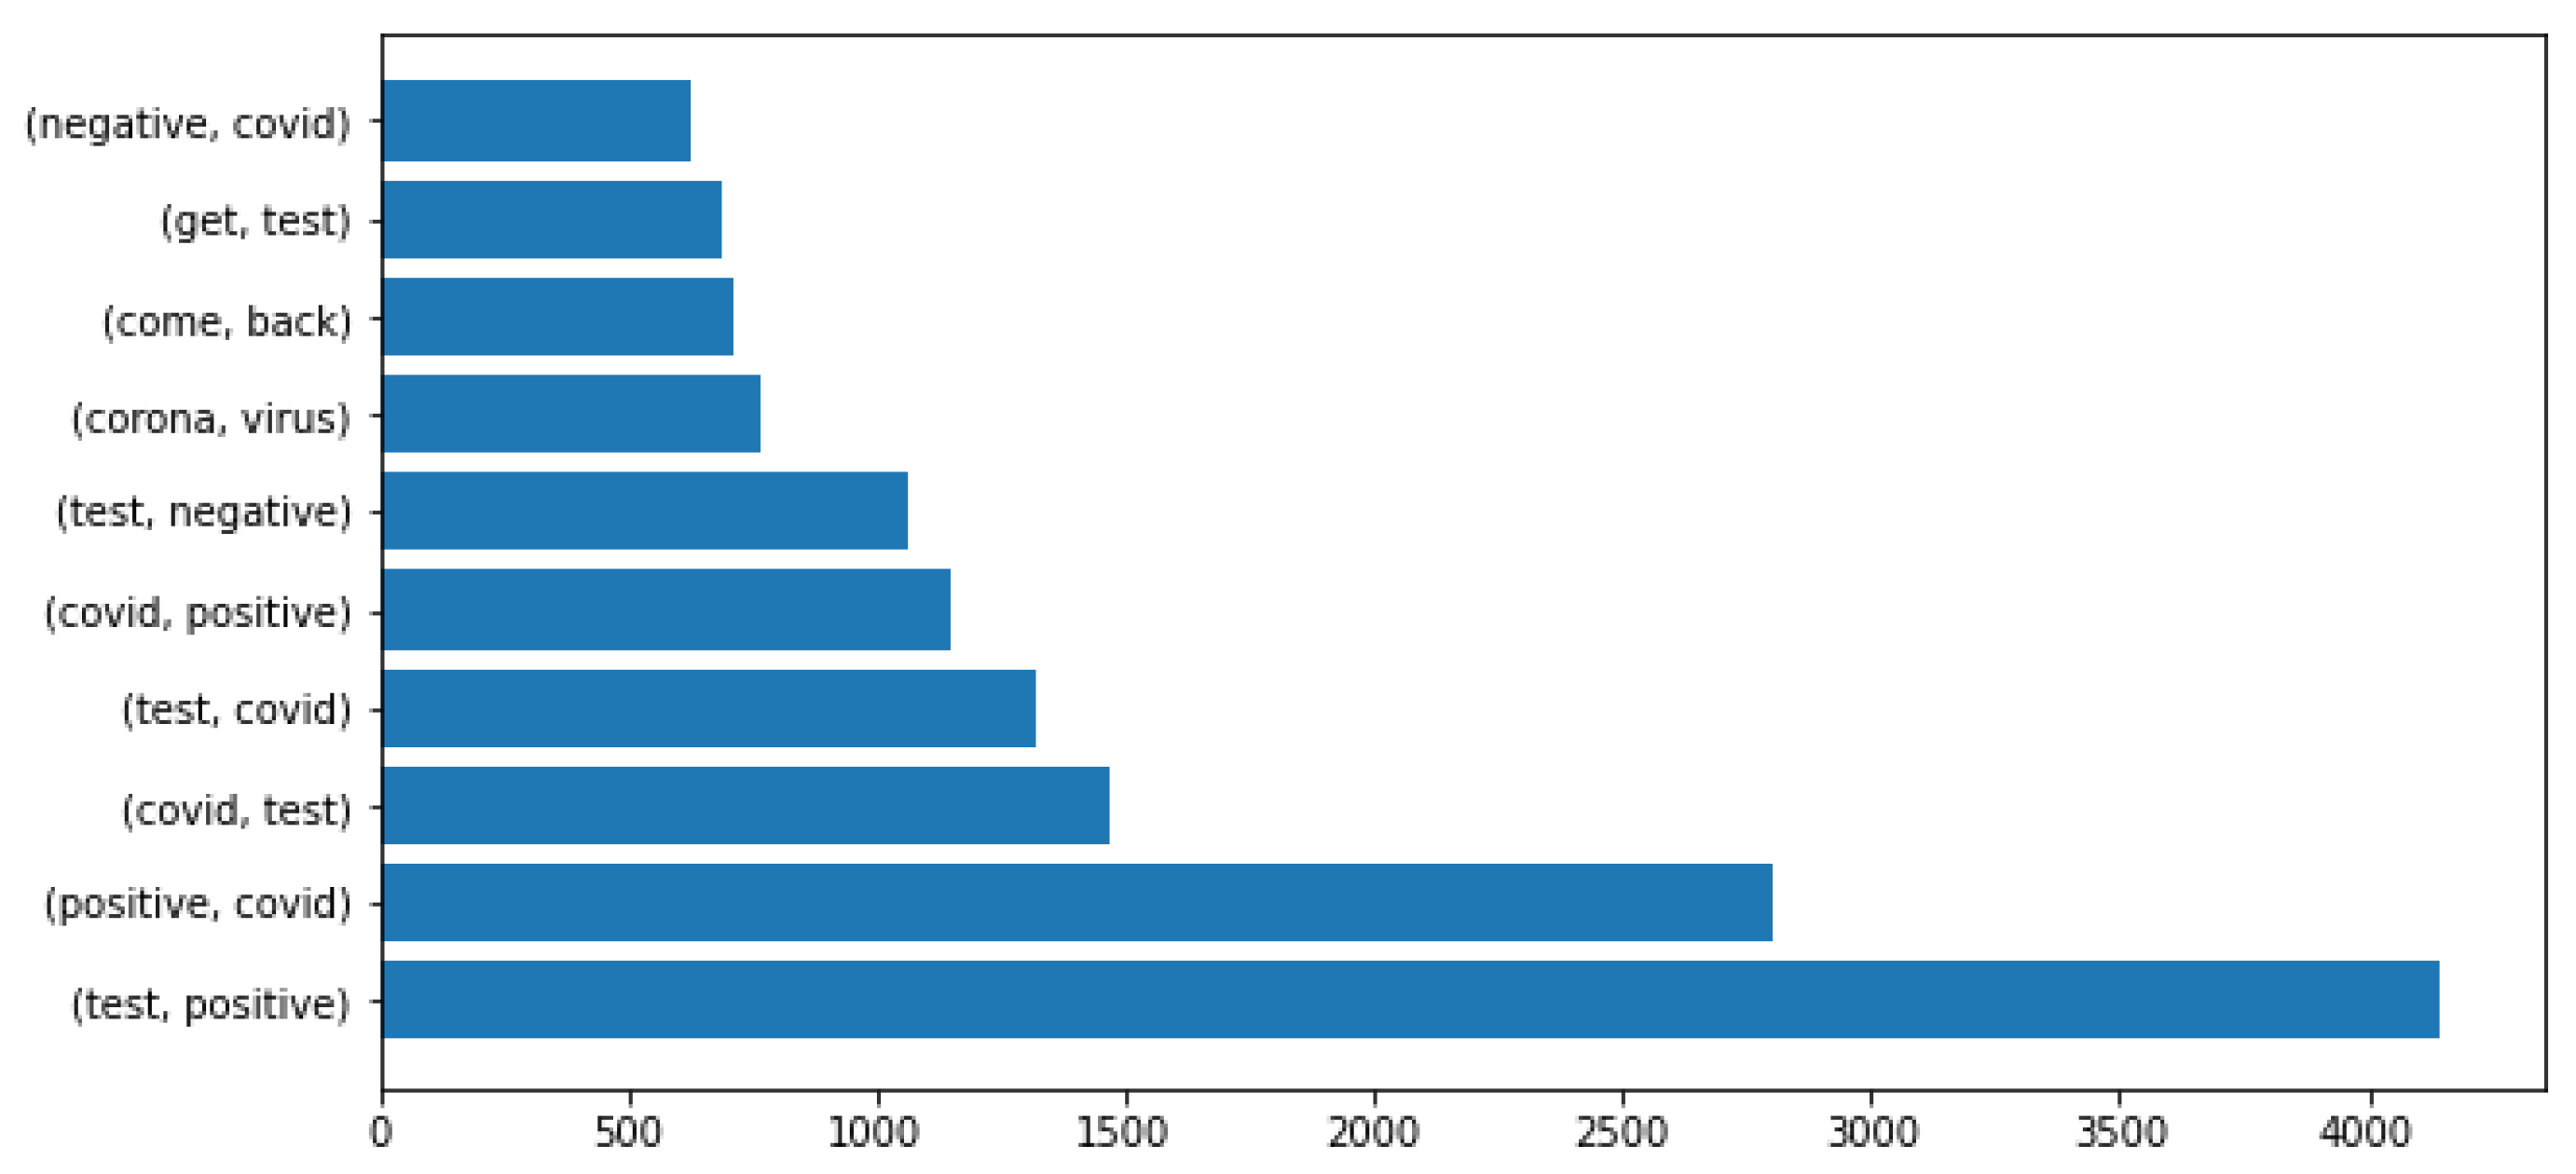
The bi-grams were also calculated for the entire dataset and for the positive and negative classes. Bi-grams are a sequence of two elements of a set of tokens. The bi-grams frequency for the entire dataset are show in Figure 5.
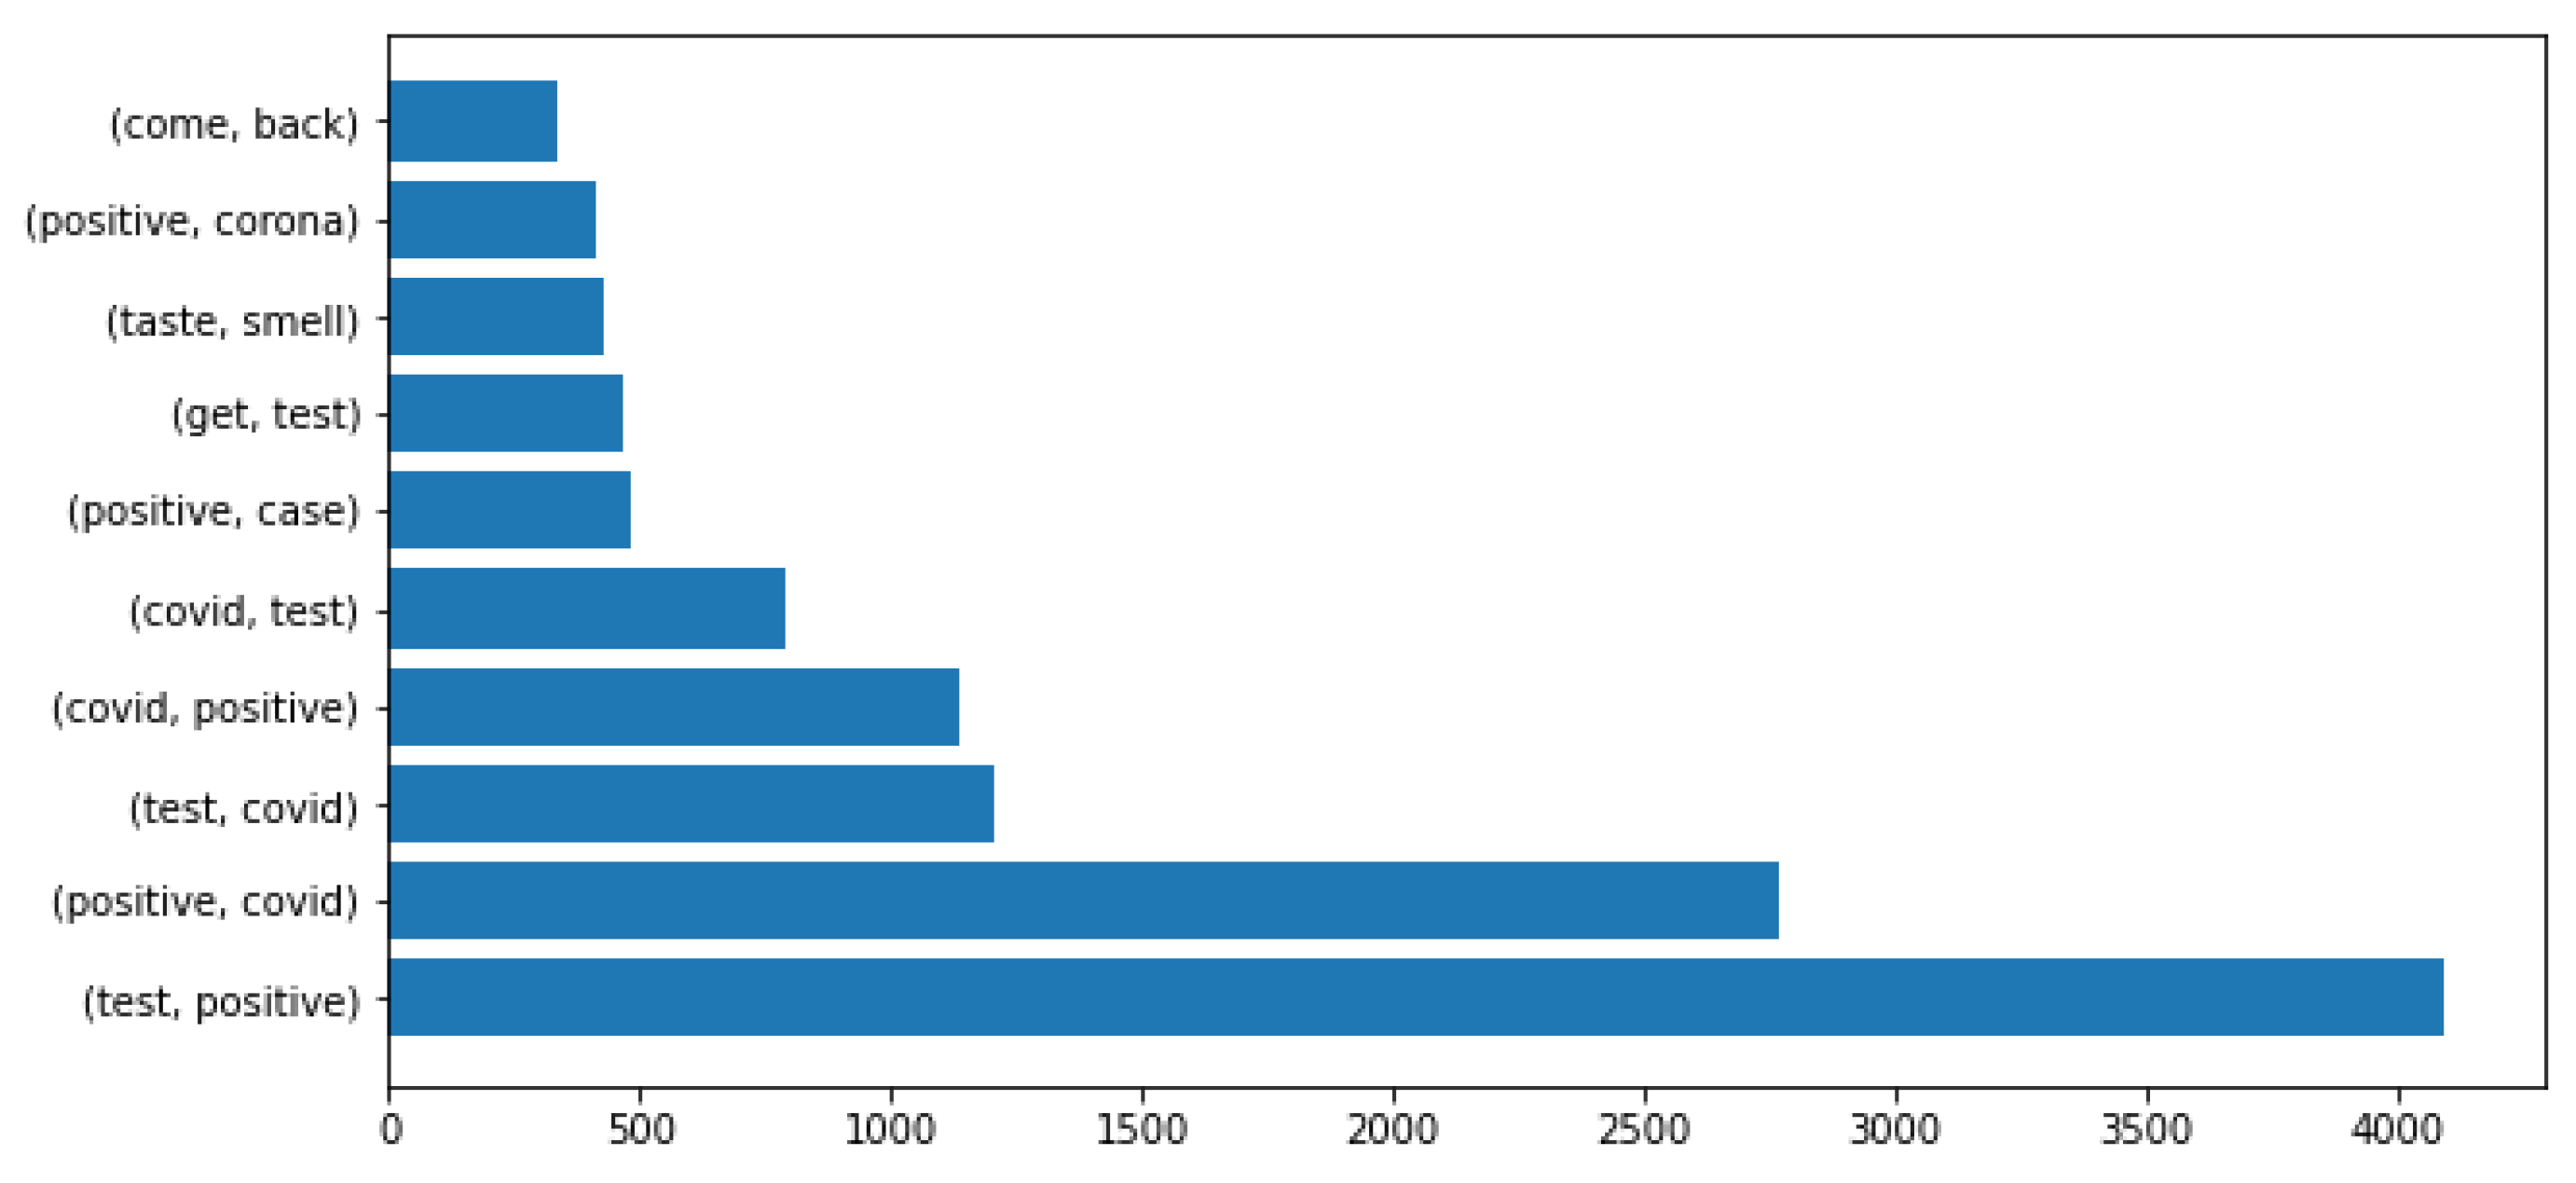
According to Figure 6, the most frequent bi-grams that appeared in the positive class were (test,positive), (positive,covid), (test,covid), (covid,positive).
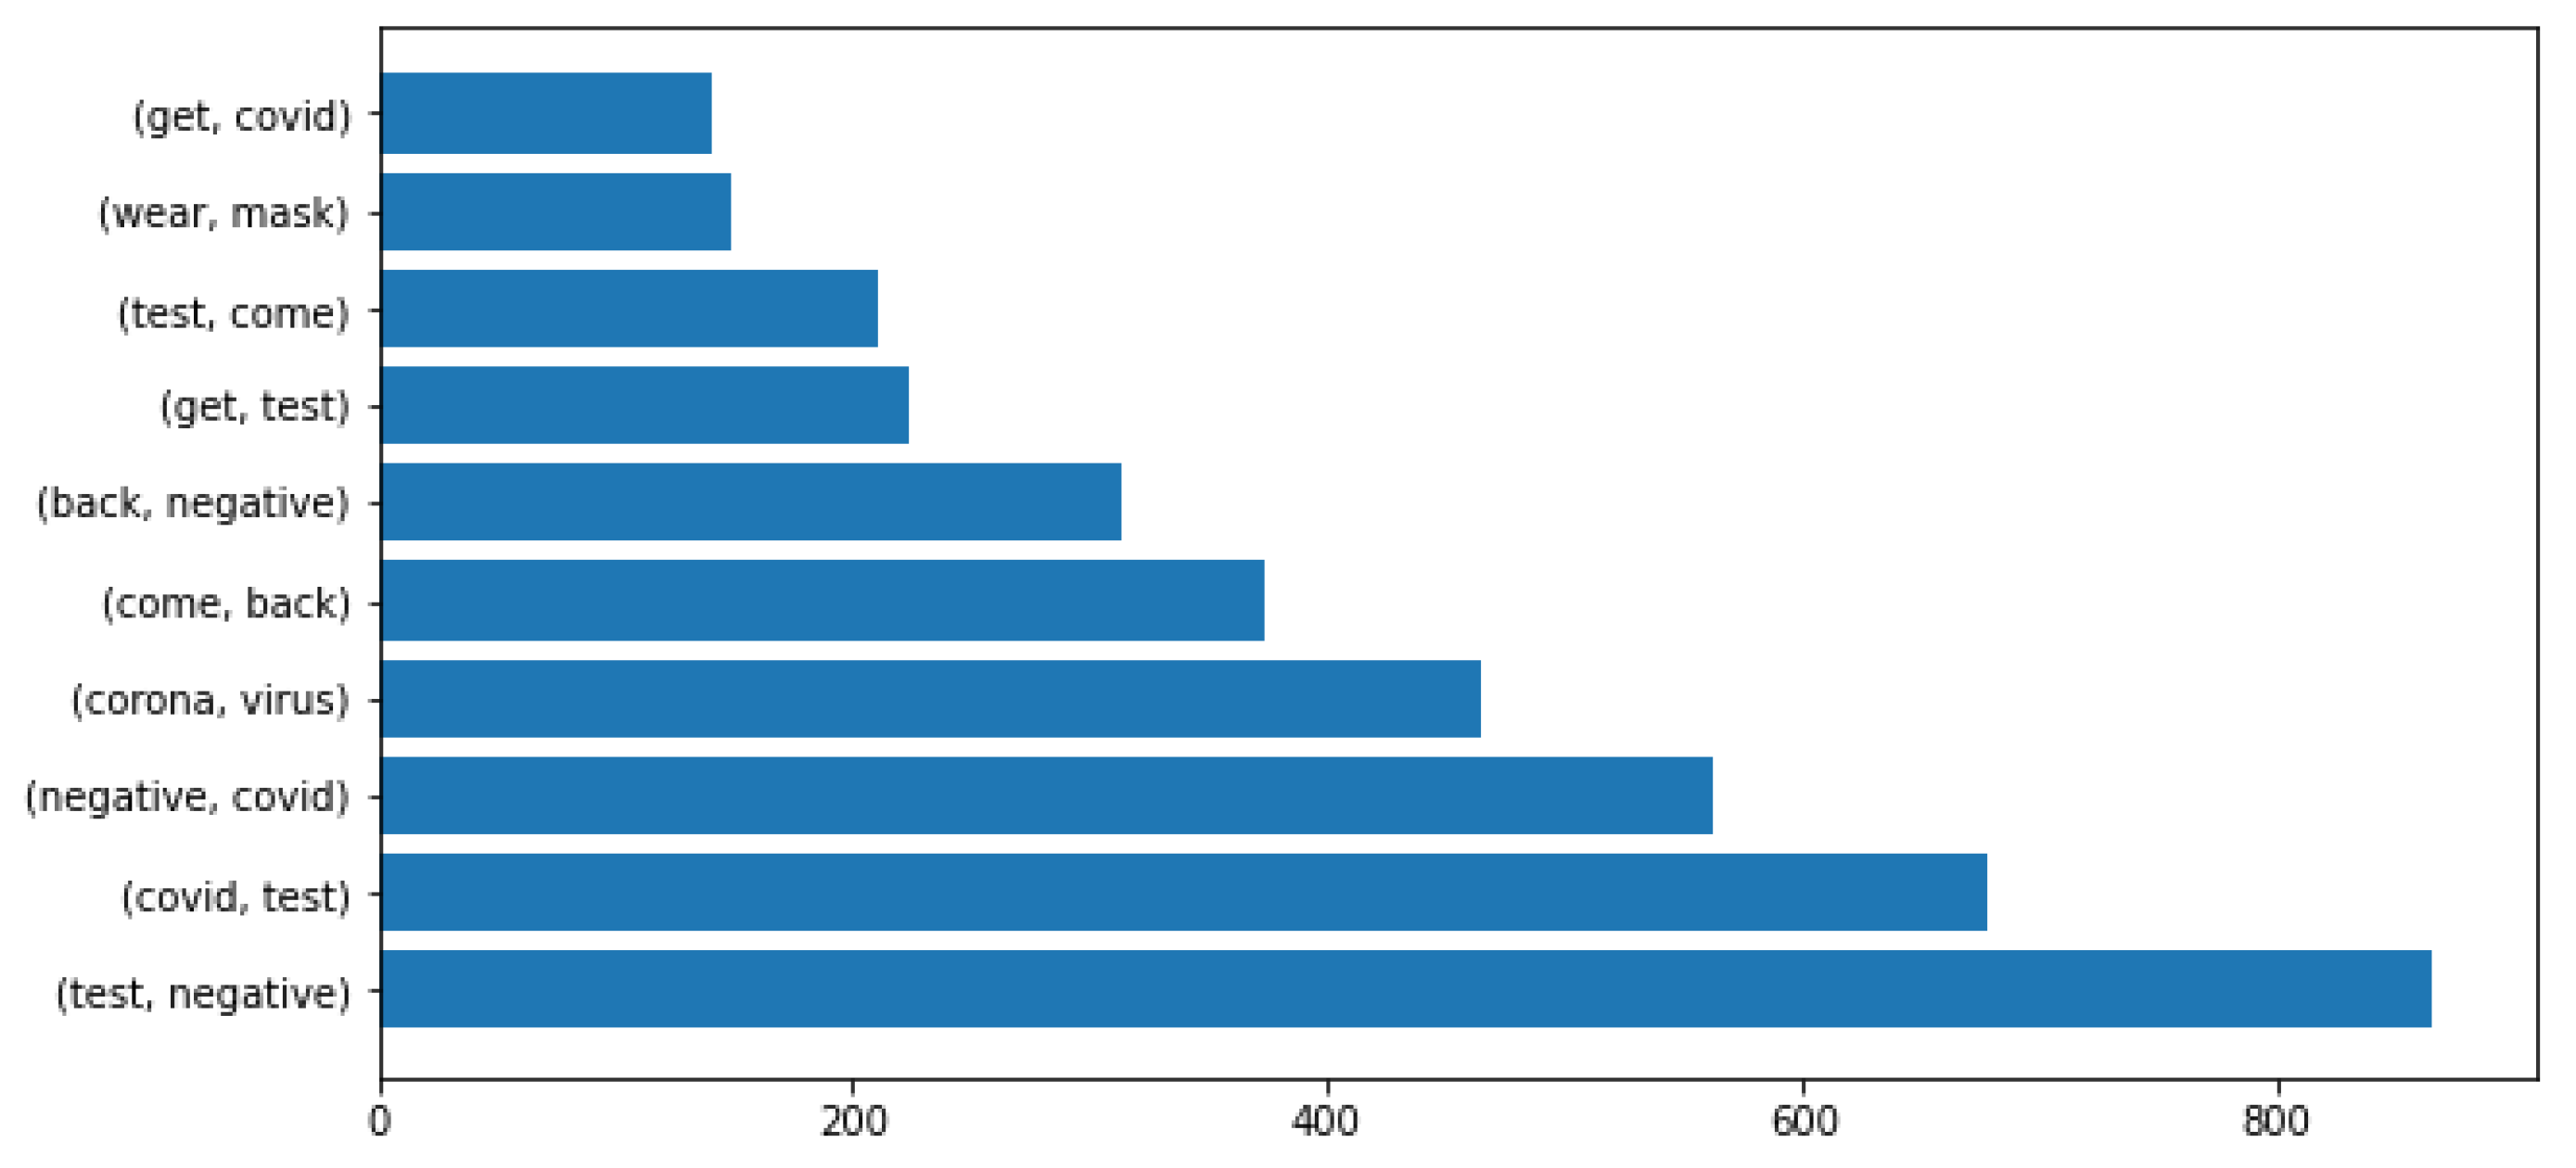
For the negative class, the most frequent bi-grams were (test,negative), (covid,test), (negative,covid), (corona,virus) (Figure 7).
This previous exploratory data analysis gives us some clues about the dataset and the characteristics of the different classes, namely, positive, for tweets that reveal positive covid tests and symptoms, and negative, with the absence of symptoms report.
2.4. Training
The dataset was divided in training (70%) and testing (30%). We used the dataset to train and test KNN, Naive Bayes, Decision Tree, Random Forest, SVM, MLP, CNN and BERT classification models.
In the paper by Hsu [44], the author made comparisons between 8 supervised models for text classification and among the models were the Multilayer Perceptron, Naive Bayes, SVM, Decision Tree and Random Forest. We configured our models with the hyperparameters that obtained the best results on each of models presented on the paper. The Multilayer Perceptron was configured with a single hidden layers with 100 neurons and ReLU activation function. In SVM, the regularization parameter was set to and the tolerance for stopping criterion . In Decision Tree, criterion = entropy it was used, and, in Random Forest and also criterion = entropy.
For CNN, the configuration of the hyperparameters followed the work of Krishnakumari [45] which compared different hyperparameters for document classification. The size of the filters were set to 3, 4 and 5, dropout = 0.5 and the feature map size =128 and Softmax activation function (Figure 8). In the Figure, the input is represented as a matrix of size 7 × 5 as the author used as an example. The size of the input matrix in the paper should be set as where d is the dimension of the embedding and l the size of the sentence. For our work, we used embedding dimension of 128.
BERT model was used for classification, ignoring the embeddings related to question answering and others [39]. To highlight that stemming was also not used, in this case.
3. Results
To evaluate the results, we analyzed the confusion matrices obtained from each model on the test dataset (Table 2). The confusion matrix shows the classification frequencies for each class of the model, presenting the number of True Positives (TP), False Positives (FP), True Negatives (TN) and False Negatives (FN):
- TP is when the model classifies an instance as positive and the real class is positive;
- FP is the classification of an instance as positive but its real class is negative;
- TN is the classification of an instance as negative and the real class is negative;
- FN is the classification of an instance as negative but its real class is positive.
In addition to this, we calculated the accuracy, precision, recall and F-Measure of all the tested models (Table 3):
- Precision quantifies the number of positive class predictions that actually belong to the positive class. To calculate the precision of the model, the following formula is used: .
- Recall quantifies the number of positive class predictions made out of all positive examples in the dataset. To calculate the recall of the model, the following formula is used: .
- F-Measure provides a single score that balances both the concerns of precision and recall in one number. To calculate the F-Measure of the model, the following formula is used: F-Measure .
- Accuracy presents an overall performance of the model, among all instances, how many of them were correctly classified. To calculate the accuracy of the model, it is used the following formula: .
4. Discussion
From the results it is possible to verify that KNN had the highest number of incorrect classifications of all the models when classifying as FP and Naive Bayes had the highest number of instances classified as FN. When both the FP and FN are summed in all the models, these two present the highest number of incorrect classifications.
The results also show that from the correct classifications, Random Forest had the highest number of correct classifications for positive examples. Although this model presented a high number of hits in the TN classification, compared to the other models, BERT presented best number of correct classes for the negative examples. Nevertheless, the models that presented best results for both the TP and TN classification were relatively close.
KNN and Naive Bayes had the worst results in FP and FN, respectively, they also presented the worst results when classifying correctly the instances. KNN had the smaller number of TP of all models while Naive Bayes presented the worst number of TN classification.
Based on the confusion matrix values, it was possible to calculate the Precision, Recall, F-Measure and Accuracy of the models in order to have more measures to evaluate their performance.
Precision deals with the amount of variation that arises from a set of measurements. The more precise a measurement, the smaller the variability between the values obtained. Therefore, the precision of the analyzed models did not check the overall correctness of each one, which was measured by the accuracy, but rather the degree of variation and correctness in the positive class. BERT, SVM and Random Forest were the models that presented the highest precision in the tests, with BERT having 95.6% precision. This suggests that there was not a large variation in the test results for the models with the highest precision, and these were the models that presented the greatest correctness in classifying the instances of the positive class. It is also possible to verify that the Naive Bayes algorithm was the one that presented the lowest precision among all the models tested. This means that of all the instances classified as positive it was the worst, obtaining a precision of only 77.1%.
Recall deals with the frequency that the model finds instances of a class. This measure checks if an instance is actually of the class being observed. Of all models tested, the one with the highest Recall was the Random Forest algorithm which obtained 95.1%. Of the instances that this algorithm classified as positive, 95.1% were expected to belong to this class. On the other hand, the KNN algorithm was the one that presented the worst result, with only 42.8%. In the KNN algorithm, similar data tends to be concentrated in the same region of the data scatter space. In our dataset, some tweets were found to have reports of COVID-19 symptoms that were out of context with the disease, such as in the use of sarcasm. These tweets were classified in the dataset as negative. In this case, the algorithm may have grouped words that represent a COVID-19 symptom to classify the instances as positive class.
The F-Measure represents the harmonic mean of the Precision and Recall that seeks to bring a number that indicates the overall quality of the model. F-Measure values can range from to which indicates the perfection of the precision and recall results. Among the models analyzed in the tests, the one that presented the highest F-Measure was Random Forest (95.2%). On the other hand, the model that presented the lowest F-Measure was KNN, which obtained 42.8%. This result is due to the imbalance between the accuracy of this model, which presented a value of 84.6%, and the recall that obtained 42.8%, while in the other models the difference between the them was not so high.
The Accuracy gives an overall result of how the model performed during testing. It typically provides an evaluation of the overall success rate of the model. In this case, It was possible to verify that the model that presented the highest accuracy was Random Forest, with 94.3%, and the one that obtained the lowest accuracy was KNN, with 62.3%. It is also possible to note that BERT, SVM and CNN had very close results, all within the 93% accuracy range, with a slight superiority for the BERT model, which was the second best model.
5. Conclusions
The goal of this work was to analyze and compare machine learning and deep learning models for the classification of text, more specifically COVID-19 related tweets, to identify which contained indications of symptoms of the disease. This context allowed the study and implementation of machine learning models to identify textual description of symptoms and self-diagnostic content in social networks. This work was important for understanding how different models work for text classification. Also to help the identification of certain disease symptoms that may appear in social medias.
For that, it was necessary to obtain and adapt a specific dataset and annotate the examples with the presence or absence of COVID-19 symptoms. This was achieved with a systematic approach based on regular expressions and specific keywords. The Random Forest algorithm was the approach that presented the best results among all the models analyzed in this work. BERT and CNN models are more robust than Random Forest, but may suffer from over-fitting when the training data is too small, which provides a hint of trying a bigger training dataset. Although Random Forest performed better than BERT, CNN and SVM, they all showed metrics very close to each other and could change the order of performance if the dataset were larger or the parameters of the models were modified.
In this work, we did not test different hyperparameters for each model, which could improve the performance of the algorithms for this kind of task and bring better practical results. Therefore, for future work, there is the possibility of testing these same models, together or individually, with different parameters to verify which combinations of parameters provide the best results.
Author Contributions
Conceptualization, C.F.d.S. and R.P.L.; methodology, R.P.L. and A.C.J.; software, C.F.d.S.; validation, C.F.d.S., R.P.L. and A.C.J.; formal analysis, A.C.J.; investigation, C.F.d.S.; resources, R.P.L.; writing—original draft preparation, C.F.d.S.; writing—review and editing, R.P.L. and A.C.J.; visualization, C.F.d.S.; data curation, C.F.d.S.; supervision, R.P.L.; project administration, R.P.L.; funding acquisition, R.P.L. All authors have read and agreed to the published version of the manuscript.
Funding
This work has been supported by FCT—Fundação para a Ciência e Tecnologia within the Project Scope: DSAIPA/AI/0088/2020.
Data Availability Statement
The data presented in this study are available on request from the corresponding author.
Conflicts of Interest
The authors declare no conflict of interest.
References
- Al-Garadi, M.A.; Yang, Y.C.; Lakamana, S.; Sarker, A. A Text Classification Approach for the Automatic Detection of Twitter Posts Containing Self-Reported COVID-19 Symptoms. 2020. Available online: https://openreview.net/pdf?id=xyGSIttHYO (accessed on 30 December 2021).
- Remuzzi, A.; Remuzzi, G. COVID-19 and Italy: What next? Lancet 2020, 395, 1225–1228. [Google Scholar] [CrossRef]
- Ding, W.; Wang, Q.G.; Zhang, J.X. Analysis and prediction of COVID-19 epidemic in South Africa. ISA Trans. 2021. [Google Scholar] [CrossRef] [PubMed]
- Ding, Q.; Massey, D.; Huang, C.; Grady, C.B.; Lu, Y.; Cohen, A.; Matzner, P.; Mahajan, S.; Caraballo, C.; Kumar, N.; et al. Tracking Self-reported Symptoms and Medical Conditions on Social Media During the COVID-19 Pandemic: Infodemiological Study. JMIR Public Health Surveill. 2021, 7, e29413. [Google Scholar] [CrossRef] [PubMed]
- Hasni, S.; Faiz, S. Word embeddings and deep learning for location prediction: Tracking Coronavirus from British and American tweets. Soc. Netw. Anal. Min. 2021, 11, 66. [Google Scholar] [CrossRef]
- Marengo, D.; Montag, C.; Sindermann, C.; Elhai, J.D.; Settanni, M. Examining the links between active Facebook use, received likes, self-esteem and happiness: A study using objective social media data. Telemat. Inform. 2021, 58, 101523. [Google Scholar] [CrossRef]
- Faelens, L.; Hoorelbeke, K.; Soenens, B.; Van Gaeveren, K.; De Marez, L.; De Raedt, R.; Koster, E.H. Social media use and well-being: A prospective experience-sampling study. Comput. Hum. Behav. 2021, 114, 106510. [Google Scholar] [CrossRef]
- Chen, X.; Pan, Z. A review on assessment, early warning and auxiliary diagnosis of depression based on different modal data. In Proceedings of the Twelfth International Conference on Graphics and Image Processing (ICGIP 2020), Xi’an, China, 13–15 November 2020; p. 75. [Google Scholar] [CrossRef]
- Alzubaidi, L.; Zhang, J.; Humaidi, A.J.; Al-Dujaili, A.; Duan, Y.; Al-Shamma, O.; Santamaría, J.; Fadhel, M.A.; Al-Amidie, M.; Farhan, L. Review of deep learning: Concepts, CNN architectures, challenges, applications, future directions. J. Big Data 2021, 8, 53. [Google Scholar] [CrossRef] [PubMed]
- Ziora, L. Natural Language Processing in the Support of Business Organization Management. In Intelligent Systems and Applications; Lecture Notes in Networks and Systems; Arai, K., Ed.; Springer International Publishing: Cham, Switzerland, 2022; Volume 296, pp. 76–83. [Google Scholar] [CrossRef]
- Cortis, K.; Davis, B. Over a decade of social opinion mining: A systematic review. Artif. Intell. Rev. 2021, 54, 4873–4965. [Google Scholar] [CrossRef] [PubMed]
- Singhal, T. A Review of Coronavirus Disease-2019 (COVID-19). Indian J. Pediatr. 2020, 87, 281–286. [Google Scholar] [CrossRef] [Green Version]
- World Health Organization. Coronavirus Disease (COVID-19): Vaccines; World Health Organization: Geneva, Switzerland, 2020. [Google Scholar]
- Zhou, Y. Natural Language Processing with Improved Deep Learning Neural Networks. Sci. Program. 2022, 2022, 1–8. [Google Scholar] [CrossRef]
- Jurafsky, D.; Martin, J.H. Speech and Language Processing: An Introduction to Natural Language Processing, Computational Linguistics, and Speech Recognition; Pearson Prentice Hall: Upper Saddle River, NJ, USA, 2009. [Google Scholar]
- Lopes, R. CeDRI at eRisk 2021: A naive approach to early detection of psychological disorders in social media. In Proceedings of the CEUR Workshop Proceedings, CEUR-WS, Bucharest, Romania, 21–24 September 2021; Volume 2936, pp. 981–991. [Google Scholar]
- Pereira, A.; Trifan, A.; Lopes, R.P.; Oliveira, J.L. Systematic review of question answering over knowledge bases. IET Softw. 2022, 16, 1–13. [Google Scholar] [CrossRef]
- Jonker, R.A.A.; Poudel, R.; Pedrosa, T.; Lopes, R.P. Using Natural Language Processing for Phishing Detection. In Optimization, Learning Algorithms and Applications; Communications in Computer and Information, Science; Pereira, A.I., Fernandes, F.P., Coelho, J.P., Teixeira, J.P., Pacheco, M.F., Alves, P., Lopes, R.P., Eds.; Springer International Publishing: Cham, Switzerland, 2021; Volume 1488, pp. 540–552. [Google Scholar] [CrossRef]
- Mori, K. Decoding peak emotional responses to music from computational acoustic and lyrical features. Cognition 2022, 222, 105010. [Google Scholar] [CrossRef]
- Abisado, M.; Yongson, M.; De Los Trinos, M. Towards the Development of Music Mood Classification of Original Pilipino Music (OPM) Songs Based on Audio and Lyrics Keyword. In Proceedings of the 2021 5th International Conference on E-Society, E-Education and E-Technology, Taipei, Taiwan, 21–23 August 2021; pp. 87–90. [Google Scholar] [CrossRef]
- Wang, Y.; Wang, Z.O. A fast KNN algorithm for text categorization. In Proceedings of the 2007 International Conference on Machine Learning and Cybernetics, Hong Kong, 19–22 August 2007; Volume 6, pp. 3436–3441. [Google Scholar]
- Jose, I. KNN (K-Nearest Neighbors). 2018. Available online: https://medium.com/brasil-ai/knn-k-nearest-neighbors-1-e140c82e9c4e (accessed on 30 December 2021).
- Adamu, H.; Bin Mat Jiran, M.J.; Gan, K.H.; Samsudin, N.H. Text Analytics on Twitter Text-based Public Sentiment for COVID-19 Vaccine: A Machine Learning Approach. In Proceedings of the 2021 IEEE International Conference on Artificial Intelligence in Engineering and Technology (IICAIET), Kota Kinabalu, Malaysia, 13–15 September 2021; pp. 1–6. [Google Scholar] [CrossRef]
- Joyce, J. Bayes’ Theorem. The Stanford Encyclopedia of Philosophy (Fall 2021 Edition). Available online: https://plato.stanford.edu/archives/fall2021/entries/bayes-theorem/ (accessed on 30 December 2021).
- Raschka, S. Naive bayes and text classification i-introduction and theory. arXiv 2014, arXiv:1410.5329. [Google Scholar]
- Elyassami, S.; Alseiari, S.; ALZaabi, M.; Hashem, A.; Aljahoori, N. Fake News Detection Using Ensemble Learning and Machine Learning Algorithms. In Combating Fake News with Computational Intelligence Techniques; Studies in Computational, Intelligence; Lahby, M., Pathan, A.S.K., Maleh, Y., Yafooz, W.M.S., Eds.; Springer International Publishing: Cham, Switzerland, 2022; Volume 1001, pp. 149–162. [Google Scholar] [CrossRef]
- Hossain, F.; Uddin, M.N.; Halder, R.K. An Ensemble Method-Based Machine Learning Approach Using Text Mining to Identify Semantic Fake News. In Proceedings of the International Conference on Big Data, IoT, and Machine Learning; Lecture Notes on Data Engineering and Communications, Technologies. Arefin, M.S., Kaiser, M.S., Bandyopadhyay, A., Ahad, M.A.R., Ray, K., Eds.; Springer: Singapore, 2022; Volume 95, pp. 733–744. [Google Scholar] [CrossRef]
- Gandhi, R. Support Vector Machine—Introduction to Machine Learning Algorithms. 2018. Available online: https://towardsdatascience.com/support-vector-machine-introduction-to-machine-learning-algorithms-934a444fca47 (accessed on 30 December 2021).
- Islam, N.; Shaikh, A.; Qaiser, A.; Asiri, Y.; Almakdi, S.; Sulaiman, A.; Moazzam, V.; Babar, S.A. Ternion: An Autonomous Model for Fake News Detection. Appl. Sci. 2021, 11, 9292. [Google Scholar] [CrossRef]
- Russell, S.J.; Norvig, P. Artificial Intelligence: A Modern Approach; Pearson Education Limited: Kuala Lumpur, Malaysia, 2016. [Google Scholar]
- Haykin, S. Redes Neurais: Princípios e Prática; Bookman Editora: Orange, CA, USA, 2007. [Google Scholar]
- Leite, T.M. Redes Neurais, Perceptron Multicamadas e o Algoritmo Backpropagation. 2018. Available online: https://medium.com/ensina-ai/redes-neurais-perceptron-multicamadas-e-o-algoritmo-backpropagation-eaf89778f5b8 (accessed on 30 December 2021).
- Glassner, A.S. Deep Learning: A Visual Approach; No Starch Press: San Francisco, CA, USA, 2021. [Google Scholar]
- Demuth, H.; Beale, M.; Hagan, M. Neural network toolbox. In Use MATLAB; MathWorks Inc.: Natick, MA, USA, 1992; Volume 2000. [Google Scholar]
- Schmidt-Hieber, J. Nonparametric regression using deep neural networks with ReLU activation function. Ann. Stat. 2020, 48, 1875–1897. [Google Scholar]
- Goodfellow, I.; Bengio, Y.; Courville, A. Deep Learning; MIT Press: Cambridge, MA, USA, 2016. [Google Scholar]
- Amin, M.Z.; Nadeem, N. Convolutional neural network: Text classification model for open domain question answering system. arXiv 2018, arXiv:1809.02479. [Google Scholar]
- Singla, C.; Al-Wesabi, F.N.; Pathania, Y.S.; Alfurhood, B.S.; Hilal, A.M.; Rizwanullah, M.; Hamza, M.A.; Mahzari, M. An Optimized Deep Learning Model for Emotion Classification in Tweets. Comput. Mater. Contin. 2022, 70, 6365–6380. [Google Scholar] [CrossRef]
- Devlin, J.; Chang, M.W.; Lee, K.; Toutanova, K. Bert: Pre-training of deep bidirectional transformers for language understanding. arXiv 2018, arXiv:1810.04805. [Google Scholar]
- Vaswani, A.; Shazeer, N.; Parmar, N.; Uszkoreit, J.; Jones, L.; Gomez, A.N.; Kaiser, L.; Polosukhin, I. Attention is all you need. arXiv 2017, arXiv:1706.03762. [Google Scholar]
- Jernite, Y.; Bowman, S.R.; Sontag, D.A. Discourse-Based Objectives for Fast Unsupervised Sentence Representation Learning. arXiv 2017, arXiv:1705.00557. [Google Scholar]
- Lamsal, R. Design and analysis of a large-scale COVID-19 tweets dataset. Appl. Intell. 2021, 51, 2790–2804. [Google Scholar] [CrossRef]
- Sarker, A.; Lakamana, S.; Hogg-Bremer, W.; Xie, A.; Al-Garadi, M.A.; Yang, Y.C. Self-reported COVID-19 symptoms on Twitter: An analysis and a research resource. J. Am. Med. Inform. Assoc. 2020, 27, 1310–1315. [Google Scholar] [CrossRef] [PubMed]
- Hsu, B.M. Comparison of Supervised Classification Models on Textual Data. Mathematics 2020, 8, 851. [Google Scholar] [CrossRef]
- Krishnakumari, K.; Sivasankar, E.; Radhakrishnan, S. Hyperparameter tuning in convolutional neural networks for domain adaptation in sentiment classification (HTCNN-DASC). Soft Comput. 2020, 24, 3511–3527. [Google Scholar] [CrossRef]
Figure 1.
Most frequent words in dataset.

Figure 2.
Most frequent words for positive class.

Figure 3.
Most frequent words for negative class.

Figure 4.
Symptoms that appeared the most in the dataset.

Figure 5.
Most frequent bi-grams in the dataset.

Figure 6.
Most frequent bi-grams in the positive class.

Figure 7.
Most frequent bi-grams in the negative class.

Figure 8.
Proposed Convolution Neural Network (CNN) architecture.


Table 1.
Words associated with the term covid.
| Word | Similarity |
|---|---|
| rapid | 0.7554 |
| antibody | 0.7390 |
| inconclusive | 0.7301 |
| pcr | 0.7294 |
| corona | 0.7160 |
| retested | 0.7048 |
Table 2.
Confusion matrix of each model.
| Model | TP | TN | FP | FN |
|---|---|---|---|---|
| KNN | 1709 | 2592 | 2285 | 312 |
| Naive Bayes | 3614 | 1833 | 380 | 1071 |
| Decision Tree | 3732 | 2675 | 262 | 229 |
| Random Forest | 3801 | 2706 | 193 | 198 |
| SVM | 3695 | 2726 | 299 | 178 |
| MLP | 3641 | 2609 | 353 | 295 |
| CNN | 3721 | 2693 | 273 | 211 |
| BERT | 3699 | 2734 | 295 | 170 |
Table 3.
Metric result of each model.
| Model | Precision | Recall | F-Measure | Accuracy |
|---|---|---|---|---|
| KNN | 84.6% | 42.8% | 56.8% | 62.3% |
| Naive Bayes | 77.1% | 90.4% | 83.2% | 79.0% |
| Decision Tree | 94.2% | 93.4% | 93.8% | 92.9% |
| Random Forest | 95.0% | 95.1% | 95.2% | 94.3% |
| SVM | 95.4% | 92.5% | 93.9% | 93.1% |
| MLP | 92.5% | 91.2% | 91.9% | 90.6% |
| CNN | 94.6% | 93.2% | 93.9% | 93.0% |
| BERT | 95.6% | 92.6% | 94.0% | 93.3% |
Publisher’s Note: MDPI stays neutral with regard to jurisdictional claims in published maps and institutional affiliations. |
© 2022 by the authors. Licensee MDPI, Basel, Switzerland. This article is an open access article distributed under the terms and conditions of the Creative Commons Attribution (CC BY) license (https://creativecommons.org/licenses/by/4.0/).
Share and Cite
MDPI and ACS Style
Silva, C.F.d.; Junior, A.C.; Lopes, R.P. Predictive Analysis of COVID-19 Symptoms in Social Networks through Machine Learning. Electronics 2022, 11, 580. https://doi.org/10.3390/electronics11040580
AMA Style
Silva CFd, Junior AC, Lopes RP. Predictive Analysis of COVID-19 Symptoms in Social Networks through Machine Learning. Electronics. 2022; 11(4):580. https://doi.org/10.3390/electronics11040580
Chicago/Turabian StyleSilva, Clístenes Fernandes da, Arnaldo Candido Junior, and Rui Pedro Lopes. 2022. "Predictive Analysis of COVID-19 Symptoms in Social Networks through Machine Learning" Electronics 11, no. 4: 580. https://doi.org/10.3390/electronics11040580
Note that from the first issue of 2016, this journal uses article numbers instead of page numbers. See further details here.