
Exploring the Effects of Carpooling on Travelers’ Behavior during the COVID-19 Pandemic: A Case Study of Metropolitan City

Economics and Management School, Harbin University of Science and Technology, Harbin 150080, China
*
Author to whom correspondence should be addressed.
Sustainability 2021, 13(20), 11136; https://doi.org/10.3390/su132011136
Submission received: 28 August 2021
/
Revised: 27 September 2021
/
Accepted: 30 September 2021
/
Published: 9 October 2021
(This article belongs to the Special Issue Travel Behavior and Sustainable Urban Mobility Planning/Management)
Abstract
:Transportation accounts for more than a quarter of the greenhouse gas emissions that are causing climate change. Carpooling is a subset of the sharing economy, in which individuals share their vehicle with commuters to save travel expenses. In recent decades, carpooling has been promoted as a feasible alternative to car ownership with the potential to alleviate traffic congestion, parking demand, and environmental problems. Unstable economic conditions, cultural norms, and lack of infrastructure make cultural exchange activities and mobility habits different in developing nations to those in developed countries. The rapid evolution of sharing mobility has reshaped travelers’ behavior and created a dire need to determine the travel patterns of commuters living in megacities in developing countries. To obtain data, a web-based stated choice (SC) experiment was used in this study. It used mode-related variables, socioeconomic demographic variables, and a coronavirus disease 2019 (COVID-19) precautionary measure variable. Logit models, namely the mixed logit regression model (ML) and the multinomial logit regression model (MNL), were applied to analyze the available data. According to modeling and survey data, economic variables associated with modes of transport, such as trip time and trip cost, were determined to be significant. Additionally, the results revealed that commuters were more conscious of COVID-19 preventive measures, which was determined to be highly significant. The findings showed that the majority of residents in the COVID-19 pandemic continue to rely on automobiles and motorcycles. It is noteworthy that individuals with more than two members in their family and a travel distance of less than seven miles were more likely to prefer a carpooling service. This study’s findings will provide a basis for researchers to aid existing operators in the field of transportation, as well as offer guidelines for governments in developing countries to enhance the utility of transportation networks.
1. Introduction
Transportation accounts for more than a quarter of the greenhouse gas emissions that are causing climate change [1]. In recent decades, Asia has been considered the region with the fastest economic growth. Additionally, the region is defined by a concurrent trend of growing urbanization, with the urban population concentrated in large cities. Indeed, rising urbanization reflects people’s desire for economic prosperity and a higher standard of living enabled by modern urban amenities. In contrast, urban megacities serve as economic growth engines, generating opportunities for investors, entrepreneurs, and both low- and high-skilled workers. In this regard, urbanization is beneficial. The trends observed in Asia may be part of a positive cycle. Despite the potential benefits of urbanization, the nature and size of urbanization in Asian countries have created complex and difficult challenges for policymakers. In developing countries, urbanization and motorization have been considered as critical challenges, with adverse consequences such as traffic congestion, parking issues, air pollution, and traffic safety [2]. Karachi’s population growth rate has been phenomenal, estimated to be approximately 5.5% yearly, with natural growth accounting for 3% and migration accounting for 2.5%. Economic losses have been observed in various cities around the world as a result of traffic congestion. Likewise, every day in Karachi, $6330 is lost due to traffic congestion, which can be generalized to the entire city. The sum is made up of opportunity and fuel consumption costs incurred as a result of severe traffic congestion [3]. Another study shows that traffic congestion costs in Karachi exceeded $1 billion per year in 2018, accounting for 2% of the city’s entire gross domestic product (GDP) [4]. Karachi is Pakistan’s first largest megacity and economic center, with a population of more than 24 million people, and is ranked seventh among the world’s megacities. Karachi has a land area of 3530 square kilometers. Notably, in Karachi, four-fifths of the total population has been added in the past decade, making it the world’s fastest-growing megacity. Despite its economic potential and strategic location, the Karachi megacity suffers from a lack of densification and inadequate transportation infrastructure. In Karachi, private automobile ownership is 36.5% and accounts for 21% of all passenger transport, motorbike ownership is 47.4% and accounts for 17% of all passenger transport, public transportation is 4.5% and accounts for 42% of all passenger transport, paratransit is 9.9% and accounts for 8% of all passenger transport, and contract carriage ownership is approximately 1.7% and accounts for 10% of all passenger transport [2,4]. As of December 2017, the market share of Android phones in Pakistan was 83.53% [5]. Karachi’s economic potential refers to its vital trade and investment, employment opportunities, growth, and innovation. The city, on the other hand, pays the price for this function in terms of increased density and deteriorated transit infrastructure. In developing regions, transportation infrastructure density is expanded to satisfy anticipated demand, but this adds an extra financial burden on society in the end [2,4,6].
Globally, travel demand management strategies have been implemented to address transportation challenges [7,8]. Carpooling fleets are rapidly expanding, including in China, France, the United States, Europe, the Netherlands, Greece, India, and Canada [9]. Carpooling is a type of sharing economy, in which individuals pool their vehicles to utilize a service. This new mode of transportation encourages single-occupancy vehicle (SOV) owners to switch to a more sustainable mode of transportation [10,11,12]. Carpooling has several societal benefits, including reduced energy use and emissions, parking demand, and less congestion. This unoccupied parking space can be used for additional commercial purposes or active transportation. Along with environmental benefits, carpoolers can benefit from shared travel costs, time savings from driving in high occupancy vehicle (HOV) lanes, decreased commuting stress, and, in certain situations, preferential parking and other incentives [9,13,14]. Additionally, carpooling services enable two or more unrelated individuals to share a trip or a portion of a trip, with passengers contributing to the driver’s expenses [15,16]. Some non-profit carpooling programs are community-based initiatives (cooperatives) that broaden the scope of shared mobility beyond commercial models. There are numerous incentives for this mode of transportation, particularly in the United States. For example, towns such as Houston, Texas, have dedicated lanes for carpool vehicles [17].
In 2016, a carpooling service, i.e., Careem, was launched in Pakistan’s major cities and has since expanded to additional cities. Careem began operating its service for the benefit of society by creating possibilities for everyone to earn and obtain benefits through grabbing Pakistani society’s attention. In addition, the company announced an initiative to empower women in 2017. Careem introduced female drivers to eliminate gender differences and meet the needs of all travelers. Due to cultural and safety concerns, women in Pakistan prefer to drive with other women. Careem has surpassed rival Uber in the Middle East and Pakistan, establishing itself as the preferred alternative. Careem had around 30 million registered users in 2018, from 120 cities, 15 countries, and around 1 million drivers. In 2019, Careem funding is expected to total USD 770 million dollars [8]. In Pakistan, carpooling services can be booked via phone, website, or app. Only “Now, later, repeat” is available as a booking option. Payments can be made with a credit or debit card and cash. Careem is a carpooling service that operates in eight major cities as well as smaller cities. The driver requirements state that people who have a valid driver’s license and own an automobile are eligible to become a driver. Careem has gained ground in developing nations such as Pakistan, where a campaign to redefine shared economic business models is under way.
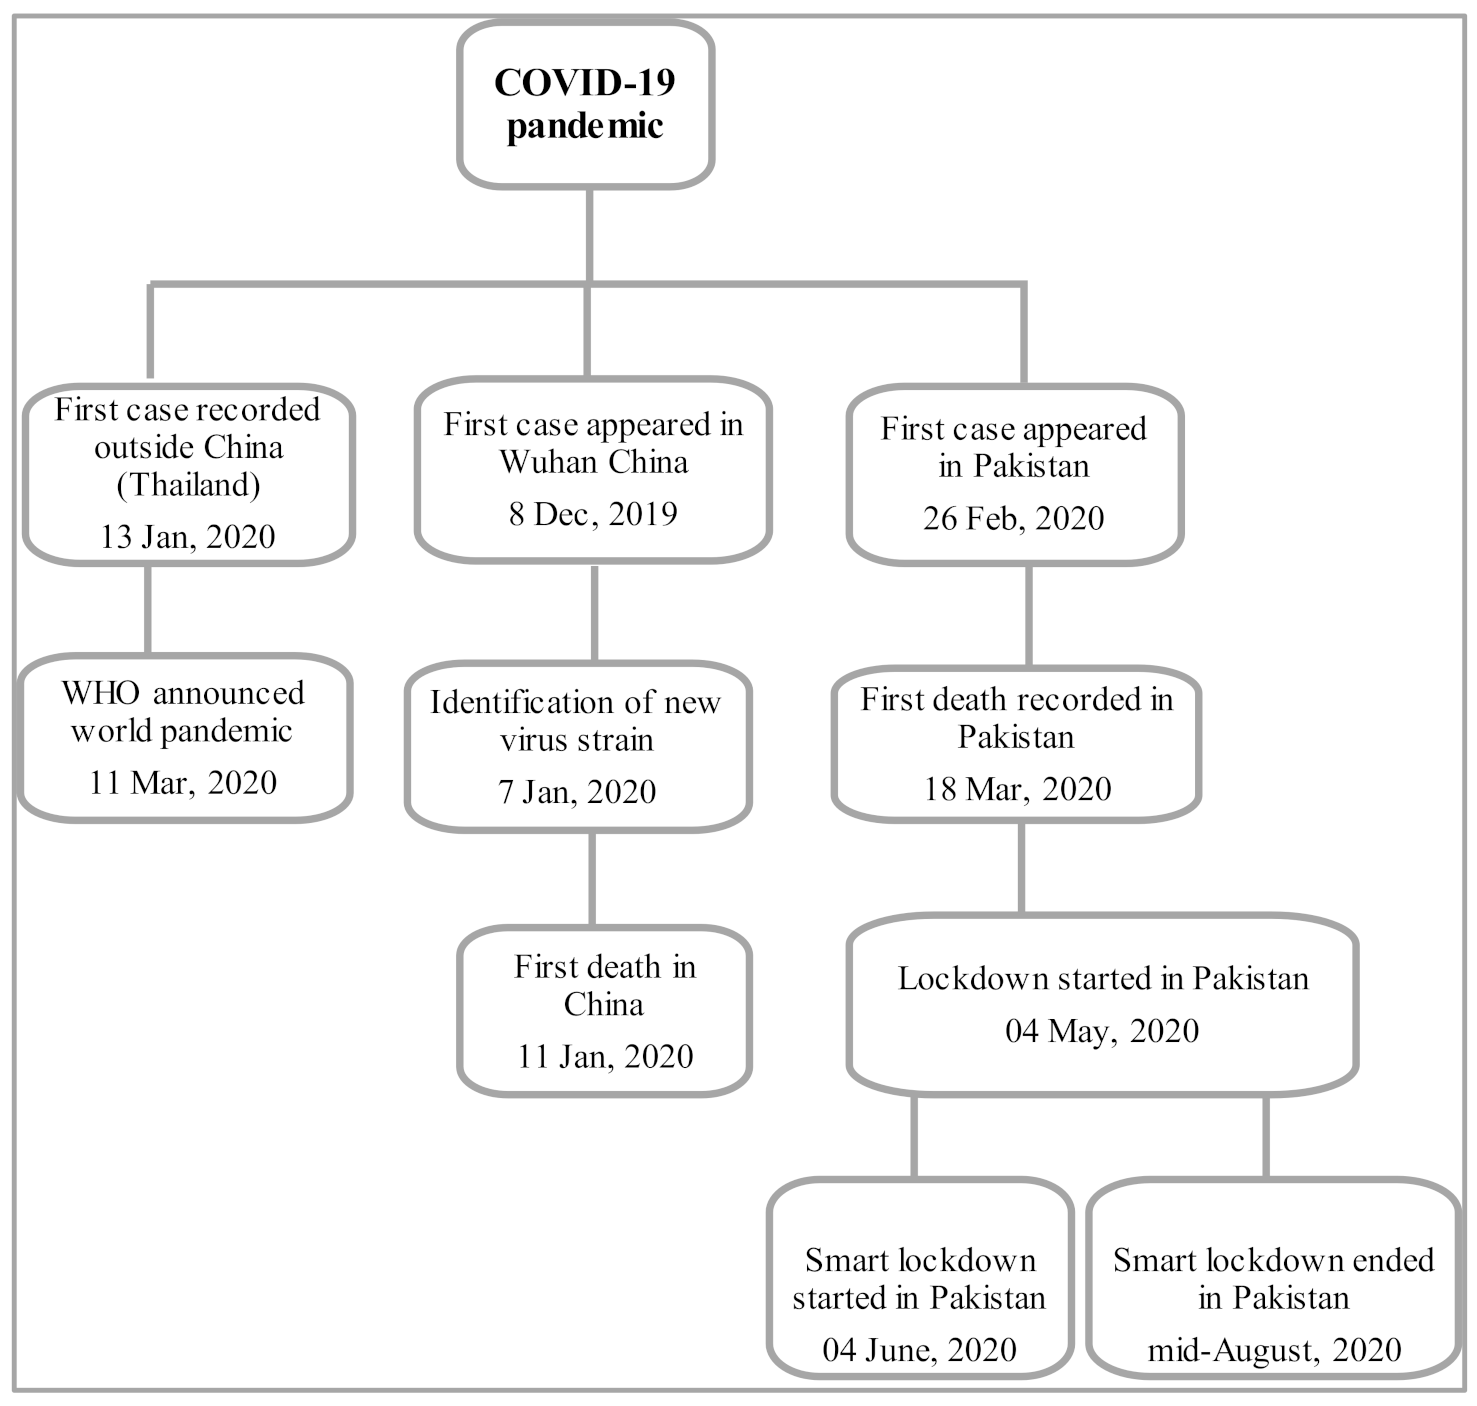
The timeline of the COVID-19 pandemic, from its origin to the procedure adopted by the World Health Organization (WHO) and the situation in Pakistan, is depicted in Figure 1. The COVID-19 pandemic first appeared in December 2019 in Wuhan, Hebei province, China. The identification of this virus was made in January 2020. This disease has been spreading around the world. The first case was recorded outside of China (in Thailand) on 13 January 2020. On 11 March 2020, the WHO declared COVID-19 a global pandemic [18,19]. On 26 February 2020, the first case of COVID-19 was confirmed in Pakistan. The first death was reported on 18 March 2020. The government implemented the first lockdown on 4 May 2020 [19,20]. As shown in Figure 2, the rate of cases and deaths increased by around 2.5 times during May–June 2020. Because of the unprecedented increase, the government converted the lockdown into a ‘smart’ lockdown to restrict people and only allow movement for basic needs during a specific time. Since the outbreak of the COVID-19 disease, travel behavior has been influenced all around the world. The WHO released a report towards the end of March 2020. There were around 750,900 confirmed cases and 36,400 deaths worldwide. One year later, the total numbers of confirmed cases and deaths had risen to approximately 126,372,400 and 2,769,700, respectively [21]. In Pakistan, there were approximately 2 confirmed cases and no deaths on 25 February 2020, and there were 577,472 confirmed cases and 12,804 deaths by 25 February 2021 [20]. It is more than a health issue because the epidemic has wreaked havoc on various businesses, notably transportation. The imposition of mobility restrictions was the first major influence of the COVID-19 pandemic on travel patterns, resulting in the disruption of people’s livelihoods and social lives [19].
According to the World Bank, by 2050, two-thirds of the predicted world population (5.4 billion people) will live in cities, and the number of automobiles on the road will double to 2 billion [22]. Extensive urban sprawl, insufficient urban transportation systems, disorganized traffic patterns with a high reliance on automobiles, excessive pollution, and inadequate pedestrian and bicycle infrastructure are only a few of the trends observed in several cities worldwide. As a result, an increasing number of people are deciding to acquire and operate automobiles, exacerbating the problem [7]. Carpooling, a relatively new mode of transport, has gained great interest in both developed and developing countries. However, research on the impact of carpooling in low-income developing countries such as Pakistan is limited, and commuter behavior needs to be forecasted, especially in light of the COVID-19 epidemic, which remains a research gap in developing countries.
The rapid evolution of sharing mobility has reshaped commuter behavior and there is a dire need to evaluate current carpooling services and satisfaction of people with them. To answer these research questions, a stated choice experiment was conducted using service attributes, demographic variables, and an additional COVID-19 precautionary measures level variable. This study will aid existing operators and governments in developing countries in improving the utility of transportation systems during the COVID-19 pandemic, and it will attract the attention of future researchers looking to develop policies for sustainable megacities. The remainder of this paper is arranged as follows. Following this introduction, Section 2 discusses related works. Section 3 describes the questionnaire design and the data. Section 4 explains the analysis and findings, including model specification analysis, people’s perceptions of carpooling, and patterns of carpooling. Finally, the study’s conclusions are drawn.
2. Related Works
Carpooling has been the focus of various studies in the transportation literature, and it has the potential to boost social welfare. According to Correia and Viegas [10], carpooling is a low-income form of transportation, and saving money is a major incentive for participation. Delhomme and Gheorghiu [13] suggest that carpoolers are more likely to be women and individuals with children, people who have positive opinions about public transportation, and those who are environmentally conscious. Ridesharing allows for the development of policies for parking discounts, toll pricing, and access to high occupancy vehicle (HOV) lanes by pooling rides. Brownstone and Golob [23] revealed that carpooling has a certain level of control over parking fees and ridesharing pricing. Ma and Zhang [24] used statistical assessments to show that ridesharing could help reduce traffic congestion while also providing environmental and economic benefits. A study conducted in the greater Dublin area [25] found that significant reductions in the modal proportion of SOVs of up to 8% could be obtained through the implementation of policies to improve the time and cost parameters of carpooling and car-sharing for commuting to work. Dewan and Ahmad conducted a study in India [11] and found that carpooling can be a low-cost mode of transportation for those who have not purchased a vehicle.
According to [26], several factors, such as travel time, toll, gender, and income, were found to be more predictive of managed lane use than psychological variables. Only conscientiousness and a risky driving style were found to be significant psychological variables. More precisely, those who scored higher on the risky driving scale indicated a lower preference for carpooling than general-purpose lanes. A recent study conducted during the COVID-19 pandemic [19] indicated that there was a considerable shift in the primary purpose of travel from work and school to shopping during the pandemic. The number of trips made for non-commuting purposes was also considerably different between the pre-and post-pandemic periods. For distances smaller than 5 km, there was a considerable modal shift away from motorcycles and toward non-motorized modes of travel. In addition, individuals switched from public transportation to private automobiles for longer distances. Zhang et al. [27] found that the influence of outbreaks on public transportation was reported as trips to affected and non-affected areas in South Korea were reduced by 14% and 9%, respectively, during the MERS outbreak. Furthermore, during the same outbreak, a 10% decline in public transportation trips was reported. Haghani et al. [28] revealed that physical distance, avoiding congestion and crowding, disinfection of public vehicles and transit hubs, and the availability of sanitizers in all public vehicles and hubs are among the precautionary measures that are being prioritized concerning public transportation use.
A plethora of research has been undertaken in the United States, South Korea, and China, with very few studies conducted in Pakistan, Bangladesh, and India, all of which have similar socioeconomic and cultural values. To address this gap and to examine the impact of carpooling on travel behavior, we investigated carpooling during the COVID-19 pandemic and for various trip distances in metropolitan cities of developing nations that have received less attention in previous studies.
3. Questionnaire Design and Data
3.1. Questionnaire Design
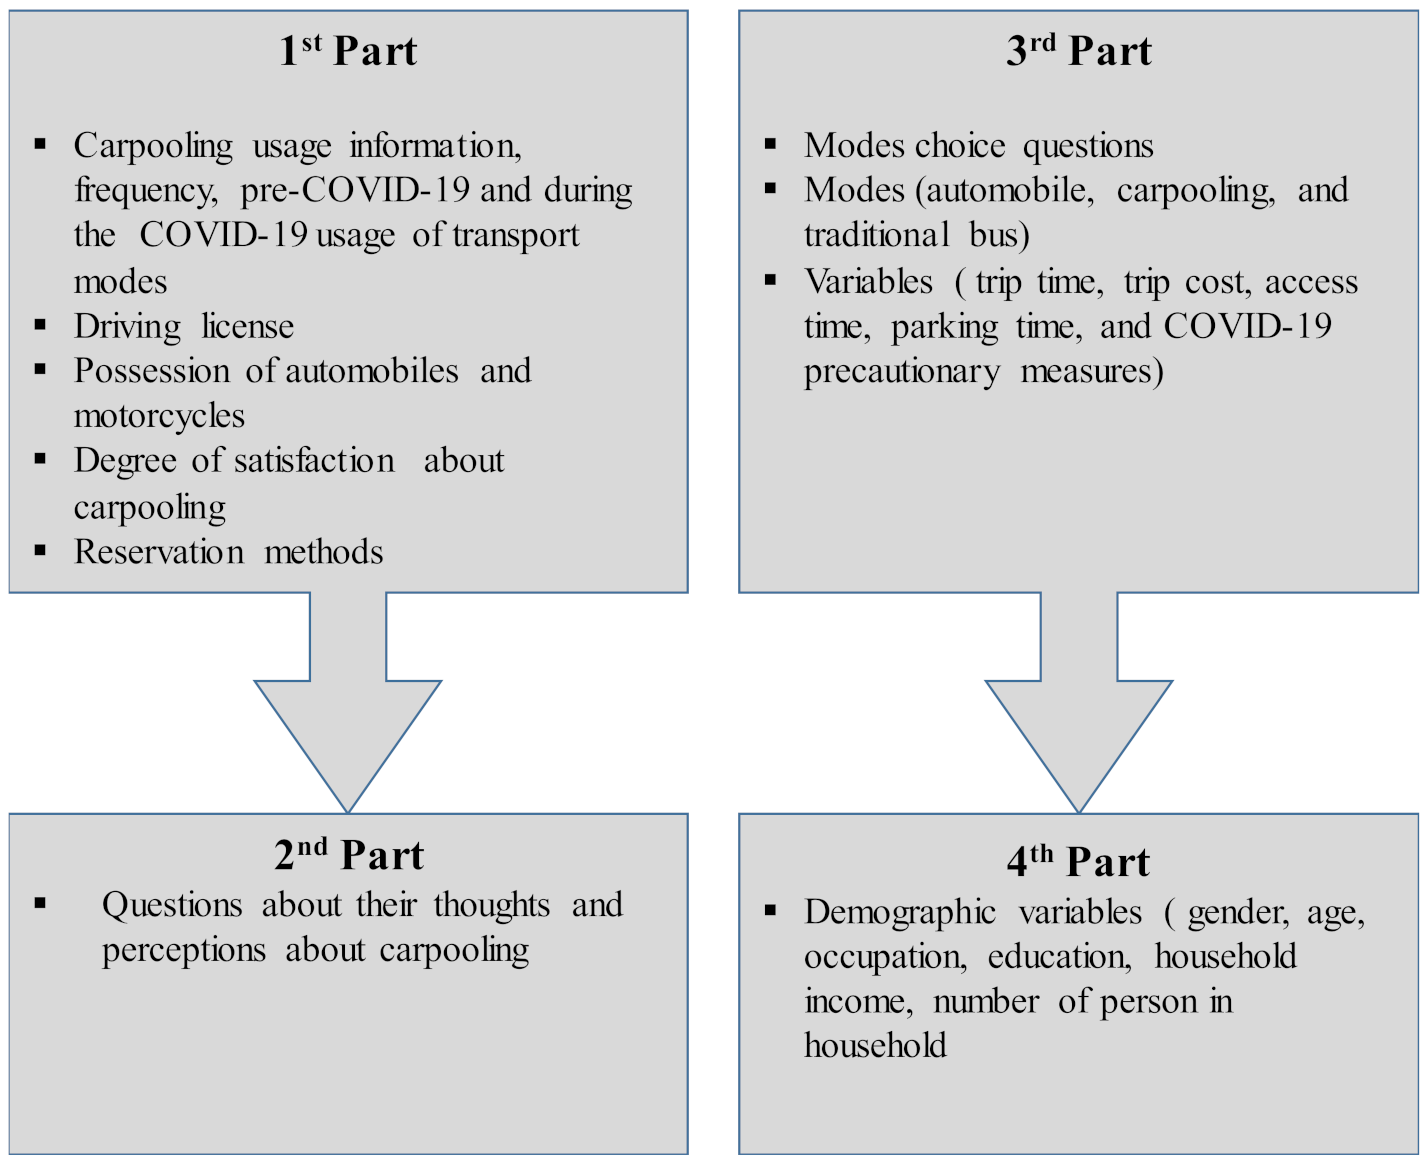
A stated choice experiment usually entails a lengthy process that includes data gathering, administration, and analysis. To better understand public behavior and preferences, a stated choice experiment with hypothetical choices was considered [13,29]. The stated choice experiment was broken down into four parts in this research: firstly, the participants were briefly introduced to the carpooling system and asked questions about how often they carpooled, if they owned a car or a motorcycle, whether they had a driver’s license, how satisfied they were with their current carpooling service, and how they made reservations.
In the second part, participants were asked about their thoughts and experiences concerning carpooling in Pakistan. The stated choice experiment questions were asked in the third part to choose a mode from a provided choice set. The stated choice set was pivoted around the modes and values of the independent variables. In the last part, demographic information such as gender, age, household income, occupation, education, and the number of people in the household was obtained. The framework is shown in Figure 3, and the interface of the existing carpooling service is shown in Figure 4.
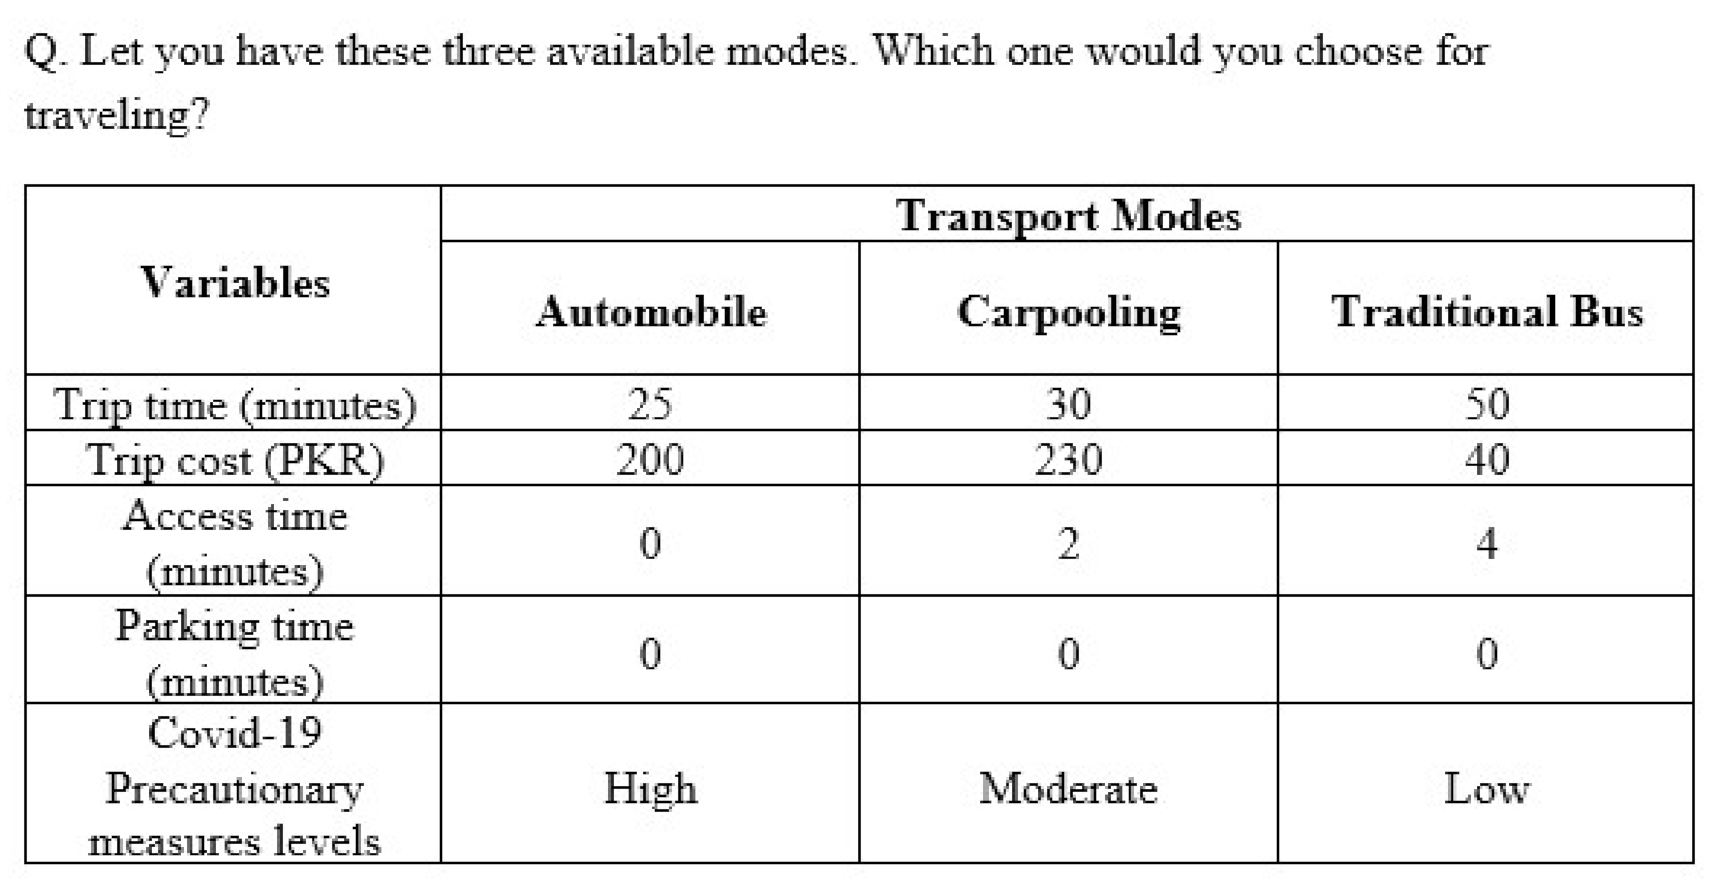
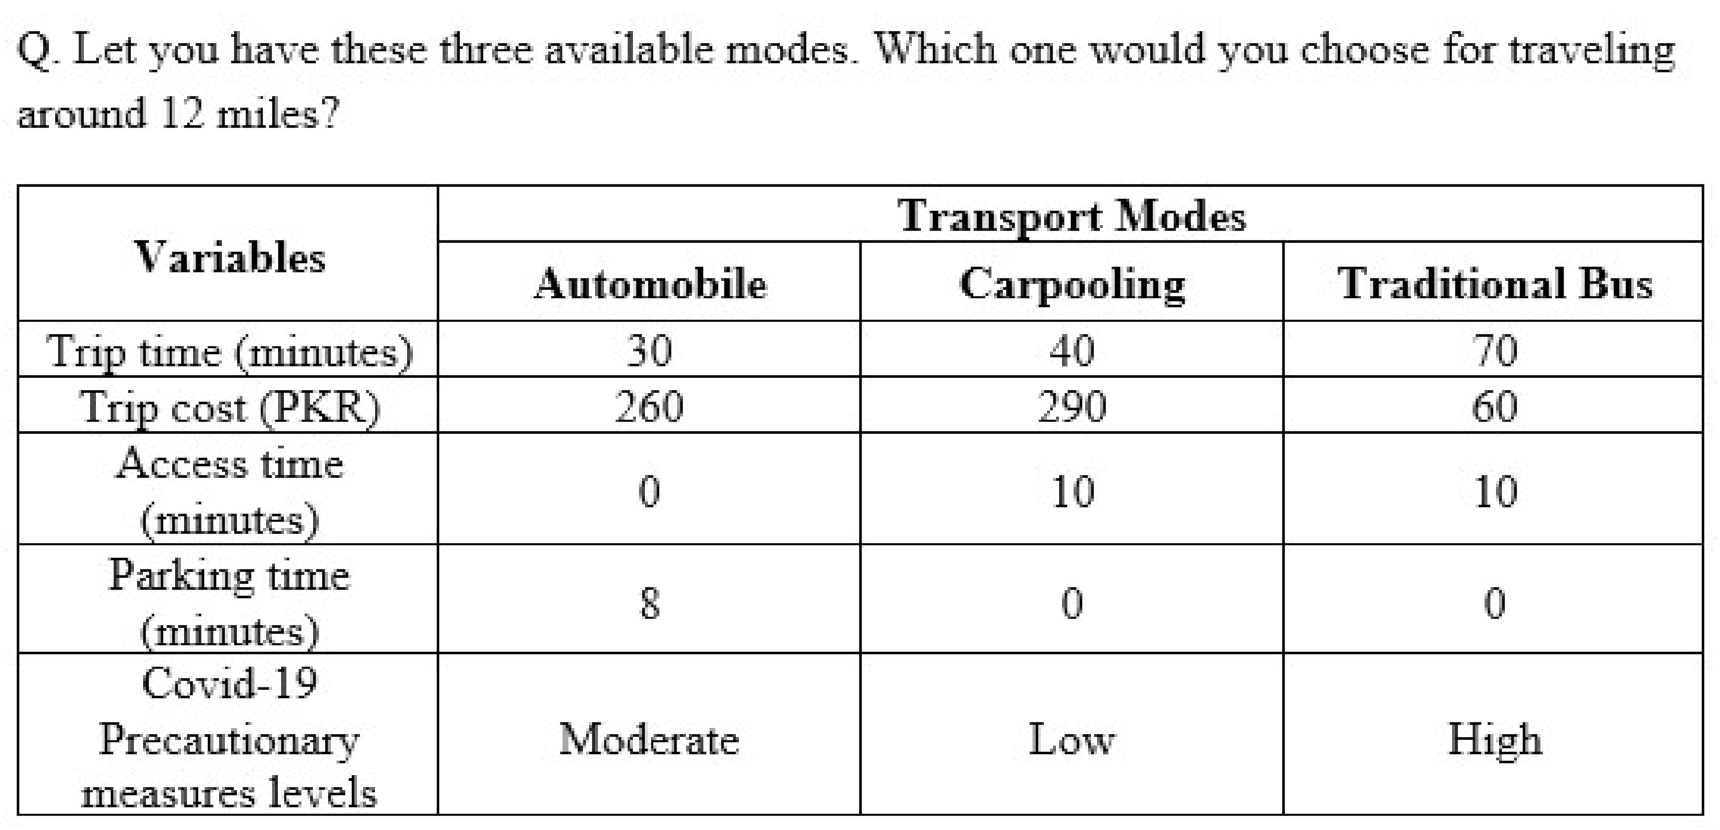
The stated choice experiment is based on choice experiments that incorporate modes of transport, variables, and levels. This study took into account automobiles, carpooling, and traditional buses. Trip time, trip cost, access time, parking time, and COVID-19 precautionary measures levels were all considered. Three levels were assumed for each variable. The cost of a car ride was PKR 230, and the values were pivoted for participants for different selections. The trip time had different values for various scenarios involving an automobile. A parking time of 0, 4 or 8 min was assumed for an automobile. According to the current Careem service plan, the cost of a carpooling trip was around PKR 260, and trip times had different values for various scenarios. Similarly, bus trip costs and trip times were taken from the transport companies. Access times for traditional bus travel and carpooling were 4, 8, or 12 and 2, 6, or 10 min, respectively. A systematic technique was used to create the stated choice experiment [30,31]. The latter was used to limit the number of options that each respondent was presented. To decrease the number of options, fractional factorial design was used as a subset of the complete factorial design. The setting of the stated choice experiment was made for the given three modes of transport and 12 factors. This is critical because combining the defined attributes would result in an enormous number of possible scenarios to evaluate. To assure the equal frequency of the variables and their levels (i.e., orthogonality), a fractional factorial design was used. All levels of each characteristic are accounted for in the design matrix (i.e., balance), while substantially lowering the number of possible choices shown to the participants. The possible choice sets for the 3 modes of transport and 12 factors were made into 27 choice sets using fractional factorial design. The 27 choices sets were divided into three groups. Each participant confronted 9 choice sets of choice experiments. Maintaining orthogonality and ensuring that participants were presented with the whole range of each attribute’s values was ensured by carefully grouping the scenarios into small subsets (i.e., blocks) [10].
To keep the participants and the preceding ideas in mind, each participant was presented with nine scenarios. This means that each participant was given nine distinct tasks from which to choose. Figure 5 and Figure 6 illustrate selection scenarios. The data were gathered from a variety of web sources (Facebook, WhatsApp, Instagram). The study focused on Karachi, Pakistan. The information was gathered with the assistance of friends and colleagues. After removing the invalid responses, the final analysis included just 318 usable responses. There were a total of 2862 selections made.
3.2. The Data
The survey took place from January 2021 to 15 March 2021. The profiles of the participants are summarized in Table 1. Male participants composed 69.5% of the total, while female participants composed 30.50%. Around 41% of participants were between the ages of 18 and 35, while around 46% were between the ages of 36 and 50. The remaining 15% of the sample were older than 50 years. The majority of participants, 39.62%, had a bachelor’s degree, while 26.42% had a master’s degree or higher. Intermediate and high school students constituted 21.70% and 12.26% of the total, respectively. The participants’ household income levels were: 19.8% earned less than PKR 20,000, 45.60% earned between PKR 21,000 and PKR 50,000, 23.58% earned between PKR 51,000 and PKR 80,000, and the remaining 11.64% earned more than PKR 80,000. In terms of occupation, private and government employees accounted for half of the sample, while students contributed 35.22%, and the rest were jobless and businesspeople. It was observed that the majority of the participants were students, accounting for 35.22% of the sample. The proportion of those with a driver’s license was 56.62% and those without a driver’s license made up 43.08%. Those who had an automobile or motorcycle accounted for 62.61%, while those who did not have them accounted for 37.39%.
3.3. Analysis Methods
Kenneth Train’s book Discrete Choice Methods with Simulation is the primary source for this description of the multinomial logit regression model and mixed logit regression model [31,32]. It is kept brief since more detailed explanations can be obtained from a variety of different sources. Discrete choice methods are based on microeconomic theory and involve a decision-maker n selecting an alternative i to a choice t that provides greater satisfaction. The decision-makers understand the utility of each mode where authors can only observe the choice made by and some of the characteristics of the decision-makers. is the total utility of the decision-maker, which is shown in Equation (1). The researcher can estimate the observed part of the utility.
Here is the observed utility. is the coefficient of observed parameters, and indicates choice variables and respondent characteristics. The element is the stochastic error, which is an assumed generalized extreme value distribution. In a simple logit regression model, the probability of a respondent choosing a choice set j is shown in Equations (2) and (3).
where is the probability that decision-maker n chooses alternative i, and J is the total set of alternatives. Pr shows the probability. is the observable part of the utility and is the random error term.
The mixed logit regression model captures the heterogeneity among the respondents over modes of transport. In the simple logit regression model specification, all respondents are supposed to react identically to marginal changes in the choice attributes. The mixed logit regression model captures the heterogeneity among the respondents over modes of transport. In the simple logit regression model specification, all respondents are supposed to react identically to marginal changes in the choice attributes. To account for preference heterogeneity, we used a mixed logit regression model with random, which defines the choice probability across a sequence of T choices, as shown in Equation (4). The random parameter
in the equation depicts that it varies over respondents, with the density described by
and is not fixed [33]. The estimation of this model involved the simulation of log-likelihood. The probability of a random parameter for mode i is shown in Equation (4). Python, an open-source statistical software, was used for data analysis [30].
3.4. Model Specification
A multinomial logit regression model was estimated in the first step of the analysis using trip time, parking time, access time, and trip cost characteristics. The independent variables that were found to be significant were included. The final specification of the model includes the following independent variables.
= Constant of modes
= Gender (0 = Female, 1 = Male)
= Occupation (0 = Jobless and student, 1 = Private, government employees and businessman)
= Education (0 = intermediate and high school, 1 = Bachelor and master degree and above)
= Driver license (0 = Don’t have, 1 = Have)
= Age (0 = 18–35, 1 = 36–50 plus)
= Number of persons in Households (0 = 1–2, 1 = 3–4 plus)
= Marital status (0 = Single, 1 = Married)
= Travel distance (0 = less than 7 miles, 1 = greater than 7 miles)
= COVID-19 Precautionary measures levels (1 = Low, 2 = Moderate, 3 = High)
= Trip time (minutes)
= Trip cost (Pakistan rupees)
= Parking time (minutes)
= Access time (minutes)
4. Analysis and Discussion
4.1. Traveler Perceptions and Usage of Carpooling in Karachi
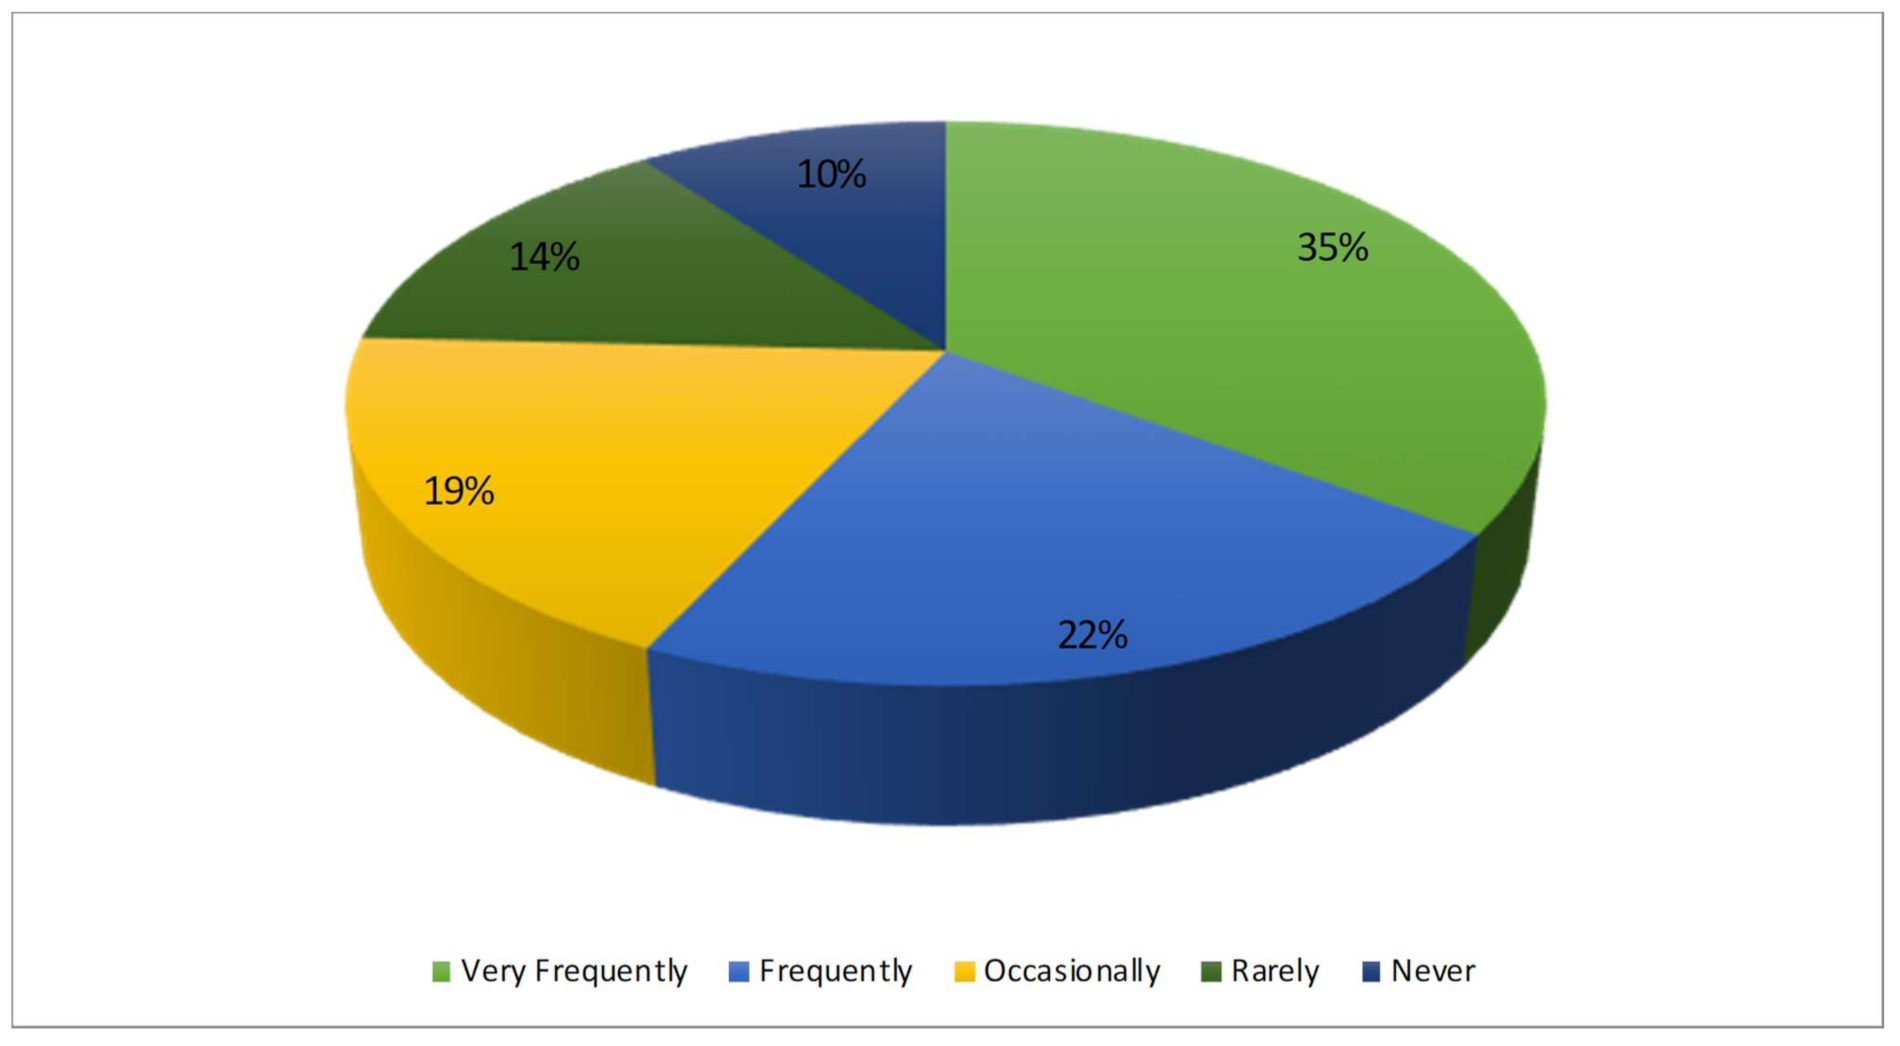
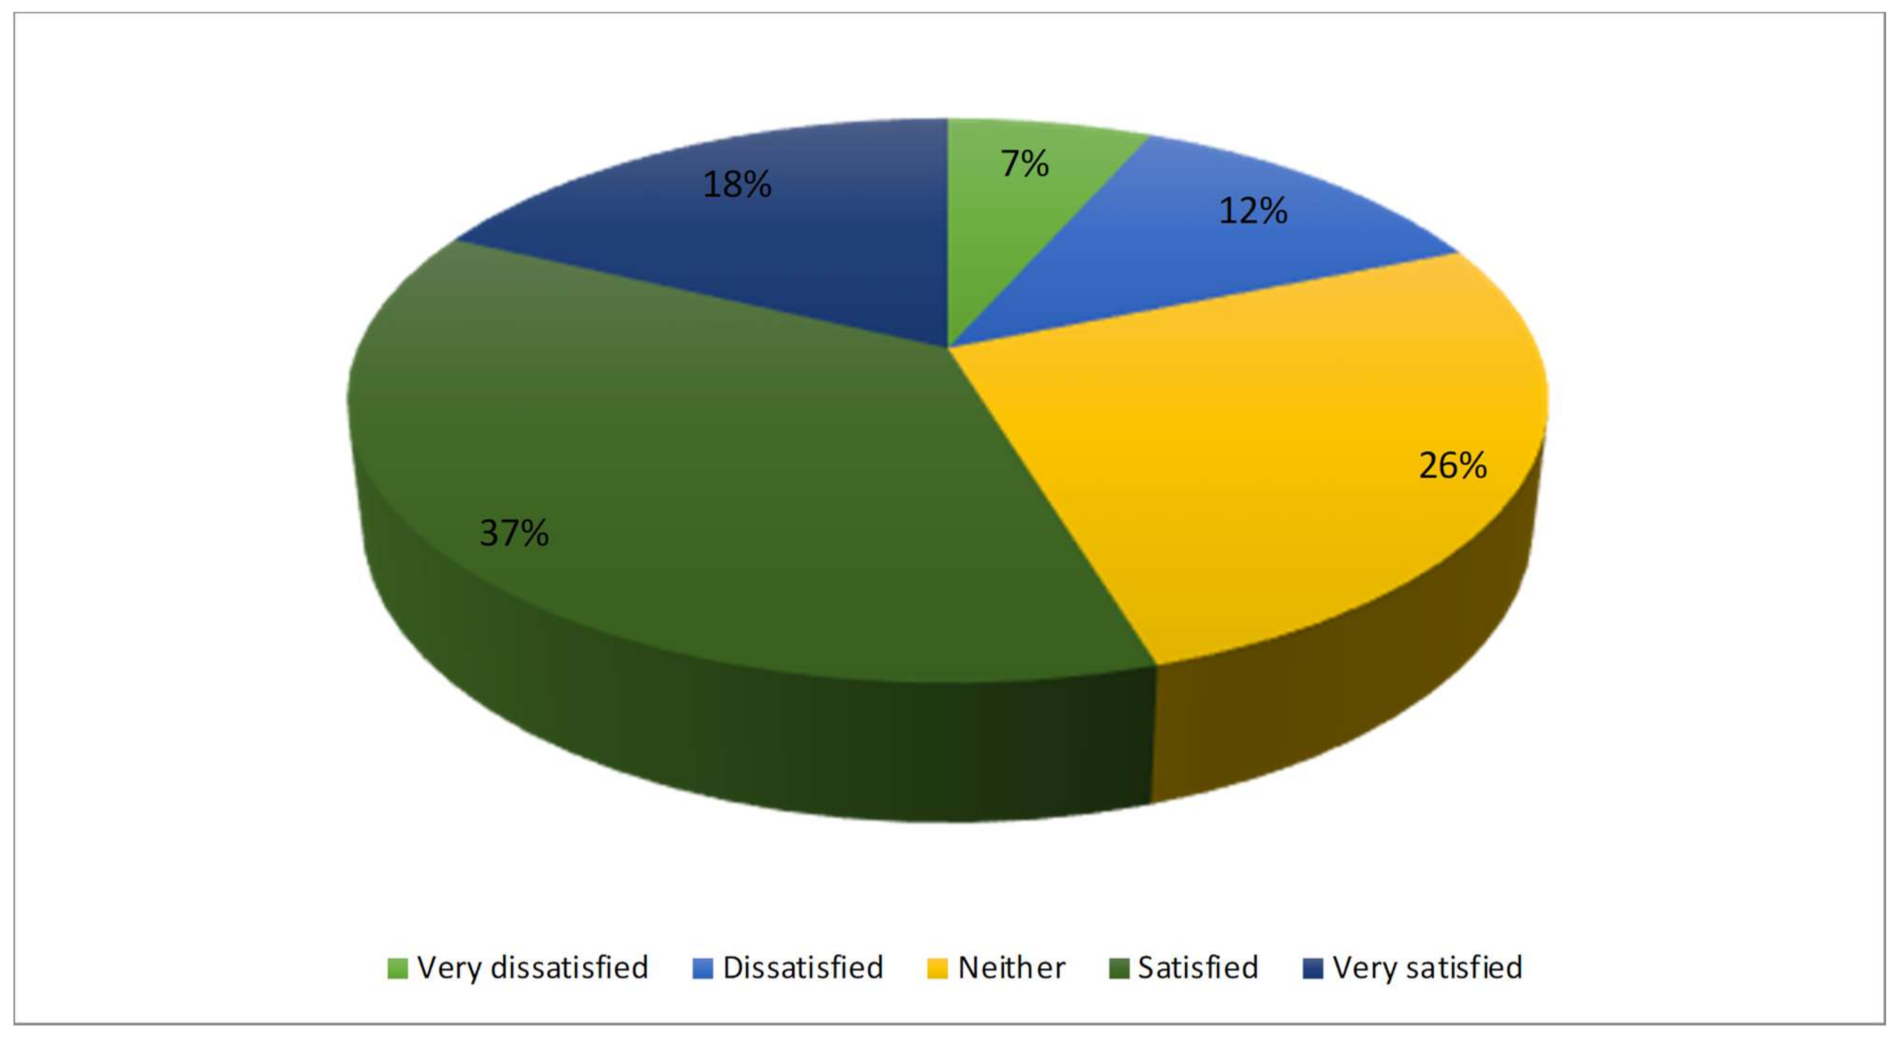
The first and second parts of the questionnaire, as mentioned in Section 3.1, inquired about people’s perceptions, usage, and satisfaction with existing carpooling services in Karachi, Pakistan. Carpooling services such as Careem or Uber were used frequently by 57% of participants, 33% only occasionally or rarely, and the remaining 10% did not use this system, as shown in Figure 7. To better understand the performance of the carpooling system, participants were asked how likely they were to be satisfied with the current service. Figure 8 demonstrates that 55% of the participants were extremely satisfied with the current services, whereas 25% were not. According to a previous study, Danish drivers and commuters seem to be divided on the issue. Lack of availability and difficulties locating rides, as well as perceptions of ridesharing as unsafe or insecure, and expectations of social discomfort, were among the negative perceptions reported by respondents [34]. This might be one of the reasons for the limited number of carpooling vehicles in Pakistan during the COVID-19 pandemic recurrent lockdowns. Furthermore, some travelers may have experienced inconvenience as a result of a driver’s harsh behavior and failure to meet the passengers on time.
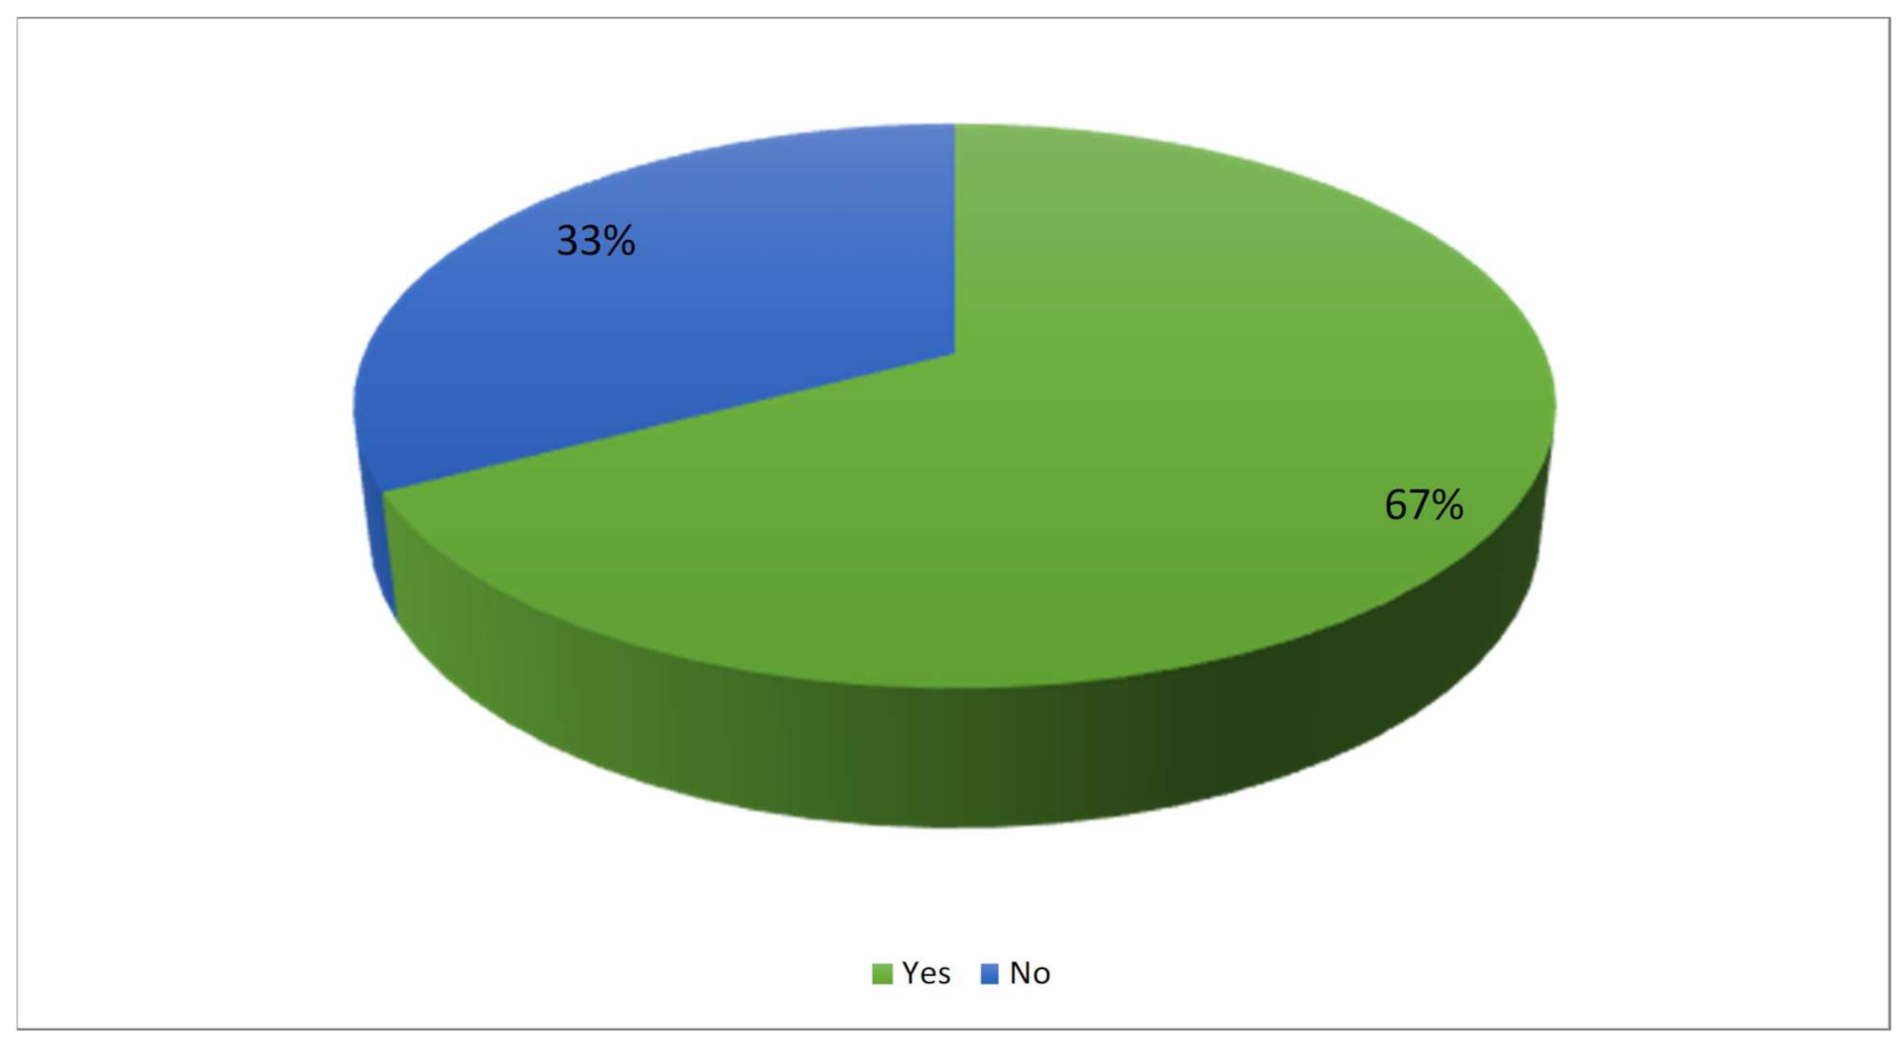
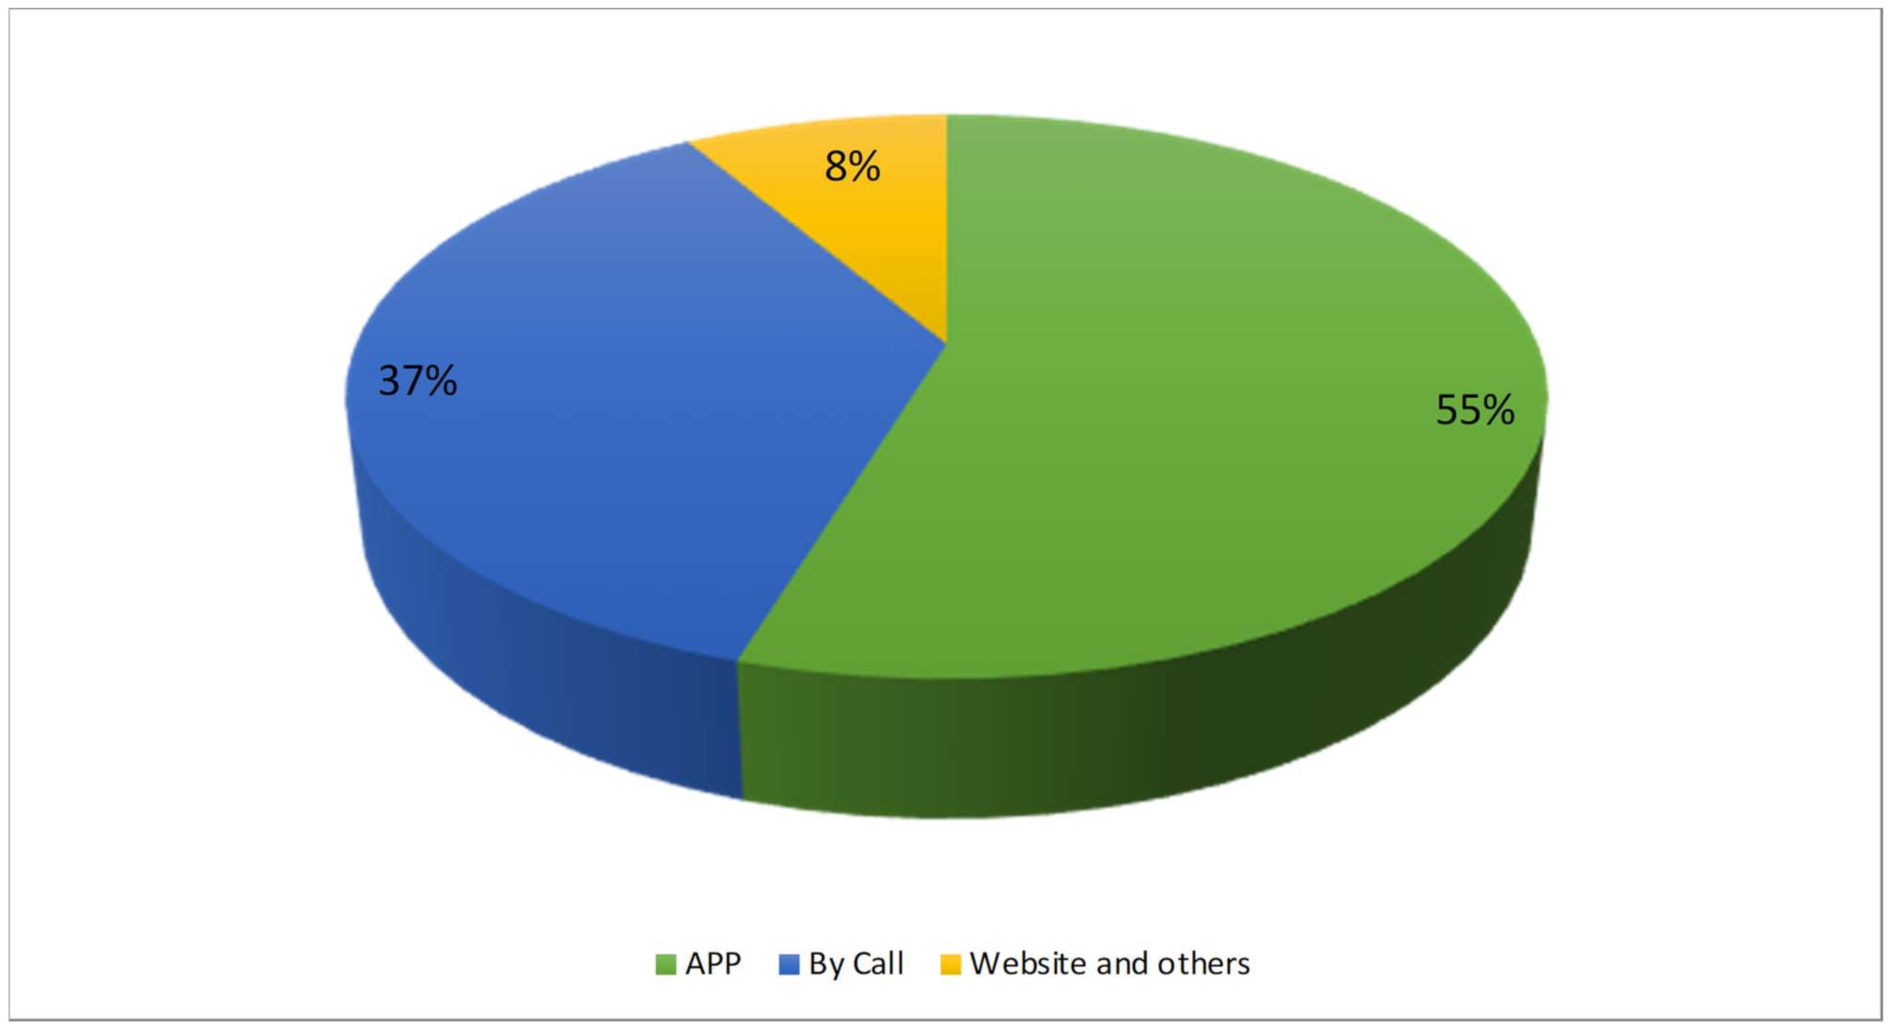
Figure 9 shows the percentage of participants who had installed carpooling applications, with 67% having done so and 33% not having done so. To empower sharing, mobility apps have been adopted in Europe and the USA, such as MyTaxi, Flywheel, etc [7]. Participants were asked how they made reservations for carpooling services. In Figure 10, the majority of the participants (55%) had used a carpooling app, 37% had used a phone call, and 8% had used websites and other methods. Table 2 shows how travelers used different modes of transportation before and during the COVID-19. During the COVID-19 pandemic, people’s preferences for modes of transportation did not change. Another multi-country study suggests that carpooling appears to be slightly decreasing in the COVID-19 pandemic [9]. During the COVID-19 pandemic, only the rate of private transportation and motorcycles increased. This implies that people are more responsive to alternative ways of transportation. The COVID-19 preventive measures include social distancing, sensitization, and masking. To avoid contracting the sickness, the individuals opted for motorbikes and private transportation. The previous study showed that the COVID-19-related lockdown has had a detrimental influence on the transportation and accommodation sectors [35]. A study suggests that during the COVID-19 pandemic, respondents did not show significant differences in preferences for car sanitation by ride-sharing service operators or self-service [36]. Finally, the participants’ opinions about carpooling were asked. The answers about participants’ environmental friendliness, car ownership, and traffic congestion are presented in Table 3. The majority of the studies reported that carpooling lowers traffic congestion, reduces auto ownership, and is an effective traffic congestion solution [7,12,13,17].
4.2. Estimated Model Coefficients
The results of the multinomial logit regression model and a mixed logit regression model are summarized in Table 4 and Table 5, respectively. The mixed logit regression model is regarded as a reliable model for quantifying travel mode or route choice [33]. It has been widely employed in transportation, tourism, and economic studies. The mixed logit regression model captures travelers’ taste variability. The modes of transportation, which include automobiles, carpooling, and traditional buses, are the dependent variables in this analysis. Due to certain random effects, people with the same socioeconomic and demographic characteristics may respond to the survey differently. Because the ratio of mixed logit probabilities depends on all the data, including characteristics of alternatives, the mixed logit regression model weakens the simple logit regression model’s independent and identically distributed (IID) assumption [32]. The null hypothesis is rejected based on the results of these analyses’ level of significance (p-value or significance level < 0.10), as some of the variables influence the mode of transportation adopted. Trip time, trip cost, access time, and COVID-19 precautionary measures were revealed to be negatively significant to the study’s expectations. Overall, the results show that trip cost, access time, and trip time factors strongly influence mode selection, with both having an expected negative effect. Furthermore, the results of trip cost, trip time, and safety were consistent with the previous study [37].
The COVID-19 precautionary measures levels were highly significant, which implies that the travelers had a high concern about safety before using any transport modes. This result is interesting and consistent with a previous study carried out in Spain, which stated that around 64.3% of the respondents said they would pay extra for public transportation if operators implemented sanitizing measures [38]. The parking time was found to be insignificant. The significance of access time shows that travelers are concerned about getting to their destination on time. This finding is obvious and anticipated because travelers tend to utilize carpooling services to get to work or school on time. Second, Karachi is Pakistan’s industrial center, and because of poor public transportation, residents are more inclined to use carpooling services, which have emerged as an alternative flexible and on-demand mode of public transportation [6]. The utility of various modes, including automobiles, carpooling, and traditional buses, is given in Equations (5)–(7) below based on significant results of mode-related variables and independent variables.
In Table 4 and Table 5, the mixed logit regression model values of initial log-likelihood (−3144.228), and final log-likelihood (−2978.28) are greater than the values of the multinomial logit regression model, initial log-likelihood (−3144.228), and final log-likelihood (−2982.164). These results show that the model fitness of the mixed logit regression model is better than that of the multinomial logit regression model. The likelihood ratio index, as shown in Equation (8), is frequently used in statistics with discrete choice models to assess how well the models fit the data.
In terms of the effect of socioeconomic/demographic variables, we included in the final model only those variables that were determined to have a statistically significant effect. Gender had a positive and significant effect on automobile carpooling, implying that men were more likely than women to use carpooling in Karachi, as shown in Table 4 and Table 5. This finding is opposite with prior research, which found that men are less likely than women to use carpooling services [39]. A study conducted in Turkey shows that women and regular campus travelers are more likely to use carpooling [40]. The occupation variable is a positive significant factor for carpooling in Karachi, which indicates that employed people were more likely to use carpooling for their travel purposes. This could be explained by the fact that private and government employees in Pakistan earn low wages and cannot afford to buy new cars. As a result, they are willing to use carpooling. Second, in Pakistan, employed people frequently use a pooled commuting system to save money on travel expenses. In Pakistan, the majority of people are used to traveling and shopping with family and friends and have a combined family system. This outcome is consistent with previous research [41].
For carpooling and automobiles, the age variable was found to be positively significant. The findings reveal that travelers over the age of 35 are more likely to prefer carpooling in Karachi, as shown in Table 4 and Table 5. Furthermore, the number of people in the household was determined to be significant, suggesting that more than two members of the family were willing to employ carpooling and automobiles. This is an intriguing finding because, due to culture and social cohesion, people in Pakistan prefer to travel in groups rather than alone. The majority of people travel in groups of family and friends. However, it was observed that the travel distance variable was negatively significant for carpooling. This shows that travelers within a 7-mile radius of Karachi were more likely to utilize carpooling. This is both intuitive and the driving force behind carpooling services. Typically, carpooling services are employed for short periods and within a city context. The marital status variable was shown to be negatively significant, implying that unmarried travelers are more likely to use carpooling and private transportation in Karachi. In Portugal, a similar study showed that married status was regarded as significant for carpooling [10].
Having a driver’s license was found to be positively significant for automobile use. It is self-evident that a driver’s license is needed to drive an automobile. Independent variables such as education were found to be negatively significant for automobile use in Karachi. The variables such as household incomes and ownership of an automobile or a motorcycle did not affect transportation mode choice and were thus removed from the final analysis.
5. Conclusions
In this paper, we provide the results of a stated choice experiment that investigated travelers’ behaviors, usage, and degree of satisfaction with carpooling in a metropolitan city of a developing country during the COVID-19 pandemic. This study contributes some useful findings from a metropolitan city in a developing country. The economic variables associated with modes of transport economic, such as trip time and trip cost, were found to be significant for carpooling and automobile use. This study demonstrates that families with more than two members and a travel distance of less than seven miles are more likely to use carpooling in a developing country. This finding is noteworthy because individuals in developing countries prefer to travel in groups rather than alone due to strong cultural norms. The sociodemographic variables such as gender, age, education, marital status, and driving license were determined to be statistically significant. The COVID-19 precautionary measures levels variable was also found to be significant. This suggests that travelers were more likely to use public transportation that adhered to COVID-19 standards and guidelines, such as sanitization, masking, and social distances. It is noteworthy that the current coronavirus disease pandemic (COVID-19) has influenced public transportation and people are shifting to walking and other motorized modes of transport. Furthermore, travelers indicated that they believed carpooling was safer than other modes of transportation in developing countries.
The sociodemographic variables such as the number of persons in a household and occupation were found to be statistically significant. This study’s outcomes suggest the need to review the current company culture for working individuals who frequently commute from and to their residences in megacities of developing countries. Carpooling services could be expanded to include a vanpooling concept to help developing countries to reduce transportation expenses and improve their urban environments. To increase the viability and popularity of carpooling services in developing countries, the payment method must be updated. Payments should be made via scanning apps and should be integrated with existing carpooling apps instead of using cash. Carpooling companies have been using independent operators and integrating them into a centralized software and technology platform, allowing for improved planning and coordination.
Future research should attempt to incorporate other measures, such as focus group opinions, to enable more in-depth analysis. Because this study used a quantitative method that is inflexible to individuals’ subjective perceptions of the effect of the COVID-19 pandemic, it is recommended that future research incorporate qualitative assessments via in-depth interviews. However, the COVID-19 pandemic continues, and post-COVID-19 research should be conducted in order to establish a complete strategy. Existing carpooling operators and transportation network firms should investigate latent traveler characteristics and change policies in order to maintain viability and a widespread market. Since urban areas in developing countries are facing environmental and safety challenges, it is necessary to examine the influence of carpooling on road safety and air pollution. Additionally, a more comprehensive examination of traffic performance criteria should be explored. The study’s findings are also applicable to other megacities of developing countries with comparable demographic and socioeconomic characteristics.
Author Contributions
Conceptualization, A.X. and Z.L.; methodology, A.X.; software, A.X. and Z.L.; validation, A.X., J.C. and Z.L.; formal analysis, A.X.; investigation, A.X. and J.C.; resources, A.X. and Z.L.; data curation, A.X. and J.C.; writing—original draft preparation, A.X. and Z.L.; writing—review and editing, A.X., J.C. and Z.L.; visualization, J.C.; supervision, A.X.; project administration, A.X.; funding acquisition, A.X. All authors have read and agreed to the published version of the manuscript.
Funding
This research was funded by National Natural Science Foundation of China (72174045); Natural Science Foundation of Heilongjiang Province (LH2021G013); Social science Foundation of Heilongjiang Province (17GLE293); Training Program of Economics and management school of HRBUST (KY202032D).
Institutional Review Board Statement
Not Applicable.
Informed Consent Statement
Not Applicable.
Data Availability Statement
Not Applicable.
Acknowledgments
This work was sponsored in part by National Natural Science Foundation of China (72174045); Natural Science Foundation of Heilongjiang Province (LH2021G013); Social science Foundation of Heilongjiang Province (17GLE293); Training Program of Economics and management school of HRBUST (KY202032D).
Conflicts of Interest
The authors declare that they have no conflict of interest.
References
- Mustapa, S.I.; Bekhet, H.A. Analysis of CO2 emissions reduction in the Malaysian transportation sector: An optimisation approach. Energy Policy 2016, 89, 171–183. [Google Scholar] [CrossRef]
- Ahmed, Q.I.; Lu, H.; Ye, S. Urban transportation and equity: A case study of Beijing and Karachi. Transp. Res. Part A Policy Pract. 2008, 42, 125–139. [Google Scholar] [CrossRef]
- Ali, M.S.; Adnan, M.; Noman, S.M.; Baqueri, S.F.A. Estimation of traffic congestion cost-a case study of a major arterial in Karachi. Procedia Eng. 2014, 77, 37–44. [Google Scholar] [CrossRef] [Green Version]
- Hoor-Ul-Ain, S. An empirical review of Karachi’s transportation predicaments: A paradox of public policy ranging from personal attitudes to public opinion in the megacity. J. Transp. Health 2019, 12, 164–182. [Google Scholar] [CrossRef]
- Aslam, W.; Farhat, K.; Ejaz, L.; Arif, I. Adoption of Android smartphones and intention to pay for mobile internet: An empirical analysis of consumers in Pakistan. Int. J. Bus. Innov. Res. 2020, 21, 428–446. [Google Scholar] [CrossRef]
- Iqbal, S.; Woodcock, A.; Osmond, J. The effects of gender transport poverty in Karachi. J. Transp. Geogr. 2020, 84, 102677. [Google Scholar] [CrossRef]
- Machado, C.A.S.; Hue, N.P.M.S.; Berssaneti, F.T.; Quintanilha, J.A. An overview of shared mobility. Sustainability 2018, 10, 4342. [Google Scholar] [CrossRef] [Green Version]
- Javaid, A.; Javed, A.; Kohda, Y. Exploring the role of boundary spanning towards service ecosystem expansion: A case of Careem in Pakistan. Sustainability 2019, 11, 3996. [Google Scholar] [CrossRef] [Green Version]
- Molina, J.A.; Ignacio Giménez-Nadal, J.; Velilla, J. Sustainable commuting: Results from a social approach and international evidence on carpooling. Sustainability 2020, 12, 9587. [Google Scholar] [CrossRef]
- Correia, G.; Viegas, J.M. Carpooling and carpool clubs: Clarifying concepts and assessing value enhancement possibilities through a Stated Preference web survey in Lisbon, Portugal. Transp. Res. Part A Policy Pract. 2011, 45, 81–90. [Google Scholar] [CrossRef]
- Dewan, K.K.; Ahmad, I. Carpooling: A step to reduce congestion (A case study of Delhi). In Proceedings of the International MultiConference of Engineers and Computer Scientists 2006, IMECS 2006, Hong Kong, China, 20–22 June 2006; pp. 408–413. [Google Scholar]
- Cohen, B.; Kietzmann, J. Ride On! Mobility Business Models for the Sharing Economy. Organ. Environ. 2014, 27, 279–296. [Google Scholar] [CrossRef]
- Delhomme, P.; Gheorghiu, A. Comparing French carpoolers and non-carpoolers: Which factors contribute the most to carpooling? Transp. Res. Part D Transp. Environ. 2016, 42, 1–15. [Google Scholar] [CrossRef]
- Malodia, S.; Singla, H. A study of carpooling behaviour using a stated preference web survey in selected cities of India. Transp. Plann. Technol. 2016, 39, 538–550. [Google Scholar] [CrossRef]
- Kim, H.; Choi, K.H.; Kim, K.J.; Park, E. From owning to sharing: Understanding the emergence of social sharing services. Program 2017, 51, 102–115. [Google Scholar] [CrossRef]
- Keyvanfar, A.; Shafaghat, A.; Muhammad, N.Z.; Ferwati, M.S. Driving behaviour and sustainable mobility-policies and approaches revisited. Sustainability 2018, 10, 1152. [Google Scholar] [CrossRef] [Green Version]
- Shaheen, S.A.; Chan, N.D.; Gaynor, T. Casual carpooling in the San Francisco Bay Area: Understanding user characteristics, behaviors, and motivations. Transp. Policy 2016, 51, 165–173. [Google Scholar] [CrossRef] [Green Version]
- Menon, N.; Keita, Y.; Bertini, R.L. Impact of COVID-19 on Travel Behavior and Shared Mobility Systems; USF Center for Urban Transportation Research: Tampa, FL, USA, 2020. [Google Scholar]
- Abdullah, M.; Ali, N.; Hussain, S.A.; Aslam, A.B.; Javid, M.A. Measuring changes in travel behavior pattern due to COVID-19 in a developing country: A case study of Pakistan. Transp. Policy 2021, 108, 21–33. [Google Scholar] [CrossRef]
- OurWorldinData. Pakistan: Coronavirus Pandemic. 2020. Available online: https://ourworldindata.org/coronavirus/country/pakistan?country=~PAK. (accessed on 12 April 2020).
- Carteni, A.; Di Francesco, L.; Martino, M. How mobility habits influenced the spread of the COVID-19 pandemic: Results from the Italian case study. Sci. Total Environ. 2020, 741, 140489. [Google Scholar] [CrossRef]
- Pojani, D.; Stead, D. The Urban Transport Crisis in Emerging Economies: An Introduction; Urban Book Series; Springer International Publishing: Berlin/Heidelberg, Germany, 2017; pp. 1–10. [Google Scholar] [CrossRef]
- Brownstone, D.; Golob, T.F. The effectiveness of ridesharing incentives. Discrete-choice models of commuting in Southern California. Reg. Sci. Urban Econ. 1992, 22, 5–24. [Google Scholar] [CrossRef]
- Ma, R.; Zhang, H.M. The morning commute problem with ridesharing and dynamic parking charges. Transp. Res. Part B Methodol. 2017, 106, 345–374. [Google Scholar] [CrossRef]
- Carroll, P.; Caulfield, B.; Ahern, A. Examining the potential for car-shedding in the Greater Dublin Area. Transp. Res. Part A Policy Pract. 2017, 106, 440–452. [Google Scholar] [CrossRef]
- Devarasetty, P.C.; Burris, M.; Arthur Jr, W.; McDonald, J.; Muñoz, G.J. Can psychological variables help predict the use of priced managed lanes? Transp. Res. Part F Traffic Psychol. Behav. 2014, 22, 25–38. [Google Scholar] [CrossRef]
- Zhang, Y.; Zhang, Y.; Liu, Z. The role of different transportation in the spreading of new pandemic influenza in mainland China. In Proceedings of the 2011 19th International Conference on Geoinformatics, Shanghai, China, 24–26 June 2011. [Google Scholar]
- Haghani, M.; Bliemer, M.C.J.; Goerlandt, F.; Li, J. The scientific literature on Coronaviruses, COVID-19 and its associated safety-related research dimensions: A scientometric analysis and scoping review. Saf. Sci. 2020, 129. [Google Scholar] [CrossRef] [PubMed]
- Abdel-Aty, M.A. Using ordered probit modeling to study the effect of ATIS on transit ridership. Transp. Res. Part C Emerg. Technol. 2001, 9, 265–277. [Google Scholar] [CrossRef]
- Zhou, F.; Zheng, Z.; Whitehead, J.; Washington, S.; Perrons, R.K.; Page, L. Preference heterogeneity in mode choice for car-sharing and shared automated vehicles. Transp. Res. Part A Policy Pract. 2020, 132, 633–650. [Google Scholar] [CrossRef]
- Cartenì, A. The acceptability value of autonomous vehicles: A quantitative analysis of the willingness to pay for shared autonomous vehicles (SAVs) mobility services. Transp. Res. Interdiscip. Perspect. 2020, 8. [Google Scholar] [CrossRef]
- Train, K.E. Discrete Choice Methods with Simulation, 2nd ed.; Cambridge University Press: Cambridge, UK, 2009; Volume 9780521766555, pp. 1–388. [Google Scholar]
- Andani, I.G.A.; La Paix Puello, L.; Geurs, K. Modelling effects of changes in travel time and costs of toll road usage on choices for residential location, route and travel mode across population segments in the Jakarta-Bandung region, Indonesia. Transp. Res. Part A Policy Pract. 2021, 145, 81–102. [Google Scholar] [CrossRef]
- Nielsen, J.R.; Hovmøller, H.; Blyth, P.L.; Sovacool, B.K. Of “white crows” and “cash savers”: A qualitative study of travel behavior and perceptions of ridesharing in Denmark. Transp. Res. Part A Policy Pract. 2015, 78, 113–123. [Google Scholar] [CrossRef]
- Batool, M.; Ghulam, H.; Hayat, M.A.; Naeem, M.Z.; Ejaz, A.; Imran, Z.A.; Spulbar, C.; Birau, R.; Gorun, T.H. How COVID-19 has shaken the sharing economy? An analysis using Google trends data. Econ. Res. Ekon. Istraz. 2020. [Google Scholar] [CrossRef]
- Curtale, R.; Liao, F.; van der Waerden, P. Understanding travel preferences for user-based relocation strategies of one-way electric car-sharing services. Transp. Res. Part C Emerg. Technol. 2021, 127. [Google Scholar] [CrossRef]
- Huang, K.; Liu, Z.; Kim, I.; Zhang, Y.; Zhu, T. Analysis of the Influencing Factors of Carpooling Schemes. IEEE Intell. Transp. Syst. Mag. 2019, 11, 200–208. [Google Scholar] [CrossRef]
- Awad-Núñez, S.; Julio, R.; Gomez, J.; Moya-Gómez, B.; González, J.S. Post-COVID-19 travel behaviour patterns: Impact on the willingness to pay of users of public transport and shared mobility services in Spain. Eur. Transp. Res. Rev. 2021, 13. [Google Scholar] [CrossRef]
- Olsson, L.E.; Maier, R.; Friman, M. Why do they ride with others? Meta-analysis of factors influencing travelers to carpool. Sustainability 2019, 11, 2414. [Google Scholar] [CrossRef] [Green Version]
- Tezcan, H. Potential of carpooling among unfamiliar users: Case of undergraduate students at Istanbul technical university. J. Urban Plan. Dev. 2016, 142. [Google Scholar] [CrossRef]
- Neoh, J.G.; Chipulu, M.; Marshall, A. What encourages people to carpool? An evaluation of factors with meta-analysis. Transportation 2017, 44, 423–447. [Google Scholar] [CrossRef]
Figure 1.
Timeline of the COVID-19 pandemic.

Figure 2.
Timeline of COVID-19 pandemic, number of cases and deaths in Pakistan.

Figure 3.
Stated choice experiment layout.

Figure 4.
Screenshots of booking carpooling service (Careem) in Pakistan.

Figure 5.
SP choice example (values pivoted around modes and their variables).

Figure 6.
SP choice example (values pivoted around modes and their variables).

Figure 7.
Usage of existing carpooling system.

Figure 8.
Degree of satisfaction with existing carpooling system.

Figure 9.
Installation of carpooling apps.

Figure 10.
How respondents booked carpooling services.


Table 1.
Socioeconomic demographic profiles of the sample.
| Demographics | Percentages |
|---|---|
| Gender | |
| Male | 69.50% |
| Female | 30.50% |
| Household income | |
| <PKR 20,000 | 19.18% |
| PKR 21,000–50,000 | 45.60% |
| PKR 51,000–80,000 | 23.58% |
| >PKR 80,000 | 11.64% |
| Occupation | |
| Students | 35.22% |
| Private employee | 29.56% |
| Govt. employee | 19.50% |
| Jobless | 8.81% |
| Businessperson | 6.92% |
| Driver’s license | |
| Have | 56.92% |
| Do not have | 43.08% |
| Marital status | |
| Single | 32.39% |
| Married | 67.61% |
| Age | |
| 18~25 years | 21.07% |
| 26~35 years | 25.16% |
| 36~50 years | 39.62% |
| >50 years | 14.15% |
| Education | |
| Bachelor degree | 39.62% |
| Master and above | 26.42% |
| High school | 12.26% |
| Intermediate | 21.70% |
| Number of household persons | |
| 1 | 18.24% |
| 2 | 33.33% |
| 3 | 19.81% |
| 4+ | 28.62% |
| Possession of automobiles or motorcycles | |
| Have | 62.61% |
| Do not have | 37.39% |
Table 2.
Usage of transportation modes before and during COVID-19 pandemic.
| S.no | Transportation Modes | Before COVID-19 Pandemic, n (%) | During COVID-19 Pandemic, n (%) |
|---|---|---|---|
| 1 | Walking | 20 (6.29) | 21 (6.60) |
| 2 | Motorcycles or rickshaw | 137 (43.08) | 98 (30.82) |
| 3 | Carpooling | 63 (19.81) | 62 (19.50) |
| 4 | Bus | 26 (8.18) | 33 (10.38) |
| 5 | Private car | 50 (15.72) | 78 (24.53) |
| 6 | Taxi | 22 (6.92) | 26 (8.18) |
Table 3.
Perceptions and thoughts of people about carpooling in Karachi, Pakistan.
| S.no | Questions | Strongly Disagree, n (%) | Disagree, n (%) | Unknown, n (%) | Agree, n (%) | Strongly Agree, n (%) |
|---|---|---|---|---|---|---|
| 1 | Carpooling is eco-friendly | 46 (14.47) | 49 (15.41) | 62 (19.5) | 96 (30.19) | 65 (20.44) |
| 2 | Carpooling reduces automobile ownership | 31 (9.75) | 128 (40.25) | 75 (23.58) | 68 (21.38) | 16 (5.03) |
| 3 | Carpooling reduces traffic congestion | 58 (18.24) | 66 (20.75) | 89 (27.99) | 73 (22.96) | 32 (10.06) |
Table 4.
Results of multinomial logit regression model.
| Parameters | Coefficients | Automobile | Carpooling | Traditional Bus | |||
|---|---|---|---|---|---|---|---|
| Estimated Value | t-Value | Estimated Value | t-Value | Estimated Value | t-Value | ||
| Constant | −0.384 | (−1.07) | 0.523 | (1.30) | _ | _ | |
| Gender | 1.85 | (3.45 ***) | 1.95 | (3.83 ***) | _ | _ | |
| Occupation | −0.0888 | (−0.85) | 0.304 | (2.99 ***) | _ | _ | |
| Education | −0.205 | (−1.83 *) | −0.155 | (−1.43) | _ | _ | |
| Driving license | 0.646 | (3.72 ***) | 0.218 | (1.36) | _ | _ | |
| Age | 0.366 | (3.57 ***) | 0.233 | (2.36 **) | _ | _ | |
| Number of person in household | 0.213 | (2.09 **) | 0.313 | (3.18 ***) | _ | _ | |
| Marital status | −1.37 | (−2.61 ***) | −1.57 | (−3.08 ***) | _ | _ | |
| Travel distance | −0.0645 | (−0.62) | −0.347 | (−3.41 ***) | _ | _ | |
| COVID-19 precautionary measures levels | 0.113 (3.52 ***) | ||||||
| Trip time | −0.0237 (−5.38 ***) | ||||||
| Trip cost | −0.00664 (−4.31 ***) | ||||||
| Parking time | −0.00755 | (−0.55) | _ | _ | |||
| Access time | _ | −0.0665 (−5.97 ***) | |||||
| Sample size | 2862 | ||||||
| Number of parameters | 27 | ||||||
| ‘Initial log-likelihood | −3144.228 | ||||||
| final log-likelihood | −2982.164 | ||||||
| McFadden value | 0.052 | ||||||
Significant codes *** p < 0.001, ** p < 0.05, * p < 0.10.
Table 5.
Results of mixed logit regression model.
| Parameters | Coefficients | Automobile | Carpooling | Traditional Bus | |||
|---|---|---|---|---|---|---|---|
| Estimated Value | t-Value | Estimated Value | t-Value | Estimated Value | t-Value | ||
| Constant | −0.576 | (−1.43) | 0.553 | (1.28) | _ | _ | |
| Gender | 2.12 | (3.36 ***) | 2.21 | (3.73 ***) | _ | _ | |
| Occupation | −0.0791 | (−0.64) | 0.322 | (2.77 ***) | _ | _ | |
| Education | −0.229 | (−1.72 *) | −0.175 | (−1.41) | _ | _ | |
| Driving license | 0.780 | (3.66 ***) | 0.309 | (1.65 *) | _ | _ | |
| Age | 0.449 | (3.51 ***) | 0.302 | (2.58 **) | _ | _ | |
| Number of persons in household | 0.281 | (2.25 **) | 0.373 | (3.21 ***) | _ | _ | |
| Marital status | −1.57 | (−2.53**) | −1.75 | (−2.99 ***) | _ | _ | |
| Travel distance | −0.113 | (−0.93 ***) | −0.366 | (−3.20 ***) | _ | _ | |
| COVID-19 precautionary measures levels | 0.106 (2.93 ***) | ||||||
| Trip time | −0.0385 (−4.81 ***) | ||||||
| Trip cost | −0.00775 (−4.66 ***) | ||||||
| Parking time | −0.0077 (−0.54) | _ | _ | ||||
| Access time | _ | −0.676 (−5.73 ***) | |||||
| Standard deviation of travel time | −0.0404 (−3.84 ***) | ||||||
| Sample size | 2862 | ||||||
| Number of parameters | 28 | ||||||
| Initial log-likelihood | −3144.228 | ||||||
| final log-likelihood | −2978.28 | ||||||
| McFadden value | 0.053 | ||||||
Significant codes *** p < 0.001, ** p < 0.05, * p < 0.10.
Publisher’s Note: MDPI stays neutral with regard to jurisdictional claims in published maps and institutional affiliations. |
© 2021 by the authors. Licensee MDPI, Basel, Switzerland. This article is an open access article distributed under the terms and conditions of the Creative Commons Attribution (CC BY) license (https://creativecommons.org/licenses/by/4.0/).
Share and Cite
MDPI and ACS Style
Xu, A.; Chen, J.; Liu, Z. Exploring the Effects of Carpooling on Travelers’ Behavior during the COVID-19 Pandemic: A Case Study of Metropolitan City. Sustainability 2021, 13, 11136. https://doi.org/10.3390/su132011136
AMA Style
Xu A, Chen J, Liu Z. Exploring the Effects of Carpooling on Travelers’ Behavior during the COVID-19 Pandemic: A Case Study of Metropolitan City. Sustainability. 2021; 13(20):11136. https://doi.org/10.3390/su132011136
Chicago/Turabian StyleXu, Anfeng, Jiming Chen, and Zihui Liu. 2021. "Exploring the Effects of Carpooling on Travelers’ Behavior during the COVID-19 Pandemic: A Case Study of Metropolitan City" Sustainability 13, no. 20: 11136. https://doi.org/10.3390/su132011136
Note that from the first issue of 2016, this journal uses article numbers instead of page numbers. See further details here.