

")


Coronavirus disease-2019: Changes in computed tomography radiation burden across Moscow medical facilities
- Authors: Druzhinina U.V.1,2, Ryzhov S.A.1,3, Vodovatov A.V.4,5, Soldatov I.V.6, Lantukh Z.A.1, Mukhortova A.N.6, Lubencova Y.N.6
-
Affiliations:
- Research and Practical Clinical Center for Diagnostics and Telemedicine Technologies of Moscow Health Care Department
- Russian Medical Academy of Continuous Professional Education
- Dmitry Rogachev National Medical Research Center of Pediatric Hematology, Oncology and Immunology
- Saint-Petersburg Research Institute of Radiation Hygiene after Professor P.V.Ramzaev
- Saint Petersburg State Pediatric Medical University
- Research and Practical Clinical Center for Diagnostics and Telemedicine Technologies of Health Care Department
- Issue: Vol 3, No 1 (2022)
- Pages: 5-15
- Section: Technical Reports
- URL: https://jdigitaldiagnostics.com/DD/article/view/87628
- DOI: https://doi.org/10.17816/DD87628
- ID: 87628

Cite item

Abstract
BACKGROUND: The spread of coronavirus disease-2019 (COVID-19) in Moscow has significantly increased the number of chest computed tomography examinations to establish a diagnosis and assess the treatment efficacy. In Moscow, the new approach to diagnostic imaging associated with COVID-19 caused divergent shifts in the volume and structure of the population radiation burden. This study aimed to bridge the gap in data, as no reliable information about the changes in the structure of diagnostic imaging and the current radiation burden due to COVID-19 in the Moscow population has been reported.
AIMS: To evaluate the impact of the pandemic on the computed tomography radiation doses in Moscow medical facilities between 2017 and 2020.
MATERIALS AND METHODS: We collected and analyzed the following data: forms No. 3-DOZ completed by the public and private Moscow medical facilities in 2017–2020; forms No. 30 completed in 2017–2020; data from the Unified Radiological Information Service for 2020. The study provides details about the annual population radiation exposure and the average individual radiation doses, with a breakdown by anatomic region.
RESULTS: The statistical form evaluation elucidated the boost of computed tomography imaging in Moscow, accounting for 31% higher than anticipated. In 2020, the number of chest imaging studies increased almost two-fold compared to the previous periods. Thereby, causing a corresponding increase in the mean effective dose by over two times.
CONCLUSION: The results show that the epidemiological situation of 2020 had a profound effect on the changes in the computed tomography-related radiation exposure, which helped us get insight into the diagnostic effect of certain types of computed tomography studies applied to various anatomic regions. The analysis contributed to a better understanding of the strengths and weaknesses of various statistical forms.
Keywords
Full Text
BACKGROUND
The use of computed tomography (CT) in diagnosing coronavirus disease-2019 (COVID-19) has been widely discussed among physicians. Initially, multiple perspectives on the applicability of diagnostic radiology existed worldwide, ranging from the use of CT as disease screening [1] to CT scans only in confirmed COVID-19 cases [2]. The reliability of polymerase chain reaction diagnostics did not exceed 70%; thus many countries, including Russia, particularly Moscow, decided to introduce the term “clinically confirmed COVID-19 case” that combines symptoms, respiratory disorders, and CT or X-ray findings (regardless of results from a single laboratory test for SARS-CoV-2 ribonucleic acid by a polymerase chain reaction and epidemiological history) [3]. Additionally, diagnostic radiology detects COVID-19 pneumonia, complications, and differential diagnosis with other lung diseases, as well as determines the status and change dynamics and assesses the therapy effectiveness [4]. The common manifestation of COVID-19 includes viral lung damage (viral pneumonia), thus radiological methods are one of the main tools to assess disease severity and decide the hospitalization needs for patients [5, 6].
Chest CT is not a classical method for diagnosing acute respiratory viral infection but is highly sensitive to pulmonary thickening, a typical COVID-19 symptom [7]. The spread of COVID-19 in Moscow significantly increased the number of chest CT scans performed on patients as part of COVID-19 diagnosis and therapy effectiveness assessment. The increased number of chest CT scans is probably related both to the increased demand for this type of examination and the increased availability of medical care for patients with COVID-19 signs due to the organization of outpatient CT centers within the city; however, this issue was not included in the goals and objectives of the study.
The rapid growth in the number of CT scans was associated with an increased radiation dose of medical exposure in the Moscow population, hence additional cases of radiation-induced cancers and hereditary effects [8, 9]. Additionally, the scope of radiological techniques to detect pathological conditions had rapidly increased, along with the increased radiological burden on patients, accompanying persons, and medical facility staff [10]. COVID-19-related changes in the structure of diagnostic radiology in Moscow changed the value and structure of the radiation dose to the city’s population, with the multidirectional process. On the one hand, the number of chest CT scans dramatically increased; on the other hand, the transfer of some exclusive medical organizations for COVID-19 treatment and the closure of medical facilities or individual departments for quarantine due to COVID-19 decreased the number of performed CT scans on elective patients, primarily multiphase procedures with X-ray contrast agents associated with high (up to 50–80 mSv) individual radiation doses [11, 12]. The structure of radiological examinations was affected by the suspension of the All-Russian Medical Examination of the Adult Population of the Russian Federation, stipulated by a decree of the Government of the Russian Federation1 and other regulatory documents of the executive authorities. Unfortunately, reliable information on the changes in the diagnostic radiology structure and exposure levels of the Moscow population is currently unavailable due to the COVID-19 epidemic.
The study aimed to assess the radiation dose changes in the Moscow population from CT scans in 2020 compared to 2017–2019 as affected by the epidemiological situation associated with COVID-19.
MATERIALS AND METHODS
Data from Forms No. 3-DOZ and No. 30 for 2017–2020 and the Unified Radiological Information Service (ERIS) for 2020 was analyzed.
Research and Practical Clinical Center for Diagnostics and Telemedicine Technologies of the Moscow Health Care Department systematically collect and records data according to Form No. 3-DOZ “Information on Patient Radiation Doses during Medical X-Ray Radiological Examinations,”2 approved by the order of the Federal State Statistics Service3.
In Moscow, as elsewhere in the country, data are collected using Form No. 30,4 approved by the order of the Federal State Statistics Service. The study only analyzed the sections related to diagnostic radiology.
Additionally, ERIS5data were analyzed.
This retrospective study did not contain personalized information about the patients. The data presented in Forms No. 3-DOZ and No. 30 was anonymized and contained information only about the number of examinations by modality and anatomical regions. Data from the ERIS were also anonymized and extracted only by the number of performed CT scans.
Both annual population and average individual radiation patient doses depending on anatomical body regions during CT scans were analyzed. Moreover, the specific contribution of CT concerning other types of examinations, particularly fluorography, radiography, fluoroscopy, and special (angiographic and interventional) and radionuclide (functional tests and scintigraphy) instrumental methods was estimated.
Data from Forms No. 3-DOH and No. 30 were analyzed for 2017–2020, whereas ERIS data were considered only for 2020, which is due to the completion of connecting all CT scanners operated in Moscow public medical facilities to the Unified Radiological Information Service only by 2020.
Each of the three options for data collection (ERIS and Forms No. 30 and No. 3-DOZ) has both advantages and disadvantages. For example, ERIS, which is the most complete and user-friendly database, has a significant limitation on the operating time and modalities of the currently connected equipment used in diagnostic radiology. Form No. 30 has excellent data details but a significant limitation on the organizations that fill it out. Additionally, most of this is manual work, in which the quality and completeness of the provided information are significantly affected by the human factor. Significant disadvantages of Form No. 3-DOZ, which provides the most complete information on the number of examinations, the population and effective dose per examination, and the distribution of the demand for examinations depending on the anatomical region, includes the limited range of organizations that fill it out and the human factor resulting from incorrect information due to the manual data entry.
Statistical analysis
The statistical analysis used the specialized options of Microsoft Excel software, where data on the number of examinations presented in Forms No. 3-DOH and No. 30 for 2017–2019 were entered. The estimated number of examinations in 2020 was calculated based on the “Forecast” function of the same software.
RESULTS
Annually, an increased number is observed in medical organizations that submit data according to the federal state statistical monitoring form, which is used by the Federal Service for the Oversight of Consumer Protection and Welfare to collect information on patient radiation doses during medical X-ray radiological examinations to protect the well-being of citizens of the Russian Federation (Form No. 3-DOZ),. Hence, the number of X-ray radiological examinations and, therefore, the population radiation dose (manSv) consistently increased (Table 1).
Table 1. Summary data on radiological examinations and dose burdens in Moscow medical facilities according to Form No. 3-DOZ
Parameters | 2017 г. | 2018 г. | 2019 г. | 2020 г. |
Number of medical facilities | 1233 | 1330 | 1394 | 1453 |
Number of examinations, units | 27 128 339 | 28 882 702 | 29 705 881 | 23 626 477 |
Population dose, manSv | 10 946 | 11 593 | 12 582 | 16 662 |
Average effective dose, mSv | 0,404 | 0,401 | 0,424 | 0,705 |
The specific share of the use of different types of examinations (Table 2) and the specific population dose contribution from different types of examinations (Table 3) in 2017–2020 was estimated to assess the current situation with the average effective dose per procedure in 2020.
Table 2. Specific share of the use of different types of examinations according to Form No. 3-DOZ
Year | FG, % | RG, % | FS, % | CT, % | Other procedures, % | RN, % |
2017 | 28.4 | 63.9 | 1.1 | 5.5 | 0.7 | 0.4 |
2018 | 27.8 | 63.7 | 0.8 | 6.4 | 0.9 | 0.4 |
2019 | 26.1 | 62.9 | 0.8 | 6.8 | 3.0 | 0.4 |
2020 | 22.7 | 62.0 | 0.6 | 13.1 | 1.0 | 0.5 |
Note. Here and in Table 3: FG, fluorography; RG, radiography; FS, fluoroscopy; CT, computed tomography; RN, radionuclide examinations.
Table 3. Specific population dose contribution from different types of examinations according to Form No. 3-DOZ
Year | FG, % | RG, % | FS, % | CT, % | Other procedures, % | RN, % |
2017 | 2.8 | 13.2 | 6.8 | 60.7 | 11.3 | 5.2 |
2018 | 3.3 | 11.0 | 5.5 | 64.2 | 9.1 | 6.9 |
2019 | 2.8 | 9.4 | 5.2 | 65.0 | 10.1 | 7.5 |
2020 | 1.5 | 5.2 | 2.4 | 75.9 | 7.2 | 7.8 |
The results presented in Tables 2 and 3 show a significantly increased number of CT scans performed in 2020 (almost twofold) and a uniformly increased population radiation dose contribution (manSv). Additionally, CT scans in all analyzed years (2017–2020) contribute to the maximum radiation patient doses (manSv).
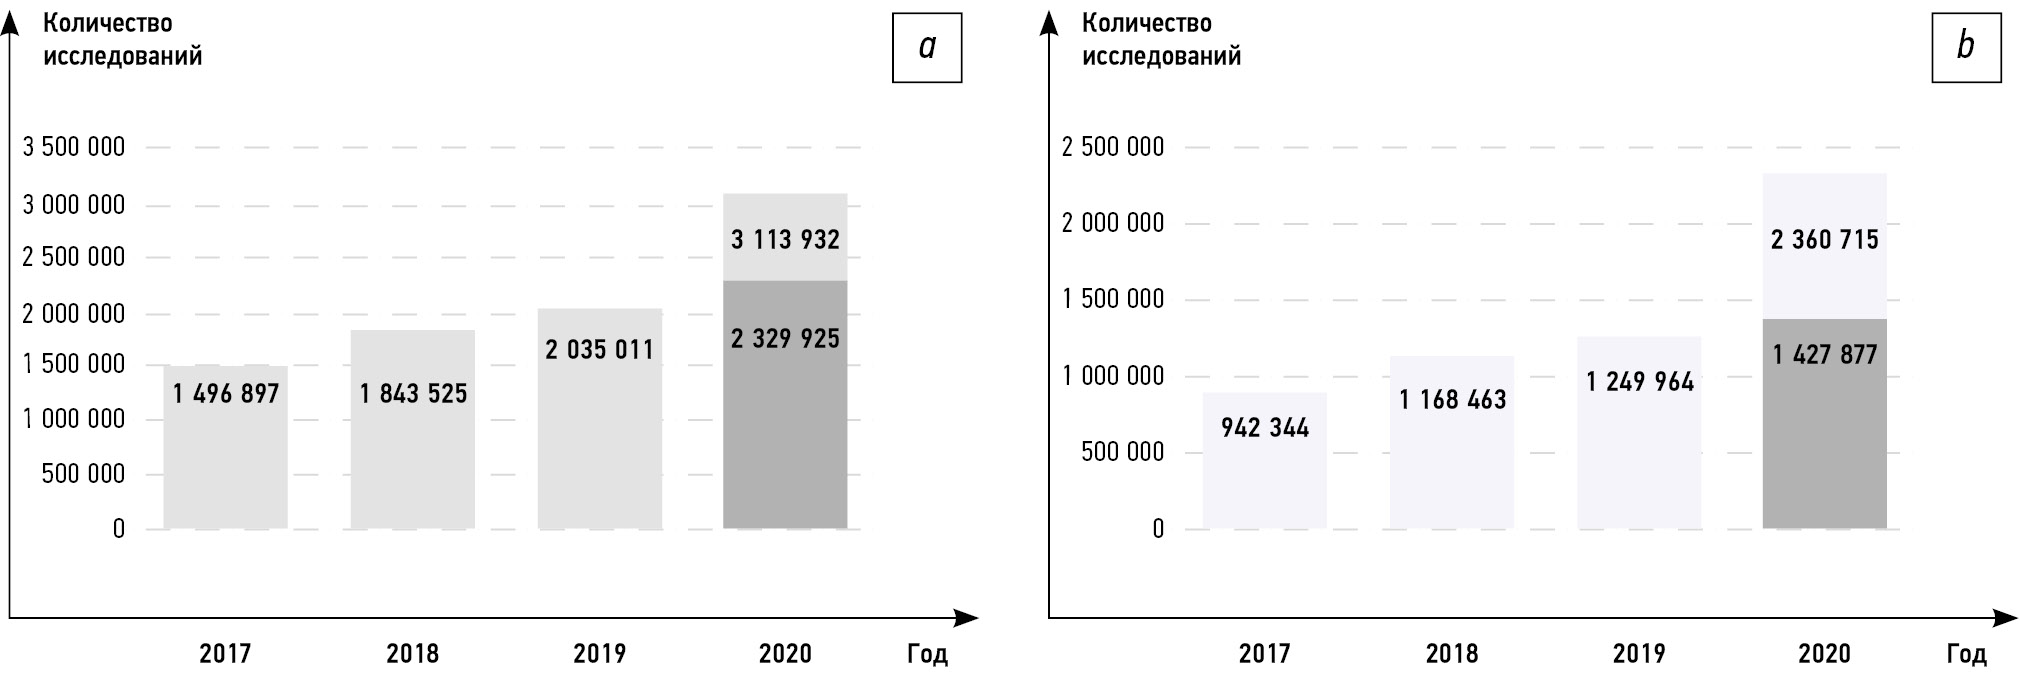
The predicted number of 2,329,925 examinations for 2020 was calculated using the Microsoft Excel “Forecast” function, based on the number of given CT scans in the reporting Form No. 3-DOZ for 2017–2019. A linear one with an approximation coefficient of 0.989 was used when making a forecast of five different types of trend lines. According to Form No. 3-DOZ, the actual number of examinations was 3,113,932, which is 31% higher compared with the expected number of CT scans. A similar analysis was conducted according to Form No. 30 (Fig. 1): the expected number of examinations in 2020 was 1,427,877, whereas 2,360,715 examinations were conducted in reality, which is 65% higher than that of the predicted number (see Fig. 1). The linear type of trend lines with the approximation coefficient of 0.9714 was also used when making the forecast.

Fig. 1. Number of CT scans according to Forms No. 3-DOZ (a) and No. 30 (b). The yellow color marks the predicted number of examinations.
Based on three sources (Forms No. 30, ERIS, and No. 3-DOZ), Table 4 was generated, which presents data on the number of CT scanners and CT scans depending on the data source.
Table 4. Data on the number of CT scanners and CT scans for 2020 from three sources
Data source | Scanners | Scans | Number of scans per scanner |
ERIS | 183 | 1 931 908 | 10 557 |
Form No. 30 | 305 | 2 360 715 | 7740 |
Form No. 3-DOZ | 595 | 3 113 932 | 5233 |
Table 5 shows the effective radiation doses per CT scan depending on the anatomical region.
Table 5. Average effective dose per CT scan depending on the anatomical region for 2017–2019 compared to data for 2020 according to Form No. 3-DOZ
Anatomical region | Average effective radiation doses, mSv | |||
2017 г. | 2018 г. | 2019 г. | 2020 г. | |
Thoracic organs | 5.609 | 4.933 | 4.818 | 4.545 |
Extremities | 0.718 | 0.781 | 0.702 | 0.674 |
Cervical vertebrae | 3.142 | 2.288 | 2.134 | 1.710 |
Thoracic vertebrae | 5.228 | 5.708 | 4.331 | 4.563 |
Lumbar vertebrae | 6.139 | 6.795 | 6.438 | 5.884 |
Pelvis and femur | 6.368 | 6.468 | 6.573 | 6.858 |
Ribs and sternum | 3.712 | 3.953 | 2.566 | 3.811 |
Abdominal organs | 8.886 | 8.246 | 8.005 | 7.413 |
Upper gastrointestinal tract | 5.348 | 3.721 | 4.118 | 6.894 |
Lower gastrointestinal tract | 5.810 | 5.832 | 5.951 | 12.304 |
Skull, maxillofacial area | 1.681 | 1.448 | 1.476 | 1.225 |
Teeth | 0.080 | 0.100 | 0.104 | 0.042 |
Kidneys, urinary system | 7.269 | 7.210 | 6.651 | 6.103 |
Other | 4.396 | 4.556 | 4.104 | 3.023 |
The average radiation dose for CT scan, mSv | 4.442 | 4.040 | 4.019 | 4.061 |
The dynamics of the demand share for CT scans were analyzed according to Form No. 3-DOZ based on the anatomical region (Table 6). Based on Tables 5 and 6, the specific contribution to the total effective dose was estimated depending on the number of CT scans of certain anatomical regions (Table 7).
Table 6. Dynamics of the demand share for CT scan based on the anatomical region
Anatomical localization (according to Form No. 3-DOZ) | The share of one examination of the anatomical region relative to the total number of examinations per year, % | |||
2017 г. | 2018 г. | 2019 г. | 2020 г. | |
Thoracic organs | 24.36 | 24.09 | 25.55 | 55.6 |
Extremities | 2.88 | 2.37 | 2.98 | 1.98 |
Cervical vertebrae | 1.71 | 1.99 | 2.39 | 1.4 |
Thoracic vertebrae | 0.97 | 1.09 | 1.05 | 0.62 |
Lumbar vertebrae | 2.56 | 2.28 | 2.37 | 1.27 |
Pelvis and femur | 3.04 | 3.64 | 3.3 | 2.11 |
Ribs and sternum | 0.03 | 0.02 | 0.22 | 0.03 |
Abdominal organs | 16.31 | 15.2 | 15.44 | 9.11 |
Upper gastrointestinal tract | 0.48 | 0.29 | 0.25 | 0.02 |
Lower gastrointestinal tract | 0.65 | 0.48 | 0.12 | 0.43 |
Skull, maxillofacial area | 38.52 | 40.41 | 38.28 | 22.41 |
Teeth | 1.54 | 0.69 | 0.25 | 0.72 |
Kidneys, urinary system | 4.58 | 4.39 | 6.14 | 3.67 |
Other | 2.37 | 3.06 | 1.66 | 0.63 |
Table 7. Specific contribution to the total effective dose based on the number of CT scans of certain anatomical regions
Specific contribution (%) to the total effective dose depending on the number of CT scans of certain anatomical regions, mSV | 2017 г. | 2018 г. | 2019 г. | 2020 г. | |
Thoracic organs | % | 24.36 | 24.09 | 25.55 | 55.6 |
mSv | 1.37 | 1.19 | 1.23 | 2.53 | |
High-dose examinations (lumbar vertebrae, pelvis and femur, upper and lower gastrointestinal tract, kidneys, and urinary system) | % | 27.62 | 26.28 | 27.62 | 16.61 |
mSv | 2.2 | 2.0 | 2.03 | 1.17 | |
Other CT scans (extremities, cervical vertebrae, ribs and sternum, skull, and teeth) | % | 48.02 | 49.63 | 46.83 | 27.79 |
mSv | 0.87 | 0.85 | 0.76 | 0.36 | |
Average effective radiation doses | mSv | 4.442 | 4.040 | 4.019 | 4.061 |
DISCUSSION
Data analysis results demonstrated a significant impact on the distribution structure of the use of different types of X-ray radiological examinations and the dynamics of changes in the effective radiation doses of patients. The analysis results of Form No. 3-DOZ, presented in Table 1, shows that the average effective dose per X-ray radiological examination in 2017–2019 differed by 5%, whereas the average effective dose (mSv) per examination increased by 66% and 74% in 2020 compared with 2019 and 2017–2018, respectively.
The number of examinations, such as fluorography, radiography, and fluoroscopy, evenly decreased from 2017 to 2020 (Table 2). Relatedly, the population dose contribution from these examinations also decreased (Table 3). However, a sharp increase in CT scans (more than twofold in 2020 compared with 2017) was observed (Table 2). The population dose contribution from CT scans grew more evenly, with a maximum increase in all years, reaching approximately 76% in 2020 (Table 3). The number of radionuclide examinations was approximately the same from 2017 to 2019, with a slight increase in 2020 (Table 2). Additionally, the population dose contribution from radionuclide examinations, due to their variety conducted using an increasingly broad spectrum of radiopharmaceuticals and the expansion of examination protocols, grew slowly, which resulted in an increased effective dose of patient exposure per examination (Table 3). The number of other examinations, which include procedures, such as radiosurgery and angiography, slightly and irregularly varied from year to year, along with the population dose contribution, which was most probably due to incorrect recording of examinations in different columns for one or another year (Tables 2, 3).
According to Forms No. 30 and No. 3-DOZ, the actual number of CT scans performed in 2020 was significantly higher than that predicted from the 2017–2019 data. Thus, according to Forms No. 3-DOH and No. 30, the increased number of examinations conducted in 2020 compared with those expected was 31% and 65%, respectively. According to ERIS, which records only examinations conducted in medical facilities belonging to the Moscow City Health Department, 1,931,908 CT scans were performed, which was 81% and 62% of the total number of examinations recorded in Forms No. 30 and No. 3-DOZ, respectively. This means that most of the registered CT scans were performed in medical facilities of the Moscow City Health Department. The results indicate a significant impact on the dynamics of the population dose to the organizational and methodological measures taken due to the epidemiological situation and the transfer of the outpatient departments to the operation mode of the outpatient CT centers.
Further analysis of the impact of the epidemiological situation on the dynamics of changes in the patient dose burden during CT was conducted according to the data presented in Form No. 3-DOZ for 2017–2020.
The study showed that average effective radiation patient doses during CT scan in all anatomical regions, except for doses from lower gastrointestinal tract examinations, uniformly decreased from year to year, which is directly associated with equipment renewal and examination protocol quality improvement (Table 5). The reasons for such a significant (over twofold) increase in the average effective dose for lower gastrointestinal tract examinations (Table 5) have not yet been found an explanation, which requires detailed analysis, consideration, and possible correction of the examination protocols to reduce the effective dose while maintaining the quality of the obtained diagnostic information.
The analysis found that skull and maxillofacial examinations contributed the most in 2017–2019, presumably, because this line also included dental CT scanners examinations. In 2020, the largest number of examinations was conducted on thoracic organs (over twice as many as in 2017), while the number of the skull and maxillofacial area examinations sharply decreased (approximately twofold), and insignificantly on almost all anatomical regions except for ribs and sternum, whose specific contribution to the number of examinations increased and gradually decreased (Table 6).
Based on Tables 5 and 6, the specific contribution to the total effective dose from chest CT scans and high-dose examinations (lumbar vertebrae, pelvis and femur, upper and lower gastrointestinal tract, kidneys, and urinary system) and other CT scans (extremities, cervical vertebrae, ribs and sternum, skull, and teeth) was estimated and presented in Table 7. The results suggest that the main population radiation dose contribution was from chest CT scans.
Study limitations
This study was limited to 1 year of data on CT radiation burden in the ERIS, inadequate information on patient doses recorded in Form No. 30, and the restricted range of organizations that fill out Forms No. 3-DOZ and No. 30.
CONCLUSIONS
The epidemiological situation in 2020 had a significant impact both on the dynamics of changes in CT dose burden on patients and on the number of certain types of CT scans depending on the anatomical region. The largest share (55.6%) of all CT scans in 2020 was that of thoracic organs, with an overall almost twofold increased share of CT in the total number of all X-ray radiological procedures. The analysis of the dynamics of changes in the number and population dose in X-ray radiological examinations confirms that the population dose in medical exposure was formed mainly due to CT scans. Therefore, special attention should be paid to the control of existing CT examination protocols and to the development and implementation of new protocols that would reduce the radiation burden while maintaining the quality of diagnostic information. Moreover, particular attention should be paid to the possibility of conducting a low-dose CT instead of the traditional one for COVID-19 analysis, which would significantly reduce the radiation burden on patients.
The analysis revealed several advantages and disadvantages of different forms of data collection. Generally, the existing reporting forms are representative enough; however, the specifics of their completion may significantly reduce their value and the available data quality. Thus, the use of specialized dose-monitoring software is recommended to avoid errors and simplify the work of medical professionals who are responsible for collecting data on X-ray radiological examinations.
ADDITIONAL INFORMATION
Funding source. The authors declare that there is no external funding for the exploration and analysis work.
Competing interests. The authors declare no obvious and potential conflicts of interest related to the publication of this article.
Authors’ contribution. Y.V. Druzhinina ― search for relevant publications, literature analysis, research design development, data processing, writing; S.A. Ryzhov ― determination of the main focus of the review, expert evaluation of literature review, research design development; A.V. Vodovatov ― determination of the main focus of the review, expert evaluation of literature review, research design development, editing of the review; I.V. Soldatov ― determination of the main focus of the review, expert evaluation of literature review; Z.A. Lantukh ― expert evaluation of literature review, systematization and final editing of the review; A.N. Mukhortova ― determination of research methods determination of research methods and materials; Y.N. Lubentsova ― literature analysis, determination of research materials. All authors made a substantial contribution to the conception of the work, acquisition, analysis, interpretation of data for the work, drafting and revising the work, final approval of the version to be published and agree to be accountable for all aspects of the work.
Acknowledgments. The authors express our gratitude for the help in preparing the article for publication to the data researcher of the department for the coordination of scientific research, Irina A. Vinogradova, and to the translator of the scientific research work group, Andrey A. Romanov.
1 Decree of the Government of the Russian Federation dated March 21, 2020, No. 710-r “On the Temporary Suspension of the All-Russian Medical Examination of the Adult Population of the Russian Federation.” Available at https://www.garant.ru/products/ipo/prime/doc/73681079/. Accessed on 01/15/2022.
2 Information on Patient Radiation Doses during Medical X-Ray Radiological Examinations (form No. 3-DOZ). Available at http://www.consultant.ru/document/cons_doc_LAW_52009/c262c55885294afd998489c7f7ef8fe17e14da38/. Accessed on 01/15/2022.
3 Federal State Statistics Service Order No. 411 dated October 16, 2013, (revised on December 22, 2021) “On Approval of Statistical Tools for Federal Statistical Monitoring of Sanitary Status of Territories, Occupational Diseases (Poisonings), and Radiation Doses by Federal Service for Surveillance on Consumer Rights Protection and Human Wellbeing.” Available at http://www.consultant.ru/document/cons_doc_LAW_153534/2ff7a8c72de3994f30496a0ccbb1ddafdaddf518/. Accessed on 01/15/2022.
4 Federal State Statistics Service Order No. 863 dated December 30, 2020, (revised on December 20, 2021) “On Approval of Federal Statistical Monitoring Forms with Instructions for their Completion for the Organization of Federal Statistical Health Protection Monitoring by the Ministry of Health of the Russian Federation.” Available at http://www.consultant.ru/document/cons_doc_LAW_373430/. Accessed on 01/15/2022.
5 Research and Practical Clinical Center for Diagnostics and Telemedicine Technologies of Moscow Health Care Department: Unified Radiological Information Service (ERIS). Available at https://zdrav.expert/index.php/Продукт:НПКЦ_ДиТ_ДЗМ:_Единый_радиологический_информационный_сервис_(ЕРИС). Accessed on 01/15/2022.
About the authors
Uliya V. Druzhinina
Research and Practical Clinical Center for Diagnostics and Telemedicine Technologies of Moscow Health Care Department; Russian Medical Academy of Continuous Professional Education
Email: yu.druzhinina@npcmr.ru
ORCID iD: 0000-0002-3230-3722
SPIN-code: 1973-2848
эксперт-физик отдела клинической дозиметрии и медицинской физики, преподаватель кафедры радиационной гигиены им. Ф.Г. Кроткова
Russian Federation, building 1, st. Petrovka, 24, Moscow; MoscowSergey A. Ryzhov
Research and Practical Clinical Center for Diagnostics and Telemedicine Technologies of Moscow Health Care Department; Dmitry Rogachev National Medical Research Center of Pediatric Hematology, Oncology and Immunology
Email: s.ryzhov@npcmr.ru
ORCID iD: 0000-0002-0640-7368
SPIN-code: 6595-4011
MD
Russian Federation, building 1, st. Petrovka, 24, Moscow; MoscowAlexander V. Vodovatov
Saint-Petersburg Research Institute of Radiation Hygiene after Professor P.V.Ramzaev; Saint Petersburg State Pediatric Medical University
Email: vodovatoff@gmail.com
ORCID iD: 0000-0002-5191-7535
SPIN-code: 4560-8978
канд. биол. наук, заведующий лабораторией радиационной гигиены медицинских организаций, ведущий научный сотрудник, доцент кафедры гигиены
Russian Federation, building 1, st. Petrovka, 24, Moscow; 8, Mira street, S.-Petersburg, 197101Iliya V. Soldatov
Research and Practical Clinical Center for Diagnostics and Telemedicine Technologies of Health Care Department
Email: i.soldatov@npcmr.ru
ORCID iD: 0000-0002-4867-0746
SPIN-code: 4065-6048
начальник лаборатории рентгенорадиологического отделение г. Москвы
Russian Federation, building 1, st. Petrovka, 24, MoscowZoya A. Lantukh
Research and Practical Clinical Center for Diagnostics and Telemedicine Technologies of Moscow Health Care Department
Email: z.lantukh@npcmr.ru
ORCID iD: 0000-0001-6623-9610
SPIN-code: 5486-6496
начальник отдела дозиметрического контроля
Russian Federation, MoscowAnna N. Mukhortova
Research and Practical Clinical Center for Diagnostics and Telemedicine Technologies of Health Care Department
Email: a.mukhortova@npcmr.ru
ORCID iD: 0000-0001-9814-3533
SPIN-code: 9051-1130
начальник информационно-аналитического отдела
Russian Federation, building 1, st. Petrovka, 24, Moscow, 127051Yuliya N. Lubencova
Research and Practical Clinical Center for Diagnostics and Telemedicine Technologies of Health Care Department
Author for correspondence.
Email: lubencova@npcmr.ru
ORCID iD: 0000-0001-6274-9736
SPIN-code: 5975-7418
начальника отдела координации лабораторной деятельности
Russian Federation, building 1, st. Petrovka, 24, Moscow, 127051References
- Zhao W, Zhong Z, Xie X, et al. Relation between chest CT findings and clinical conditions of coronavirus disease (COVID-19) pneumonia: a multicenter study. AJR. 2020;214(5):1072–1077. doi: 10.2214/AJR.20.22976
- Erturk SM. CT is not a screening tool for corona-virus disease (COVID-19) pneumonia. (letter). AJR. 2020;215(1):W12–W12. doi: 10.2214/AJR.20.23288
- Morozov SP, Protsenko DN, Smetanina SV, et al. Radiation diagnosis of coronavirus disease (COVID-19): organization, methodology, interpretation of results. Issue 65. Version 2 dated 17.04.2020. Moscow; 2020. 78 p. (Series: Best practices of radiation and instrumental diagnostics). (In Russ).
- Ministry of Health of the Russian Federation. Temporary methodological recommendations. Prevention, diagnosis and treatment of new coronavirus infection (COVID-19). Version 11 (07.05.2021). Moscow; 2021. 225 p. (In Russ).
- Morozov SP, Reshetnikov RV, Gombolevskiy VA, et al. Diagnostic accuracy of computed tomography for identifying hospitalizations for patients with COVID-19. Digital Diagnostics. 2021;2(1):5−16. (In Russ). doi: 10.17816/DD46818
- Siordia JA. Epidemiology and clinical features of COVID-19. A review of current literature. J Clin Virol. 2020;127:104357. doi: 10.1016/j.jcv.2020.104357
- Morozov SP, Kuzmina ES, Ledikhova NV, et al. Mobilizing the academic and practicalpotential ofdiagnostic radiology duringthe COVID-19 pandemic in Moscow. Digital Diagnostics. 2020;1(1):5−12. (In Russ). doi: 10.17816/DD51043
- Vodovatov AV, Romanovich IK, Historian OA, et al. Preliminary assessment of changes in the structure of the collective dose from CT examinations for the period March-June 2020 in connection with the diagnosis of COVID-19 in the Russian Federation. Preprint [Internet]. (In Russ). Available from: https://covid19-preprints.microbe.ru/article/28. Accessed: 15.01.2022.
- Okhrimenko SE, Ilin LA, Korenkov IP, et al. Optimization of radiation doses to patients in x-ray diagnostics // Hygiene and Sanitation. 2019;98(12):1331–1337. (In Russ). doi: 10.47470/0016-9900-2019-98-12-1331-1337
- Morozov SP, Soldatov IV, Lantukh ZA, et al. Characteristics of the dose load on patients in medical institutions in Moscow [Internet]. (In Russ). Available from: https://tele-med.ai/documents/482/harakteristika_dozovoj_nagruzki_na_pacientov_v_medicinskih_organizaciyah_g_moskvy_1.pdf. Accessed: 15.01.2022.
- Balonov MI, Golikov VYu, Vodovatov AV, et al. Scientific foundations of radiation protection in modern medicine. Ed. by M.I. Ballonov. Vol. 1. Radiation diagnostics. Saint Petersburg: Ramzaev Research Institute; 2019. 320 p. (In Russ).
- Chipiga LA, Bernhardsson C. Patient doses in computed tomography examinations in two regions of the Russian Federation. Radiat Prot Dosimetry. 2016;169(1-4):240–244. doi: 10.1093/rpd/ncv516
Supplementary files

