Article

Research on the Satisfaction Degree Characteristics of Residential Public Resources under Lockdowns for Pandemic Prevention and Control: A Case Study in the Changchun

Faculty of Architecture, Civil and Transportation Engineering, Beijing University of Technology, Beijing 100124, China
*
Author to whom correspondence should be addressed.
Sustainability 2022, 14(8), 4385; https://doi.org/10.3390/su14084385
Submission received: 21 February 2022 / Revised: 28 March 2022 / Accepted: 6 April 2022 / Published: 7 April 2022

Abstract

:
In order to improve the ability of residential disaster prevention, control, and governance, it is important to objectively measure how nearby residents’ needs match the public resources of the residential area, and to understand the factors affecting the satisfaction of residents’ needs at the time of lockdowns. Taking Changchun City as an example, this paper used Structural Equation Modeling (SEM)-logit and Importance–Satisfaction (I–S) evaluation methods to discuss the impact mechanism and improvement strategies of residential public resource elements on the satisfaction of residents’ needs during the lockdown period. The results showed the influencing factors and the degree of importance of the satisfaction of residents’ needs under different types of settlements have obvious differentiation characteristics. The level of resource management can better affect the overall evaluation of residents in newly built settlements, and the quality of the conditions of the space environment is more important for the old residential communities. The satisfaction of residents in settlements has a more significant impact. Finally, the study explained the renovation proposals and their priority levels that meet the needs of residents to provide beneficial support for the resilience of urban settlements.

1. Introduction

At the beginning of 2020, the COVID-19 pandemic broke out globally, and a sudden major public health incident posed a great challenge to the governance system and emergency carrying capacity of cities in various countries. In pandemic prevention and control, some countries, represented by China, Singapore, and Japan [1,2], adopted a community-based lockdown method, which has become a crucial means of curbing the spread of the pandemic [3,4]. As a result, “community resilience” has once again caused reflection and discussion in the field of international settlement planning. A key issue is how to construct a pandemic prevention and control system that is built on patterns of behavior, structure, and space found in residential communities [5,6]. The residential community functions as the fundamental unit of residents’ lives and the hub of the community. As a result of the lockdowns, the supply–demand relationship between residents’ living needs and residential communities’ handling capacity (which refers to the integrated supply ability to sustain residents’ daily lives, covering commercial and medical services supplied with service facilities and cleaning services within the residential communities) was significantly enhanced, leading to further conflict between the two, especially with respect to the allocation and management of public resources such as physical space, roads, and service facilities. Residents were irritated by the unreasonable entrances and exits, inadequate basic services, and insufficient sanitation measures that were revealed during the lockdowns [7]. When faced with such circumstances, it is essential to objectively measure how well residential public resources match residents’ needs to rationally formulate residential management plans and enhance the ability of residential communities to resist, control, and manage disasters. Furthermore, our urban and rural planning work should also be guided by how residents perceive their public lives in residential communities, as well as the factors that influence them during lockdown periods to develop strategies for the orderly management of pandemic prevention and control in urban and rural communities post-pandemic.
In 2003, another pandemic, SARS, became rampant across the globe. Afterward, many urban planning practitioners made reflections on the phenomena from professional perspectives. For instance, Makwana [8] pointed out the necessity of institutionally constructing an integrated disaster mitigation management system for metropolises. Additionally, Corburn [9] proposed 11 urban planning improvement measures for coping with the outbreak of SARS. As the economies keep developing, the concept of the “Healthy City” is emerging. Correspondingly, Barton [10] discussed the status-quo and hot issues in present domestic healthy city studies, concluding that urban planning has become a major branch of related studies. Furthermore, Giles-Corti [11], Iswahyudi [12], and Khomenko [13] have conducted similar analyses of planning issues with and urban strategies for healthy city construction in cities located in Austria, Great Britain, and Australia as research objects, respectively. Against this background, a great number of scholars and experts around the world have set out to discuss residential planning and governance measures amid pandemic prevention and control.
From an international perspective, many scholars have discussed the main types of communities in China and their differentiated governance models during this special period of pandemic prevention and control. For example, Mackworth-Young [14] conducted telephone interviews and found that in pandemic prevention and control, personal protective equipment and sufficient salaries for health care workers, as well as provisions to meet residents’ basic needs, are prerequisites for communities to take effective preventive measures. In a report by Zhang Yuxiao [15], it is recommended that, when a public health emergency occurs, the government should take measures to improve the quality of residents’ lives and coordinate prevention and control efforts, including dispatching enough service personnel, mobilizing service resources, refining service content, and adjusting incentive policies so as to effectively prevent and control the spread of the pandemic and further expedite the economic and social recovery. The management and deployment of public resources in a community are often key to preventing and controlling outbreaks during a pandemic.
In addition, it has also been noticed by some scholars that it is crucial to develop a resilient community. Resilient communities are expected to resist, adapt, and recover well from external interference, impacts, or uncertain factors and then learn after such incidents so as to improve their overall resilience. Based on resilience theory, scholars have suggested a few theories and countermeasures concerning resilient community planning from the following perspectives: residential district planning, architectural design, and dedicated facilities. Among them, Heslop [16] discussed key points in spatial planning against an unexpected pandemic in terms of public space, community unity, public facilities, and emergency space redundancy, proposing spatial governance strategies ranging from the flexible assignment of medical resources, vertically interlinked prevention and control mechanisms, social organizational participation, and elaborated community governance. By comparison, Marais [17] studied how to improve subdistrict and community governance ability and enhance resilience in the face of emergencies from various aspects, including networking, the elaboration and institutionalization of primary management, public health service institutions’ facilities and levels, environmental hygiene quality, public participation, and the application of new technology.
On the other hand, from the perspective of residents, the public resources that were sufficiently supplied in the social system during the non-pandemic period are now faced with the sudden changes brought about by residential community control during the pandemic. In order to implement community governance, it is also necessary to determine whether the residents accept such changes and whether the control conditions meet their basic needs [18].
Previous studies on the public resources of residential communities have primarily focused on residential activities, age-friendly transformations, resilience improvement, and other aspects [19,20,21,22], among which the investigation and analysis of residents’ satisfaction have played an important role. The impact of residential public resource factors on the evaluation of residents’ satisfaction was examined via partial least squares (PLS) path modeling [22], multigroup structural equation modeling (MSEM) [23], logistic regression [24], and multiple regression [25]. From the perspective of the composition of evaluation factors, factors such as residential location [23], social class, age, gender, and income [26] have been proven to have an impact on residents’ satisfaction, and residents’ subjective cognition often plays a greater role than the objective material conditions. The research group led by Zainab Ibrahim Abass [25] analyzed the satisfaction of residents in Australia’s suburbs and concluded that neighborhood characteristics such as seating environment quality, footpath conditions, and shared open spaces were the strongest predictors of residents’ satisfaction. Wanita Subadra Abioso and Sugeng Triyadi [27] explained that the content of public spaces is shaped by physical, cognitive, and social needs. It appears that spatial resources, facility resources, transportation resources, and their management are the major measurement indicators on which most studies have agreed. Nevertheless, existing studies appear insufficient in illustrating how such elements influence residents’ satisfaction levels and how they interact with each other.
This paper is based on the analysis of residential public resource satisfaction using the SEM-logit model and IS evaluation methods to quantitatively grasp the differentiation characteristics of residents’ satisfaction with residential space resources during the lockdown periods of the pandemic, clarifying which factors have an impact on the differentiation of residents’ satisfaction, and how to optimize the allocation of public resources and their service capabilities to improve the prevention, control, and governance capabilities of residential areas.

2. Materials and Methods

2.1. Study Area

The survey selected the downtown area of Changchun city as the study area for the following two reasons:
  • As the capital city of Jilin Province, Changchun is a densely populated, representative city in northeast China. It also has typical settlements and residential management patterns like other cities in China;
  • As COVID-19 approached, Changchun decided to adopt lockdowns throughout the whole city from 6 February 2020 until 25 June of that year. As one of the cities having implemented a lockdown earliest and for the longest period of time in the country, it is worth studying local residents’ life satisfaction and demands during the lockdowns.

2.2. Survey Methods

In the study, stratified random sampling was used to obtain residents’ satisfaction evaluation data through questionnaire surveys. Researchers conducted pre-survey activities in mid-March 2020 to specifically understand the residents’ characteristics and satisfaction during the pandemic period, as well as to inform questionnaire design and aid result interpretation for the satisfaction research. As a follow-up to preliminary findings, a formal survey questionnaire was conducted in downtown Changchun in May 2020 using a combination of online and offline methods. The questionnaire was mainly distributed in three municipal districts by three groups involving about 200 residential areas with 3 million residents; secondly, according to the types of residential communities in each district, they were further divided into old and new residential neighborhoods. Each of the residential communities is numbered separately based on its type. Finally, 2–3 residential communities in each district were randomly selected for a total of 13 residential communities (six old residential communities and seven new residential communities) and questionnaires were distributed online via a survey company and the neighborhood committees. In addition, in order to analyze and demonstrate the results of the questionnaire, the spatial environment characteristics of the study’s residential areas were also recorded, combined with satellite map information (Table A1).
During the survey, Changchun City’s pandemic situation was generally under control. Although the residential communities were under lockdown, residents have returned to normal production and life. Thus, the survey can reflect the time-dependent characteristics of how prevention and control of pandemics affect residents’ satisfaction.
There are four parts to the questionnaire: the respondent profile, resource utilization, the level of satisfaction with residential public resources, and the extent of renewal needs. Among them, the survey on the utilization of residential resources was at the core of the pre-survey, with 29 questions related to residents’ public activity frequency, use intention, and demand preference during the lockdowns based on three aspects: the spatial environment, the road layout, and public resource management (Appendix B). To measure the residents’ satisfaction with residential public resource demand, the scale was designed to measure the residents’ public behavior characteristics and public space conditions in the community during the period of pandemic prevention and control, as well as their satisfaction with the overall level of residential resource allocation, service management, and other indicators during the period of pandemic prevention and control. A Likert scale with five points was used to measure their level of satisfaction with the survey. In general, the higher the satisfaction, the higher the score. As shown in Table 1, in the first part of the questionnaire, evaluation indicators No. 3–5 and No. 8–11 attempt to clarify the differences between lockdown management during the pandemic and usual management in terms of people access control, motor vehicle access control, community health, safety prevention and control, and so on [28,29]. Based on these findings, combined with the results of the pre-survey, and considering that residents have a high demand for residential activity space and public health service facilities during the outbreak period, evaluation indicators No. 1, 2, 6, and 7 (Table 1) were proposed, including a total of 11 observed variables, from which the initial model of residents’ satisfaction with public space utilization was constructed, as shown in Figure 1. Moreover, to understand the rationale behind the residents’ selection, the team conducted sub-sampling on the basis of the information obtained from the questionnaire, while analyzing the results of the questionnaire alongside online interviews with the residents.

2.3. Data

A total of 453 questionnaires were collected (Appendix C). After excluding the invalid data (Appendix D), a total of 412 valid samples were obtained, with an effective rate of 91%, meeting the necessary sample size (Appendix E) for stratified sampling. The basic characteristics of the sample are shown in Table 2. Approximately 36.4% of the total sample comprised 25–45-year-olds, while 35.6% of the total sample size composed 46–60-year-olds. There were 208 respondents who lived in new residential communities built after 2000, accounting for 50.5% of the sample size, while 49.5% lived in old residential communities built before 2000, showing a relatively balanced distribution.

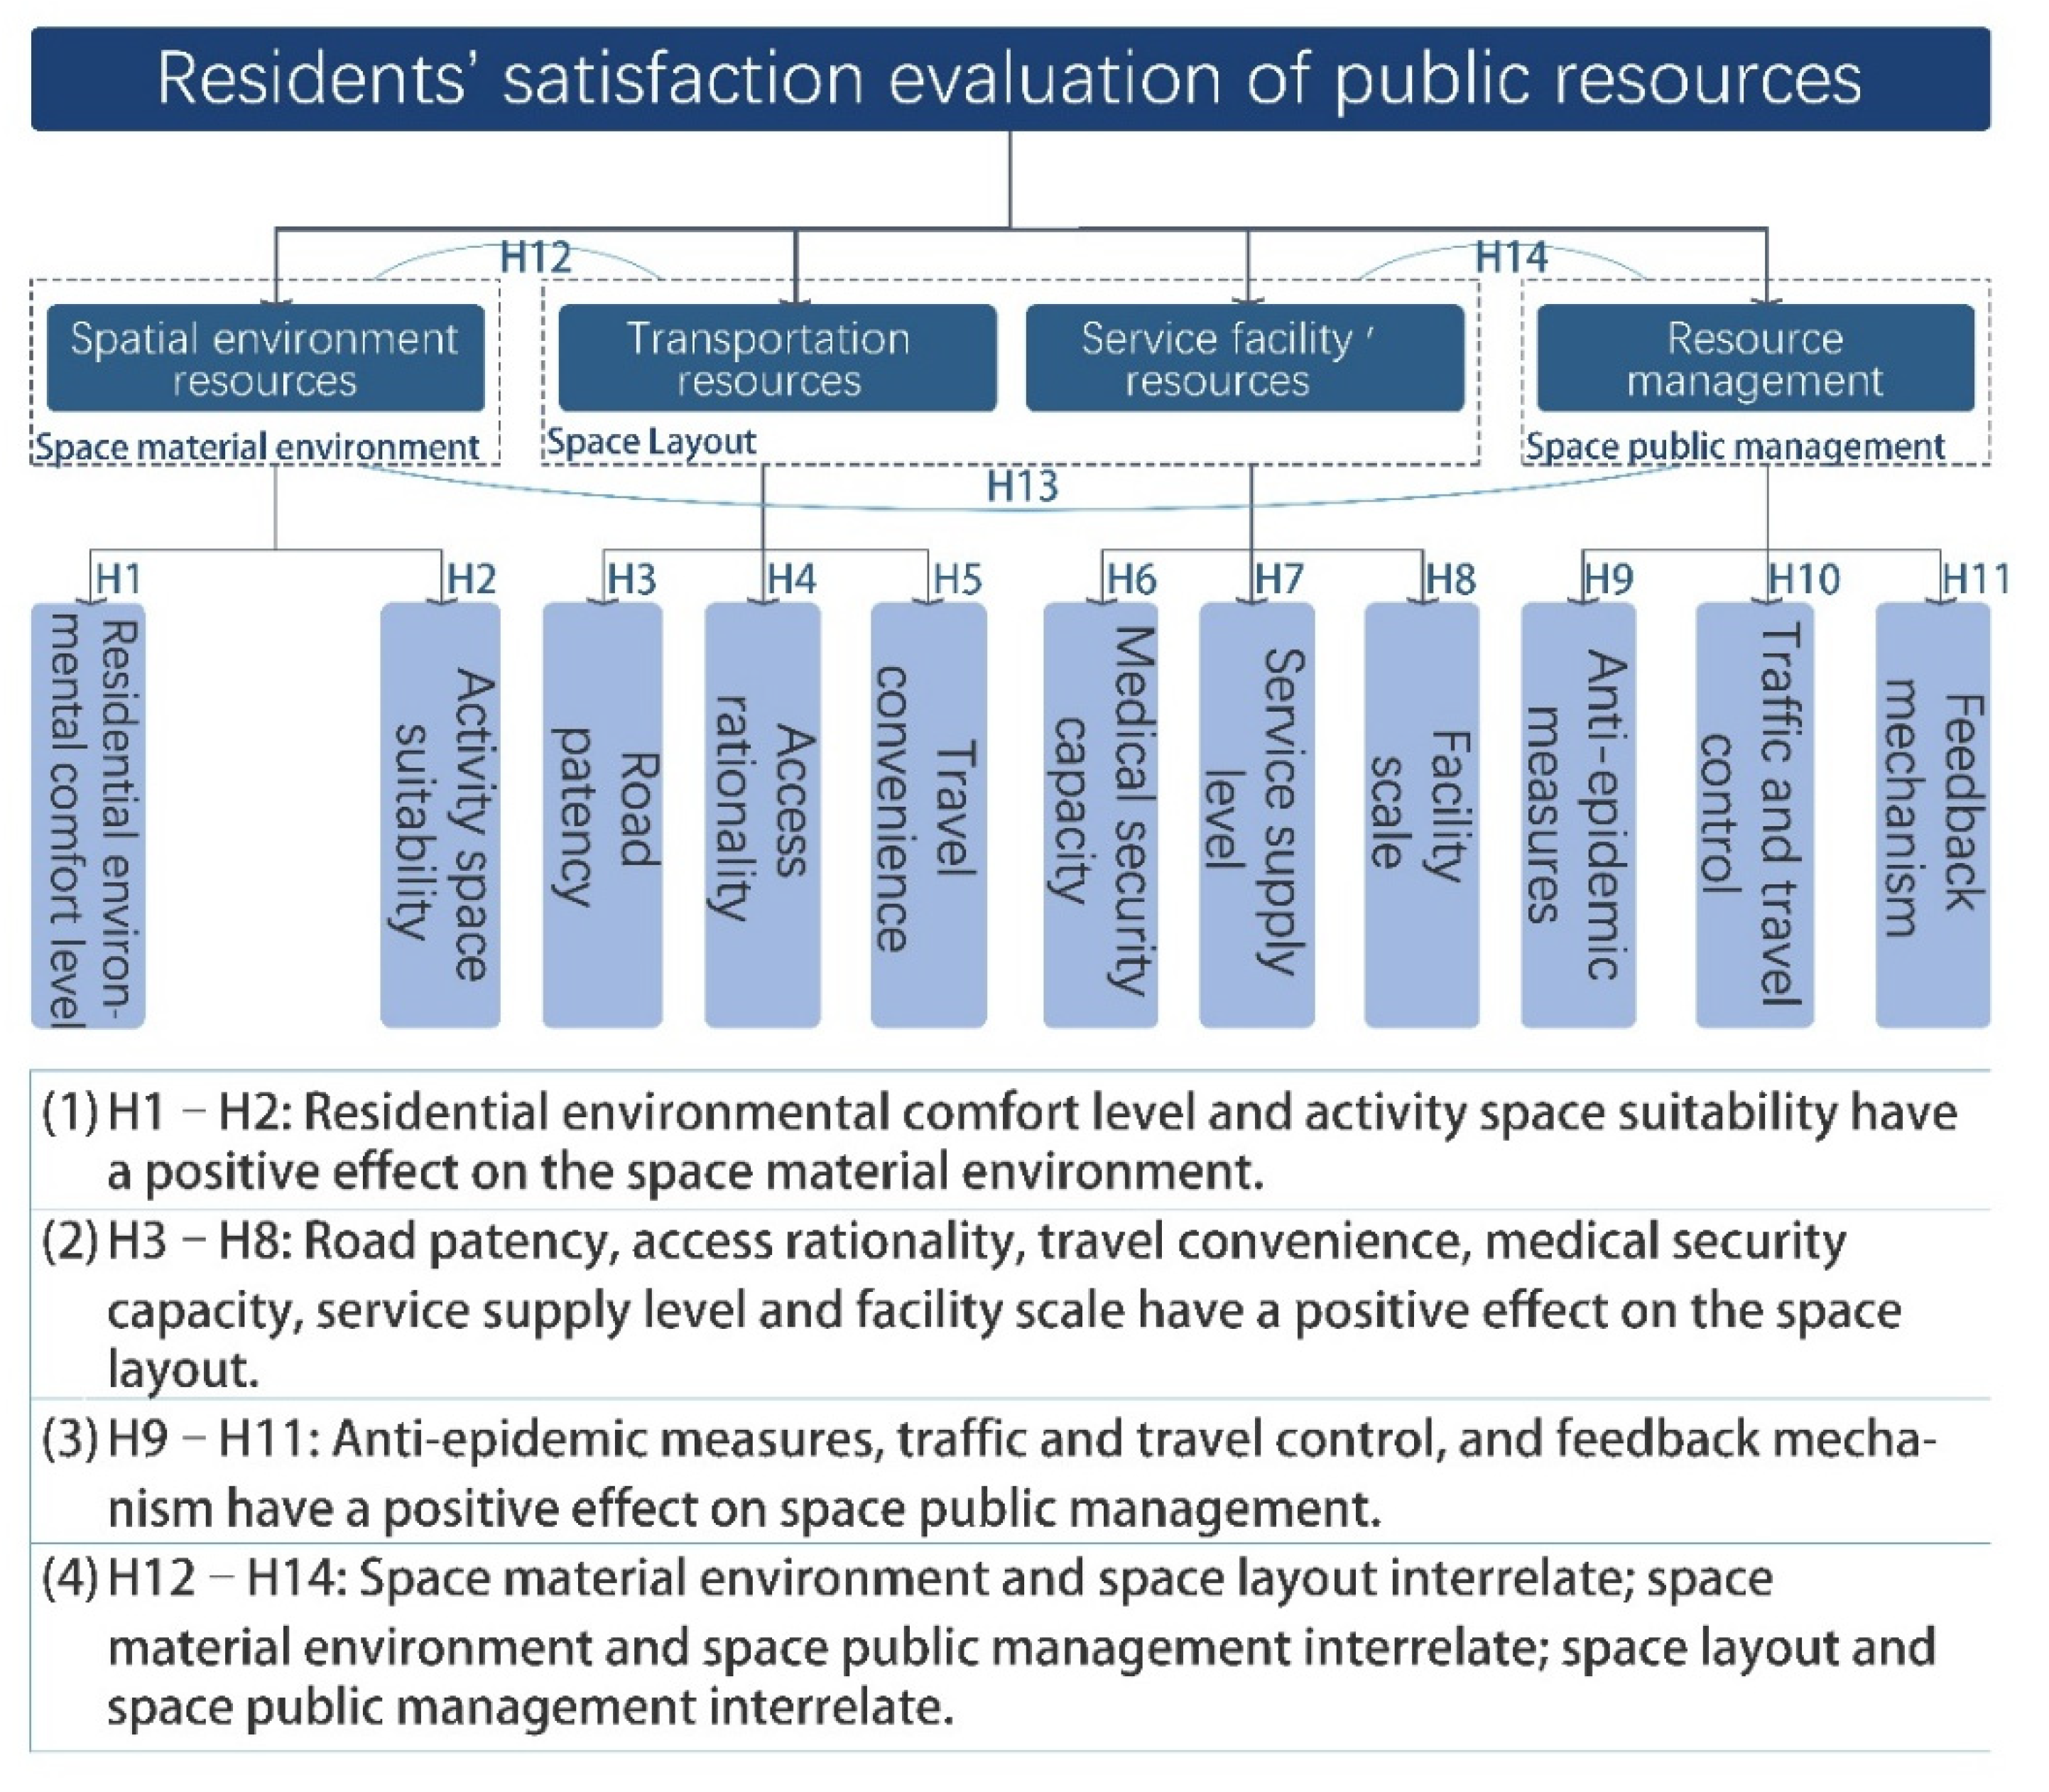
2.4. Overview of SEM-Logit Model

Satisfaction is often viewed as residents’ perceptions of the gap between their expected utility and actual feelings [30], and the satisfaction model is often nonlinear according to random utility theory [31,32]. At the same time, satisfaction evaluation is a complex multifactor decision-making process. Its structure includes not only directly observable influencing factors (such as residents’ age, social status, etc.) but also many different aspects and different types of potential psychological factors. For a comprehensive assessment of spatial environmental resources, resource management, and other index categories and latent variables, these factors are often not directly observable and need to be further refined to create a multi-level nested variable structure. Therefore, if the non-linear model is directly used for analysis, statistical errors such as multicollinearity may occur, and it is also difficult to effectively explain the relationship between various influencing factors and satisfaction.
To tackle the issue of IA (independence from irrelevant alternation) characteristics and stochastic preferences in statistics, this study builds an SEM-logit model by combining the classic logit model with a structural equation model (SEM) that measures the relationship between observed variables and latent variables.
There are two steps in the analysis of the SEM-logit model. The first step is to construct the SEM model. In the first place, the researcher proposed the hypothesis of the influence path of residents’ satisfaction with public resources and established the structural model of residents’ satisfaction with public resources to evaluate the causal relationship between the observed and latent variables. Additionally, the researcher determined the actual structural relationship between the variables through model testing and correction and computed the configuration value of latent variables from each parameter. The calculation formula is as follows:
η i k n = r λ i k n x i r n + ζ i k n
y i , t , n = k γ i k t η i k n + ξ i t n
where ηikn represents the latent variables; xirn denotes the manifest variables related to the latent variables; yi,t,n refers to the indicator variables corresponding to the latent variables; t is the number of observed variables corresponding to the latent variables; n is the number of the manifest variables related to latent variables; ζikn and ξitn are stochastic error terms; and λikn and γikt are unknown parameters.
The second step is to substitute the fit values of the latent variables in the SEM model into the ordered Logit model, coupled with a t-test, and finally to determine the correlation coefficients of each variable, thereby identifying the impact of various factor attributes in residential public resources on residents’ overall satisfaction. The calculation formula is as follows:
U i n = V i n + ε i n
V i n =   a i q   s i q n +   b i k   η i k n
where Uin represents the utility function of resident n choosing satisfaction degree i; Vin refers to the fixed term of the utility function of resident n choosing satisfaction degree i; εin is the random term of resident n choosing the utility function of satisfaction degree i; q is the number of the variables of residents’ characteristic; siqn is the manifest variables of the residents’ characteristics; k is the number of latent variables; ηikn is the latent variables; and aiq and bik are unknown parameters.

3. Result

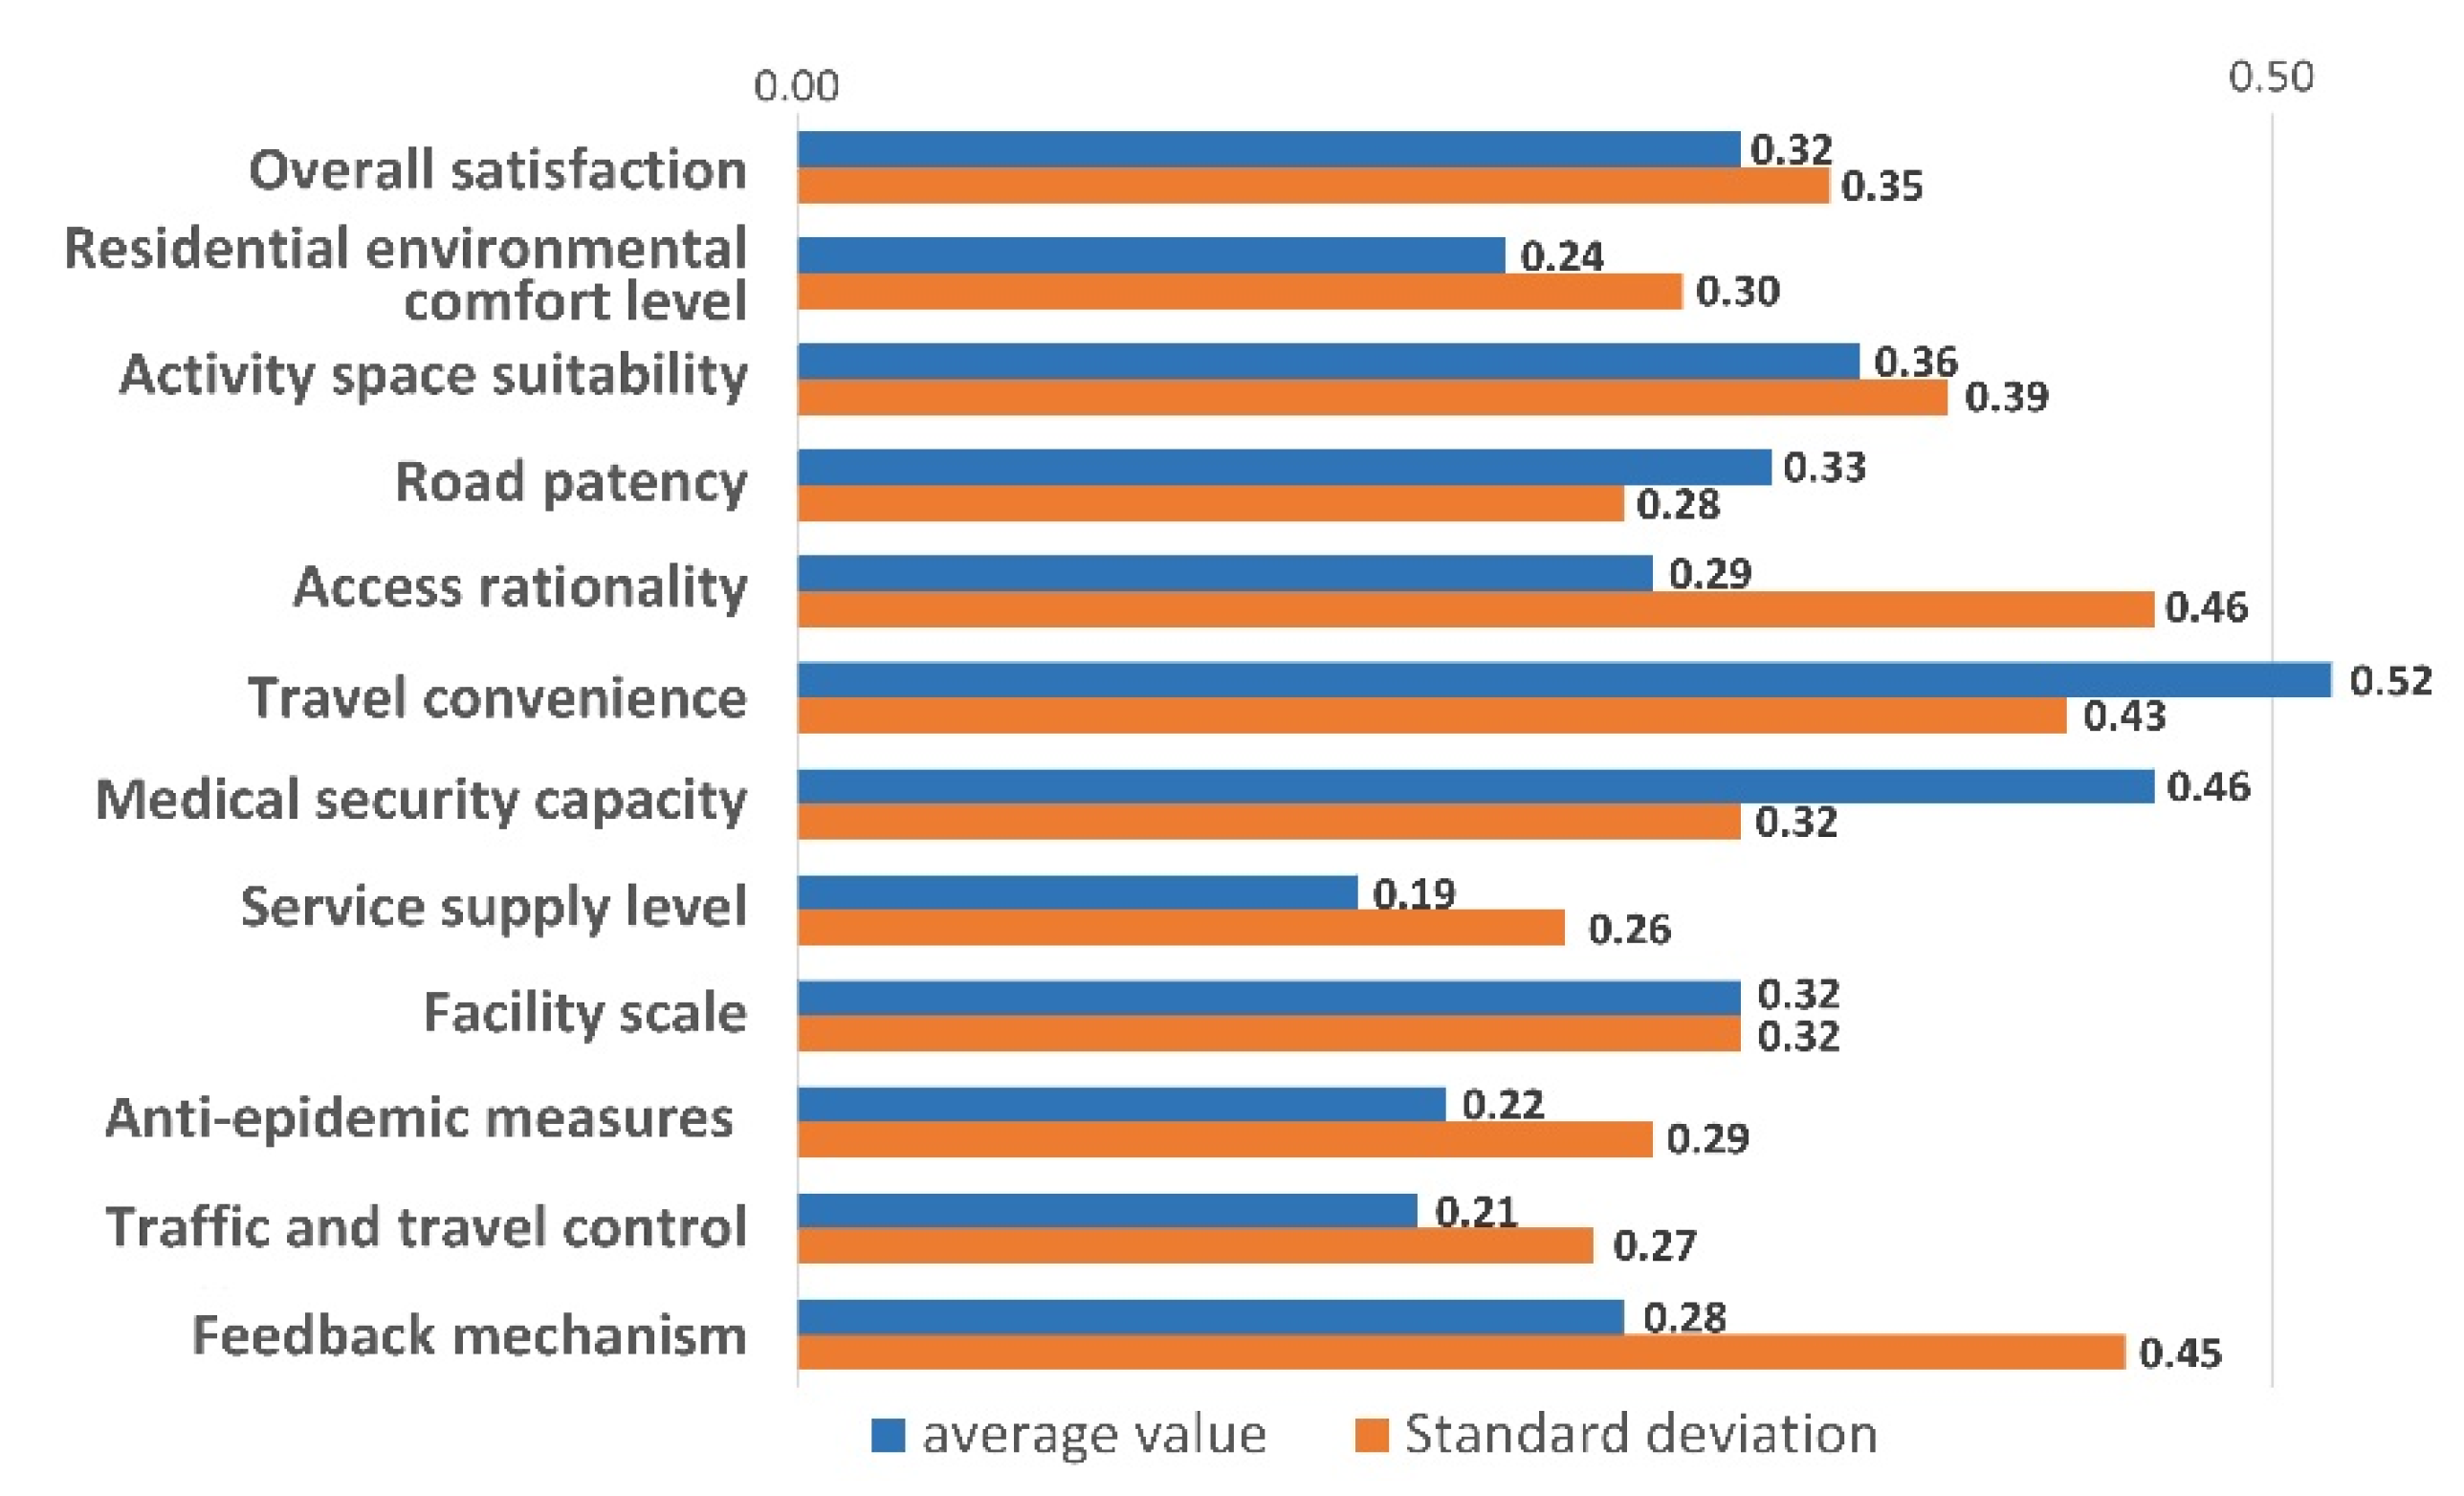
3.1. Statistical Overview of Satisfaction Data

As shown in Figure 2, the statistical results of the questionnaire data were obtained after normalizing the scores for the evaluation indicators of satisfaction with residential public resources. During the lockdown period, residents’ satisfaction levels averaged 0.32 (max: 1), which suggests that many residents did not find the public resources and service capacity of the residential communities to be adequate to meet their living needs. According to the indicators, the satisfaction rate of travel convenience was the highest, with an average value of 0.52, indicating that access restrictions in residential communities did not significantly affect residents’ transportation; in contrast, the satisfaction rate of service supply is only 0.19, the lowest of all the indicators. During the lockdown period, many public facilities, such as supermarkets and vegetable markets in residential communities, could not meet the daily needs of residents.
Based on Spearman’s analysis, the correlation between the respondents’ basic information and the satisfaction of community public resources was tested. The results show that the correlation coefficient between the residential area type and the public resource satisfaction of residents is −0.188, and the correlation is the most significant. This proves that with different types of settlements, residents’ evaluation of public resource satisfaction has distinct characteristics. Based on this result, the study distinguished between the old and newly built settlements and explored the differentiating factors of spatial resource satisfaction and their influence on structure.

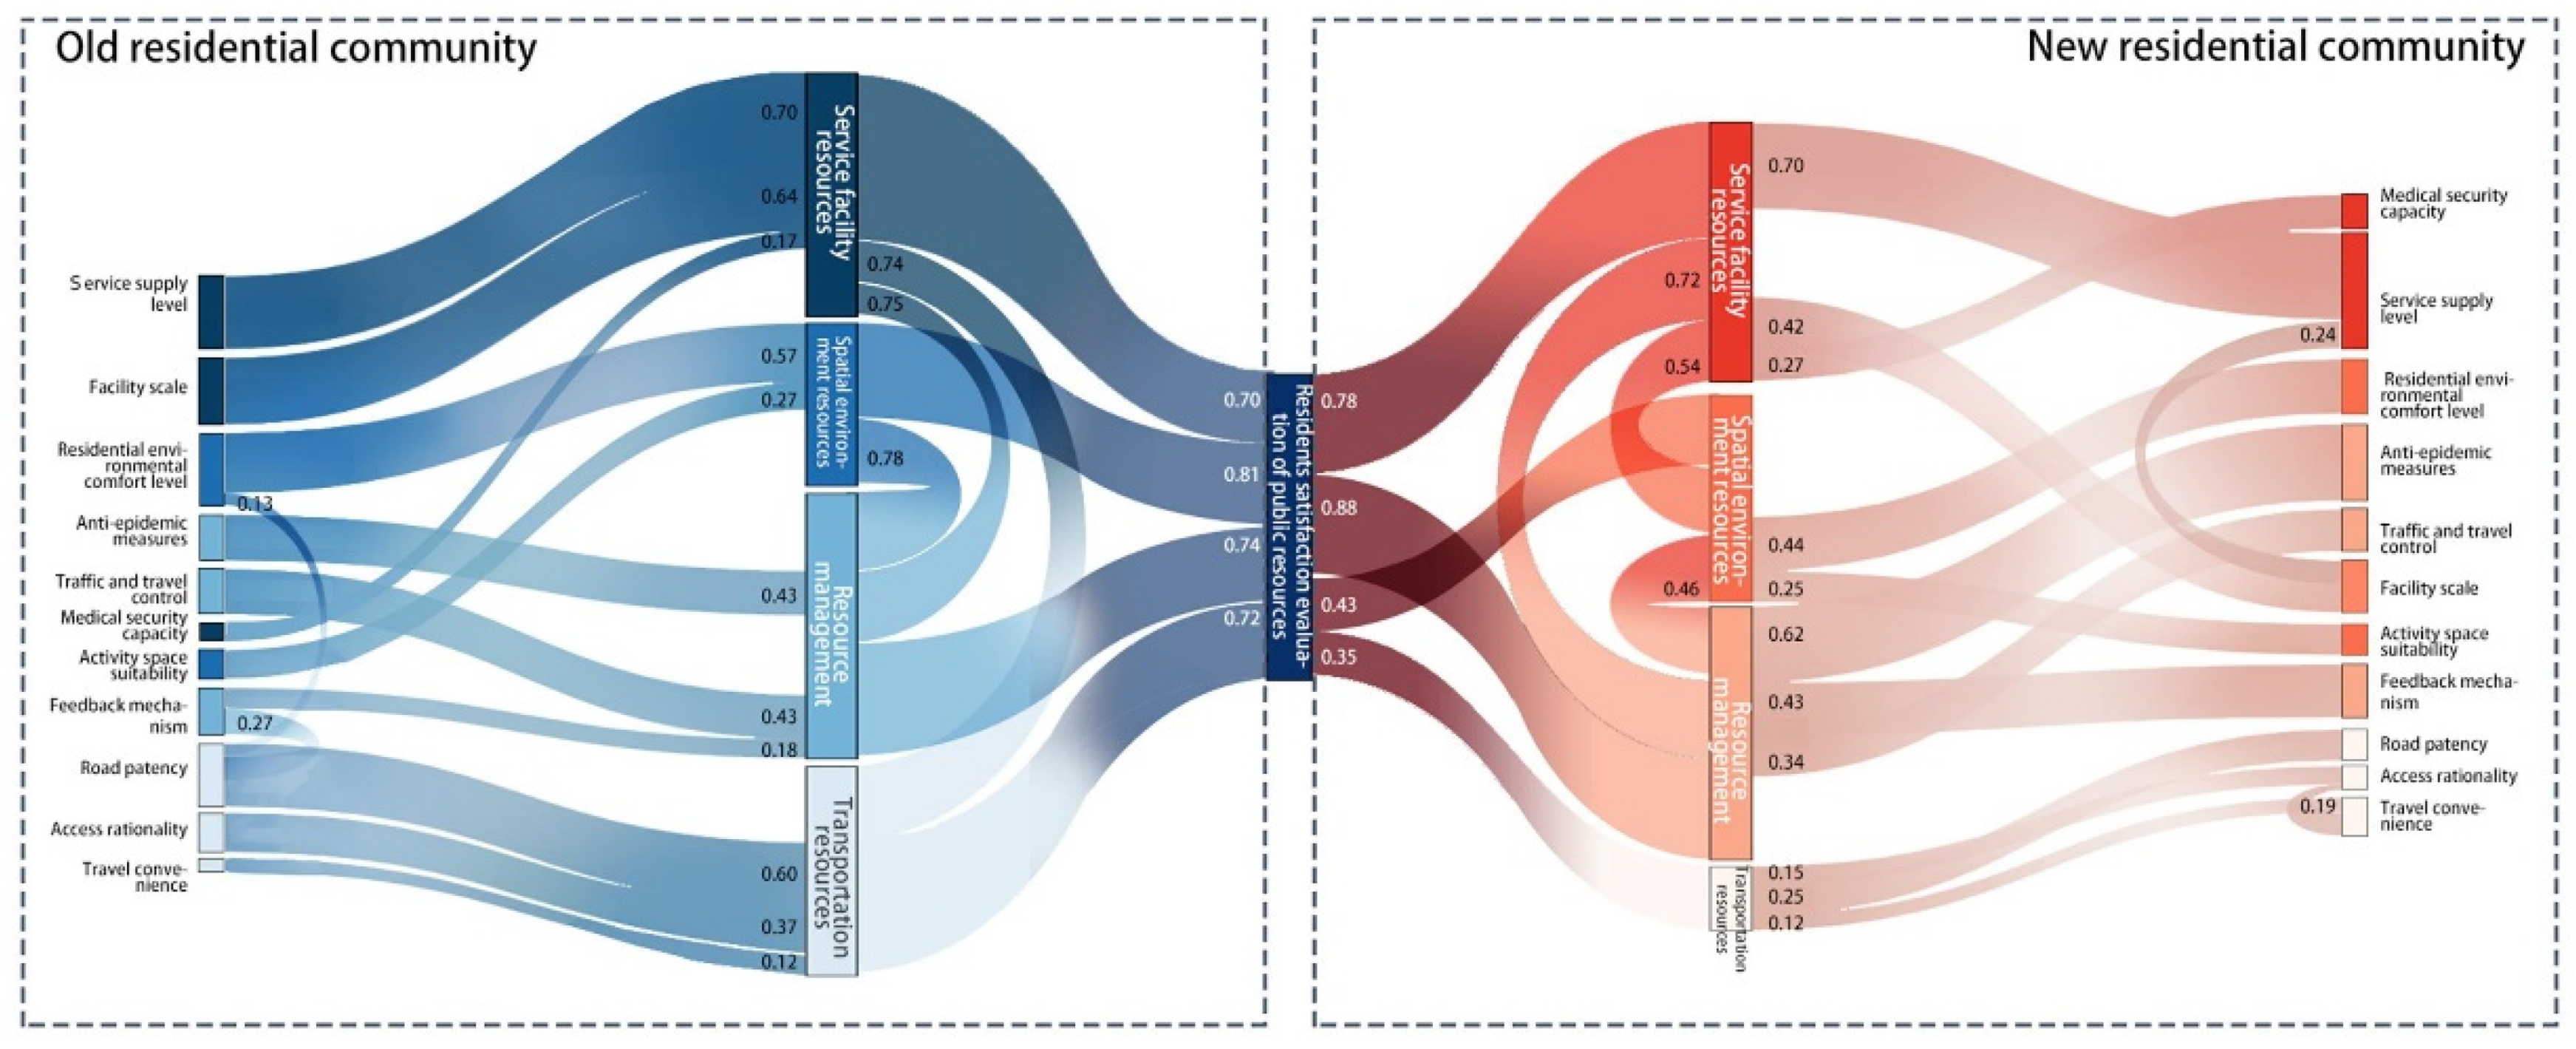
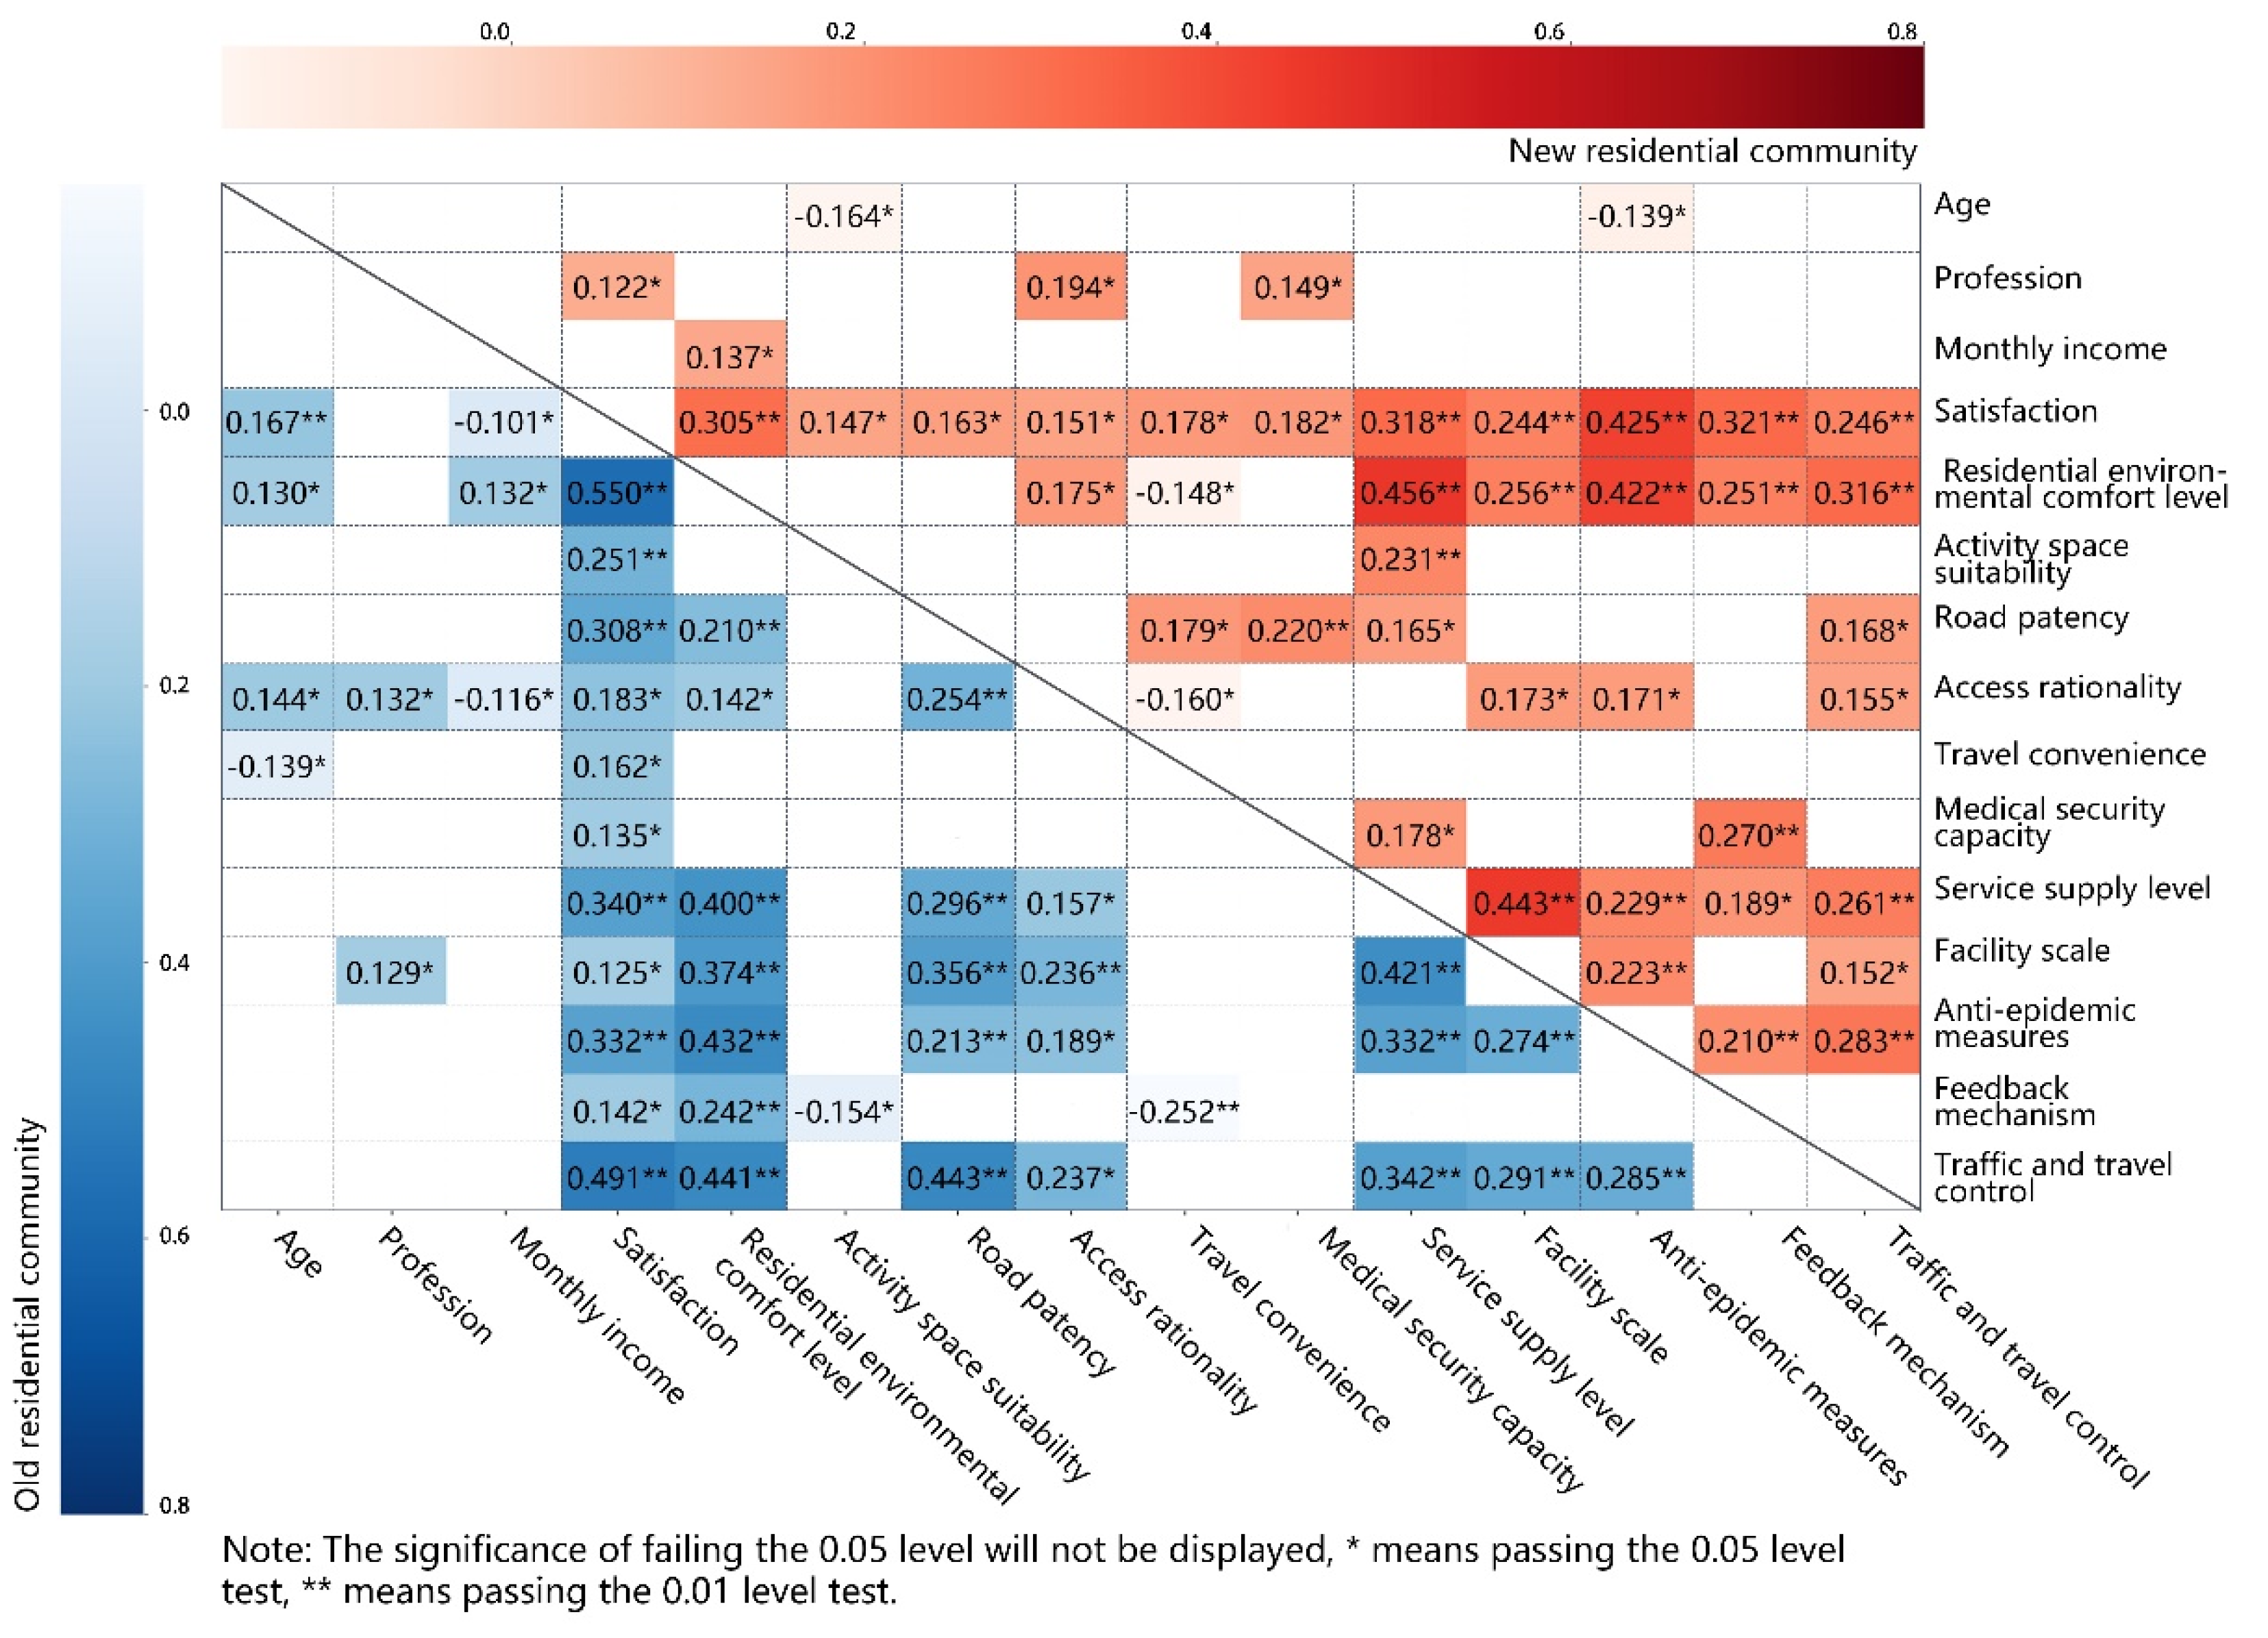
3.2. Results of SEM Model Analysis

As shown in Table 3, the reliability and validity of the factors in the old residential community model and the new residential community model were tested through confirmatory factor analysis (CFA). All the composite reliability values were greater than 0.7, indicating high reliability and sound internal consistency for the model data. All latent variables also passed the KMO test (all greater than 0.7) and Bartlett’s sphere test, indicating that the model had sound discriminant validity. Using the fitted data and the modification indices, the model was modified and optimized by adding paths between factors.
Model optimization usually brings in more than one possible model (which could also be called an alternative or competing model) [33]. To ensure the reasonableness of the resultant model, this study referred to the research findings of Amerigo [34] and Han Soojeong [35] regarding settlement satisfaction in order to guarantee qualified sample data fitting and finally chose the model structure as shown in Figure 3. Moreover, it was pointed out by Boomsma [36] and Lei Puiwa [33] that the SEM model’s effectiveness was directly related to the sample size. They suggested a minimum sample size of over 200. It could be inferred that this study is in line with the effectiveness precondition and its results are of interpretation value.
Figure 3 shows the results of the SEM model. According to the figure, the thickness of the connection between variables indicates the intensity of the influence relationship, and the thicker the connection, the greater the influence intensity. Based on the results, the overall structure of the model indicates that the four latent variables of spatial environmental resources, transportation resources, service facility resources, and re-source management all have a positive impact on the overall satisfaction of the residents in the two types of residential communities. In other words, the more satisfied residents are with the four, the more satisfied they are with the public resources of their communities. Furthermore, the service facility resources, spatial environmental resources, and resource management in the two types of residential community models interrelate, indicating that the increased satisfaction of residents with the residential management measures can result in their higher evaluation of spatial environmental resources and service facility resources.
In the old residential community model, the spatial environmental resources had the greatest effect on residents’ satisfaction (0.81). During the lockdown period, residents of old residential areas pay more attention to the quality conditions of residential squares, parks, and other spaces, whether the public space meets their daily needs, and their feelings about the size, facilities, and other aesthetic aspects.
In the new residential community model, the influence coefficient of the resource management variables is 0.88, which is the largest compared to the other latent variables. During the lockdown period, residents of new residential communities paid more attention to the management measures and their implementation when evaluating the residential public resources.

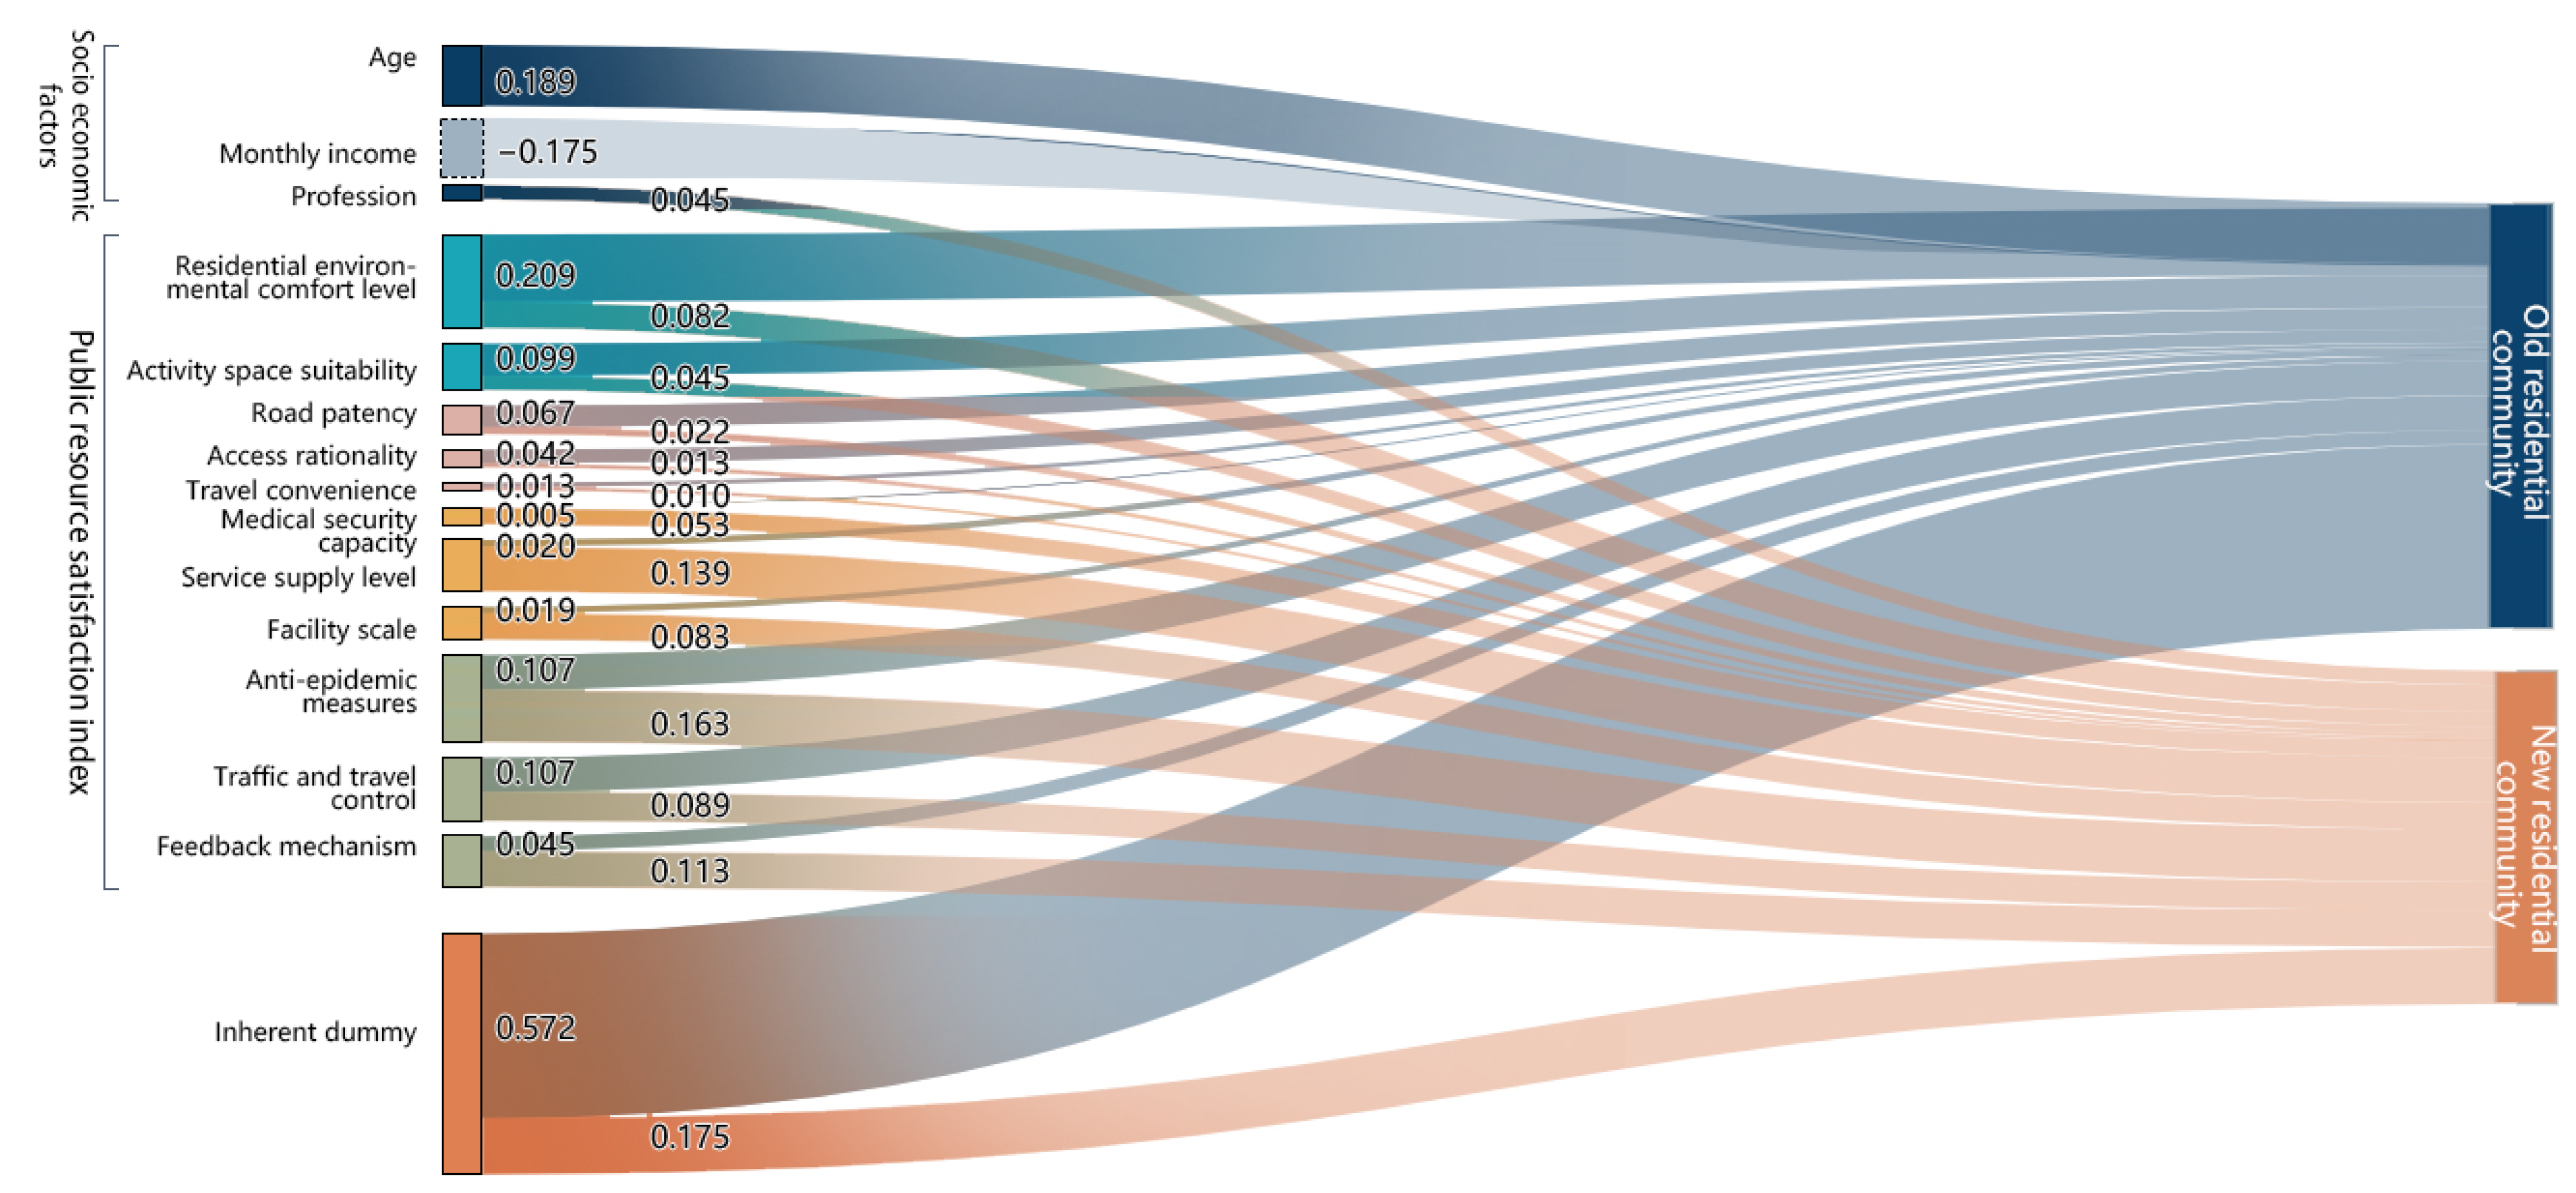
3.3. Results of SEM-Logit Model Analysis

Figure 4 shows the results of substituting the residents’ characteristics and the fit value of the latent variables into the ordered logit model for calculation. The regression coefficient represents the relative importance of each attribute factor to the overall satisfaction of the residents.
In the old residential community model, as seen from the socioeconomic attribute factors of residents, the significance of the age and monthly income of residents in old residential areas are 0.035 and 0.002, passing the significance test at 0.05. This indicates that these two factors have a significant influence on the overall satisfaction distribution of residents in old residential areas. Likewise, when combined with the positive and negative regression coefficients, it can be determined that the lower the income of the residents of the old residential communities, the higher their overall satisfaction with the public resources of the settlements. Furthermore, the public resource satisfaction index results (Table 4) indicate that in the old residential community model, the regression coefficient of residential environmental comfort level is the highest, indicating that it contributes the most to the overall satisfaction of residents. Therefore, residents’ satisfaction with residential public resources will increase by 0.209 units for every point increase in residential environmental comfort level. Additionally, anti-epidemic measures (0.107) and traffic and travel control (0.107) have a significant impact on overall satisfaction.
In the new residential community model, only the “occupation” factor areas pass the significance test. This suggests that when expressing the satisfaction level of the local residential district, residents from different walks of life have distinct focuses. Moreover, as seen from the public resource satisfaction index, the regression coefficient of the anti-epidemic measures in the newly built residential community model is the highest (0.163), suggesting that the extent of satisfaction with anti-epidemic measures has a large impact on the overall satisfaction of residents.

4. Discussion

Analysis on the Root of Differences in Satisfaction Degree

According to the statistical results shown in Table 4 and Figure 5, it can be seen that the influencing factors of satisfaction differences in old residential communities mainly include the environmental comfort level of residential communities, traffic and travel control, and service supply level, as the strong correlation coefficient between the evaluation indicators and overall satisfaction suggests that they are closely related. The satisfaction difference in newly built residential communities is more related to factors such as anti-epidemic measures, feedback mechanisms, and service supply levels. Comparing the effect sizes of each factor attribute, it can be stated that, during the lockdown period, the system and regulations of residential resource management generally have a greater impact on the overall impression of residents in new residential communities in terms of the allocation of public resources and service capacity. Additionally, residents of old residential communities pay more attention to factors of spatial environmental resources, whether the residential community is convenient for parking, and whether the activity square is still able to host their daily activity habits during the special period.
While the pandemic is still spreading across the world, lockdown will remain a major means of urban management in domestic pandemic prevention and control. For this reason, different outcomes reflected in the aforementioned satisfaction evaluation may shed some light on urban pandemic prevention and control as well as settlement governance:
  • Lockdowns further reveal the difference between old and new residential communities in the service supply system.
When analyzing reasons underlying Chinese settlements formation, Zhao Wei [37] stressed that, when described as old, a settlement is not only built a long time ago but also lags far behind new residential communities in residential functionality and design criteria. By comparing different versions of the Chinese Code of Urban Residential Areas Planning & Design, we may find that version 1993 implemented before 2000 specifies 1 m2 per capita public green area in residential public resource allocation and offers no standard public parking space size or underground parking design requirements, which makes it different from versions 2002 and 2016. It is highlighted by Liu Bing [38] and Wu Tianyan [39] that old communities largely rely on neighboring subdistricts to gain access to service facilities and they have developed a sort of co-existence with urban functions. By contrast, newly built settlements are more complete in matching services, which can independently maintain the fundamental public life of their residents. As revealed by data from the research report on residential satisfaction of green and pleasant settlement quality and architectural quality published by the ministry of housing and urban–rural development in 2021, 42.1% and 26.8% of residents’ outdoor activities are carried out outside settlements for old and newly built communities, respectively, in first tier cities such as Beijing, Shanghai, Guangzhou, and Changchun. In old communities, 63.7% of residents have no fixed parking space and have to park their cars outside on the street. By comparison, only 21.6% of residents living in newly built settlements are faced with this problem. Old and newly built communities are mostly supported by two distinct service supply systems in sustaining their residents’ public life.
However, with the implementation of a lockdown pattern in response to the pandemic outbreak, old communities are denied access to service functions in their neighboring street blocks, which intensifies the effect of their deficient settlement resources on the residents therein.
From the questionnaire question “Is there any demand for outdoor activities (non-collecting express delivery and shopping, etc.) during the lockdown?”, it can be seen that 62.9% of residents did engage in outdoor activities (as shown in Figure 6). In analyzing the data with regard to the item “Do you still maintain outdoor activities?”, it was found that only 32.5% of the residents in need still maintained regular outdoor activities. Based on this observation, it can be concluded that although residents have a relatively high willingness to participate in outdoor activities during the lockdown period, most activities are restricted by external factors and are hard to carry out. On the other hand, as many as 72.6% of residents live in old residential communities.
Moreover, a random interview with residents living in old residential communities disclosed that such residents largely believe their public activity space to be narrow in area, centralized in layout, at risk of spreading the pandemic, and unable to meet their exercise demands. In the meantime, though featuring richer public resources than older communities, newly built settlements are expected by their residents to provide better management services. It is noteworthy that as declared by many residents, newly built settlements should have more clearly defined property ownership and jurisdictions and should be equipped with specific management and control plans for public facilities and activity spaces therein. According to the above information, the differences between old and newly built communities in terms of service supply systems was amplified during lockdown, causing residents to face distinct public resource issues due to settlement patterns. This is finally reflected in factors influencing their satisfaction evaluation.
2.
Lockdown in residential areas brings in a change to residents’ satisfaction evaluation decision-making mechanism.
As suggested by the research findings of Zhan Dongsheng [40] regarding the satisfaction of residential public resources, overall satisfaction is greatly impacted by residents’ socioeconomic properties such as identity, age, academic background, and family structure. A distinct result is obtained here regarding the lockdown. According to the data listed in Table 4, correlation indexes between residents’ socioeconomic properties and overall satisfaction during the pandemic are rather low, as is the number of influencing factors. On the other hand, it is testified by Lv Fei [41], who found that the public resources satisfaction index is more affected by spatial material properties when residents are not perplexed by the pandemic. For example, in a pandemic-free period, residents are more concerned about public facilities’ quality (61.7%) and parking space sufficiency (23.3%) but paid least attention to public resources management measures (23.3%) when offering their satisfaction evaluation. This conclusion is distinct from the satisfaction evaluation in the lockdown period. The sorting of regression coefficients in Figure 4 indicates that when the lockdown was implemented, management measures had a great impact on residents’ satisfaction in both old and new residential communities. Thus, it can be inferred that the lockdown pattern for the anti-epidemic purpose has changed residents’ logic in evaluating intra-settlement public resource satisfaction. Residents’ attention is diverted from spatial material factors in the past to settlement management service ability now. Additionally, those settlement governance factors such as anti-epidemic measures and traffic control intensity would generate a more significant effect on residents’ overall satisfaction during the anti-epidemic period.
3.
Factors influencing satisfaction may guide settlement updating.
In light of the regression coefficients in the SEM-logit model, while we have calculated the importance of various factor attributes on residents’ satisfaction with public resources, it does not necessarily mean that the most important factor is the top priority for improvement. When a factor’s regression coefficient and satisfaction score are both high, improving the attribute factor would not be of much help to elevating the overall satisfaction level. To find out which attribute factor is most effective for improving overall satisfaction, this chapter uses the importance–satisfaction (I–S) rating [42,43] to quantify the priority levels of the improvement and transformation of various residential public resource factors. As one of the cluster analysis methods derived from the KANO model [44], the I–S rating distinguishes the information value of satisfaction-related factors. The calculation formula is as follows:
I S i = I i × D i = I i × ( 1 S i )
where ISi is the I–S score of factor i. The higher the I–S score of factor i, the more it needs to be improved. Ii is the importance score of factor i, reflecting the impact of the residents’ satisfaction with factor I on their overall satisfaction with public resources. Di is the dissatisfaction score of factor i. Si is the average satisfaction after normalization.
The I–S index and ranking identify the priority order of various public resource factors. That is, the higher the ranking of a factor attribute, the greater the benefits and the greater the increase in overall satisfaction for residents. According to the results (Table 5), the residential environmental comfort level ranks first in the I–S index (old residential communities), demonstrating that the old residential communities should focus on enhancing the environmental quality of the residential communities, which can increase residents’ satisfaction more effectively over time. Accordingly, the I–S ratings of indicators such as travel convenience and medical security capabilities are relatively low, indicating that these factor attributes currently meet the needs of residents and that the transformation is not urgently needed. In contrast to the I–S rating of old residential communities, in the newly built residential communities, anti-epidemic measures rank first while service supply (ranked 8th in the old residential communities) ranks second, so they develop key factors for transformation. In different types of residential communities, the transformation priority of public resources varies.
To optimize public resource factors, the study builds performance evaluation matrices based on importance and satisfaction scores and discusses how to improve these factors optimally. Figure 7 and Figure 8 show the results, in which the horizontal and vertical axes represent satisfaction and importance, respectively, and each matrix is divided into nine equal regions. Among them, the red zone includes low satisfaction and high importance factors that need to be transformed first; on the other hand, the purple zone includes high satisfaction and low importance factors that can temporarily remain unchanged and be monitored. The factors in the diagonal white zone need improvement, which can be made as appropriate depending on the residential communities. According to the performance evaluation matrix, the areas that need to be improved most are the environmental comfort level, anti-epidemic measures, and traffic control in old residential communities. Several key indicators, including road patency, medical security capacity, and facility size, are located in the purple zone, indicating that residential traffic and service facility resources can still secure residents’ lives during the closed-off period, so service standards should be maintained and improved as needed. In the performance evaluation matrix of the new residential communities, the resource factors in the red zone that need to be improved urgently are significantly more than those in the old residential communities. The environmental comfort level, service supply level, anti-epidemic measures, and feedback mechanisms of the residential communities should be prioritized in the planning process.

5. Conclusions

Settlement is both the front line and last line of defense in curbing pandemic outbreaks. It is also a critical carrier of socioeconomic resurrection. It is crucial to determine the matching relation between intra-settlement public resources and residents’ life demands during the lockdown period, as well as factors influencing residents’ satisfaction in enhancing settlement resilience and improving settlement governance capacity. Based on SEM-logit model analysis, the present study discussed both the impact mechanisms and improvement strategies of intra-settlement public resource elements on residents’ satisfaction. Our primary findings are as follows:
  • Based on empirical analysis, this study has proven that residents’ satisfaction in old and new residential communities differed significantly in terms of influencing factor composition, inter-factor interaction, and influence level. As revealed by the statistical model, residents’ overall satisfaction in old residential communities is more susceptible to spatial environmental resource, whereas that in new residential communities focuses more on public resource management measures;
  • By taking into account the element features of intra-settlement public resources, this study discussed the action mechanism of unmeasurable (latent) variables in the process of “objective environment–subjective evaluation” with a theoretical framework from cognitive psychology and proposed and verified an influence path model of public resource elements on satisfaction evaluation;
  • A comparative analysis of residential satisfaction degree findings during the pandemic-free period reveals that the lockdown policy adopted during the anti-epidemic period intensifies problems arising from differentiated service supply systems between old and new residential communities and displays them with factors influencing residents’ satisfaction evaluation. The policy also transforms the decision-making logic of residents’ satisfaction evaluation. Attention to settlement management capacity is one of the salient characteristics highlighted during the anti-epidemic period;
  • We also discussed how to guide settlement updating based on satisfaction evaluation outcomes. By referring to the I–S performance evaluation matrix, the present study quantitatively determined the priority of various public resources amid the transformation and upgrading of both old and new residential communities.
It is true that resilient community creation involves almost all aspects of a city, including its society, economy, production, life, and ecology. Such factors as the government’s modern governance level and public policy execution capacity have an impact on the implementation of settlement management patterns during pandemic prevention and control. Starting from residents’ satisfaction, this study discusses public resources allocation and utilization in settlements under a lockdown pattern. In subsequent studies, settlement planning and design theories in the post-pandemic period may be further enriched based on the improvement of various resources within settlements (e.g., ecology and architecture), as well as settlement management patterns, so as to offer data support for evaluation implementation.

Author Contributions

Conceptualization, Z.L. (Ze Liu) and R.W.; methodology, Z.L. (Ze Liu); software, R.W.; validation, Z.L. (Ze Liu), R.W. and Z.L. (Ziteng Liu); formal analysis, Z.L. (Ze Liu); investigation, R.W.; resources, Z.L. (Ze Liu); data curation, Z.L. (Ze Liu) and R.W.; writing—original draft preparation, R.W.; writing—review and editing, Z.L.(Ziteng Liu); visualization, Z.L. (Ziteng Liu); supervision, Z.L. (Ze Liu); project administration, Z.L. (Ze Liu); funding acquisition, Z.L. (Ze Liu). All authors have read and agreed to the published version of the manuscript.

Funding

This research was funded by the National Natural Science Foundation of China, grant number 51808010.

Institutional Review Board Statement

Ethical review and approval were waived for this study, due to this article does not involve human experiments or personal privacy, obtained the consent of the other party when doing the questionnaire, and we got a reply with unnecessary requirement of the approval after consulting the ethics committee, and did not touch the issue of publication.

Informed Consent Statement

Informed consent was obtained from all subjects involved in the study.

Data Availability Statement

Not applicable.

Conflicts of Interest

The authors declare no conflict of interest.

Appendix A

Table A1. Spatial environment characteristics of the study residential area under study.
Settlement IDGreening RatePer capita Green AreaRoad Area RatioAverage Parking Space Ratio Per HouseholdResidential Area (ha)Whether the Facilities Are Complete
Commercial FacilitiesMedical FacilitiesCultural and Sports Facilities
Old Residential
community
1271.214.40.725OO×
2251.715.30.831×OO
3262.114.80.721OOO
4311.313.70.619×O×
5331.715.90.833OOO
6281.515.6118OOO
New Residential
community
7312.317.61.224OOO
8303.118.41.826OOO
9332.116.71.319OOO
10312.118.91.621OOO
11322.617.71.522OOO
12312.819.11.528OOO
13322.217.11.230OOO

Appendix B

Spatial environment refers to the characteristics of the physical environment presented by a community’s public space, including features such as space scale, facility conditions, landscape greening, and physical environment. Accessibility of space to individuals, landscape greening, and environmental sanitation have been shown to have a positive impact on residents’ satisfaction [45].
Space layout consists of the structural characteristics of the public space in the community, including the transportation system and facility system, and is related to factors such as the rationality of entrances and exits, the suitability of the road environment, the adequacy of parking, and the size of service facilities [46].
In terms of public space management, studies have shown that community management and maintenance play a major role in residents’ satisfaction with public spaces [47]. This paper divides the management measures taken by the communities for the external public space during the pandemic into three major categories: pandemic prevention, facility services, and transportation and travel management.

Appendix C

We present here the samples collected during the formal investigation phase, not the pre-survey. In the pre-survey, 289 questionnaires were returned, with a valid response rate of 92.7%.

Appendix D

There are four steps involved in the data processing:
  • Calculate the score variance and average and remove highly repetitive data samples with a variance of 0 or an average close to one;
  • Eliminate questionnaire data samples with abnormal values (more than twice the deviation of the average response time of other questionnaires) such as excessively short response times;
  • Remove data samples with incomplete information;
  • Discard samples that do not match the answer logic (such as a mismatch between age and income).

Appendix E

Because these are scale questionnaires, the number of returned questionnaires exceeds ten times the scale items. Meanwhile, within the 95% confidence interval, with a population of about 5 million in the downtown area of Changchun and a maximum coefficient of variation of 0.5, the sample size in this survey is 453, which surpasses the necessary number (approximately 385) and is thus statistically significant. The formula for calculating the sample size is:
n = P ( 1 P ) / e 2 Z 2 + P ( 1 P ) N
where e is the precision value percentage of the known survey results; Z is the coefficient of the confidence interval; P is the precision of the proportion estimation, that is, the sample coefficient of variation; and N is the total number of samples.

References

  1. Chen, S.S.; Zhai, G.F.; Ge, Y.F.; Ren, H.F. Research on Community Governance and Resilience lmprovement Under Epidemic Risk of Infectious Diseases Based on QRH Philosophy. Urban Plan. Int. 2021, 11, 1–15, (In Chinese with English Abstract). [Google Scholar]
  2. Hu, R. Enlightenment of International Community Experience on Epidemic Prevention to China. J. Beijing City Univ. 2020, 2, 1–4+14, (In Chinese with English Abstract). [Google Scholar]
  3. Duan, J.; Yang, B.; Zhou, L. Planning improves city’s immunity: A written conversation on COVID-19 breakout. City Plan. Rev. 2020, 44, 115–136, (In Chinese with English Abstract). [Google Scholar]
  4. Wang, W.W.; Wang, B.Y.; Li, L.L. Governance System’s Application of Combination of Three Governance to Epidemic Prevention and Governance in Grassroots Community: A Case Study of Tongshan. Urban Dev. Stud. 2020, 27, 8–12, (In Chinese with English Abstract). [Google Scholar]
  5. Zheng, T.M.; Liu, H.L. Exploration of the Built-Environmental Elements that lnfluence the Spread of COVID-19 Pandemic on Community Scale: A Case Study of Wuhan, China. Mod. Urban Res. 2020, 10, 20–29, (In Chinese with English Abstract). [Google Scholar]
  6. Liu, J.Y. Community Epidemic Prevention Planning and Governance System against COVID-19 Epidemic. Planners 2020, 36, 86–89, (In Chinese with English Abstract). [Google Scholar]
  7. Wang, Z.Z.; Gu, Z.M. Viewing the Function of Social Workers in Unexpected Healthy Accident. Soc. Sci. J. Univ. Shanxi 2004, 5, 32–35, (In Chinese with English Abstract). [Google Scholar]
  8. Makwana, N. Public health care system’s preparedness to combat epidemics after natural disasters. J. Fam. Med. Prim. Care 2020, 9, 5107. [Google Scholar] [CrossRef]
  9. Corburn, J. Confronting the challenges in reconnecting urban planning and public health. Am. J. Public Health 2004, 94, 541–546. [Google Scholar] [CrossRef] [PubMed]
  10. Barton, H. Urban Planning for Healthy Cities. J. Urban Health 2013, 90, 129–141. [Google Scholar] [CrossRef] [PubMed] [Green Version]
  11. Giles-Corti, B. Achieving the SDGs: Evaluating indicators to be used to benchmark and monitor progress towards creating healthy and sustainable cities. Health Policy 2020, 124, 581–590. [Google Scholar] [CrossRef]
  12. Iswahyudi, F.; Darwin, M.; Hadna, A.H.; Kutanegara, P.M. Kontekstualisasi Adopsi Kebijakan: Studi Kasus Kebijakan Pengendalian COVID-19 di Korea Selatan. J. Borneo Adm. 2020, 16, 117–136. [Google Scholar] [CrossRef]
  13. Khomenko, S.; Nieuwenhuijsen, M.; Ambros, A.; Wegener, S.; Mueller, N. Is a liveable city a healthy city? Health impacts of urban and transport planning in Vienna, Austria. Environ. Res. 2020, 183, 109238. [Google Scholar] [CrossRef]
  14. Mackworth-Young, C.R.; Chingono, R.; Mavodza, C.; McHugh, G.; Tembo, M.; Chikwari, C.D.; Weiss, H.A.; Rusakaniko, S.; Ruzario, S.; Bernays, S. Community perspectives on the COVID-19 response, Zimbabwe. BWHO 2021, 99, 85–91. [Google Scholar] [CrossRef] [PubMed]
  15. Zhang, Y.; Cao, P.; Meng, J.; Qiu, J.; Hu, Q.; Cheng, L. Exploration of the Evaluation and Optimization of Community Epidemic Prevention in Wuhan Based on a DEA Model. IJERPH 2020, 17, 7633. [Google Scholar] [CrossRef]
  16. Heslop, D.; MacIntyre, R.; Gerber, B. The adaptability and resilience of cities to major epidemics. In Inoculating Cities; Rebecca, K., Matthew, B., Eds.; Academic Press: Cambridge, MA, USA, 2021; Chapter 10; pp. 171–199. [Google Scholar]
  17. Marais, B.; Sorrell, T. Pathways to COVID-19 ‘community protection’. Int. J. Infect. Dis. 2020, 96, 496–499. [Google Scholar] [CrossRef] [PubMed]
  18. Liang, H.; Meng, J.M.; Wu, X.Y. Suggestions for Old Communities Responding to Public Health Emergencies and Urban Emergency Management. Constr. Sci. Technol. 2020, 6, 12–14, (In Chinese with English Abstract). [Google Scholar]
  19. Emine, Y.K.; Ulusoy, M. The Analysis of User Satisfaction in The New Trends of Housing Gated Communities. Selcuk Univ. J. Eng. Sci. Technol. 2014, 2, 1. [Google Scholar]
  20. Cristina, F.Z.; David, A.; Padura, A.B. Dwelling conditions and life satisfaction of older people through residential satisfaction. J. Environ. Psychol. 2017, 49, 1–7. [Google Scholar]
  21. Azad, S.; Ghandehari, M. Spatio-temporal study of the determinants of residential satisfaction in new york city during COVID-19 using crowdsourced data. ISPRS Ann. Photogramm. Remote Sens. Spat. Inf. Sci. 2021, VIII-4/W1-2021, 3–10. [Google Scholar] [CrossRef]
  22. Youssoufi, S.; Houot, H.; Vuidel, G.; Pujol, S.; Mauny, F.; Foltête, J.C. Combining visual and noise characteristics of a neighborhood environment to model residential satisfaction: An application using GIS-based metrics. Landsc. Urban Plan. 2020, 204, 103932. [Google Scholar] [CrossRef]
  23. Ren, H.H.; Folmer, H. Determinants of residential satisfaction in urban China: A multi-group structural equation analysis. Urban Stud. 2017, 54, 1407–1425. [Google Scholar] [CrossRef]
  24. Wang, D.; He, S.; Webster, C.; Zhang, X. Unravelling residential satisfaction and relocation intention in three urban neighborhood types in Guangzhou, China. Habitat Int. 2019, 85, 53–62. [Google Scholar] [CrossRef]
  25. Zainab, L.A.; Richard, T. Residential satisfaction in low-density Australian suburbs: The impact of social and physical context on neighbourhood contentment. J. Environ. Psychol. 2018, 56, 36–45. [Google Scholar]
  26. Riccardo, B.; Alessandra, M.; Federica, P. Handling Heterogeneity in Assessing Residential Satisfaction. Geogr. Anal. 2020, 53, 447–466. [Google Scholar]
  27. Wanita, S.A.; Sugeng, T. Quality of common space in traditional residential area in perspective of use satisfaction. IOP Conf. Ser. Mater. Sci. Eng. 2018, 407, 012072. [Google Scholar]
  28. Tang, Y. Challenges and Responses of Community Governance in the Prevention and Control of Novel Coronary Pneumonia: From Perspectives of Urban-rural Planning and Public Health. Nanjing J. Soc. Sci. 2020, 3, 8–14+27, (In Chinese with English Abstract). [Google Scholar]
  29. Tu, Q.L.; Zhang, T.S. Function of grassroots community in novel coronavirus pneumonia prevention and control. J. Hubei Norm. Univ. (Philos. Soc. Sci.) 2020, 40, 60–64, (In Chinese with English Abstract). [Google Scholar]
  30. Hu, P.; Cong, X.J. Differentiation of Satisfaction on Public Service Facilities, Nanjing. Planners 2019, 35, 64–70, (In Chinese with English Abstract). [Google Scholar]
  31. Gao, Y.N. Travel Satisfaction and Subjective Well-Being: A Behavioral Modeling Perspective. Ph.D. Dissertation, Chang’an University, Xi’an, China, 2018. (In Chinese with English Abstract). [Google Scholar]
  32. Zou, K. Theory, Method and Application of Community Service Public Satisfaction Measurement. Ph.D. Dissertation, Graduate School of National University of Defense Technology, Changsha, China, 2008. (In Chinese with English Abstract). [Google Scholar]
  33. Lei, P.; Wu, Q. An NCME instructional module on introduction to structural equation modeling: Issues and practical considerations. Educ. Meas. Issues Pract. 2007, 26, 33–43. [Google Scholar] [CrossRef]
  34. Amerigo, M.; Aragones, J. A Theoretical and Methodological Approach to the Study of Residential Satisfaction. J. Environ. Psychol. 1997, 17, 47–57. [Google Scholar] [CrossRef]
  35. Han, S.; Jun, H.J. Differential residential satisfaction and factors affecting. Korean Public Adm. Rev. 2021, 55, 409–446. [Google Scholar]
  36. Boomsma, A. The robustness of LISREL against small sample sizes in factor analysis models. Syst. Under Indirect. Obs. Causality Struct. Predict. 1982, 1, 149–173. [Google Scholar]
  37. Zhao, W. Review and Prospect: China’s urban housing construction and community evolution since 1949. Time + Archit. 2009, 2, 16–19, (In Chinese with English Abstract). [Google Scholar]
  38. Liu, B.; Zhang, J.Q. Study on planning measurements to residential segregation. City Plan. Rev. 2002, 12, 82–85+89, (In Chinese with English Abstract). [Google Scholar]
  39. Wu, T.Y.; He, F. On setting planning standards for public facilities in urban residential areas. City Plan. Rev. 2011, 35, 13–18, (In Chinese with English Abstract). [Google Scholar]
  40. Zhan, D.S.; Zhang, W.Z.; Yu, J.H.; Meng, B.; Dang, Y.X. Analysis of influencing mechanism of residents’ livability satisfaction in Beijing using geographical detector. Prog. Geogr. 2015, 34, 966–975, (In Chinese with English Abstract). [Google Scholar]
  41. Lv, F.; Ding, M.; Sun, P. Resident satisfaction-based updating strategies of old communities: A case study of harbin demonstration communities. Areal Res. Dev. 2019, 38, 75–79+91. [Google Scholar]
  42. Li, Y.; Gao, X.; Yang, L.; Guo, J. Research on Walking Environment Satisfaction of Residents Based on Ordered Probit Model—A Case Study of Gulangyu. Chin. Landsc. Archit. 2020, 36, 90–94, (In Chinese with English Abstract). [Google Scholar] [CrossRef]
  43. Song, Y.K. The Study of Public Space Satisfaction in New Centralized Communities—Taking the Fringe Area of Suzhou as an Example. Master’s Thesis, Suzhou University of Science and Technology, Suzhou, China, 2018. (In Chinese with English Abstract). [Google Scholar]
  44. Chen, S.H.; Pai, F.Y.; Yeh, T.M. Using the Importance–Satisfaction Model and Service Quality Performance Matrix to Improve Long-Term Care Service Quality in Taiwan. Appl. Sci. 2019, 10, 85. [Google Scholar] [CrossRef] [Green Version]
  45. Xie, B.; Wei, W.; Zhou, J. Senior Community Space Evaluation and Planning. Planners 2015, 31, 5–11+33, (In Chinese with English Abstract). [Google Scholar]
  46. Zou, Q.Q.; Wang, Y.; Li, G.B. Network structure optimization of public space in new concentrated communities based on SNA. Prog. Geogr. 2016, 35, 829–838, (In Chinese with English Abstract). [Google Scholar]
  47. Yang, Y.; Lin, L.; Zhong, Z.P.; Ou, Y.Y.; Xu, Q.; Meng, M.Y.; Hao, S. Comprehensive evaluation and spatial differentiation of community resilience in Guangzhou based on response of the city to public health hazards. Acta Geogr. Sin. 2019, 74, 266–284, (In Chinese with English Abstract). [Google Scholar]
Figure 1. Conceptual model of residents’ satisfaction with public resources.
Sustainability 14 04385 g001
Figure 2. Statistical result of satisfaction with public resources (N = 412).
Sustainability 14 04385 g002
Figure 3. SEM of satisfaction with public resources in residential areas.
Sustainability 14 04385 g003
Figure 4. Analysis results of the SEM-logit model.
Sustainability 14 04385 g004
Figure 5. Correlation heat map of overall residential satisfaction.
Sustainability 14 04385 g005
Figure 6. Comparison of residents’ outdoor activity.
Sustainability 14 04385 g006
Figure 7. Performance evaluation matrix for old residential communities.
Sustainability 14 04385 g007
Figure 8. Performance evaluation matrix for new residential communities.
Sustainability 14 04385 g008
Table 1. Related variables of satisfaction scale and positive explanation.
Category (Latent Variable)Serial NumberSatisfaction Index (Observed Variable)Positive Explanation
Spatial environment resources1Residential environmental comfort levelThe residential community has a luxuriant green landscape and comfortable road environment, thus delivering a satisfactory walking experience for the residents during the lockdown period.
2Activity space suitabilityThe conditions of the public activity venues in the residential community can meet the daily activity needs of the residents during the lockdown period.
Transportation resources3Road patencyDuring the lockdown period, motor vehicle traffic in the residential community flowed freely without on-road parking or traffic jams.
4Access rationalityDuring the lockdown period, the designated entrances and exits of the residential communities were located at a reasonable distance from public transportation and urban facilities.
5Travel convenienceBefore and after the lockdown, the travel distance has not been significantly affected, and it was relatively convenient to go out.
Service facility resources6Medical security capacityThe residential community is equipped with health service stations with sufficient handling capacity. During the lockdown period, the residents’ daily medical needs could be met, and the supply of medicines could be guaranteed.
7Service supply levelResidential convenience supermarkets offer a complete supply of goods and a variety of community services, with the ability to meet the daily needs of residents during the lockdown period.
8Facility scaleThe area of service facilities such as convenience supermarkets, barber shops, and express delivery stores in the residential community was adequate so that residents could utilize them orderly instead of crowding during the lockdown period.
Resource management9Anti-epidemic measuresDuring the lockdown period, the garbage in the residential community could be cleared and transported in time, and public places were disinfected regularly.
10Traffic and travel controlDuring the lockdown period, strict inspections were carried out on the entrances and exits of residential communities, which could effectively surveil non-residential personnel and vehicles.
11Feedback mechanismDuring the lockdown period, the residential community management created a feedback channel for residents’ opinions and could respond to and resolve residents’ complaints in a timely manner.
Table 2. Characteristics of our sample.
ProjectSub-Optionn%
Type of communityOld residential community *20449.5%
New residential community *20850.5%
Gendermale20148.8%
Female21151.2%
AgeUnder 256515.7%
25–45 years old15036.4%
46–60 years old14635.6%
Over 60 years old5112.3%
ProfessionSelf-employed and service industry personnel8119.6%
Employees of state agencies and enterprises16339.6%
student5413.2%
retiree4711.4%
other6716.2%
Monthly incomeBelow 2000 CNY9623.3%
2000–5000 CNY15537.7%
5000–8000 CNY12931.3%
8000 CNY and above327.7%
* Old residential community: residential quarters that were built before 2000 in cities and counties (county towns) with backward public facilities that impact on the basic life of residents, resulting in high demands for transformation. New residential community: residential quarters built after 2000 in cities and counties (county towns).
Table 3. Test results of data reliability and validity.
Type of SettlementLatent VariableNumber of Measurement VariablesReliabilityValidity
Old residential communityTotal110.7250.729
Spatial environment resources20.7180.704
Transportation resources30.7360.776
Service facility resources30.7010.701
Resource management30.7170.744
New residential communityTotal110.7430.704
Spatial environment resources20.7390.706
Transportation resources30.7540.718
Service facility resources30.7090.741
Resource management30.7470.754
Table 4. Correlation analysis of resident satisfaction 1.
VariableCorrelation Coefficient of Overall Satisfaction
Old residential CommunityNew Residential Community
Socio economic factors1Gender0.167 **
2Profession0.122 *
3Monthly income−0.101 *
Public resource satisfaction index1Residential environmental comfort level0.550 **0.305 **
2Activity space suitability0.251 **0.147 *
3Road patency0.308 **0.163 *
4Access rationality0.183 *0.151 *
5Travel convenience0.162 *0.178 *
6Medical security capacity0.135 *0.182 *
7Service supply level0.340 **0.318 **
8Facility scale0.125 *0.244 **
9Anti-epidemic measures0.332 **0.425 **
10Traffic and travel control0.491 **0.246 **
11Feedback mechanism0.142 *0.321 **
1 “—” means that it failed the significance test at the 0.05 level, “*” means it passed the 0.05 level test, “**” means it passed the 0.01 level test.
Table 5. I–S index analysis results.
IndexImportanceSatisfactionI–S IndexPriority Promotion Level
Old Residential CommunityNew Residential CommunityOld Residential CommunityNew Residential CommunityOld Residential CommunityNew Residential CommunityOld Residential CommunityNew Residential Community
Residential environmental comfort level0.2090.0820.270.200.15260.065615
Traffic and travel control0.1070.0890.220.200.08350.071224
Anti-epidemic measures0.1070.1630.240.210.08130.128731
Activity space suitability0.0990.0450.380.340.06130.029747
Road patency0.0670.0220.350.300.04350.015459
Feedback mechanism0.0450.1130.310.250.03100.084763
Access rationality0.0420.0130.340.230.02770.0100710
Service supply level0.0200.1390.180.200.01640.111282
Facility scale0.0190.0830.290.340.01350.054796
Travel convenience0.0130.0100.490.550.00660.00451011
Medical security capacity0.0050.0530.470.460.00260.0286118
Publisher’s Note: MDPI stays neutral with regard to jurisdictional claims in published maps and institutional affiliations.

