Accounting for Underreporting in Mathematical Modeling of Transmission and Control of COVID-19 in Iran
 Meead Saberi1*
  Homayoun Hamedmoghadam2
  Kaveh Madani3
  Helen M. Dolk4
  Andrei S. Morgan5,6
  Joan K. Morris7
  Kaveh Khoshnood8
  Babak Khoshnood5
- 1Research Centre for Integrated Transport Innovation, School of Civil and Environmental Engineering, University of New South Wales, Sydney, NSW, Australia
- 2Department of Civil Engineering, Monash University, Melbourne, VIC, Australia
- 3Council on Middle East Studies, The Macmillan Center for International and Area Studies, Yale University, New Haven, CT, United States
- 4School of Nursing, Faculty of Life and Health Sciences, University of Ulster, Newtownabbey, United Kingdom
- 5Epidemiology and Biostatistics Sorbonne Paris Cité Research Center (U1153), INSERM, Paris, France
- 6Institute for Womens' Health, University College of London, London, United Kingdom
- 7Population Health Research Institute, St. George's, University of London, London, United Kingdom
- 8Yale School of Public Health, New Haven, CT, United States
Iran has been the country most affected by the outbreak of SARS-CoV-2 in the Middle East. With a relatively high case fatality ratio and limited testing capacity, the number of confirmed cases reported is suspected to suffer from significant underreporting. Therefore, understanding the transmission dynamics of COVID-19 and assessing the effectiveness of the interventions that have taken place in Iran while accounting for the uncertain level of underreporting is of critical importance. In this paper, we developed a compartmental transmission model to estimate the time-dependent effective reproduction number since the beginning of the outbreak in Iran. We associate the variations in the effective reproduction number with a timeline of interventions and national events. The estimation method accounts for the underreporting due to low case ascertainment. Our estimates of the effective reproduction number ranged from 0.66 to 1.73 between February and April 2020, with a median of 1.16. We estimate a reduction in the effective reproduction number during this period, from 1.73 (95% CI 1.60–1.87) on 1 March 2020 to 0.69 (95% CI 0.68–0.70) on 15 April 2020, due to various non-pharmaceutical interventions. The series of non-pharmaceutical interventions and the public compliance that took place in Iran are found to be effective in slowing down the speed of the spread of COVID-19. However, we argue that if the impact of underreporting is overlooked, the estimated transmission and control dynamics could mislead public health decisions, policy makers, and the general public.
Introduction
The outbreak of SARS-CoV-2 in Iran was first officially announced in February 2020, 2 months after the initial outbreak in Wuhan, China [1]. Iran's patient zero is believed to have been a merchant from Qom who had traveled to China [2]. Despite the initial signs of a spread in Qom, the government declined to place the city under quarantine to contain the epidemic at an early stage for various technical, socio-economic, religious, and security reasons [3]. The first local non-pharmaceutical interventions, such as school and university closures, were put in place a few days after the official acknowledgment of the first cases in Qom and Tehran [4]. Since then, various public health control measures at the local and national levels were taken that are believed to have altered the course of the outbreak. See Figure 1 for a spatial illustration of the spread throughout the country by province in the first week since the official announcement of the first case (Supplementary Material).
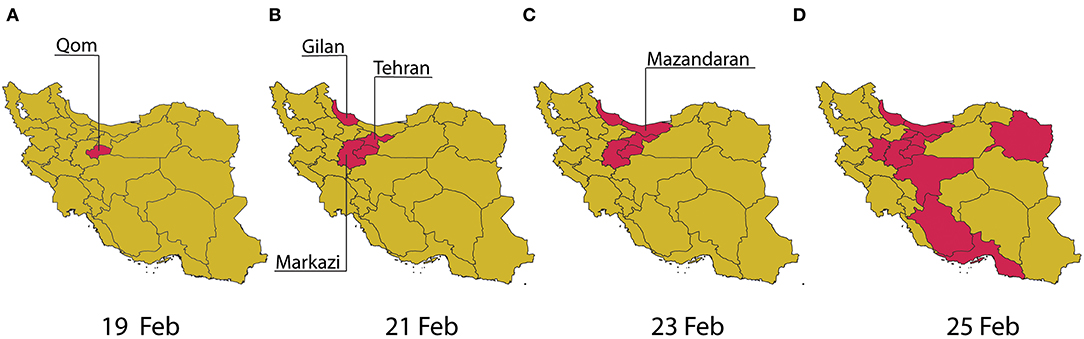
Figure 1. Spatial illustration of the spread of COVID-19 in Iran by province in the first week of the official outbreak announcement from 19 February to 25 February 2020 (A–D).
The relatively high case fatality ratio (CFR), defined as the total number of deaths over the total number of infected cases, in Iran's official reports after the first week since the official declaration of the first case (16.8%) has raised questions on the true number of cases in the country [5, 6]. The testing protocol in Iran at the early stages of the outbreak was limited to hospital admissions of patients with severe symptoms. While Iran later extended the COVID-19 diagnostic testing capacity to patients with milder symptoms, it is believed that the under-ascertainment of cases remains high. While a number of studies have already explored the dynamics of the spread of COVID-19 in different countries with various methodologies [7–10] and its association with travel restrictions and other public health interventions [11, 12], undocumented infections and how they could affect the spread of SARS-CoV-2 in a population has been a less explored area in the rapidly growing field of COVID-19 literature [13].
This study aims to understand the transmission dynamics of COVID-19 in Iran and to assess the effectiveness of the control measures that were put in place over time through estimation of the effective reproduction number R(t), defined as the average number of susceptible persons infected by an infected person during their infectious period at a given time in the course of the epidemic. We assessed R(t) in relation to a timeline of national events and non-pharmaceutical interventions. In the absence of timely and reliable data, modeling can provide helpful answers, including the degree of plausible uncertainty in different estimates and the effectiveness of non-pharmaceutical interventions. By providing explicit and clear information about model assumptions and parameters, modeling can also foster scientific discussion of data gaps and what can be done to improve outbreak-related estimates by borrowing information available elsewhere. Finally, models can be developed and presented using both average estimates and measures of their uncertainty or, alternatively, as scenarios that can illustrate possible developments of the epidemic under various conditions.
Methods
Data Sources
We use official time-series reports of the number of confirmed cases, recovered cases, and deaths from the World Health Organization (WHO) [1] and Iran's Ministry of Health and Medical Education [14]. The first confirmed case was reported on 19 February 2020, which is assumed as the beginning of the outbreak of COVID-19 in Iran.
Mathematical Model
We describe the dynamics of spread using a variation of the susceptible-exposed-infected-recovered (SEIR) model, distinguishing between fatal and recovered cases combined with an estimate of the percentage of symptomatic cases using delay-adjusted CFR (Supplementary Material) (see Figure 2). The model accounts for the time between exposure-to-onset of symptoms (or confirmation), also known as an incubation period, assuming a gamma distribution with an average of 5.5 days and a standard deviation of 2.3 days [15]. We also assume the time from symptoms onset-to-death and -to-recovery both follow a gamma distribution with an average of 22.3 days and a standard deviation of 9.4 days, and an average of 22.2 days and a standard deviation of 10 days, respectively [16]. The size of the initial susceptible population is assumed to be 80 million.
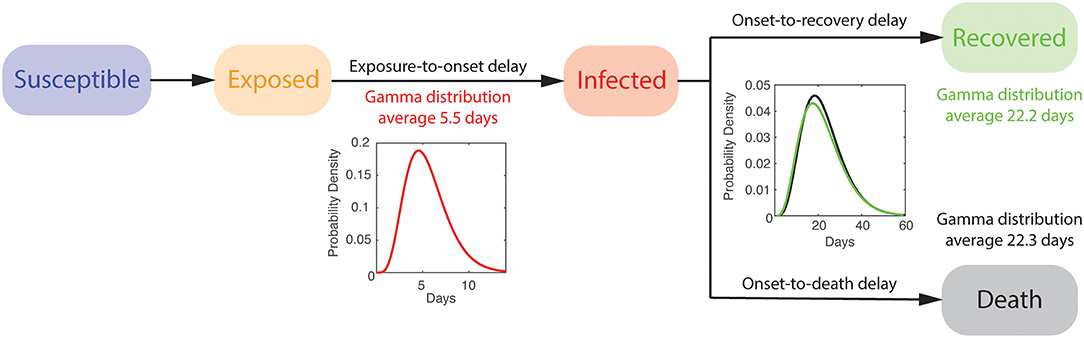
Figure 2. Schematic illustration of the formulated mathematical epidemic model.
Time-Dependent Effective Reproduction Number
The basic reproduction number, R0, a fundamental measure in infectious disease epidemiology and public health, is defined as the average number of susceptible persons infected by an infected person during their infectious period in a fully susceptible population. R0 is known to fluctuate if the social contact rate in the population changes over time or space. Since R0 assumes an entirely susceptible population, several studies from the literature [17, 18] suggest using the time-dependent effective reproduction number R(t) when examining the effect of various interventions including vaccination, social distancing, and quarantine. R(t) is defined similarly to R0 but is not limited to the assumption of a completely susceptible population. Here, we use empirical data from Iran to trace changes in R(t) over a rolling 7-day period since the beginning of the COVID-19 outbreak and describe its association with various interventions (e.g., school closures, social distancing, and bans on public gatherings) that were enacted by the public and government.
Various methods exist to estimate R0 [and R(t)] [19–21]. Here, we use the same framework described in Figure 2 in which the parameters of the formulated SEIR model are inferred through an optimization problem. To estimate the parameters of the developed SEIR model, we formulate an ordinary least squares (OLS) minimization [22]. We use pattern search as a derivative-free global optimization algorithm [23] to find the model parameters that minimizes the sum of the normalized root mean squared error (RMSE) of the number of infected εi, recovered εr, and removed cases εf. R(t) is then calculated using a rolling time window of 7 days to capture the evolving trend of the spread over time due to various changes in the social network contact rate. The calculated R(t) may be overestimated during the early stage of an outbreak [24] due to different reasons, including the impact of imported cases and heterogeneity in subpopulations (e.g., older than 60 years old) with higher transmission rates.
Accounting for Underreporting
We account for the underreporting of the number of infected cases in the official confirmed data using delay-adjusted case fatality ratio (CFR) approach [25]. This approach assumes that the time from hospitalization-to-death has a known statistical distribution and uses this distribution to estimate when the people who died from COVID-19 would have been reported as being infected (Supplementary Material). The case fatality ratio is the ratio of the numbers of deaths over the numbers of reported infections calculated at the time of reporting, not the time of death. This is extremely important for rapidly evolving epidemics. The method, however, does not account for underreporting in fatality cases. The distribution of the time from confirmation-to-death is assumed to follow the same distribution as of the time from hospitalization-to-death, following a lognormal distribution with a mean of 13 days and a standard deviation of 12.7 days [26]. Here, we assume that the estimate for percentage of symptomatic COVID-19 cases reported for Iran follows a lognormal distribution (same distribution type as of the time from hospitalization-to-death) with a mean of 9.9% and a standard deviation of 4% based on the latest estimates in the literature [25]. This is based on the assumption of a baseline CFR of 1.4%. We assume the underreporting level remains constant over time.
Model Limitations
The developed model does not take into account the imported cases. The model also does not capture the impact of quarantine and self-isolation on confirmed cases. While the model produces stochastic outcomes due to various delay distributions used as inputs, the model parameters are deterministic. The model does not take into account the population age distribution. It is also assumed that underreporting remains unchanged over time.
Results
We estimated that R(t) varied between 1.73 and 0.69 during March to April 2020 in Iran, with a median of 1.16. We estimated a reduction in R(t) from early-March to mid-April, from 1.35 (95% CI 1.31–1.39) on 8 March 2020 to 0.69 (95% 0.68–0.70) on 15 April 2020, due to control measures that took place. See Figure 3A for a timeline of interventions and events and Figure 3B for temporal variations of estimated R(t).
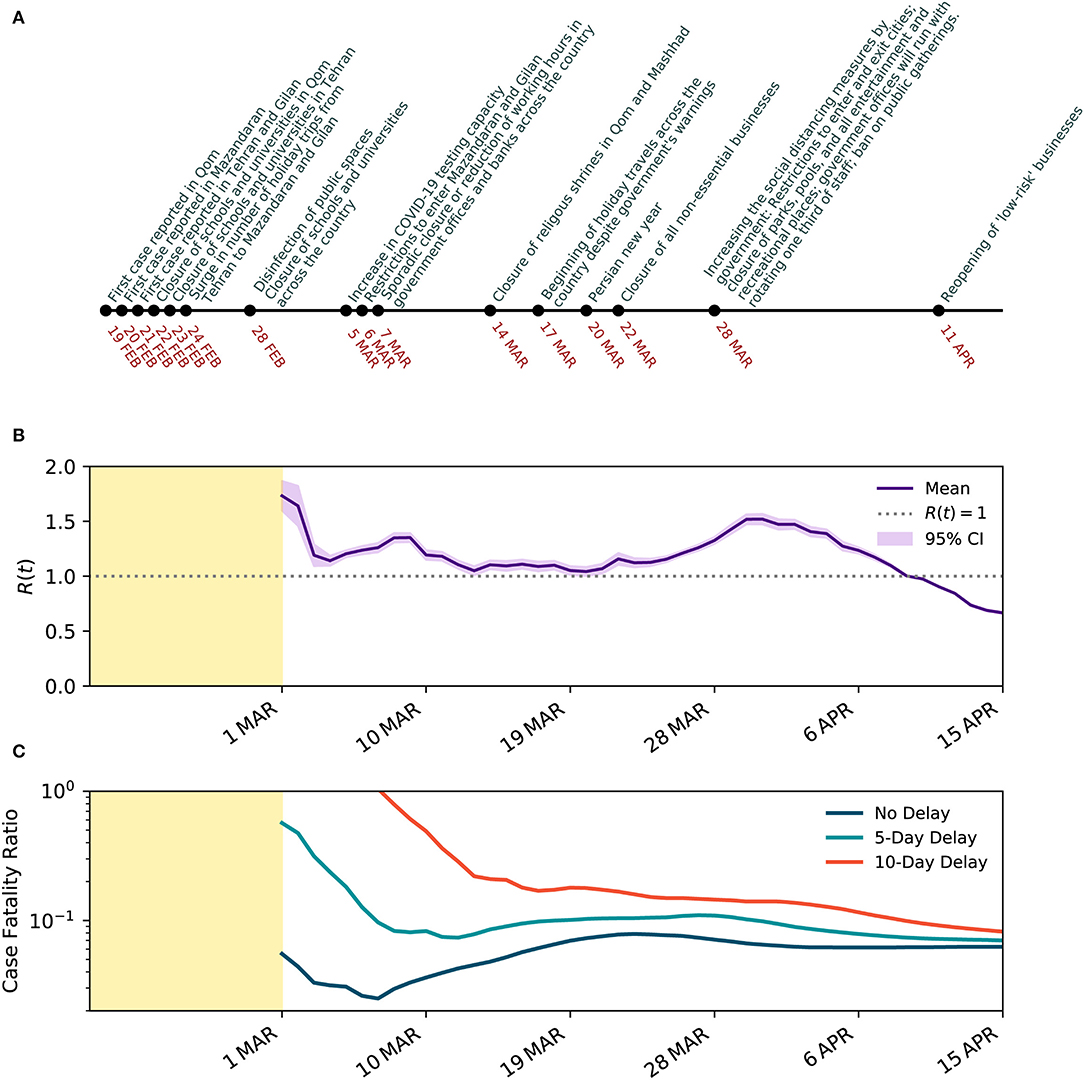
Figure 3. Temporal evolution of SARS-CoV-2 transmission characteristics in Iran. (A) Timeline of events and interventions that took place since the first case was reported on 19 February 2020. (B) Estimated effective reproduction number R(t) with 95% CI over a 7-day rolling window when underreporting is taken into account. (C) Estimated CFR with and without delay adjustment over the same time period in a semi-log scale.
The CFR on 25 February 2020, before adjusting for the time from diagnosis-to-death, was 16.84%. With more data emerging after the second week, the CFR dropped to 4.4% on the 14th day since the declared beginning of the outbreak on February 19, 2020. Later, between 15 March 2020 and 12 April 2020, the CFR stabilized between 5.2 and 7.8% with a mean of 6.7% (see Figure 3C). With the wider spread of COVID-19 across the country, the CFR increased to 7.86% on 23 March 2020. However, the CFR declined and plateaued around 6.2% between 1 and 15 April 2020. The relatively high CFR could correspond to a significant level of underreporting of the infected cases and an overwhelmed health system. Given the wide distribution of the time from confirmation-to-death of COVID-19, we also explore the delay-adjusted CFR with 5- and 10-day delay periods, as examples. The dynamics of the delay-adjusted CFR with a 10-day delay suggests that the CFR has been gradually reducing in Iran from 17.97% on 16 March 2020 to 8.20% on 12 April 2020.
When underreporting of infected cases is overlooked, the estimated effective reproduction number began from 5.67 (95% CI 5.48–4.86) on 1 March 2020 and reduced to 0.70 (95% CI 0.69–0.71) on 15 April 2020, suggesting the outbreak peak has already occurred on 8 April 2020 when R(t) goes below 1, about 50 days from the confirmation of the first case. The outbreak is also likely to continue until the end of 2020 (see Figure 4). The estimates of the effective reproduction number were consistently larger during the early stage of the outbreak when underreporting is overlooked compared to when underreporting is taken into account. However, the estimated effective reproduction numbers converged as the number of infected cases approached the peak. The convergence of the estimates can be partly explained by the fact that the effective reproduction number is more dependent on the rate of change in the infected and recovered cases rather than their absolute numbers. Results also suggest that the impact of control measures on the effective reproduction number is significantly overestimated when underreporting is not taken into account.
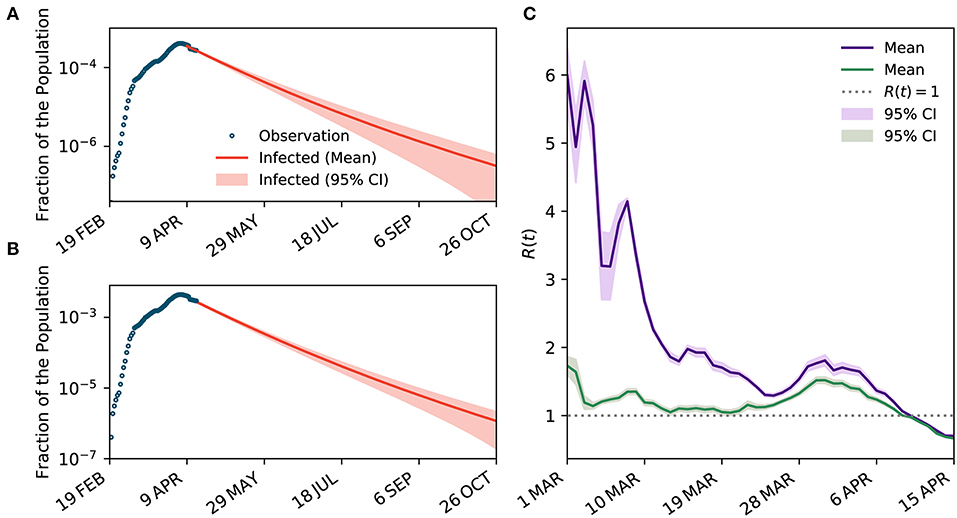
Figure 4. The impact of underreporting on the estimated dynamics of transmission. (A,B) The projected curves for the number of infected cases when underreporting is not considered and when it is taken into account, respectively. (C) Temporal variations of R(t) when underreporting is overlooked (purple curve) and when it is taken into account (green curve).
With the gradual reduction of the effective reproduction number to below one and the increasing pressure on an already fragile economy because of the implemented control measures, the government is seeking an exit strategy and is considering easing some of the restrictions. Here, we conduct a scenario analysis to understand how three different scenarios could change the projected outlook of the outbreak in Iran: (i) maintaining the same level of control measures as of 12 April 2020; (ii) intensifying the measures to increase physical distancing, represented by a 20% reduction in the reproduction number; and (iii) partially lifting the restrictions to ease physical distancing, represented by a 20% increase in the reproduction number (see Figure 5). To estimate the number of ICU beds needed, we assume 5% of confirmed cases require intensive care [27]. We found that in all scenarios the projection of patients requiring ICU admission exceeds the original ICU capacity. Note that no official information is available on the expanded ICU capacity. As of 12 April 2020, both projected curves start above the ICU capacity. Easing the restrictions can quickly push the peak to a level that is five times higher than the scenario where the current level of control measures is maintained and puts additional pressure on the health system. Results clearly suggest that with further restrictions (scenario ii), the projected curve quickly goes back under the ICU capacity, while it takes more than 100 days for the curve to go back under the ICU capacity in scenario i and iii.
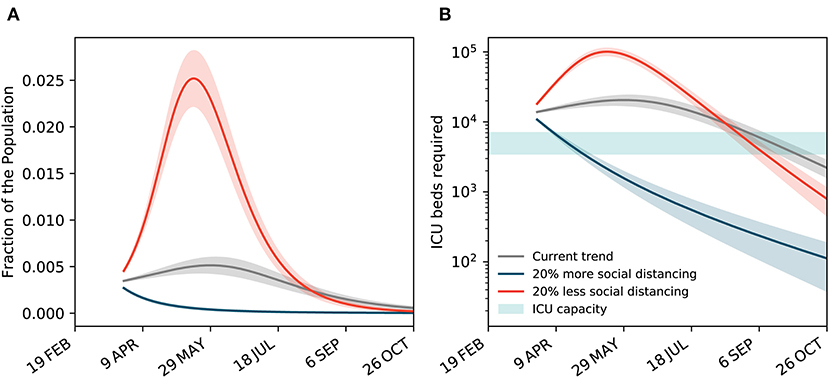
Figure 5. Scenario analysis for maintaining, reinforcing, or easing the restrictions. (A) The projected curves for the total number of confirmed and suspected cases under three different scenarios: maintaining the same level of control measures as of 12 April 2020, reinforcing the control measures to increase physical distancing by a 20% increase in the reproduction number, and partial lifting the restrictions to ease physical distancing by a 20% decrease in the reproduction number. (B) The projected number of ICU beds needed under the three scenarios. The original ICU capacity is assumed between 3,500 to 7,000 beds [7].
Conclusions and Discussion
In this study, we used a mathematical epidemic model to provide the first estimates of the changing transmission of SARS-CoV-2 infection in Iran when the underreporting of cases is considered. We used official data and adjusted our estimates for underreporting based on delay-adjusted CFR.
We used a variation of the SEIR model combined with an estimate of the percentage of symptomatic cases using delay-adjusted CFR based on the distribution of the time from confirmation-to-death [19]. In contrast to previous models of the epidemic [28], we did not assume any prior information on the distribution of the effective reproduction number. This, combined with the use of a series of distributions, allowed us to take into account more appropriately the uncertainty and the random variation in both input data and model outcomes.
Association of R(t) and Public Health Interventions
The outbreak of COVID-19 in Iran is claimed to have started in Qom province, with the first case officially reported on 19 February 2020. As shown earlier in Figure 1A, according to the official data, it only took 2 days for four more provinces, Tehran, Markazi, Mazandaran, and Gilan (Guilan), to report their first cases. The first non-pharmaceutical intervention took place on 22 February 2020, with the closure of schools and universities in Qom, followed by their closure in the capital city of Tehran after a day. With the school closures in the capital combined with low levels of social awareness about the potential risks of COVID-19, a surge in the number of holiday trips from Tehran to northern provinces of Mazandaran and Gilan was observed. Soon after, with no restriction on inter-city travel, the number of identified cases in Gilan and Mazandaran grew rapidly, and the infection spread throughout the rest of the country.
The second major non-pharmaceutical intervention occurred on 28 February 2020 with a wide campaign to disinfect public spaces and for the closure of all schools and universities across all provinces. On 5 March 2020, the government announced an increase in the COVID-19 testing capacity. On 7 March 2020, sporadic closure or reduction of working hours in government offices and banks across the country was reported. On 14 March 2020, two often crowded religious shrines in Qom and Mashhad were closed to visitors. The increased physical distancing as the result of interventions and increase in public awareness of the crisis through major official and unofficial information campaigns, especially on social media, gradually showed its impact by slowing down the speed of the spread, as shown earlier in Figure 1B. The estimated effective reproduction number increased from 1.14 on 4 March 2020 to 1.35 on 8 March 2020, perhaps due to the increase in case ascertainment and delay in early interventions to show their impact. The effective reproduction number decreased consistently to 1.04 on 20 March 2020.
On 17 March 2020, only a few days before the Persian New Year (Nowruz, 20 March 2020), in the absence of strict travel restrictions, millions of Iranians began making road trips to various destinations across the country, despite the warnings from the government, and many hotels, restaurants, and the general hospitality industry's refrainment to provide services to any traveler. This is believed to have increased the speed of the spread of COVID-19 in Iran, increasing the effective reproduction number to 1.52 on 30 March 2020.
On 22 March 2020, the government announced more restrictive non-pharmaceutical interventions, leading to the closure of all non-essential businesses for at least 2 weeks, followed by further intensified interventions on March 28, 2020, including restrictions on entry and exit to affected provinces and cities, closure of parks, pools, and all recreational places, and a ban on public gatherings including sport, cultural, and religious events. These restrictions pushed the effective reproduction number further down to 1.0 on 9 April 2020 and 0.69 on 15 April 2020.
Case Fatality Ratio
Iran has had one of the highest CFRs among the affected countries in the world. While the CFR is known to vary significantly between countries due to various reasons, including testing frequency and population age distribution [26], the CFR is still higher in Iran despite having a younger population with a median age of 30.8 years old compared to China with 4% CFR and a median population age of 37.4 and South Korea with 2% CFR and a median population age of 41.8 [26]. Perhaps a comparable country in the Middle East with similar population characteristics (median age of 30.9) is Turkey. The CFR in Turkey as of 6 April 2020 was 2%, three times lower than that of Iran [26]. While the evidence is indirect, it suggests that the official number of cases reported by Iran may have been significantly underreported, possibly due to relatively low case-ascertainment and underreporting of identified cases [26].
The continuous reduction in the delay-adjusted CFR shows a different trend compared to the CFR with no consideration of the time from confirmation-to-death. The continuous reduction could be explained by the improving case identification practice in Iran over time with various initiatives, including a National Coronavirus Helpline (a.k.a the “4030” service), established in late February 2020 to self-report symptoms and identify suspected cases.
Our results confirmed the significant impact of underreporting in describing the story of the COVID-19 outbreak in Iran, especially in the early stages. We showed how overlooking underreporting can drastically affect the estimation of R(t) and overestimate the impact of control measures.
Final Remarks
Our results showed the reduction in effective reproduction number, a measure of infection transmission, during the study period. This decrease was most likely due to increased physical distancing as the result of multiple non-pharmaceutical public health interventions, including school closures, bans on public gatherings, travel restrictions, and full/partial closure of non-essential businesses, as well as major awareness campaigns over social media. Based on the latest trends, while the first peak of COVID-19 in Iran occurred on 5 April 2020, the post-peak period may continue to the end of 2020. However, these projections assume the continuation of the current level of control measures and the absence of effective therapeutic treatments or vaccination programs. Hence, they can be subject to important shifts depending, in particular, on the public's willingness to continue and the government's success in implementing social distancing measures or easing the restrictions.
Our model provides tangible evidence of the association between the different non-pharmaceutical interventions and their impact on the course of the outbreak. The results showed how the acceptance and, hence, effectiveness of the interventions endorsed by the Iranian government aimed at “flattening the curve” depended in part on the public's level of awareness of the principles behind governmental policies and their trust in the government and its control measures. For example, closure of schools and businesses in the capital city of Tehran near the time of the Persian New Year was followed by a surge in holiday trips to Gilan and Mazandaran and a subsequent increase in the number of cases in these provinces and in other parts of the country. This observation shows how interventions may be associated with unintended and at times counterproductive consequences. These negative consequences can be prevented when there is open and credible communication by competent officials and mutual trust between the public and government. Moreover, intervention measures need to be developed, implemented, and enforced as a whole, for example through strict reinforcement of travel restrictions in conjunction with school and workplace closings.
There is no substitute for high quality data—complete, accurate, and timely—as a basis for public policy. However, in the absence of such data, modeling of the type presented here can help provide reasonable estimates as well as realistic bounds of their uncertainty. The range of uncertainty can be viewed as the margin of error in the model's predictions of the number of cases, ICU admissions, or deaths. Modeling can also illustrate different scenarios – pessimistic vs. optimistic vs. realistic – of how the epidemic may evolve in relation to current and future public health measures and the possible compliance of the public over time.
In conclusion, using a compartmental model of the SARS-CoV-2 epidemic in Iran, we assessed the dynamic of the epidemic in relation to public health measures to increase social distancing. We took into account both the inherent uncertainty in the data and the possible impact of underreporting of true cases due to low case ascertainment and reporting. In the absence of consistently reliable data, the modeling approach as presented here can help to generate reasonable estimates of key public health metrics, such as the number of cases and case fatality ratio. In turn, these metrics and scenarios can help serve the dual purpose of informing public policy and the public, and of fostering discussions and improvements of epidemic modeling.
Data Availability Statement
Publicly available datasets were analyzed in this study. The data can be found on WHO's website available online at https://www.who.int/emergencies/diseases/novel-coronavirus-2019/situation-reports and Iran's Ministry of Health and Medical Education's daily COVID-19 Epidemic Reports available online at http://corona.behdasht.gov.ir/.
Author Contributions
MS, HH, KM, and BK designed the study. MS and HH developed the mathematical model and produced the figures. MS, HH, KM, HD, AM, JM, KK, and BK contributed to literature search, data analysis, data interpretation, and writing. All authors contributed to the article and approved the submitted version.
Conflict of Interest
The authors declare that the research was conducted in the absence of any commercial or financial relationships that could be construed as a potential conflict of interest.
Acknowledgments
This manuscript has been released as a pre-print at https://www.medrxiv.org/content/10.1101/2020.05.02.20087270v1 [29].
Supplementary Material
The Supplementary Material for this article can be found online at: https://www.frontiersin.org/articles/10.3389/fphy.2020.00289/full#supplementary-material
References
1. WHO. Coronavirus disease 2019. (COVID-19). Situation report 31. Geneva: World Health Organization (2020).
2. World Economic Forum. Finding ‘Patient Zero': The Challenges of Tracing the Origins of Coronavirus. (2020). Available online at: https://www.weforum.org/agenda/2020/03/coronavirus-covid-19-patient-zero/ (accessed April 13, 2020).
3. The Atlantic. Coronavirus Could Break Iranian Society. (2020). Available online at: https://www.theatlantic.com/ideas/archive/2020/02/iran-cannot-handle-coronavirus/607150/ (accessed April 13, 2020).
4. WSJ. Iran Takes Emergency Measures After Two Coronavirus Deaths in Qom. (2020). Available online at: https://www.wsj.com/articles/iran-takes-emergency-measures-after-two-coronavirus-deaths-in-qom-11582202084 (accessed April 13, 2020).
5. Khafaiea MA, Rahim F. Cross-country comparison of case fatality rates of COVID-19/SARS-COV-2. Osong Public Health Res Perspect. (2020) 11:74–80 doi: 10.24171/j.phrp.2020.11.2.03
6. NBC News. Why is Iran's Reported Mortality Rate for Coronavirus Higher Than in Other Countries? (2020). Available online at: https://www.nbcnews.com/health/health-news/why-iran-s-reported-mortality-rate-coronavirus-higher-other-countries-n1142646 (accessed April 13, 2020).
7. Maier BF, Brockmann D. Effective containment explains subexponential growth in recent confirmed COVID-19 cases in China. Science. (2020) 368:742–6. doi: 10.1126/science.abb4557
8. Kraemer MUG, Yang CH, Gutierrez B, Wu CH, Klein B, Pigott DM, et al. The effect of human mobility and control measures on the COVID-19 epidemic in China. Science. (2020) 368:493–7. doi: 10.1126/science.abb4218
9. Vespignani A, Tian H, Dye C, Lloyd-Smith JO, Eggo RM, Scarpino SV, et al. Modelling COVID-19. Nat Rev Phys. (2020) 2:279–81. doi: 10.1038/s42254-020-0178-4
10. Xia C, Wang Z, Zheng C, Guo Q, Shi Y, Dehmer M, et al. A new coupled disease-awareness spreading model with mass media on multiplex networks. Information Sci. (2019) 471:185–200. doi: 10.1016/j.ins.2018.08.050
11. Chinazzi M, David JT, Ajelli M, Gioannini C, Litvinova M, Merler S, et al. The effect of travel restrictions on the spread of the 2019 novel coronavirus (COVID-19) outbreak. Science. (2020) 368:395–400. doi: 10.1126/science.aba9757
12. Yang Z, Zeng Z, Wang K, Wong SS, Liang W, Zanin M, et al. Modified SEIR and AI prediction of the epidemics trend of COVID-19 in China under public health interventions. J Thorac Dis. (2020) 12:165–74. doi: 10.21037/jtd.2020.02.64
13. Li R, Pei S, Chen B, Song Y, Zhang T, Yang W, et al. Substantial undocumented infection facilitates the rapid dissemination of novel coronavirus (SARS-CoV-2). Science. (2020) 368:489–93. doi: 10.1126/science.abb3221
14. Iran's Ministry of Health and Medical Education. Daily COVID-19 Epidemic Reports. Available online at: http://corona.behdasht.gov.ir/ (accessed April 13, 2020).
15. Lauer SA, Grantz KH, Bi Q, Jones FK, Zheng Q, Meredith HR, et al. The incubation period of coronavirus disease (2019). (COVID-19) from publicly reported confirmed cases: estimation and application. Ann Intern Med. (2020) 172:577–82. doi: 10.7326/M20-0504
16. Imperial College London COVID-19 Response Team. Report 4: Severity of 2019-Novel Coronavirus (nCoV). (2020). Available online at: https://www.imperial.ac.uk/media/imperial-college/medicine/sph/ide/gida-fellowships/Imperial-College-COVID19-severity-10-02-2020.pdf (accessed April 13, 2020).
17. Delamater PL, Street EJ, Leslie TF, Yang Y, Jacobsen KH. Complexity of the basic reproduction number (R0). Emerg Infect Dis. (2019) 25:1–4. doi: 10.3201/eid2501.171901
18. Mercer GN, Glass K, Becker NG. Effective reproduction numbers are commonly overestimated early in a disease outbreak. Stat Med. (2011) 30:984–94. doi: 10.1002/sim.4174
19. Nishiura H, Chowell G. The effective reproduction number as a prelude to statistical estimation of time-dependent epidemic trends. In: Chowell G, Hyman JM, Bettencourt LMA, Castillo-Chavez C, editors. Mathematical and Statistical Estimation Approaches in Epidemiology. Dordrecht: Springer Netherlands. (2009). p. 103–21. doi: 10.1007/978-90-481-2313-1_5
20. Dietz K. The estimation of the basic reproduction number for infectious diseases. Stat Methods Med Res. (1993) 2:23–41. doi: 10.1177/096228029300200103
21. Linton NM, Kobayashi T, Yang Y, Hayashi K, Akhmetzhanov AR, Jung SM, et al. Incubation period and other epidemiological characteristics of 2019 novel coronavirus infections with right truncation: a statistical analysis of publicly available case data. J Clin Med. (2020) 9:538. doi: 10.3390/jcm9020538
22. Marinov RR, Mariova RS, Omojola J, Jackson M. Inverse problem for coefficient identification in SIR epidemic models. Comput Math Appl. (2014) 67:2218–27. doi: 10.1016/j.camwa.2014.02.002
23. Audet C, Dennis JE. Analysis of generalized pattern searches. SIAM J Optim. (2003) 13:889–903. doi: 10.1137/S1052623400378742
24. Artalejo JR, Lopez-Herrero MJ. On the exact measure of disease spread in stochastic epidemic models. Bull Math Biol. (2013) 75:1031–50. doi: 10.1007/s11538-013-9836-3
25. CMMID. Using a Delay-Adjusted Case Fatality Ratio to Estimate Under-Reporting. (2020). Centre for Mathematical Modelling of Infectious Disease, London School of Hygiene & Tropical Medicine. Available online at: https://cmmid.github.io/topics/covid19/global_cfr_estimates.html (accessed April 28, 2020).
26. CEBM. Global Covid-19 Case Fatality Rates. (2020). The Centre for Evidence-Based Medicine, University of Oxford. Available online at: https://www.cebm.net/covid-19/global-covid-19-case-fatality-rates/ (accessed April 13, 2020).
27. Wu Z, McGoogan JM. Characteristics of and important lessons from the coronavirus disease (2019). (COVID-19) outbreak in china: summary of a report of 72 314 cases from the chinese center for disease control and prevention. JAMA. (2020) 323:1239–42. doi: 10.1001/jama.2020.2648
28. CMMID. Temporal Variation in Transmission During the COVID-19 Outbreak. (2020). Centre for Mathematical Modelling of Infectious Disease, London School of Hygiene & Tropical Medicine. Available online at: https://epiforecasts.io/covid/ (accessed April 13, 2020).
Keywords: COVID-19, Iran, mathematical modeling, underreporting, effective reproduction number
Citation: Saberi M, Hamedmoghadam H, Madani K, Dolk HM, Morgan AS, Morris JK, Khoshnood K and Khoshnood B (2020) Accounting for Underreporting in Mathematical Modeling of Transmission and Control of COVID-19 in Iran. Front. Phys. 8:289. doi: 10.3389/fphy.2020.00289
Received: 13 May 2020; Accepted: 26 June 2020;
Published: 10 July 2020.
Edited by:
Chengyi Xia, Tianjin University of Technology, ChinaReviewed by:
Ke Hu, Xiangtan University, ChinaZhishuang Wang, Tianjin University of Technology, China
Copyright © 2020 Saberi, Hamedmoghadam, Madani, Dolk, Morgan, Morris, Khoshnood and Khoshnood. This is an open-access article distributed under the terms of the Creative Commons Attribution License (CC BY). The use, distribution or reproduction in other forums is permitted, provided the original author(s) and the copyright owner(s) are credited and that the original publication in this journal is cited, in accordance with accepted academic practice. No use, distribution or reproduction is permitted which does not comply with these terms.
*Correspondence: Meead Saberi, meead.saberi@unsw.edu.au