Article

To Swab or Not to Swab? The Lesson Learned in Italy in the Early Stage of the COVID-19 Pandemic

1
Department of Clinical and Biological Sciences, University of Torino, 10100 Torino, Italy
2
Department of Mathematics, University of Torino, 10100 Torino, Italy
3
Department of Public Health and Pediatric Sciences, University of Torino, 10100 Torino, Italy
4
Unit of Biostatistics, Epidemiology and Public Health, Department of Cardiac, Thoracic, Vascular Sciences, and Public Health, University of Padova, 35121 Padova, Italy
5
Department Medical Sciences, University of Ferrara, 44121 Ferrara, Italy
*
Author to whom correspondence should be addressed.
Appl. Sci. 2021, 11(9), 4042; https://doi.org/10.3390/app11094042
Submission received: 12 April 2021 / Revised: 25 April 2021 / Accepted: 27 April 2021 / Published: 29 April 2021
(This article belongs to the Special Issue Data-Driven Biomedical Research and Applications)

Abstract

:
Testing for the SARS-CoV-2 infection is critical for tracking the spread of the virus and controlling the transmission dynamics. In the early phase of the pandemic in Italy, the decentralized healthcare system allowed regions to adopt different testing strategies. The objective of this paper is to assess the impact of the extensive testing of symptomatic individuals and their contacts on the number of hospitalizations against a more stringent testing strategy limited to suspected cases with severe respiratory illness and an epidemiological link to a COVID-19 case. A Poisson regression modelling approach was adopted. In the first model developed, the cumulative daily number of positive cases and a temporal trend were considered as explanatory variables. In the second, the cumulative daily number of swabs was further added. The explanatory variable, given by the number of swabs over time, explained most of the observed differences in the number of hospitalizations between the two strategies. The percentage of the expected error dropped from 70% of the first, simpler model to 15%. Increasing testing to detect and isolate infected individuals in the early phase of an outbreak improves the capability to reduce the spread of serious infections, lessening the burden of hospitals.

1. Introduction

According to the World Health Organization (WHO), testing for SARS-CoV-2 infection is critical for tracking the viral spread in the population and reducing disease transmission [1].
Several experiences pointed out the importance of surveillance based on the isolation of cases, contact tracing, and the precautionary self-isolation of close contacts. For example, the Republic of South Korea tested about 8000 people in every million in order to isolate infected individuals and quarantine their contacts [2], while in Europe, Germany processed more than 100,000 tests per week, testing around 6000 people for every million [3].
Different strategies to keep the virus under control have been adopted across regions in Italy, favoured by a highly decentralized healthcare system. In this regard, the Italian experience suggests that locking towns is necessary but not enough to control the spread of the disease [4].
In order to assess the impact of testing policies, we analyzed the experiences of Piemonte and Veneto, two Italian regions in the North of the country that, while both heavily affected by the pandemic, adopted two opposite strategies to contain the outbreak [5].
Both regions have about 5 million people, with a similar population age structure (see Supplementary Table S1). Piemonte endured 17,690 cases before the middle of April and 3762 hospitalizations; Veneto saw a comparable number of cases (14,432) but about half of the hospitalizations (1660).
To control the outbreak, Veneto carried out extensive testing of individuals with both severe and mild symptoms. Moreover, if somebody tested positive, all of the cohabitants were tested or, if tests were not available, they were required to self-quarantine. Besides this, in Vo’ Euganeo, a municipality of around 3400 inhabitants, many asymptomatic individuals were tested as part of a pilot study. Specific efforts were put into home diagnosis, with healthcare personnel making a home visit to individuals with suspected COVID-19 for sample collection, preventing them from being exposed or exposing others [6].
Conversely, in Piemonte, the Regional Crisis Management Unit adopted the recommendation issued by the Ministry of Health and the Higher Health Council, which did not consider testing to be clinically informative, based on the knowledge available by the end of February [7]. Consequently, testing was limited to individuals with critical respiratory illnesses with an epidemiological link to a confirmed COVID-19 case, and to health workers who had close contacts with positive COVID-19 patients in the absence of suitable protection. As a result, Piemonte was less proactive in testing than Veneto [8]. Limited testing capacity provided a complementary reason for adopting this strategy [9]. As pointed out during a press conference by the Regional Crisis Management Unit, at the beginning of the emergency in Piemonte only two laboratories could perform swabs, compared to 14 in Veneto.
This work aims to understand whether the opposite testing strategies adopted by Veneto and Piemonte impacted the relevant differences in daily hospitalization counts. The daily count time series were considered until April 14 only, which was around a fortnight after the total cases in Piemonte exceeded those in Veneto.

2. Materials and Methods

2.1. Data

The data source for the total number of cases, hospitalizations, swabs, and cases in isolation at home was the Italian Civil Protection Department of the Council of Ministers Presidency. Data were pulled from the COVID19ita website platform [5]. The analysis was based on data from 24 February 2020 (the first day for which data were available) to 14 April 2020. The resident population data were retrieved from the National Italian Statistics Institute [10].

2.2. Statistical Analysis
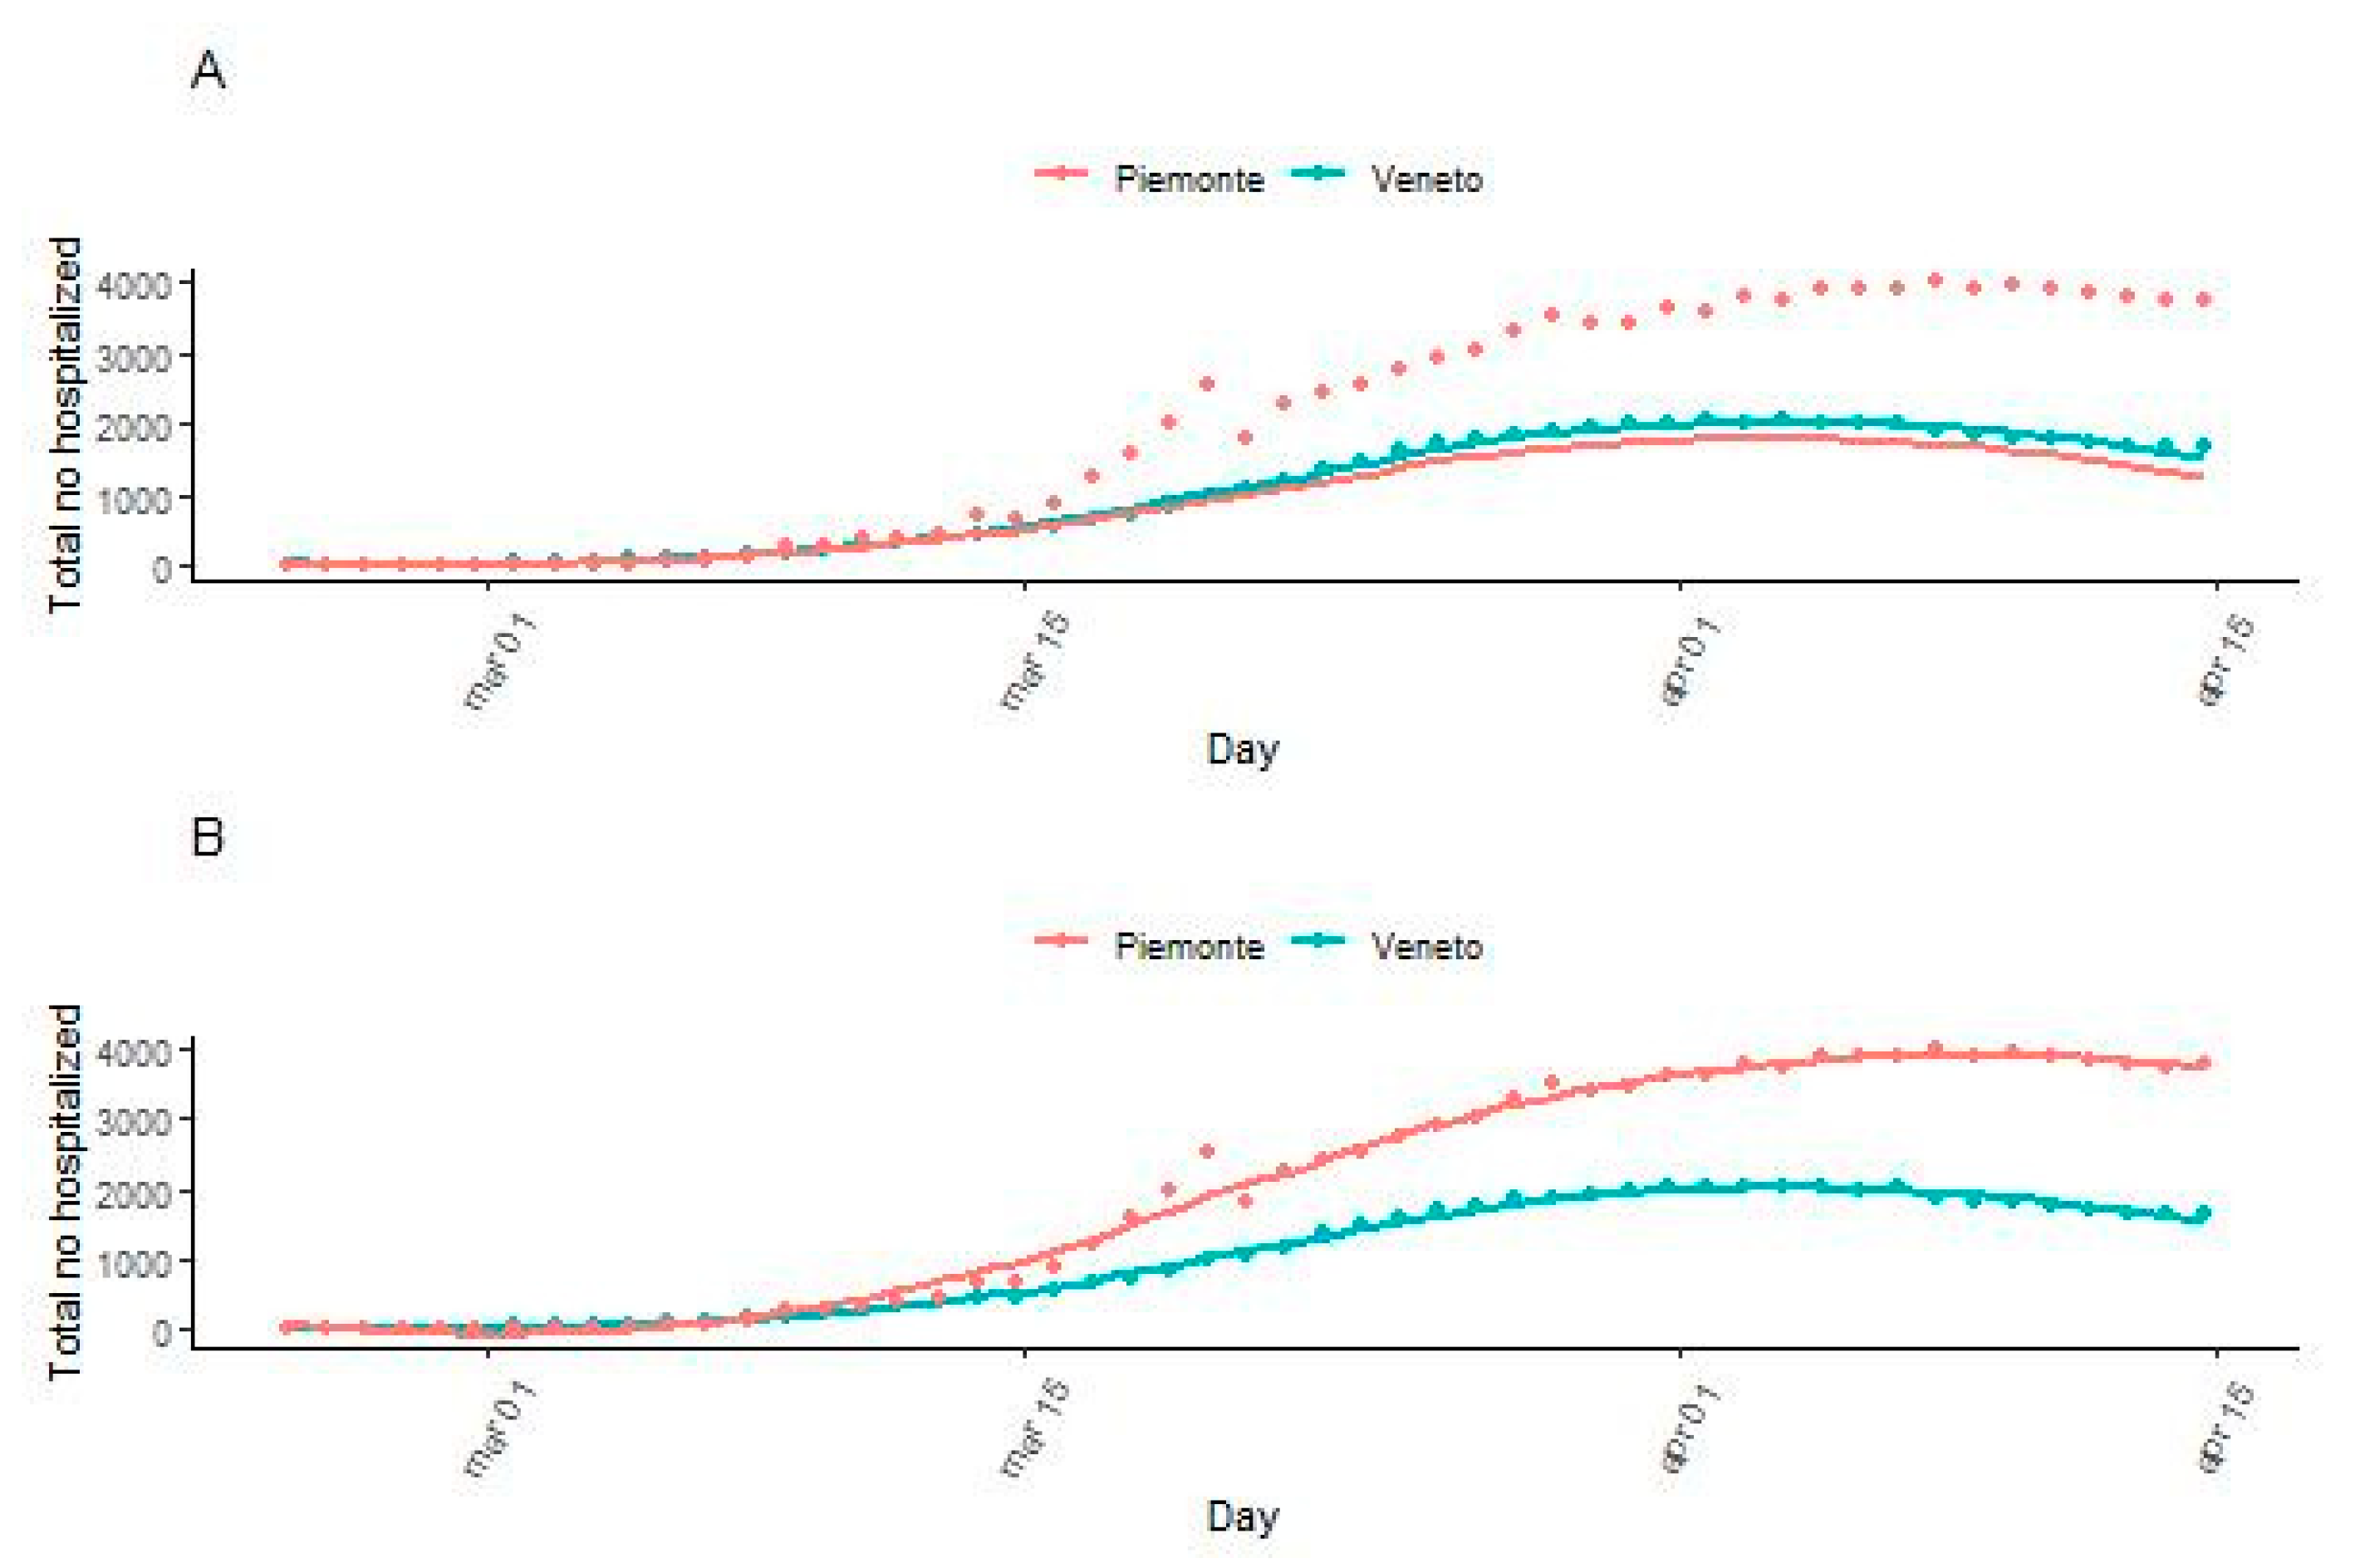
A Poisson regression approach with overdispersion was adopted in order to model the Veneto region’s daily cumulative hospitalization data count.
In the first model, a smooth function of time and the time series of COVID-19 cases were included. Natural cubic splines were employed for the smooth function of time in order to account for non-linear temporal trends; the Wald test was performed to check for non-linearity.
In the second model, the cumulative number of swabs was further added along with a time–covariates interaction to address the variation of the number of swabs over days. In both models, the logarithm of the population size was included as an offset variable.
The overdispersion was addressed by introducing a multiplicative dispersion factor in the variance function, estimated using the quasi-likelihood approach. Robust variance estimation was used to compute the standard errors in order to account for possible mild violations of the distribution assumptions [11]. The goodness-of-fit was assessed by performing chi-square tests on the residual deviance, and possibly by computing pseudo-R2.
Finally, the models fitted were employed to predict the daily hospitalization counts in Piemonte. The prediction accuracy was assessed by computing the root mean squared error (RMSE) together with the corresponding scatter index (SI), which is the percentage of the expected error, and the symmetric mean absolute percentage error (sMAPE) [12].
The statistical significance was set at p < 0.05. All of the analyses were performed with R [13].

3. Results

In Table 1, the weekly number of total positive cases of COVID-19, and the total hospitalizations, swabs, and individuals in isolation at home are reported for both Piemonte and Veneto.
A first Poisson regression model (Model 1) was fitted for the daily cumulative hospitalization data count in Veneto with a temporal trend and the daily number of positive COVID-19 cases as explanatory variables. Overdispersion was detected; hence, the model was fitted with a suitable multiplicative factor in the variance function. The goodness-of-fit test in Table 2 showed that the time trend and the number of positive cases alone could not explain the variation of the number of hospitalized patients (p = 0.026).
The same model applied to the data of Piemonte (Figure 1A) does not fit the observed data, confirming that the daily counts of positive COVID-19 cases do not explain the differences in the number of hospitalized patients between the two regions. The observed data for Piemonte and Veneto are plotted in Figure 1A as points. The continuous lines correspond to a local linear smoothing for the data from Veneto and the values predicted by the Poisson model applied to the data from Piemonte. The predicted hospitalization counts in Piemonte were significantly lower than the real observed ones, as confirmed by the measures of the prediction accuracy (RMSE = 1401.3, SI = 70%, and sMAPE = 39%).
A second Poisson model was developed including the interaction between time and the number of swabs as the further predictor. No overdispersion was detected and the number of swabs was highly significant, as well as its interaction with time (p < 0.001 for both). The model fitted reasonably well because the goodness-of-fit chi-squared test was not statistically significant and the computed pseudo-R2 was 0.988 (Table 2).
The predicted number of hospitalized patients in Piemonte according to Model 2 was in good agreement with the observed data (RMSE = 294.7, SI = 15% and sMAPE = 20%). Even if the SI and sMAPE values are still not small, they are much lower than those of the previous model 1. Moreover, they suffer mainly from an overestimation of the first days when the observed hospitalizations were very few. This behaviour is evident from the continuous line for Piemonte data in Figure 1B, plotting the predicted hospitalizations of the second model.

4. Discussion

The present work reports an analysis of the impact on the unfolding of COVID-19 in two Italian regions in the North of the country, which was heavily affected by the pandemic outbreak, resulting from opposite testing strategies. Veneto implemented extensive testing of mild symptomatic individuals along with the contacts of infected patients. Contrariwise, Piemonte limited the testing to individuals with severe respiratory symptoms, according to the first recommendations of the Ministry of Health and the Higher Health Council.
In this work, the daily time series of hospitalizations was considered. A prediction model was developed using data from Veneto. The results suggest that the cumulative number of COVID-19 cases observed is not suitable alone to predict the hospitalization trend. The same model largely underestimated the number of hospitalizations in Piemonte, which despite a similar number of positive cases, had a higher number of hospitalizations than Veneto, notwithstanding the similar age structures of the population in the two regions. The two population also share a similar prevalence of comorbidities like diabetes, which is associated with severe COVID-19 and thus hospitalization as consequences [14,15].
In searching for a potential explanation of the observed differences in the number of hospitalizations between the two regions, the best fitting model included the number of swabs and a time-interaction. This second model was also able to predict the observed trend over time in Piemonte. The percentage of the expected error dropped from 70% of the first simpler model to 15%.
Using the model developed on data from Veneto to predict hospitalizations in Piemonte allowed us to assess whether the lack of an extensive testing strategy in Piemonte could explain the quicker progression of the hospitalizations. Adjusting by the number of swabs largely explained the difference between the observed hospitalizations in Piemonte and the expected ones if the same testing strategy of Veneto would have been adopted, pointing out that more testing in Piemonte could have reduced the number of hospitalizations.
Veneto was one of the first Italian regions affected by the COVID-19 epidemic; at the same time, it was among the first regions to experience a reduction in COVID-19 hospitalizations due to the early implementation of containment policies [16] and a broad-spectrum testing strategy [6].
The proactive strategy adopted in Veneto was a key component to ensure a prompt surveillance system, especially in the presence of asymptomatic cases and mildly symptomatic cases. Identifying early cases allowed their isolation, even if they were asymptomatic, and enhanced the ability to provide home care assistance as soon as they manifested the symptoms, reducing the burden of hospitals [6].
This observation is strengthened by the number of positive cases in Piemonte, which exceeded by only 30% the total number of hospitalizations during the first three weeks of the pandemic. On the contrary, in Veneto, after the first week, the number of positive cases was already more than three times the number of hospitalizations. Hence, in the first period of the pandemic, most likely due to the lack of more widespread testing, in Piemonte many cases were tested because they presented to the hospital with severe respiratory symptoms only.
The analysis was limited to two weeks after the hospitalization trend started in order to differentiate between the two regions. This choice was twofold: first, in April in Piemonte, the number of swabs processed started to increase progressively. In fact, on 12th April, 25,396 more swabs were performed compared to the previous week, and this increase was larger than the number of tests performed on 29 March (21,511, see Table 2). Second, in the earlier phase, the effect of the lockdown was still less evident.
We did not consider in the present work the number of COVID-19 deaths, because they also depend on the availability of healthcare resources. The outbreak of COVID-19 has placed intense strain on hospital services, especially on intensive care units, which in turn potentially biases observations of mortality.
The result of the study suggests that, at the beginning of an outbreak, in the absence of relevant measures to contain the spread of the epidemic, increasing testing is helpful to detect and isolate infected individuals, improving the ability to reduce the spread of severe infections and hence lessening the burden of hospitals.

Supplementary Materials

The following are available online at https://www.mdpi.com/article/10.3390/app11094042/s1. Table S1: Veneto and Piemonte population age structure.

Author Contributions

Conceptualization, P.B., C.F., A.R. and D.G.; formal analysis, P.B. and M.T.G.; data curation, C.L.; writing—original draft preparation, P.B. and M.T.G.; writing—review and editing, C.F., S.U., V.S., I.P., D.A., G.L., G.S. and D.G. All authors have read and agreed to the published version of the manuscript.

Funding

This research received no external funding.

Institutional Review Board Statement

Not applicable. This study used secondary data already collected and publicly available online.

Informed Consent Statement

Not applicable.

Data Availability Statement

The data and code for the analysis are available at https://github.com/UBESP-DCTV/covid19ita (accessed on 20 April 2021).

Conflicts of Interest

The authors declare no conflict of interest.

References

  1. World Health Organisation (WHO). Laboratory Testing Strategy Recommendations for COVID-19 (Online); WHO: Geneva, Switzerland, 2020. [Google Scholar]
  2. Kim, J.E.; Lee, J.H.; Lee, H.; Moon, S.J.; Nam, E.W. COVID-19 Screening Center Models in South Korea. J. Public Health Policy 2021, 42, 15–26. [Google Scholar] [CrossRef] [PubMed]
  3. Cohen, J.; Kupferschmidt, K. Countries Test Tactics in ‘War’ against COVID-19. Science 2020, 367, 1287–1288. [Google Scholar] [CrossRef] [PubMed] [Green Version]
  4. Sanfelici, M. The Italian Response to the COVID-19 Crisis: Lessons Learned and Future Direction in Social Development. Int. J. Community Soc. Dev. 2020, 2, 191–210. [Google Scholar] [CrossRef]
  5. Covid19ita. Available online: https://R-Ubesp.Dctv.Unipd.It/Shiny/Covid19ita/ (accessed on 28 March 2020).
  6. Lorenzoni, G.; Lanera, C.; Azzolina, D.; Berchialla, P.; Gregori, D.; Gregori, D.; Lanera, C.; Berchialla, P.; Catelan, D.; Azzolina, D.; et al. Is a More Aggressive COVID-19 Case Detection Approach Mitigating the Burden on ICUs? Some Reflections from Italy. Crit. Care 2020, 24. [Google Scholar] [CrossRef]
  7. Higher Council of Health (Italy). Criteria for Testing through Rhino-Pharyngeal Swab and Diagnostic Test SARS-Cov-2 Clinically Asymptomatic Individuals. 2020. Available online: https://Snlg.Iss.It/Wp-Content/Uploads/2020/03/CircolareMinSal_DefinizioneCasoCOVID19.pdf (accessed on 26 February 2020).
  8. Onder, G.; Rezza, G.; Brusaferro, S. Case-Fatality Rate and Characteristics of Patients Dying in Relation to COVID-19 in Italy. JAMA 2020. [Google Scholar] [CrossRef] [PubMed]
  9. Ciminelli, G.; Garcia-Mandicó, S. COVID-19 in Italy: An Analysis of Death Registry Data. J. Public Health 2020, 42, 723–730. [Google Scholar] [CrossRef]
  10. ISTAT. Demography in Figures. Available online: http://www.demo.istat.it/ (accessed on 3 September 2020).
  11. Cameron, A.C.; Trivedi, P.K. Microeconometrics: Methods and Applications, 1st ed.; Cambridge University Press: Cambridge, UK, 2005; ISBN 978-0-521-84805-3. [Google Scholar]
  12. Hyndman, R.J.; Koehler, A.B. Another Look at Measures of Forecast Accuracy. Int. J. Forecast. 2006, 22, 679–688. [Google Scholar] [CrossRef] [Green Version]
  13. R Core Team. R: A Language and Environment for Statistical Computing; R Foundation for Statistical Computing: Vienna, Austria, 2019. [Google Scholar]
  14. ISTAT National Diabetes Fact Sheet. Available online: https://www.epicentro.iss.it/igea/en/DiabetesFactSheet#4 (accessed on 20 April 2021).
  15. ISTAT. Annual Report 2020—The State of the Nation; ISTAT: Roma, Italy, 2020. [Google Scholar]
  16. Gregori, D.; Azzolina, D.; Lanera, C.; Prosepe, I.; Destro, N.; Lorenzoni, G.; Berchialla, P. A First Estimation of the Impact of Public Health Actions against COVID-19 in Veneto (Italy). J. Epidemiol. Community Health 2020, 74, 858–860. [Google Scholar] [CrossRef] [PubMed]
Figure 1. (A): Predicted trend of COVID-19 hospitalizations in Piemonte (red solid line) based on Veneto daily cumulative number of COVID-19 positive cases. Observed hospitalizations are reported as red points in Piemonte and blue points in Veneto; (B): predicted trend of hospitalizations in Piemonte (red solid line) based on daily cumulative number of COVID-19 positive cases in Veneto and the number of swabs performed.
Applsci 11 04042 g001
Table 1. Weekly number of positive COVID-19 cases, hospitalizations, swabs performed, and individuals in isolation at home in Piemonte and Veneto.
WeekPiemonteVeneto
No. of Positive COVID-19 CasesNo. of HospitalizationsNo of SwabsNo of Individuals in IsolationNo. of Positive COVID-19 CasesNo. of HospitalizationsNo of SwabsNo of Individuals in Isolation
01/03/20201173084191358659154
08/03/202020714810465454316414,429341
15/03/20208736883680126193748526,9801290
22/03/20203752227710,70112294617119153,6423023
29/03/20207671353321,51133187930190389,3805010
05/04/202011,709389137,181580210,8242015133,2897078
12/04/202016,008381962,577835113,7681716190,9129033
14/04/202017,690376271,678929314,4321660208,8789076
Table 2. Goodness-of-fit and prediction accuracy indexes. The goodness-of-fit indexes were computed on the model built on Veneto data. The prediction accuracy indexes were computed on the predictions of the number of hospitalizations over time in Piemonte. Model 1 considers the daily number of positive Covid19 cases and time as explanatory covariates for the daily number of hospitalizations; Model 2 considers the daily number of positive Covid19 cases and the daily number of swabs with time-interaction as explanatory covariates for the daily number of hospitalizations.
IndexModel 1Model 2
Goodness-of-fit-indexes
 Goodness-of-fit test, p-value0.0260.454
 Analysis of deviance, p-value -<0.001
 Pseudo R 2 0.4120.988
 AIC488.73471.27
Prediction accuracy index
 RMSE1401.331294.732
 Scatter Index0.7100.149
 sMAPE0.3880.203
Publisher’s Note: MDPI stays neutral with regard to jurisdictional claims in published maps and institutional affiliations.

