
Radiative Effect and Mixing Processes of a Long-Lasting Dust Event over Athens, Greece, during the COVID-19 Period

 , , , and
Abstract
:1. Introduction
2. Instrumentation and Simulation Tools/Models
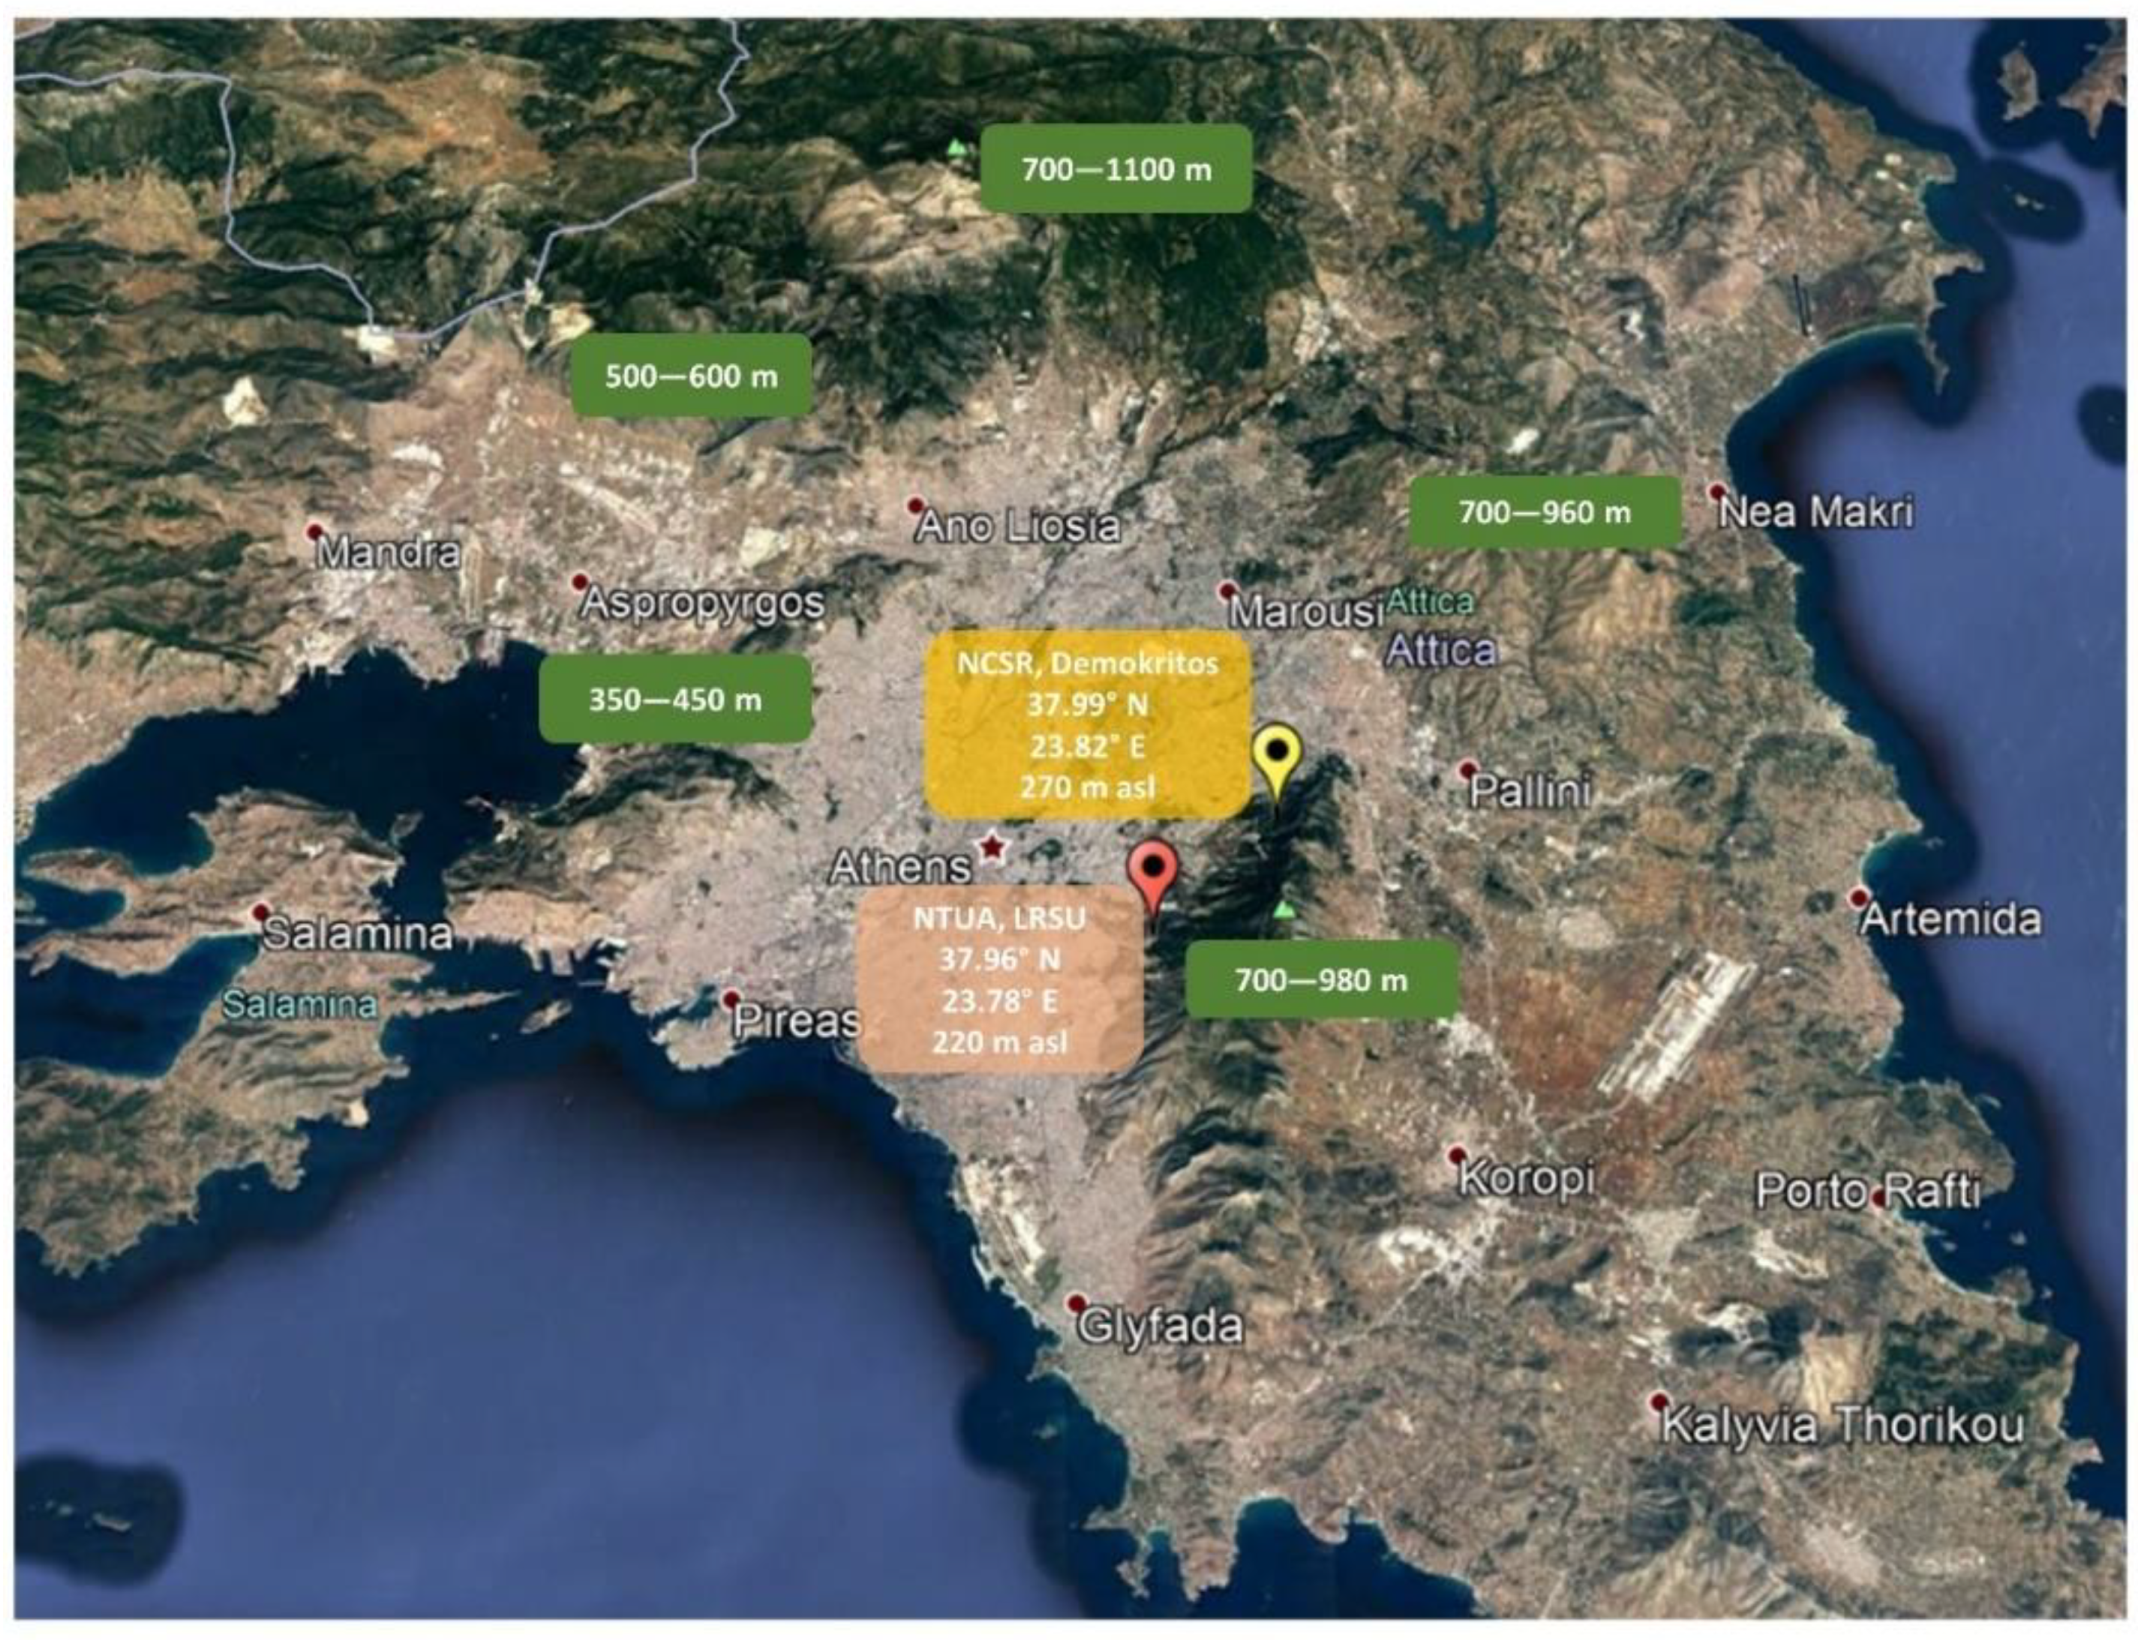
2.1. Lidar Systems at the National Technical University of Athens (NTUA)
2.2. Optical Particle Counter at the National Centre of Scientific Research (NCSR) “Demokritos”
2.3. WRF-Chem Model
2.4. MODIS Satellite Data
2.5. DREAM Dust Model
2.6. HYSPLIT Trajectory Model
3. Observations—Experimental Results
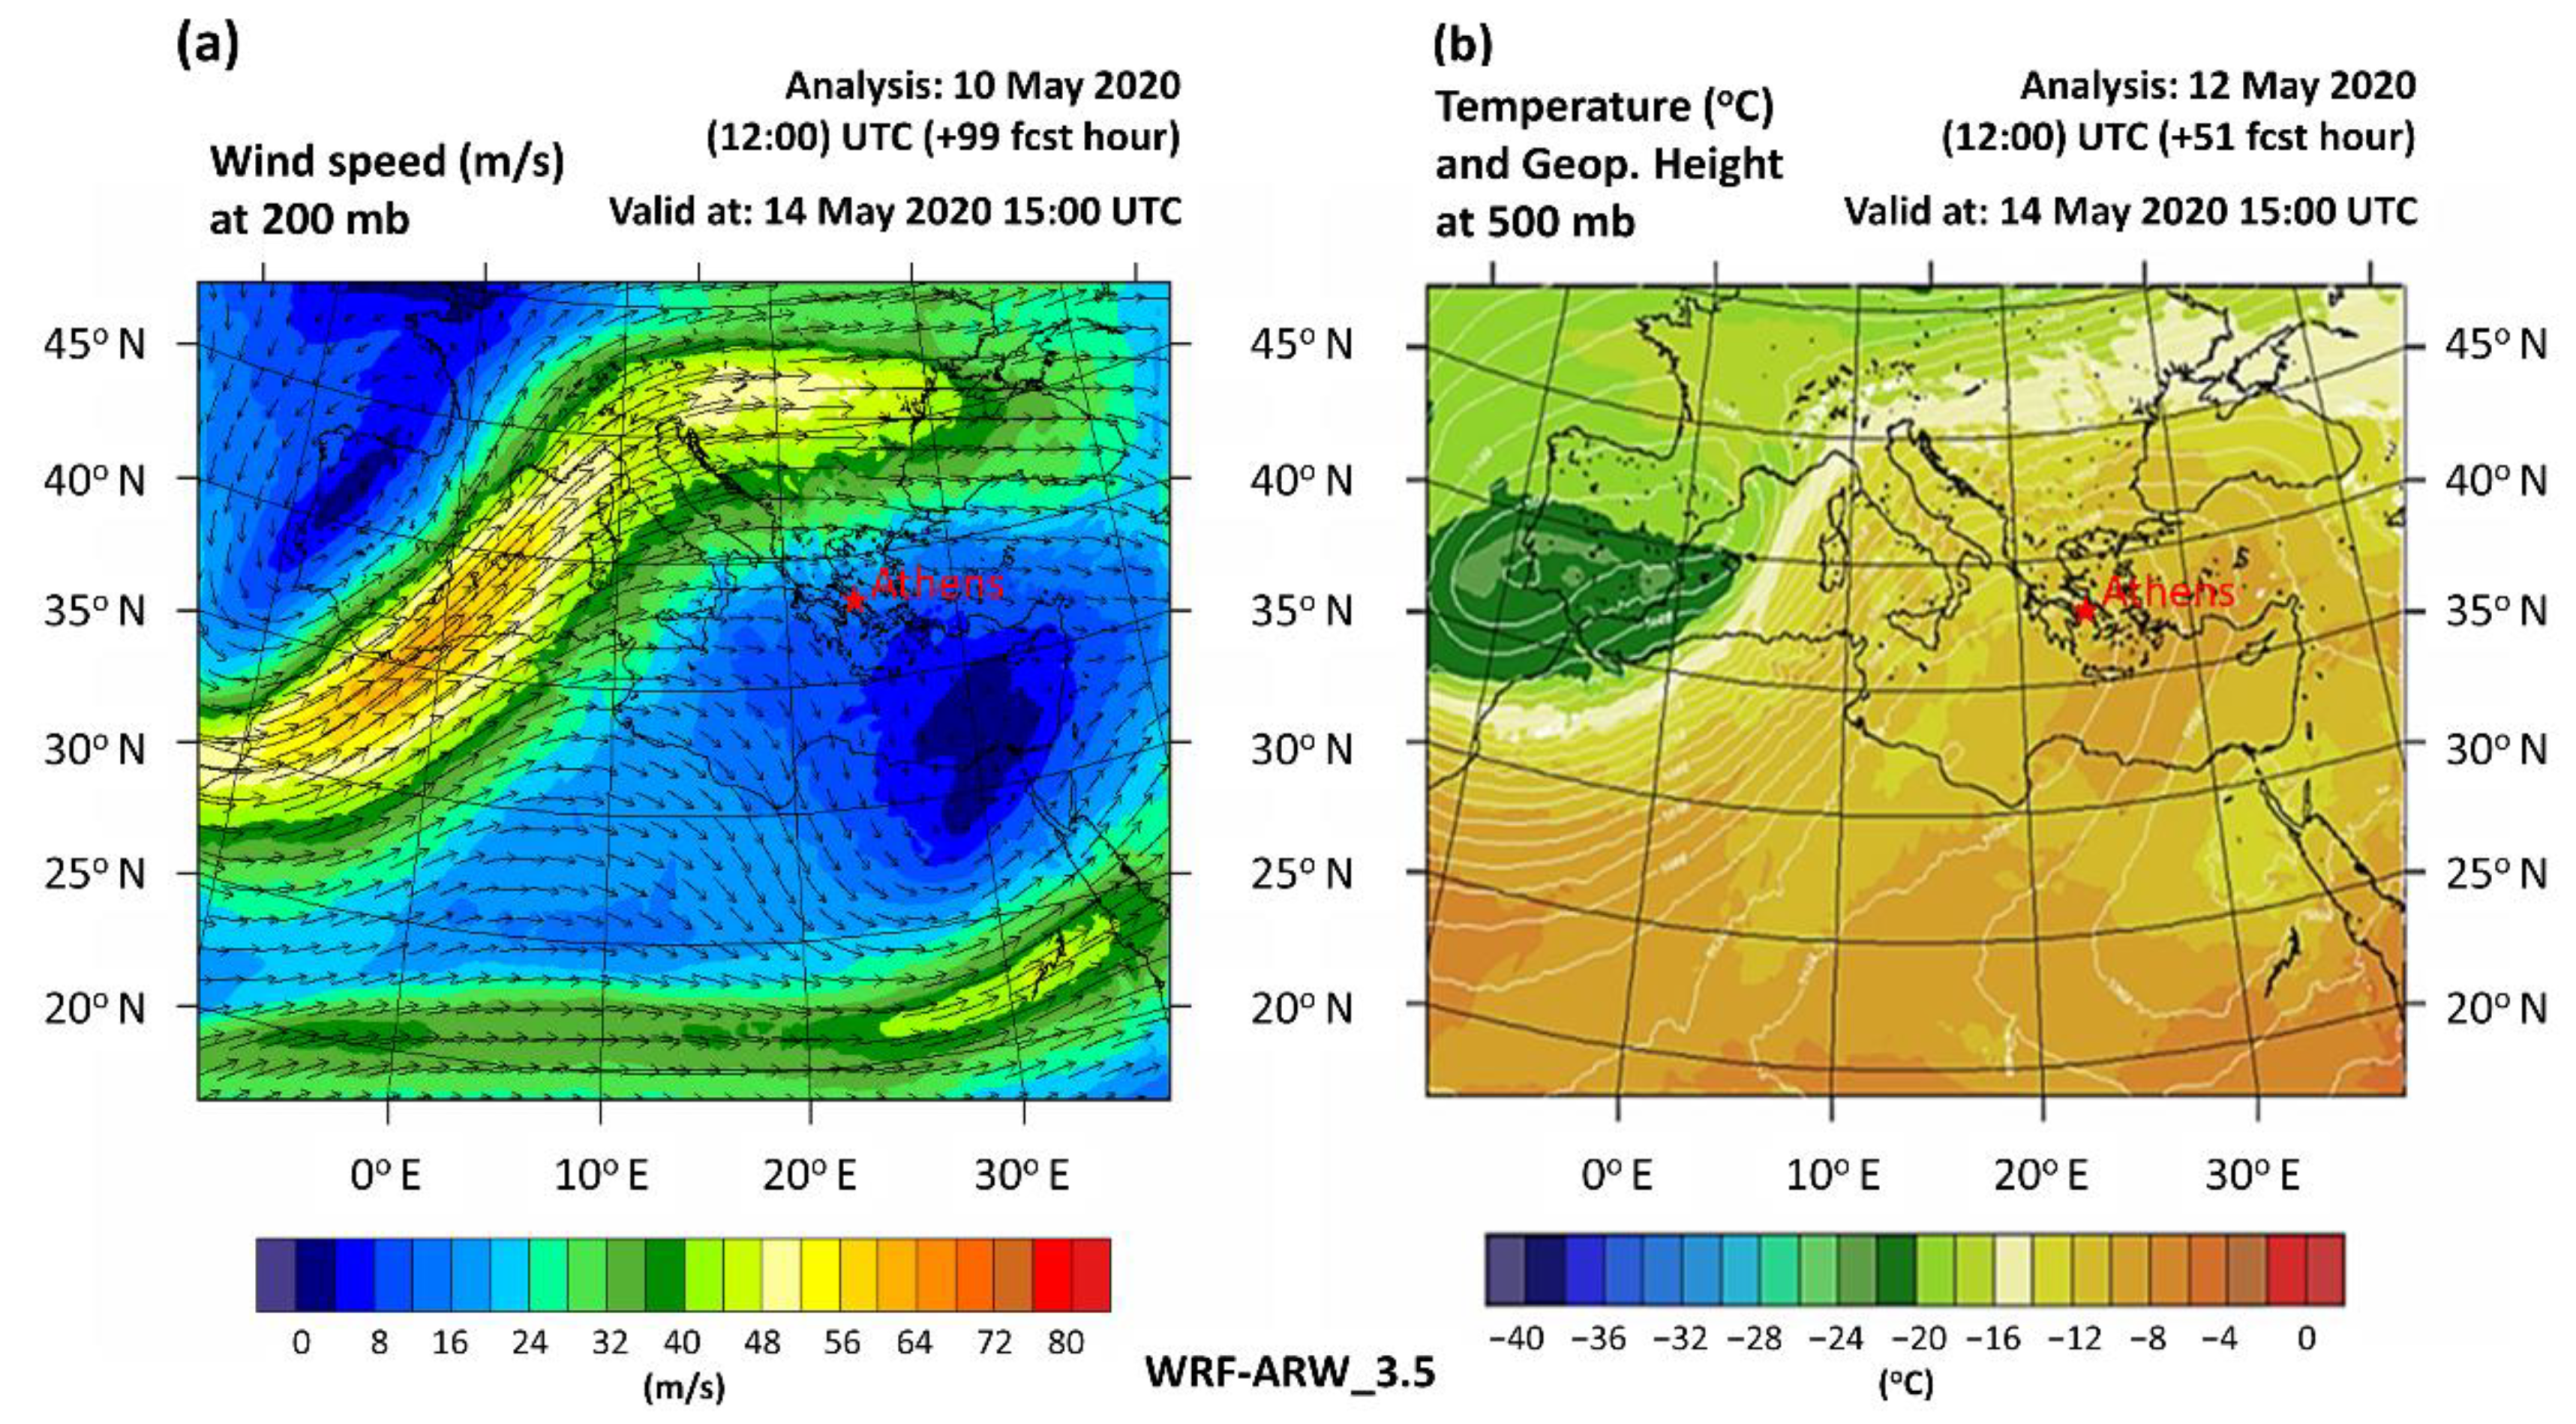
3.1. Synoptic Meteorological Description of the 11–20 May 2020 Dust Event
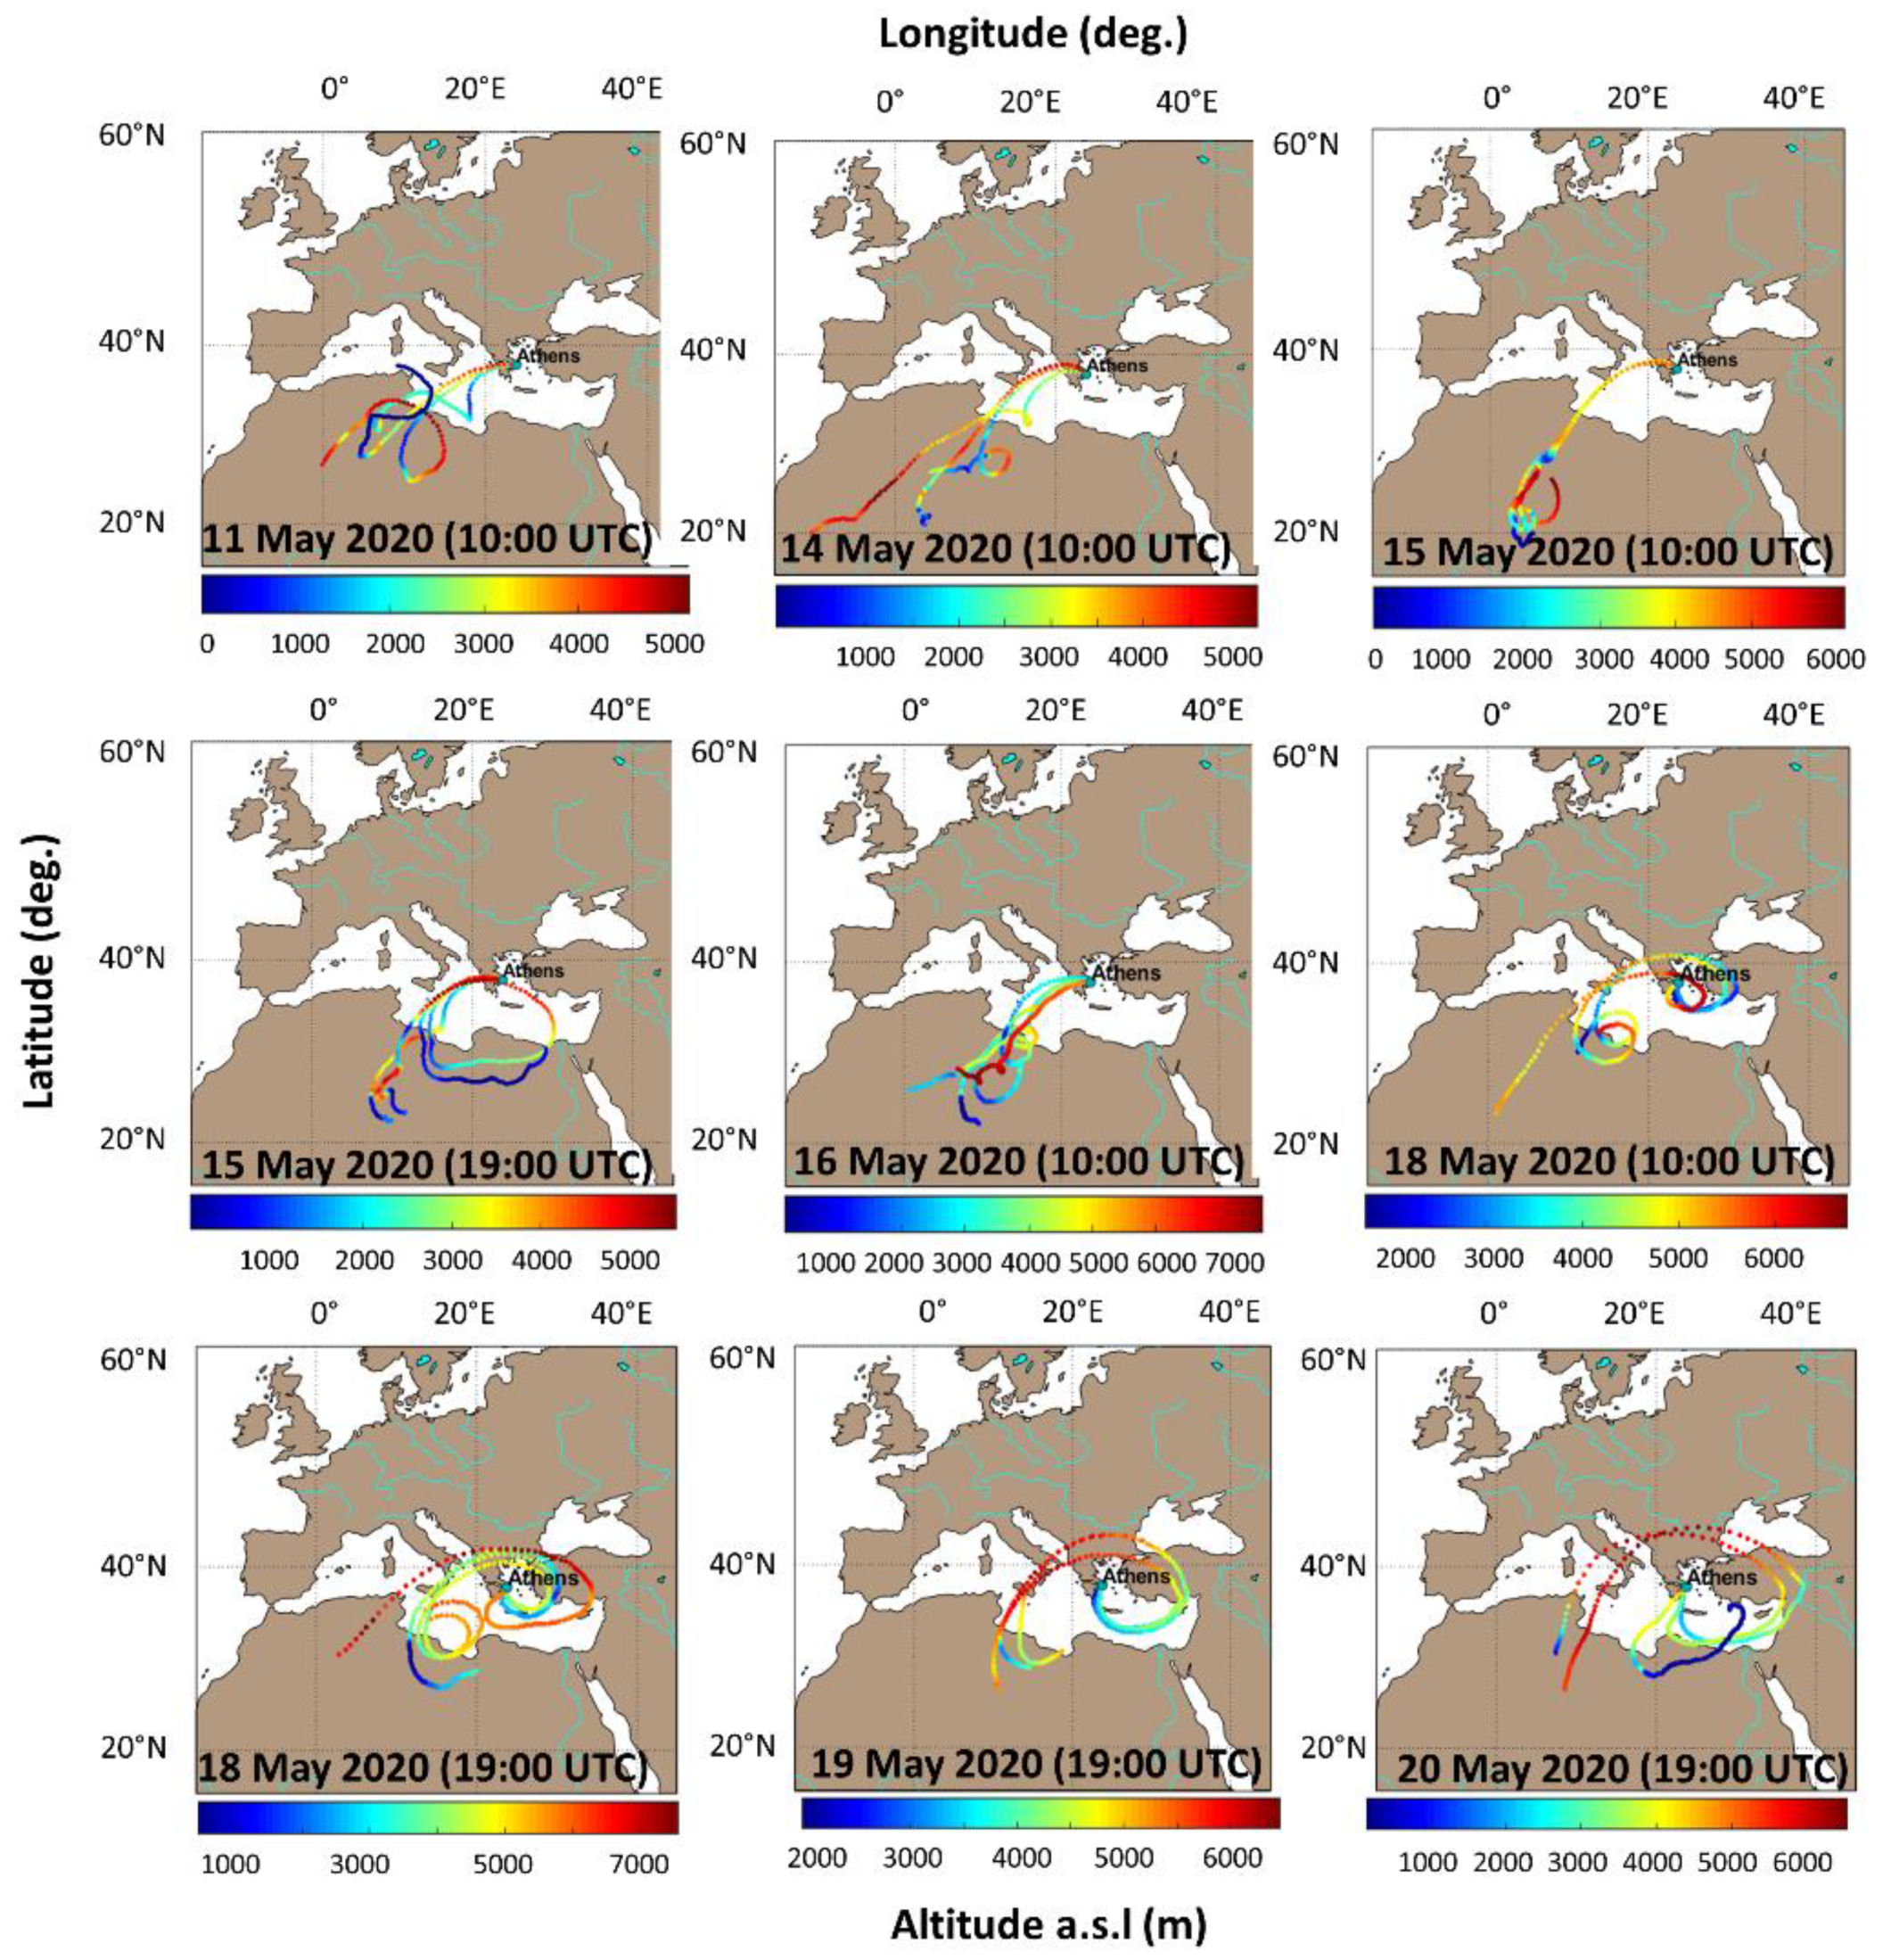
3.2. HYSPLIT Backward Trajectory Analysis
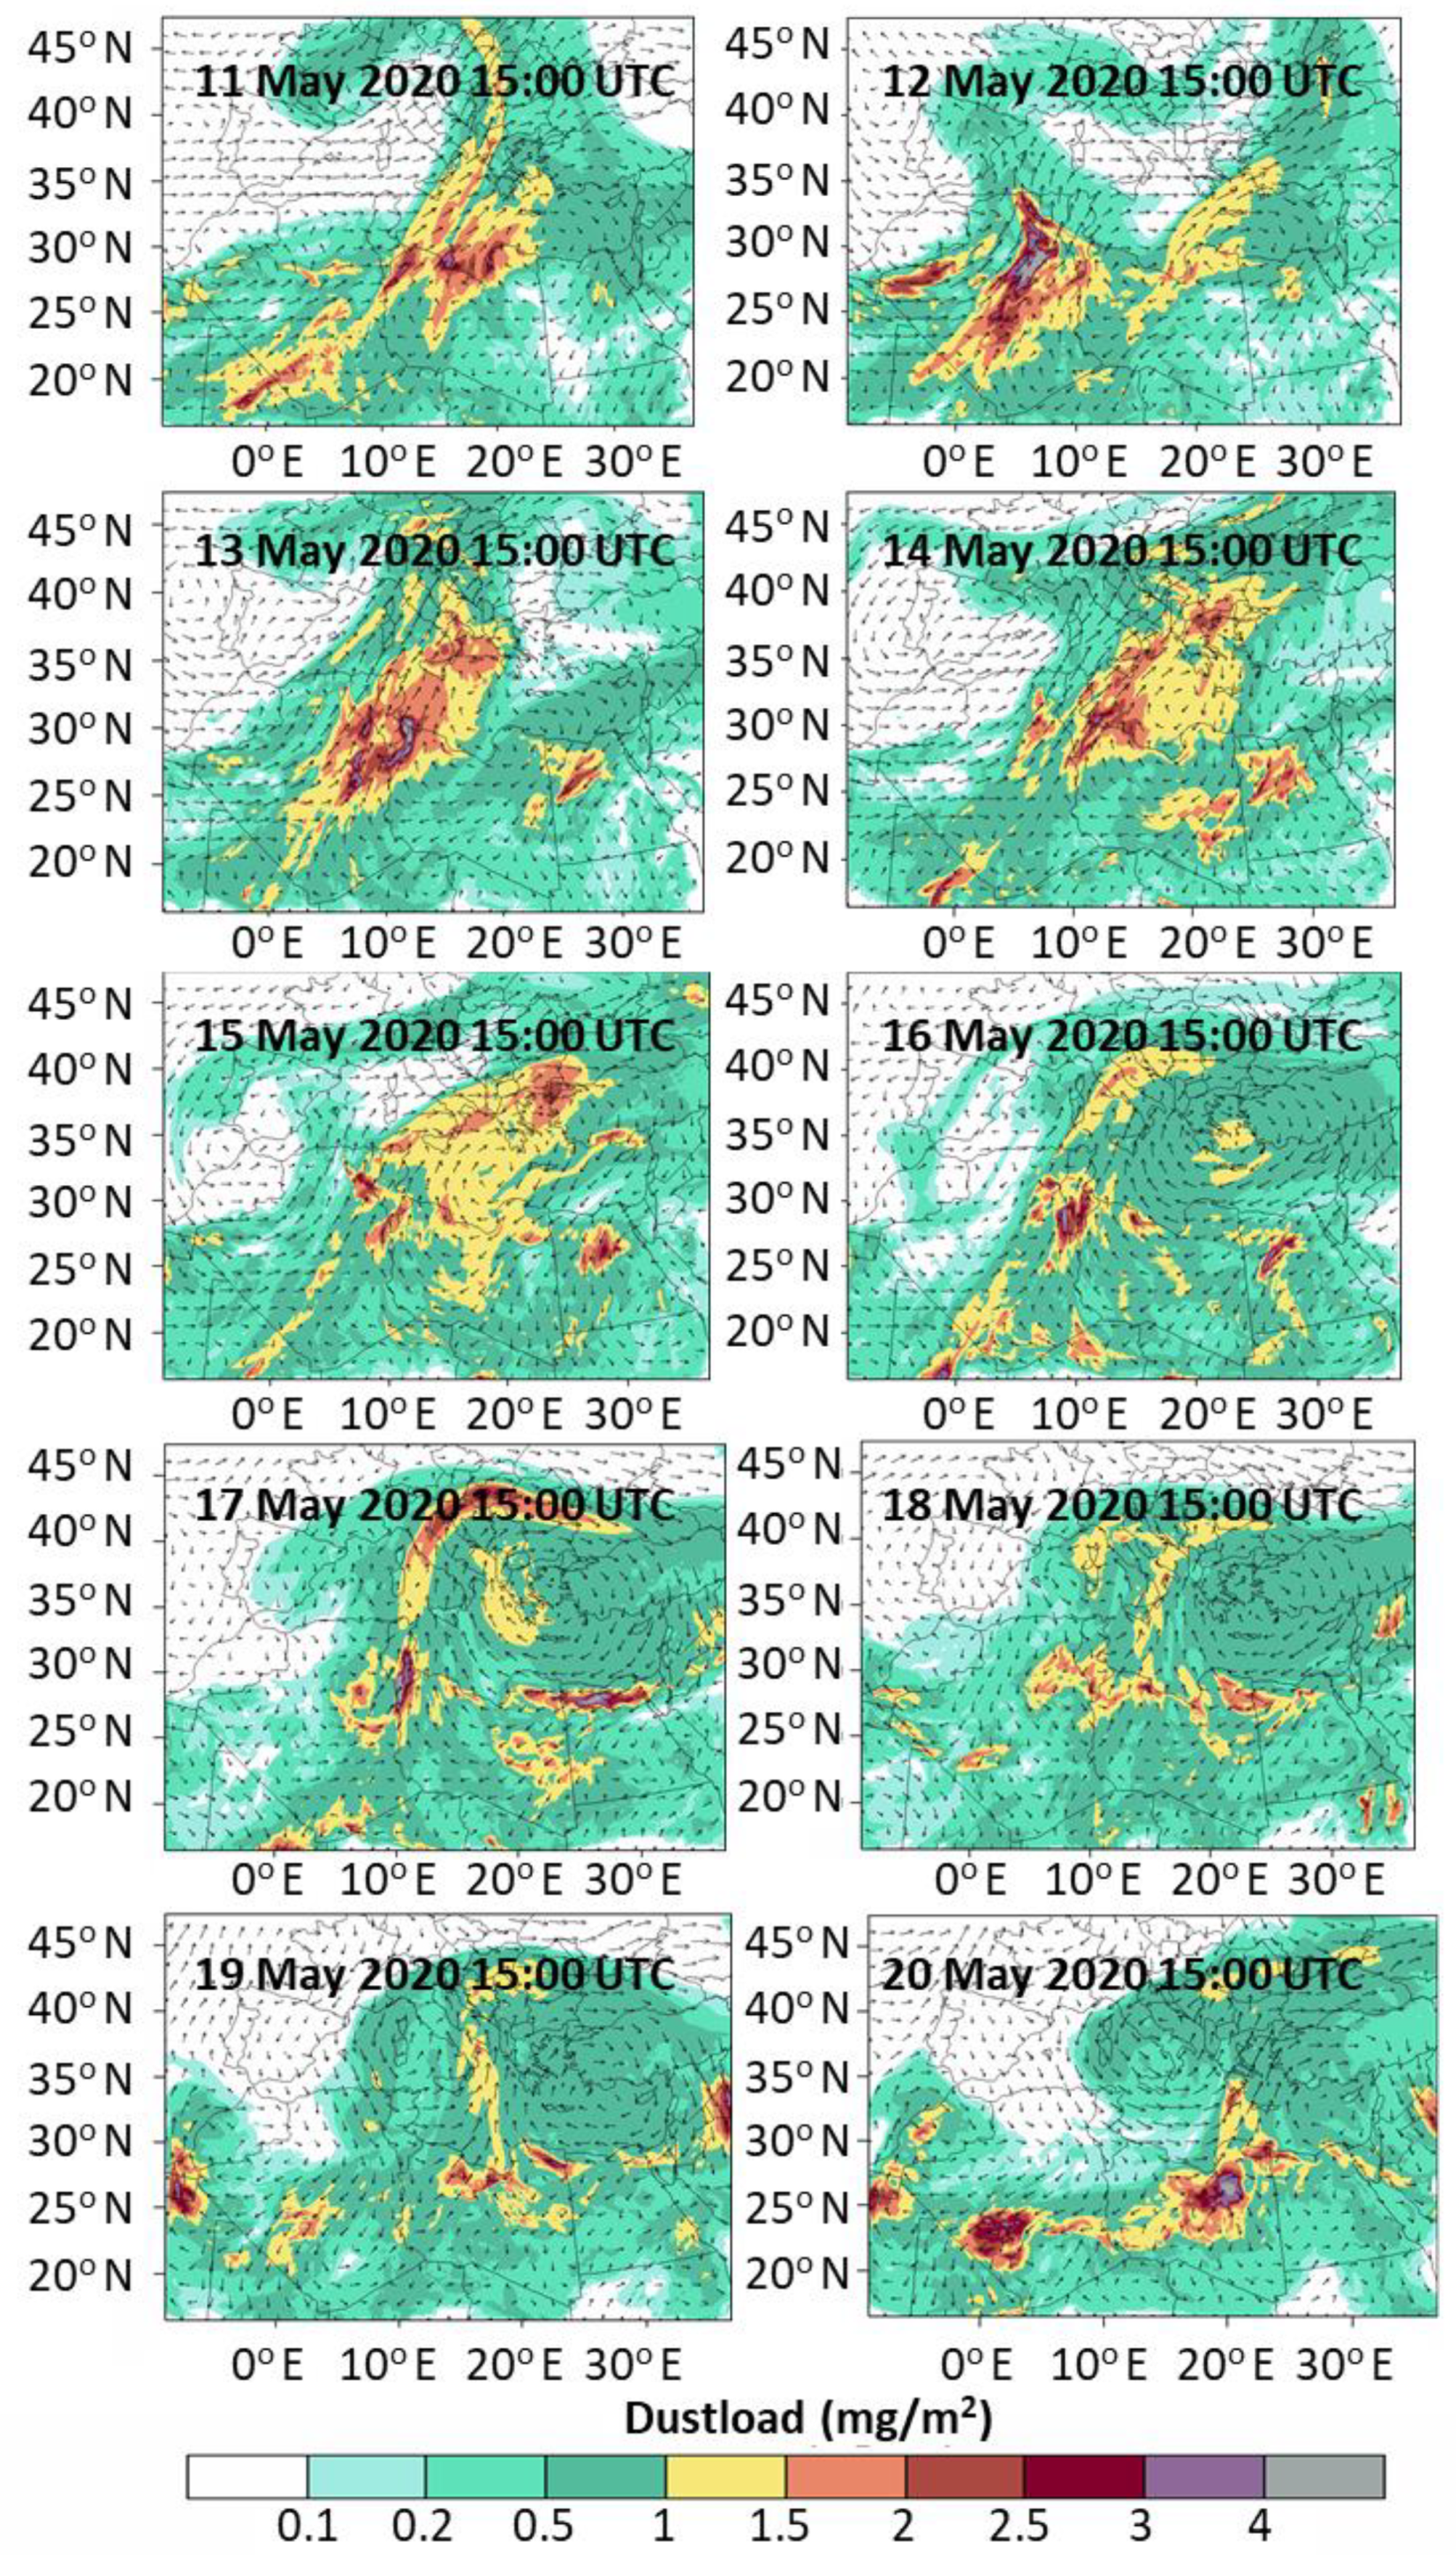
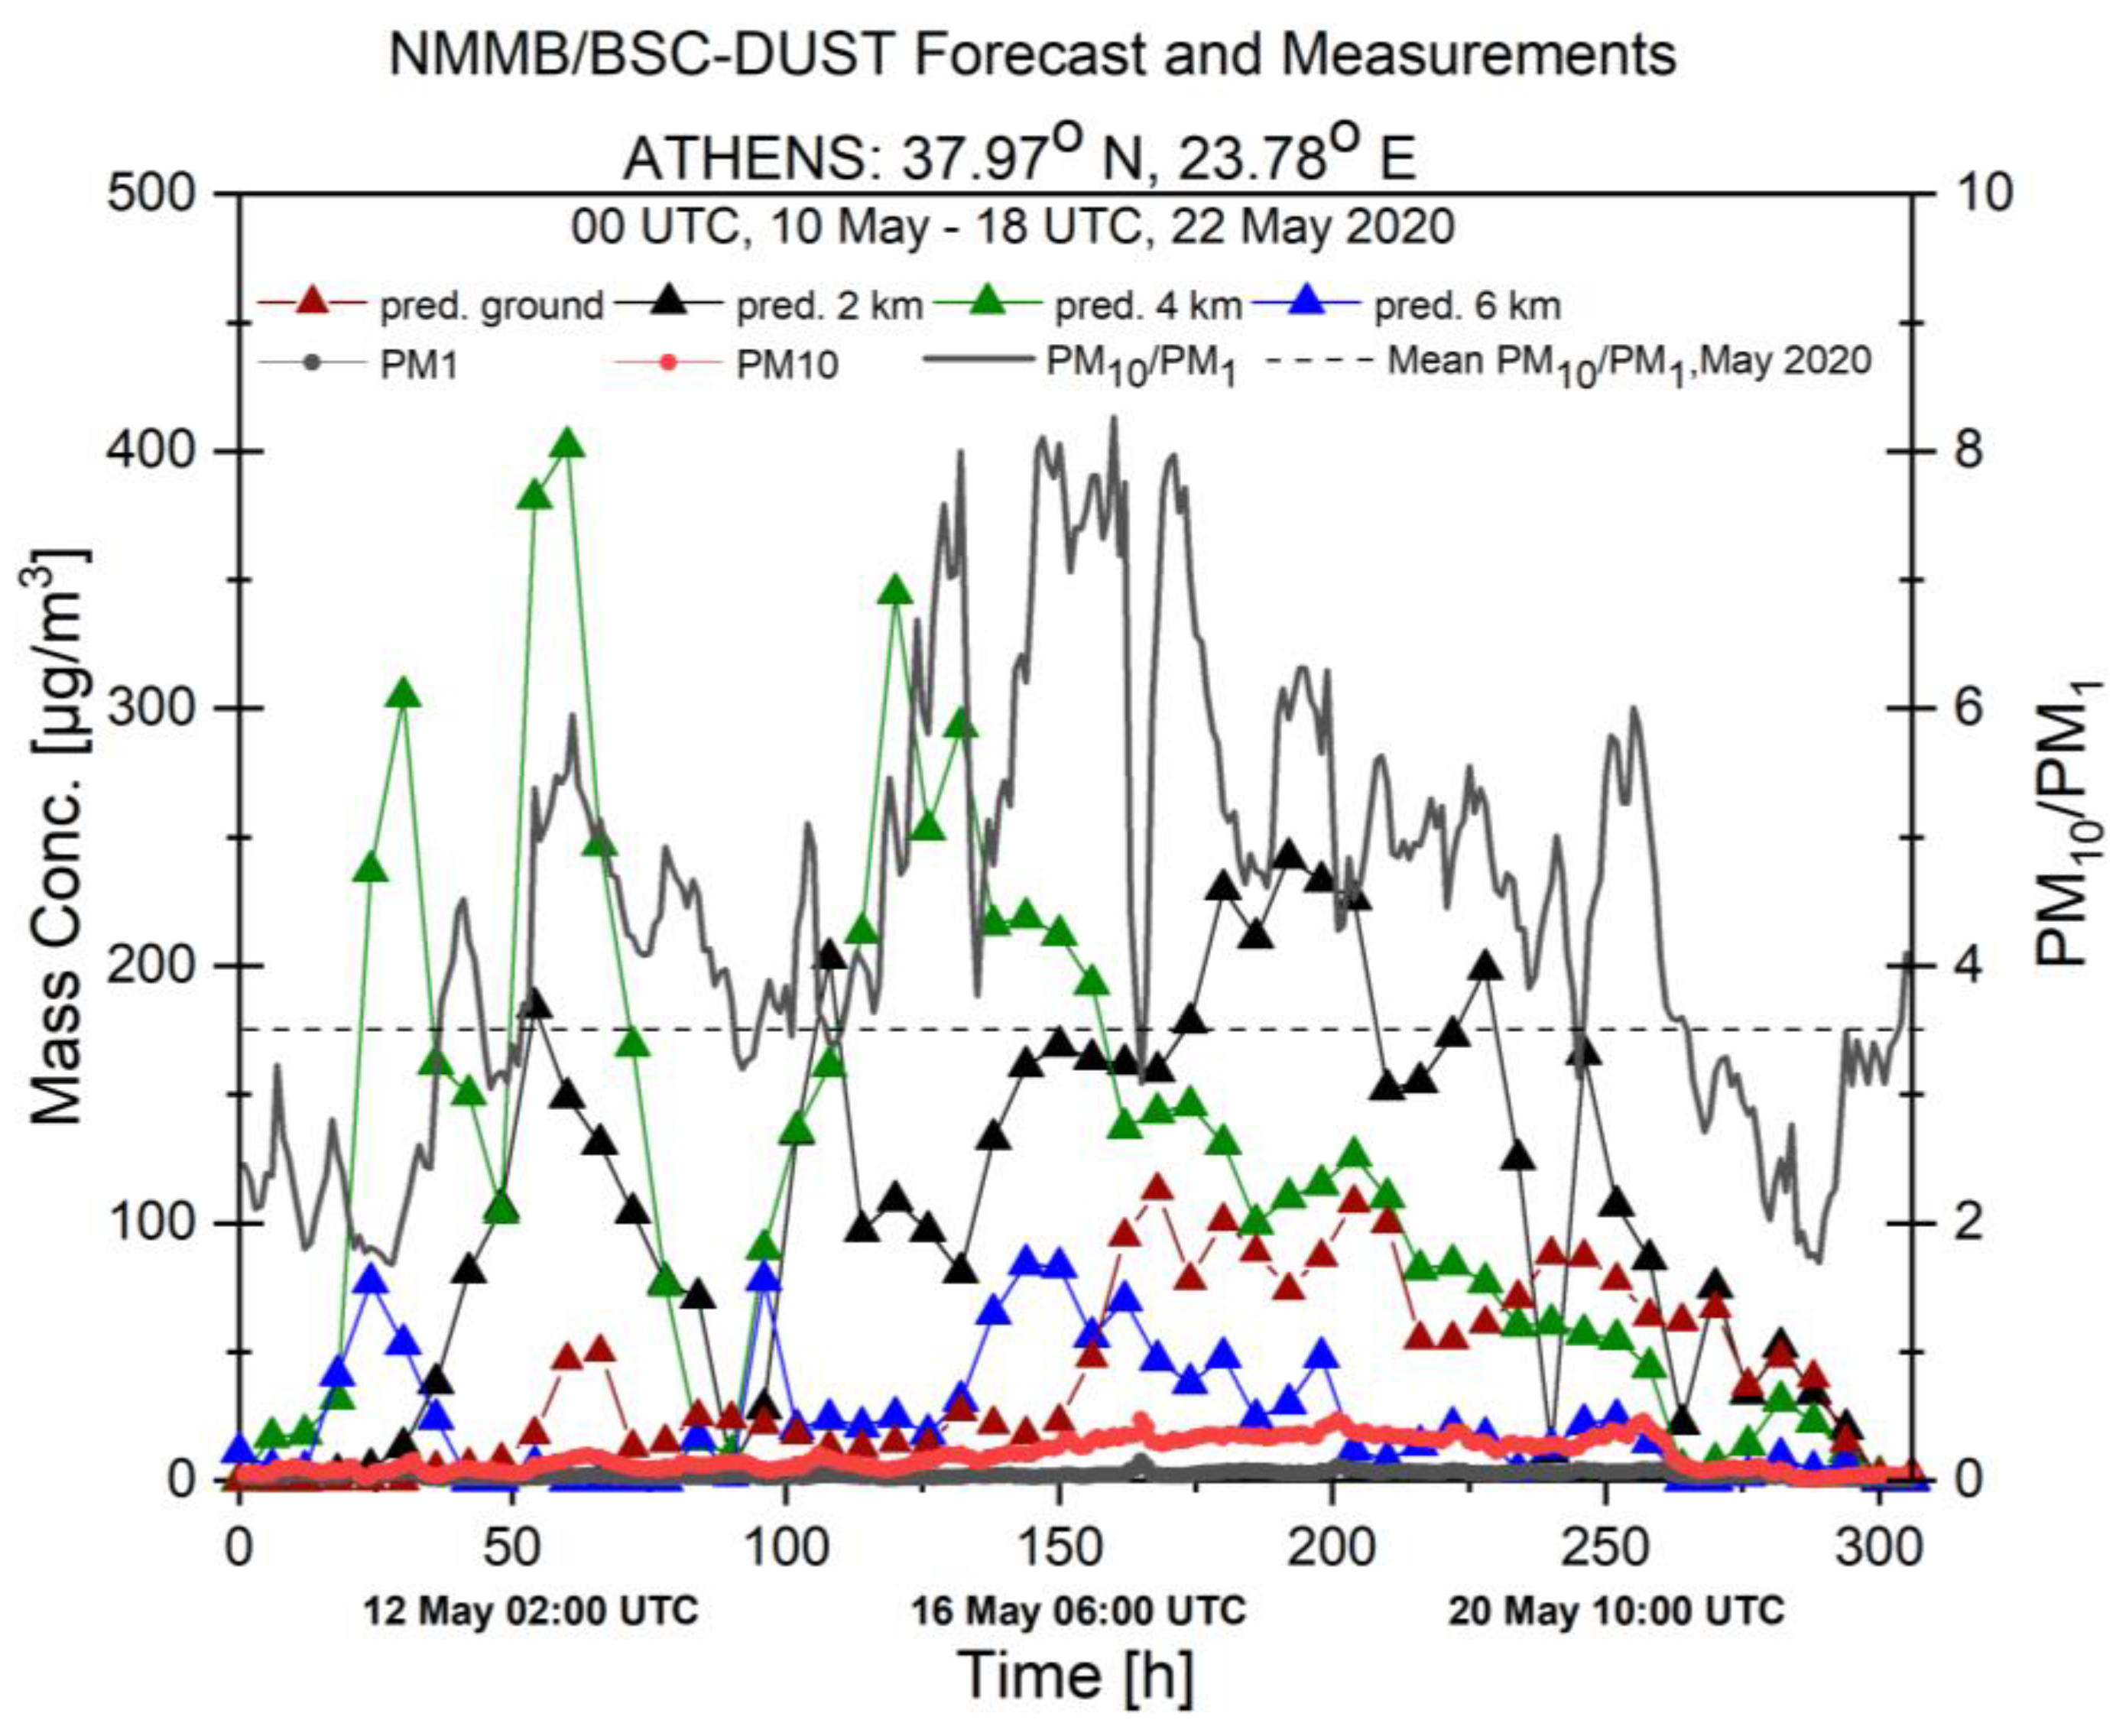
3.3. Dust Model Simulations
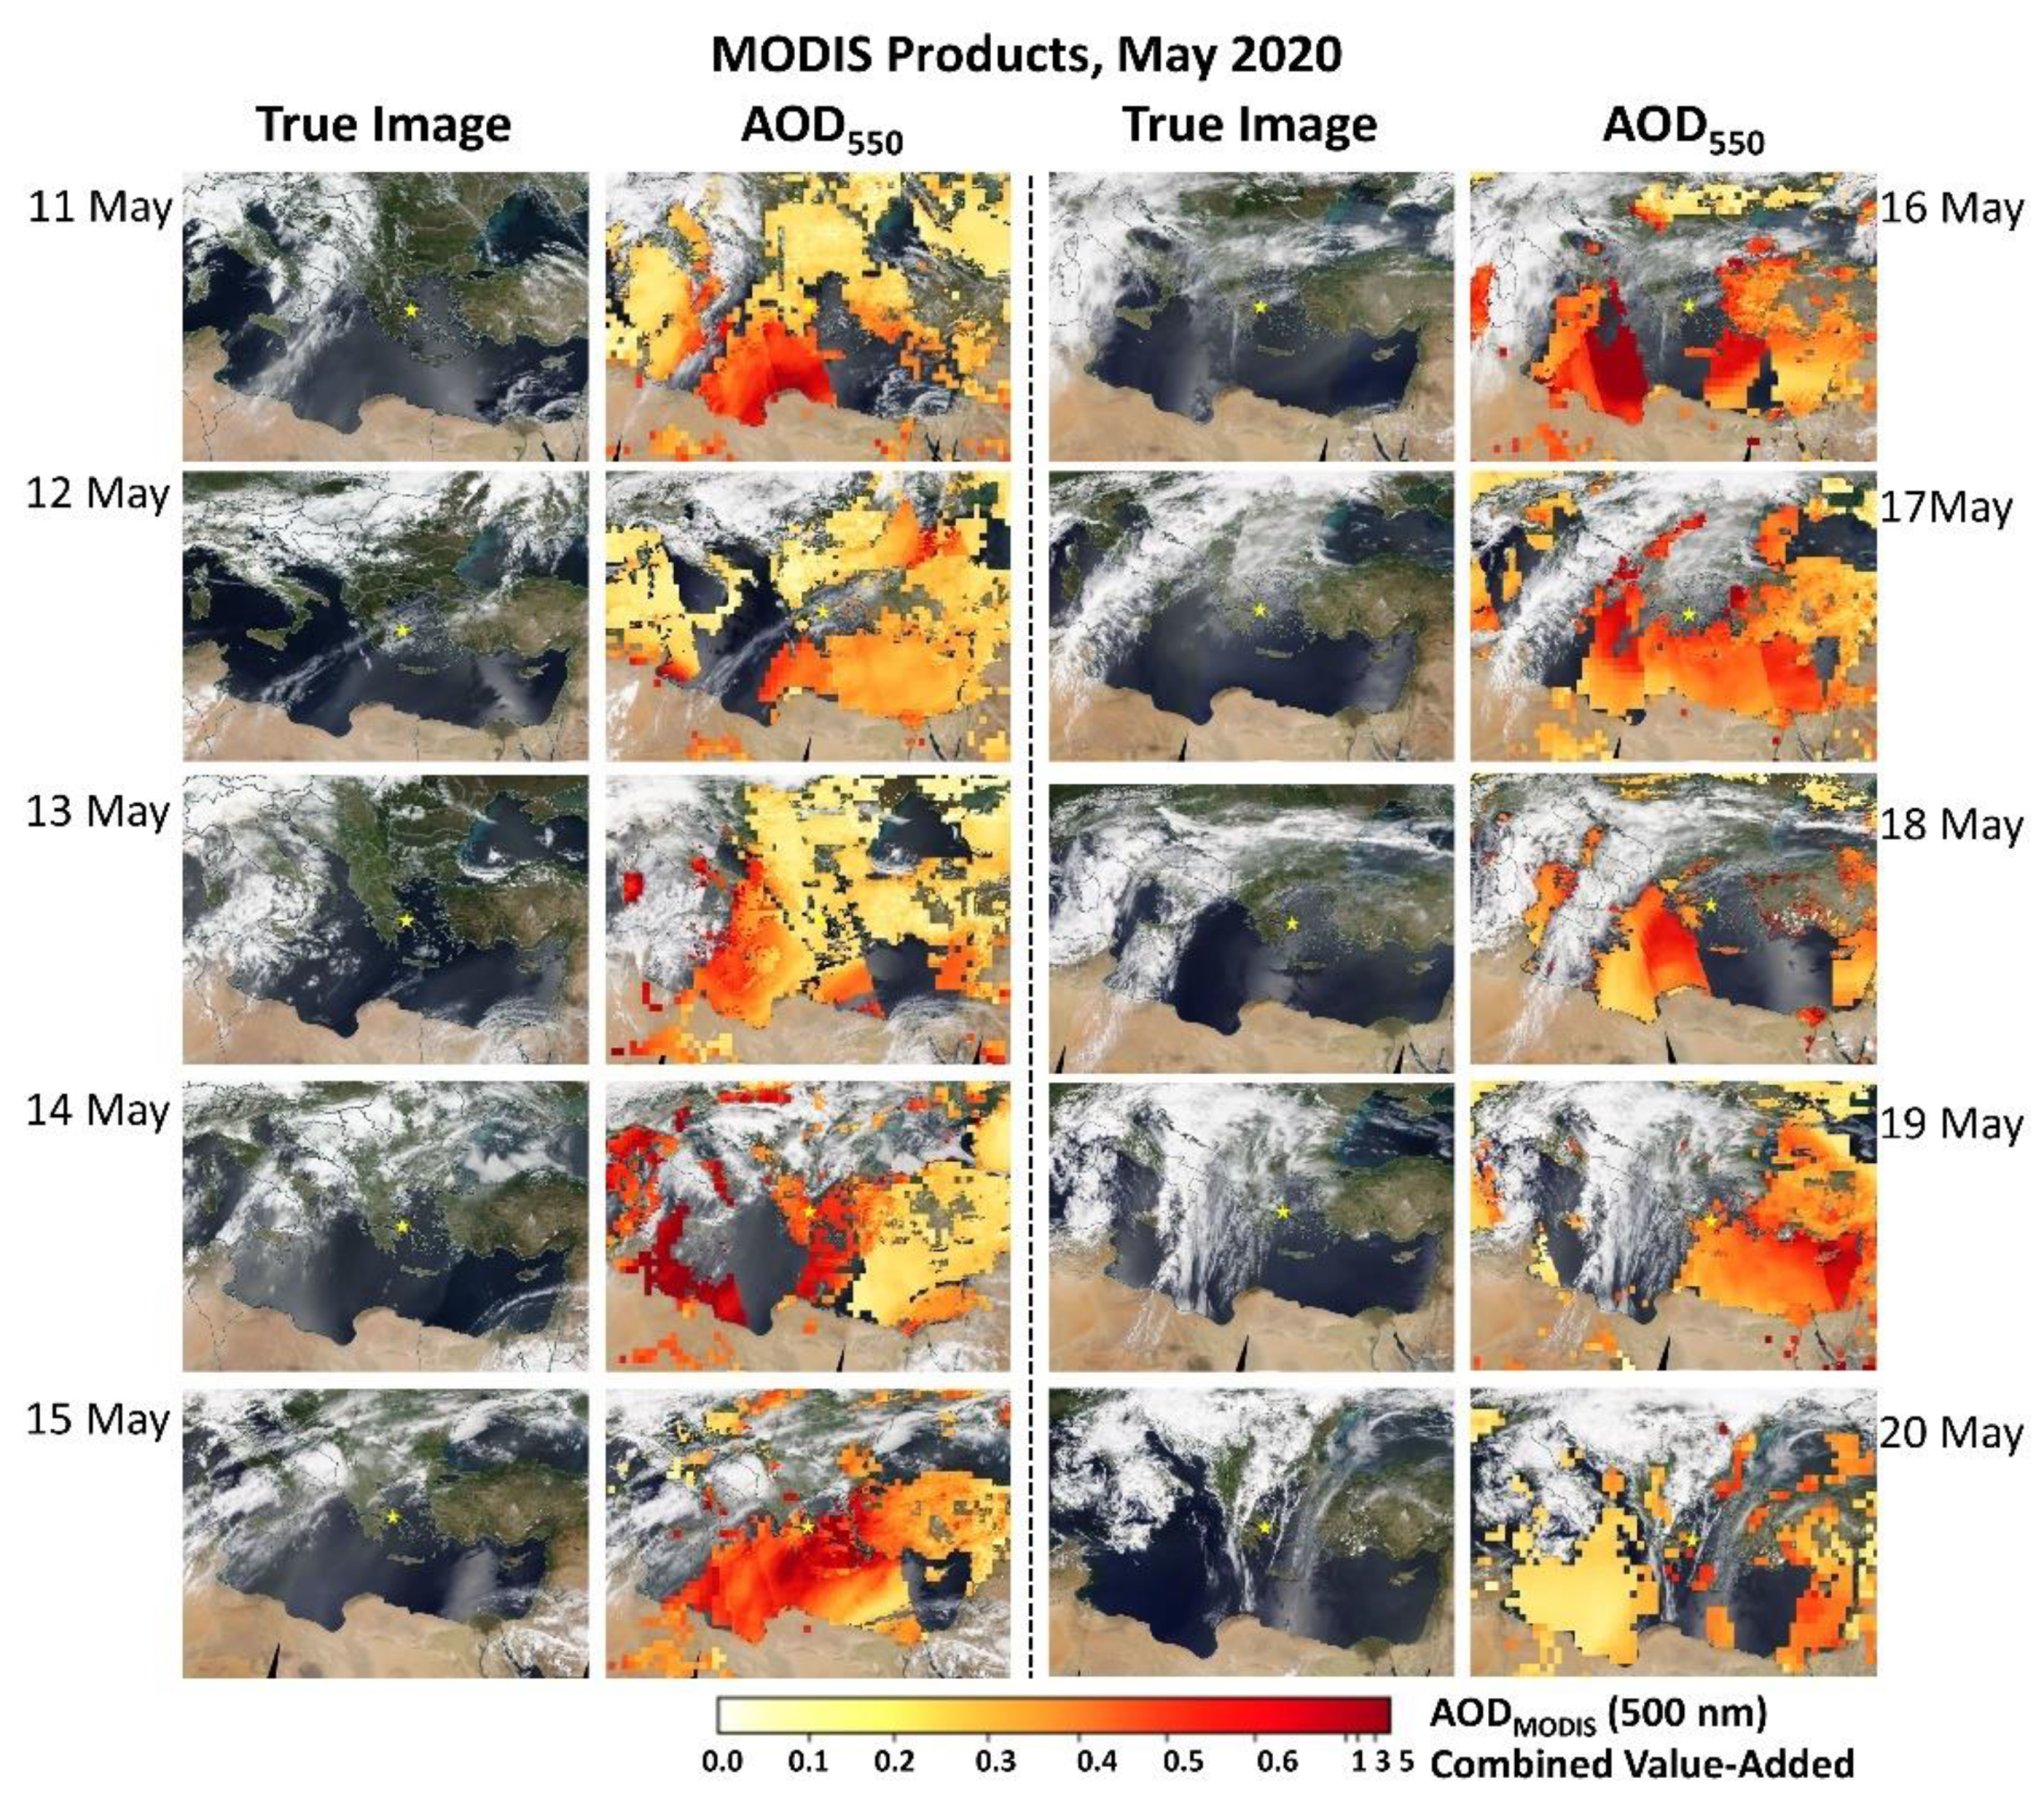
3.4. MODIS Satellite Data
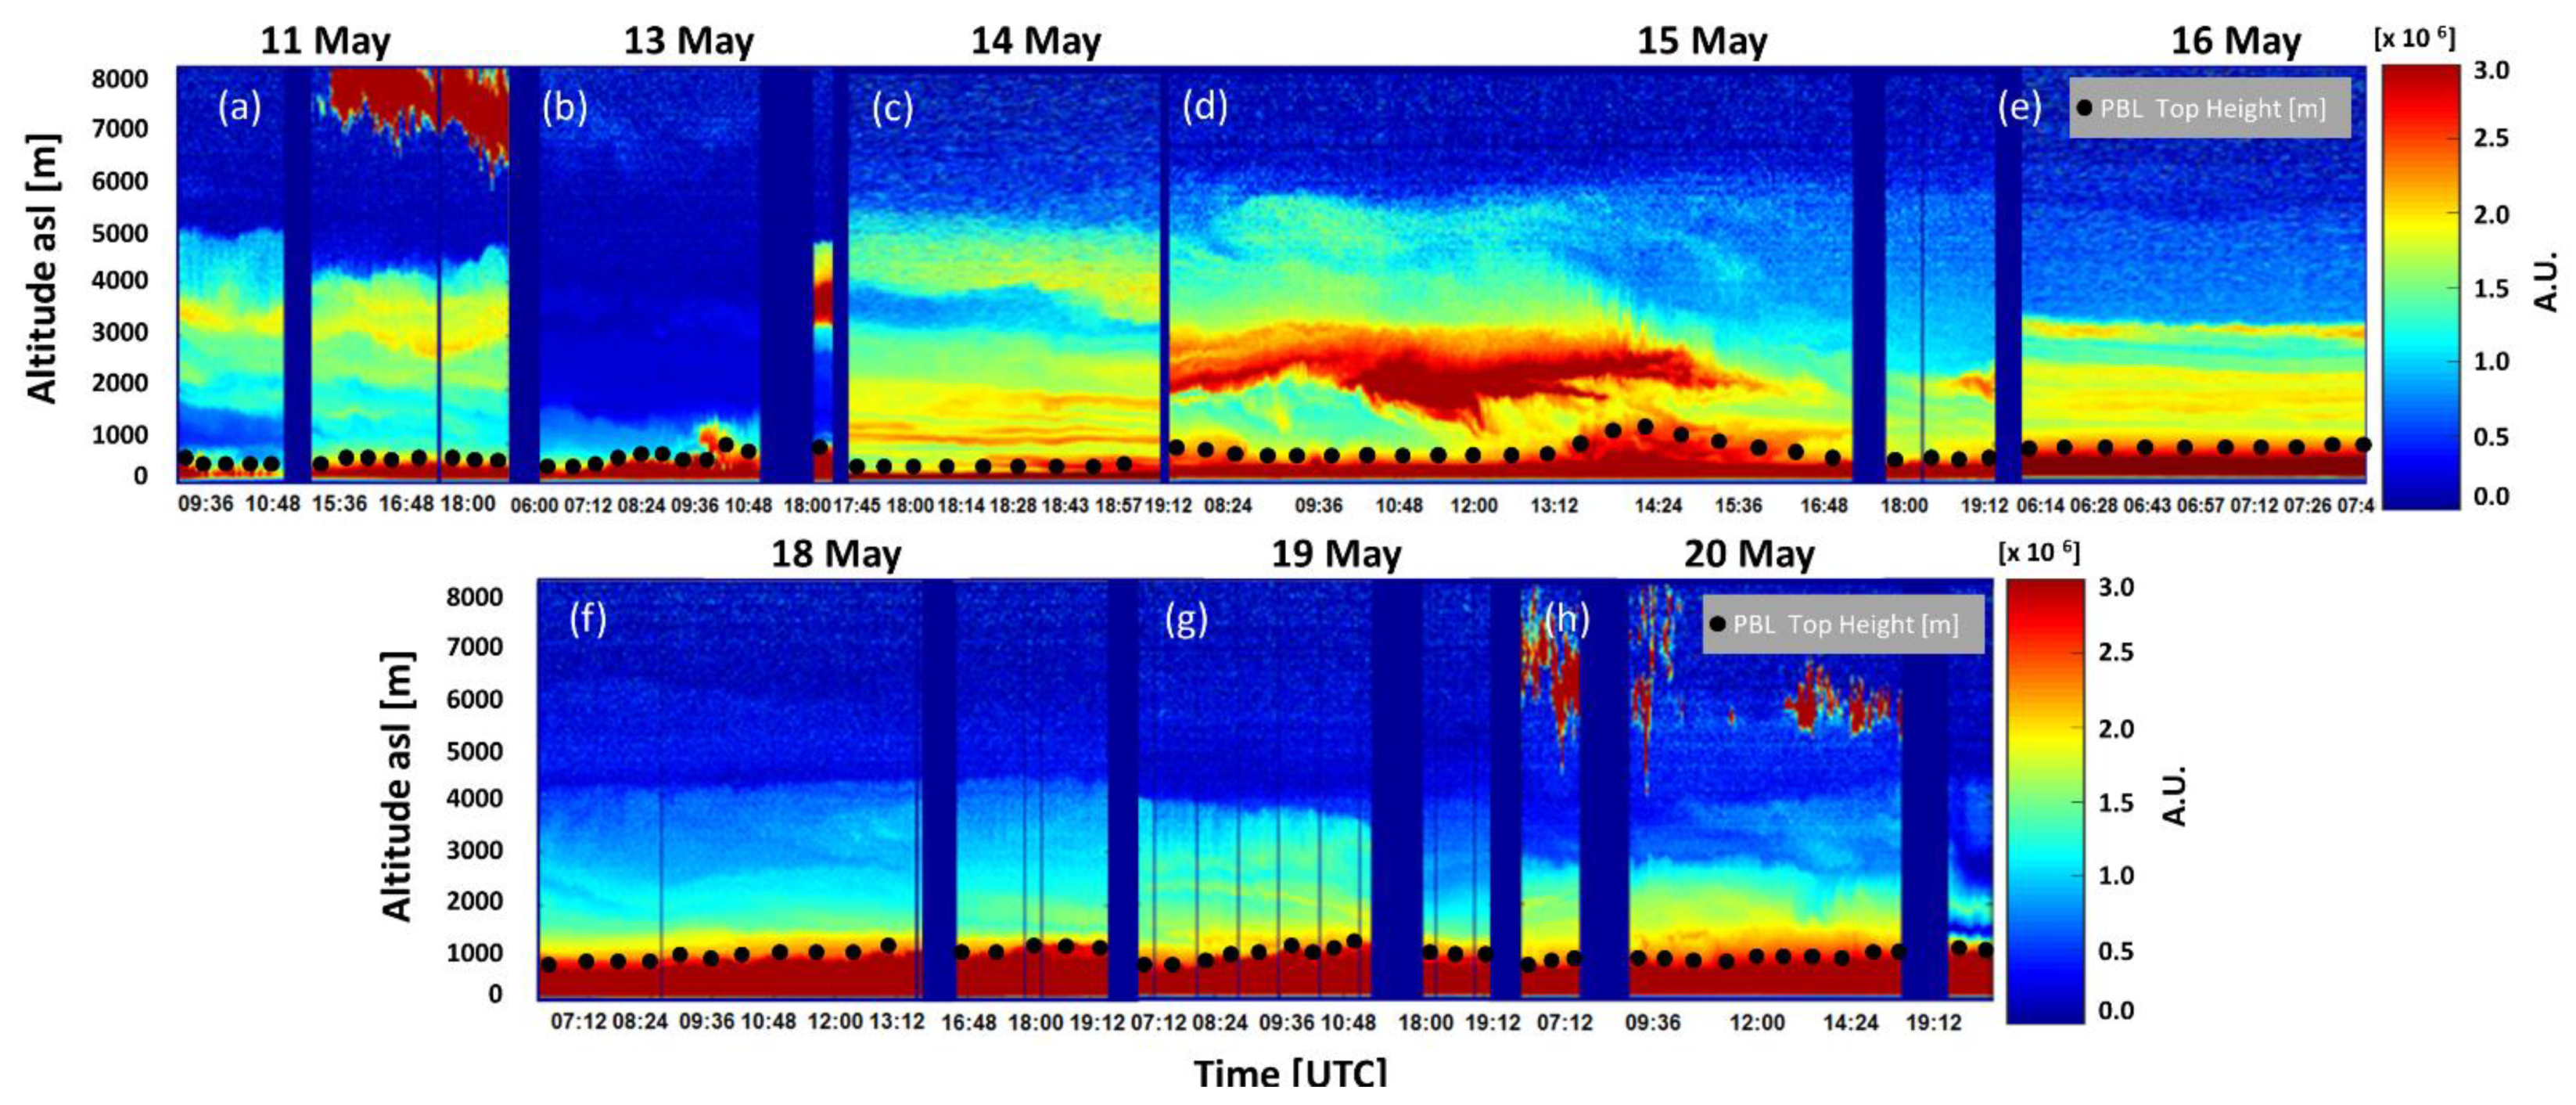
3.5. Ground-Based Aerosol Lidar Observations
4. Case Study Analysis
4.1. Case I: 15 May 2020
4.2. Case II: 18 May 2020
5. Radiative Effect Calculations Using LibRadtran
6. Conclusions
Author Contributions
Funding
Institutional Review Board Statement
Informed Consent Statement
Data Availability Statement
Acknowledgments
Conflicts of Interest
Appendix A


References
- Harrison, S.P.; Kohfeld, K.E.; Roelandt, C.; Claquin, T. The role of dust in climate changes today, at the last glacial maximum and in the future. Earth-Sci. Rev. 2001, 54, 43–80. [Google Scholar] [CrossRef]
- Teller, A.; Levin, Z. The effects of aerosols on precipitation and dimensions of subtropical clouds: A sensitivity study using a numerical cloud model. Atmos. Chem. Phys. 2006, 6, 67–80. [Google Scholar] [CrossRef] [Green Version]
- Weinzierl, B.; Sauer, D.; Minikin, A.; Reitebuch, O.; Dahlkötter, F.; Mayer, B.; Emde, C.; Tegen, I.; Gasteiger, J.; Petzold, A.; et al. On the visibility of airborne volcanic ash and mineral dust from the pilot’s perspective in flight. Phys. Chem. Earth 2012, 45–46, 87–102. [Google Scholar] [CrossRef] [Green Version]
- Griffin, D.W. Atmospheric movement of microorganisms in clouds of desert dust and implications for human health. Clin. Microbiol. Rev. 2007, 20, 459–477. [Google Scholar] [CrossRef] [PubMed] [Green Version]
- Baddock, M.C.; Strong, C.L.; Murray, P.S.; McTainsh, G.H. Aeolian dust as a transport hazard. Atmos. Environ. 2013, 71, 7–14. [Google Scholar] [CrossRef] [Green Version]
- Middleton, N.; Yiallouros, P.; Kleanthous, S.; Kolokotroni, O.; Schwartz, J.; Dockery, D.W.; Demokritou, P.; Koutrakis, P. A 10-year time-series analysis of respiratory and cardiovascular morbidity in Nicosia, Cyprus: The effect of short-term changes in air pollution and dust storms. Environ. Health A Glob. Access Sci. Source 2008, 7, 1–16. [Google Scholar] [CrossRef] [Green Version]
- Goudie, A.S. Desert dust and human health disorders. Environ. Int. 2014, 63, 101–113. [Google Scholar] [CrossRef]
- Giannadaki, D.; Pozzer, A.; Lelieveld, J. Modeled global effects of airborne desert dust on air quality and premature mortality. Atmos. Chem. Phys. 2014, 14, 957–968. [Google Scholar] [CrossRef] [Green Version]
- Zhang, X.; Zhao, L.; Tong, D.Q.; Wu, G.; Dan, M.; Teng, B. A systematic review of global desert dust and associated human health effects. Atmosphere 2016, 7. [Google Scholar] [CrossRef] [Green Version]
- Myhre, G.; Shindell, D.; Bréon, F.-M.; Collins, W.; Fuglestvedt, J.; Huang, J.; Koch, D.; Lamarque, J.-F.; Lee, D.; Mendoza, B.; et al. Anthropogenic and natural radiative forcing. In Climate Change 2013: The Physical Science Basis; Working Group I Contribution to the Fifth Assessment Report of the Intergovernmental Panel on Climate Change; Cambridge University Press: Cambridge, UK, 2013; pp. 659–740. [Google Scholar] [CrossRef]
- Adebiyi, A.A.; Kok, J.F. Climate models miss most of the coarse dust in the atmosphere. Sci. Adv. 2020, 6, 1–10. [Google Scholar] [CrossRef] [PubMed] [Green Version]
- Andreae, M.O.; Rosenfeld, D. Aerosol-cloud-precipitation interactions. Part 1. The nature and sources of cloud-active aerosols. Earth-Science Rev. 2008, 89, 13–41. [Google Scholar] [CrossRef]
- Quijano, A.L.; Sokolik, I.N.; Toon, O.B. Radiative heating rates and direct radiative forcing by mineral dust in cloudy atmospheric conditions. J. Geophys. Res. Atmos. 2000, 105, 12207–12219. [Google Scholar] [CrossRef] [Green Version]
- Rosenfeld, D. Suppression of rain and snow by urban and industrial air pollution. Science 2000, 287, 1793–1796. [Google Scholar] [CrossRef] [PubMed]
- Sassen, K.; DeMott, P.J.; Prospero, J.M.; Poellot, M.R. Saharan dust storms and indirect aerosol effects on clouds: CRYSTAL-FACE results. Geophys. Res. Lett. 2003, 30, 1–4. [Google Scholar] [CrossRef] [Green Version]
- Seigel, R.B.; Van Den Heever, S.C.; Saleeby, S.M. Mineral dust indirect effects and cloud radiative feedbacks of a simulated idealized nocturnal squall line. Atmos. Chem. Phys. 2013, 13, 4467–4485. [Google Scholar] [CrossRef] [Green Version]
- Pozzer, A.; Dominici, F.; Haines, A.; Witt, C.; Münzel, T.; Lelieveld, J. Regional and global contributions of air pollution to risk of death from COVID-19. Cardiovasc. Res. 2020, 116, 2247–2253. [Google Scholar] [CrossRef] [PubMed]
- Mamouri, R.E.; Papayannis, A.; Amiridis, V.; Müller, D.; Kokkalis, P.; Rapsomanikis, S.; Karageorgos, E.T.; Tsaknakis, G.; Nenes, A.; Kazadzis, S.; et al. Multi-wavelength Raman lidar, sun photometric and aircraft measurements in combination with inversion models for the estimation of the aerosol optical and physico-chemical properties over Athens, Greece. Atmos. Meas. Tech. 2012, 5, 1793–1808. [Google Scholar] [CrossRef]
- Granados-Muñoz, M.J.; Bravo-Aranda, J.A.; Baumgardner, D.; Guerrero-Rascado, J.L.; Pérez-Ramírez, D.; Navas-Guzmán, F.; Veselovskii, I.; Lyamani, H.; Valenzuela, A.; Olmo, F.J.; et al. A comparative study of aerosol microphysical properties retrieved from ground-based remote sensing and aircraft in situ measurements during a Saharan dust event. Atmos. Meas. Tech. 2016, 9, 1113–1133. [Google Scholar] [CrossRef] [Green Version]
- Soupiona, O.; Papayannis, A.; Kokkalis, P.; Foskinis, R.; Sánchez Hernández, G.; Ortiz-Amezcua, P.; Mylonaki, M.; Papanikolaou, C.-A.; Papagiannopoulos, N.; Samaras, S.; et al. Saharan dust intrusions over the northern Mediterranean region in the frame of EARLINET (2014-2017): Properties and impact in radiative forcing. Atmos. Chem. Phys. 2020, 20, 15147–15166. [Google Scholar] [CrossRef]
- Engelstaedter, S.; Tegen, I.; Washington, R. North African dust emissions and transport. Earth-Sci. Rev. 2006, 79, 73–100. [Google Scholar] [CrossRef]
- Tanaka, T.Y.; Chiba, M. A numerical study of the contributions of dust source regions to the global dust budget. Glob. Planet. Change 2006, 52, 88–104. [Google Scholar] [CrossRef]
- Prospero, J.M. Saharan Dust Transport over the North Atlantic Ocean and Mediterranean: An Overview. Impact Desert Dust Mediterr. 1996, 133–151. [Google Scholar] [CrossRef]
- Hamonou, E.; Chazette, P.; Balis, D.; Dulac, F.; Schneider, X.; Galani, E.; Ancellet, G.; Papayannis, A. Characterization of the vertical structure of Saharan dust export to the Mediterranean basin. J. Geophys. Res. Atmos. 1999, 104, 22257–22270. [Google Scholar] [CrossRef] [Green Version]
- Dunion, J.P.; Velden, C.S. The impact of the Saharan Air Layer on Atlantic tropical cyclone activity. Bull. Am. Meteorol. Soc. 2004, 85, 353–365. [Google Scholar] [CrossRef] [Green Version]
- Balis, D.; Amiridis, V.; Kazadzis, S.; Papayannis, A.; Tsaknakis, G.; Tzortzakis, S.; Kalivitis, N.; Vrekoussis, M.; Kanakidou, M.; Mihalopoulos, N.; et al. Optical characteristics of desert dust over the east Mediterranean during summer: A case study. Ann. Geophys. 2006, 24, 807–821. [Google Scholar] [CrossRef] [Green Version]
- Schepanski, K.; Tegen, I.; Todd, M.C.; Heinold, B.; Bönisch, G.; Laurent, B.; Macke, A. Meteorological processes forcing Saharan dust emission inferred from MSG-SEVIRI observations of subdaily dust source activation and numerical models. J. Geophys. Res. Atmos. 2009, 114, 1–18. [Google Scholar] [CrossRef] [Green Version]
- Gkikas, A.; Houssos, E.E.; Lolis, C.J.; Bartzokas, A.; Mihalopoulos, N.; Hatzianastassiou, N. Atmospheric circulation evolution related to desert-dust episodes over the Mediterranean. Q. J. R. Meteorol. Soc. 2015, 141, 1634–1645. [Google Scholar] [CrossRef]
- Flaounas, E.; Kotroni, V.; Lagouvardos, K.; Kazadzis, S.; Gkikas, A.; Hatzianastassiou, N. Cyclone contribution to dust transport over the Mediterranean region. Atmos. Sci. Lett. 2015, 16, 473–478. [Google Scholar] [CrossRef] [Green Version]
- Ansmann, A.; Bösenberg, J.; Chiakovsky, A.; Comerón, A.; Eckhardt, S.; Eixmann, R.; Freudenthaler, V.; Ginoux, P.; Komguem, L.; Linné, H.; et al. Long-range transport of Saharan dust to northern Europe: The 11-16 October 2001 outbreak observed with EARLINET. J. Geophys. Res. D Atmos. 2003, 108, 1–15. [Google Scholar] [CrossRef]
- Meloni, D.; di Sarra, A.; Biavati, G.; DeLuisi, J.J.; Monteleone, F.; Pace, G.; Piacentino, S.; Sferlazzo, D.M. Seasonal behavior of Saharan dust events at the Mediterranean island of Lampedusa in the period 1999-2005. Atmos. Environ. 2007, 41, 3041–3056. [Google Scholar] [CrossRef]
- Papayannis, A.; Mamouri, R.-E.; Amiridis, V.; Kazadzis, S.; Pérez García-Pando, C.; Tsaknakis, G.; Kokkalis, P.; Baldasano, J. Systematic lidar observations of Saharan dust layers over Athens, Greece in the frame of EARLINET project (2004-2006). Ann. Geophys. 2009, 27, 3611–3620. [Google Scholar] [CrossRef]
- Soupiona, O.; Papayannis, A.; Kokkalis, P.; Mylonaki, M.; Tsaknakis, G.; Argyrouli, A.; Vratolis, S. Long-term systematic profiling of dust aerosol optical properties using the EOLE NTUA lidar system over Athens, Greece (2000–2016). Atmos. Environ. 2018, 183, 165–174. [Google Scholar] [CrossRef]
- Soupiona, O.; Samaras, S.; Ortiz-Amezcua, P.; Böckmann, C.; Papayannis, A.; Moreira, G.A.; Benavent-Oltra, J.A.; Guerrero-Rascado, J.L.; Bedoya-Velásquez, A.E.; Olmo, F.J.; et al. Retrieval of optical and microphysical properties of transported Saharan dust over Athens and Granada based on multi-wavelength Raman lidar measurements: Study of the mixing processes. Atmos. Environ. 2019, 214. [Google Scholar] [CrossRef]
- Calidonna, C.R.; Avolio, E.; Gullì, D.; Ammoscato, I.; De Pino, M.; Donateo, A.; Feudo, T. Lo Five years of dust episodes at the Southern Italy GAW regional coastal mediterranean observatory: Multisensors and modeling analysis. Atmosphere 2020, 11. [Google Scholar] [CrossRef]
- Veselovskii, I.; Hu, Q.; Goloub, P.; Podvin, T.; Korenskiy, M.; Derimian, Y.; Legrand, M.; Castellanos, P. Variability in lidar-derived particle properties over West Africa due to changes in absorption: Towards an understanding. Atmos. Chem. Phys. 2020, 20, 6563–6581. [Google Scholar] [CrossRef]
- Ansmann, A.; Seifert, P.; Tesche, M.; Wandinger, U. Profiling of fine and coarse particle mass: Case studies of Saharan dust and Eyjafjallajökull/Grimsvötn volcanic plumes. Atmos. Chem. Phys. 2012, 12, 9399–9415. [Google Scholar] [CrossRef] [Green Version]
- Mona, L.; Liu, Z.; Müller, D.; Omar, A.; Papayannis, A.; Pappalardo, G.; Sugimoto, N.; Vaughan, M. Lidar measurements for desert dust characterization: An overview. Adv. Meteorol. 2012, 2012. [Google Scholar] [CrossRef]
- Nisantzi, A.; Mamouri, R.E.; Ansmann, A.; Schuster, G.L.; Hadjimitsis, D.G. Middle East versus Saharan dust extinction-to-backscatter ratios. Atmos. Chem. Phys. 2015, 15, 7071–7084. [Google Scholar] [CrossRef] [Green Version]
- Gkikas, A.; Basart, S.; Hatzianastassiou, N.; Marinou, E.; Amiridis, V.; Kazadzis, S.; Pey, J.; Querol, X.; Jorba, O.; Gasso, S.; et al. Mediterranean Intense Desert Dust Outbreaks and Their Vertical Structure Based on Remote Sensing Data. Atmos. Chem. Phys. 2016. [Google Scholar] [CrossRef] [Green Version]
- Mamouri, R.E.; Ansmann, A.; Nisantzi, A.; Solomos, S.; Kallos, G.; Hadjimitsis, D.G. Extreme dust storm over the eastern Mediterranean in September 2015: Satellite, lidar, and surface observations in the Cyprus region. Atmos. Chem. Phys. 2016, 16, 13711–13724. [Google Scholar] [CrossRef] [Green Version]
- Solomos, S.; Ansmann, A.; Mamouri, R.E.; Binietoglou, I.; Patlakas, P.; Marinou, E.; Amiridis, V. Remote sensing and modelling analysis of the extreme dust storm hitting the Middle East and eastern Mediterranean in September 2015. Atmos. Chem. Phys. 2017, 17, 4063–4079. [Google Scholar] [CrossRef] [Green Version]
- Granados-Muñoz, M.J.; Sicard, M.; Papagiannopoulos, N.; Barragán, R.; Bravo-Aranda, J.A.; Nicolae, D. Two-dimensional mineral dust radiative effect calculations from CALIPSO observations over Europe. Atmos. Chem. Phys. 2019, 19, 13157–13173. [Google Scholar] [CrossRef] [Green Version]
- Papayannis, A.; Mamouri, R.E.; Amiridis, V.; Remoundaki, E.; Tsaknakis, G.; Kokkalis, P.; Veselovskii, I.; Kolgotin, A.; Nenes, A.; Fountoukis, C. Optical-microphysical properties of Saharan dust aerosols and composition relationship using a multi-wavelength Raman lidar, in situ sensors and modelling: A case study analysis. Atmos. Chem. Phys. 2012, 12, 4011–4032. [Google Scholar] [CrossRef] [Green Version]
- Bauwens, M.; Compernolle, S.; Stavrakou, T.; Müller, J.F.; van Gent, J.; Eskes, H.; Levelt, P.F.; van der A, R.; Veefkind, J.P.; Vlietinck, J.; et al. Impact of Coronavirus Outbreak on NO2 Pollution Assessed Using TROPOMI and OMI Observations. Geophys. Res. Lett. 2020, 47, 1–9. [Google Scholar] [CrossRef]
- Menut, L.; Bessagnet, B.; Siour, G.; Mailler, S.; Pennel, R.; Cholakian, A. Impact of lockdown measures to combat Covid-19 on air quality over western Europe. Sci. Total Environ. 2020, 741, 140426. [Google Scholar] [CrossRef]
- Collivignarelli, M.C.; Abbà, A.; Bertanza, G.; Pedrazzani, R.; Ricciardi, P.; Carnevale Miino, M. Lockdown for CoViD-2019 in Milan: What are the effects on air quality? Sci. Total Environ. 2020, 732, 139280. [Google Scholar] [CrossRef]
- Gautam, S. COVID-19: Air pollution remains low as people stay at home. Air Qual. Atmos. Health 2020, 13, 853–857. [Google Scholar] [CrossRef]
- Velavan, T.P.; Meyer, C.G. The COVID-19 epidemic. Trop. Med. Int. Health 2020, 25, 278–280. [Google Scholar] [CrossRef] [Green Version]
- Liu, S.; Yang, L.; Zhang, C.; Xiang, Y.T.; Liu, Z.; Hu, S.; Zhang, B. Online mental health services in China during the COVID-19 outbreak. Lancet Psychiatry 2020, 7, e17–e18. [Google Scholar] [CrossRef]
- Puca, E.; Čivljak, R.; Arapović, J.; Popescu, C.; Christova, I.; Raka, L.; Cana, F.; Miranović, V.; Karageorgopoulos, D.; Baš, D.; et al. Short epidemiological overview of the current situation on COVID-19 pandemic in Southeast European (SEE) countries. J. Infect. Dev. Ctries. 2020, 14, 433–437. [Google Scholar] [CrossRef]
- Grivas, G.; Athanasopoulou, E.; Kakouri, A.; Bailey, J.; Liakakou, E.; Stavroulas, I.; Kalkavouras, P.; Bougiatioti, A.; Kaskaoutis, D.G.; Ramonet, M.; et al. Integrating in situ measurements and city scale modelling to assess the covid–19 lockdown effects on emissions and air quality in athens, greece. Atmosphere 2020, 11, 1174. [Google Scholar] [CrossRef]
- Baldasano, J.M. COVID-19 lockdown effects on air quality by NO2 in the cities of Barcelona and Madrid (Spain). Sci. Total Environ. 2020, 741. [Google Scholar] [CrossRef]
- Vultaggio, M.; Varrica, D.; Alaimo, M.G. Impact on air quality of the covid-19 lockdown in the urban area of palermo (Italy). Int. J. Environ. Res. Public Health 2020, 17, 7375. [Google Scholar] [CrossRef] [PubMed]
- Donzelli, G.; Cioni, L.; Cancellieri, M.; Morales, A.L.; Suárez-Varela, M.M.M. The effect of the covid-19 lockdown on air quality in three italian medium-sized cities. Atmosphere 2020, 11, 1118. [Google Scholar] [CrossRef]
- Zerefos, C.S.; Solomos, S.; Kapsomenakis, J.; Poupkou, A.; Dimitriadou, L.; Polychroni, I.D.; Kalabokas, P.; Philandras, C.M.; Thanos, D. Lessons learned and questions raised during and post-COVID-19 anthropopause period in relation to the environment and climate. Environ. Dev. Sustain. 2020. [Google Scholar] [CrossRef] [PubMed]
- Lolli, S.; Chen, Y.C.; Wang, S.H.; Vivone, G. Impact of meteorological conditions and air pollution on COVID-19 pandemic transmission in Italy. Sci. Rep. 2020, 10, 1–15. [Google Scholar] [CrossRef]
- Selvam, S.; Muthukumar, P.; Venkatramanan, S.; Roy, P.D.; Manikanda Bharath, K.; Jesuraja, K. SARS-CoV-2 pandemic lockdown: Effects on air quality in the industrialized Gujarat state of India. Sci. Total Environ. 2020, 737, 140391. [Google Scholar] [CrossRef]
- Adams, M.D. Air pollution in Ontario, Canada during the COVID-19 State of Emergency. Sci. Total Environ. 2020, 742, 140516. [Google Scholar] [CrossRef]
- Krecl, P.; Targino, A.C.; Oukawa, G.Y.; Cassino Junior, R.P. Drop in urban air pollution from COVID-19 pandemic: Policy implications for the megacity of São Paulo. Environ. Pollut. 2020, 265, 114883. [Google Scholar] [CrossRef] [PubMed]
- Mostafa, M.K.; Gamal, G.; Wafiq, A. The impact of COVID 19 on air pollution levels and other environmental indicators—A case study of Egypt. J. Environ. Manag. 2021, 277, 111496. [Google Scholar] [CrossRef] [PubMed]
- Kanniah, K.D.; Kamarul Zaman, N.A.F.; Kaskaoutis, D.G.; Latif, M.T. COVID-19′s impact on the atmospheric environment in the Southeast Asia region. Sci. Total Environ. 2020, 736, 139658. [Google Scholar] [CrossRef]
- Papayannis, A.; Kokkalis, P.; Mylonaki, M.; Soupiona, R.; Papanikolaou, C.A.; Foskinis, R. Recent upgrades of the EOLE and AIAS lidar systems of the National Technical University of Athens operating since 2000 in Athens, Greece. EPJ Web Conf. 2020, 2030, 4–7. [Google Scholar] [CrossRef]
- Freudenthaler, V. About the effects of polarising optics on lidar signals and the Δ90 calibration. Atmos. Meas. Tech. 2016, 9, 4181–4255. [Google Scholar] [CrossRef] [Green Version]
- D’Amico, G.; Amodeo, A.; Baars, H.; Binietoglou, I.; Freudenthaler, V.; Mattis, I.; Wandinger, U.; Pappalardo, G. EARLINET Single Calculus Chain-overview on methodology and strategy. Atmos. Meas. Tech. 2015, 8, 4891–4916. [Google Scholar] [CrossRef] [Green Version]
- Mattis, I.; D’Amico, G.; Baars, H.; Amodeo, A.; Madonna, F.; Iarlori, M. EARLINET Single Calculus Chain—Technical—Part 2: Calculation of optical products. Atmos. Meas. Tech. 2016, 9, 3009–3029. [Google Scholar] [CrossRef] [Green Version]
- Ansmann, A.; Riebesell, M.; Wandinger, U.; Weitkamp, C.; Voss, E.; Lahmann, W.; Michaelis, W. Combined raman elastic-backscatter LIDAR for vertical profiling of moisture, aerosol extinction, backscatter, and LIDAR ratio. Appl. Phys. B Photophys. Laser Chem. 1992, 55, 18–28. [Google Scholar] [CrossRef]
- Mattis, I.; Ansmann, A.; Müller, D.; Wandinger, U.; Althausen, D. Dual-wavelength Raman lidar observations of the extinction-to-backscatter ratio of Saharan dust. Geophys. Res. Lett. 2002, 29, 20-1–20-4. [Google Scholar] [CrossRef]
- Kokkalis, P. Using paraxial approximation to describe the optical setup of a typical EARLINET lidar system. Atmos. Meas. Tech. 2017, 10, 3103–3115. [Google Scholar] [CrossRef] [Green Version]
- Amodeo, A.; D’Amico, G.; Giunta, A.; Papagiannopoulos, N.; Papayannis, A.; Argyrouli, A.; Mylonaki, M.; Tsaknakis, G.; Kokkalis, P.; Soupiona, O.; et al. ATHLI16: The ATHens Lidar Intercomparison campaign. EPJ Web Conf. 2018, 176, 9008. [Google Scholar] [CrossRef] [Green Version]
- Vratolis, S.; Fetfatzis, P.; Argyrouli, A.; Papayannis, A.; Müller, D.; Veselovskii, I.; Bougiatioti, A.; Nenes, A.; Remoundaki, E.; Diapouli, E.; et al. A new method to retrieve the real part of the equivalent refractive index of atmospheric aerosols. J. Aerosol Sci. 2018, 117, 54–62. [Google Scholar] [CrossRef] [Green Version]
- Querol, X.; Pérez, N.; Reche, C.; Ealo, M.; Ripoll, A.; Tur, J.; Pandolfi, M.; Pey, J.; Salvador, P.; Moreno, T.; et al. African dust and air quality over Spain: Is it only dust that matters? Sci. Total Environ. 2019, 686, 737–752. [Google Scholar] [CrossRef] [PubMed]
- Grell, G.A.; Peckham, S.E.; Schmitz, R.; McKeen, S.A.; Frost, G.; Skamarock, W.C.; Eder, B. Fully coupled “online” chemistry within the WRF model. Atmos. Environ. 2005, 39, 6957–6975. [Google Scholar] [CrossRef]
- Powers, J.G.; Klemp, J.B.; Skamarock, W.C.; Davis, C.A.; Dudhia, J.; Gill, D.O.; Coen, J.L.; Gochis, D.J.; Ahmadov, R.; Peckham, S.E.; et al. The weather research and forecasting model: Overview, system efforts, and future directions. Bull. Am. Meteorol. Soc. 2017, 98, 1717–1737. [Google Scholar] [CrossRef]
- Janić, Z.I. Nonsingular Implementation of the Mellor-Yamada Level 2.5 Scheme in the NCEP Meso Model. 2001. Available online: https://repository.library.noaa.gov/view/noaa/11409 (accessed on 22 December 2020).
- Chen, F.; Dudhia, J. Coupling an Advanced Land Surface-Hydrology Model with the Penn State-NCAR MM5 Modeling System. Part I: Model Implementation and Sensitivity. Mon. Weather Rev. 2001, 129, 569–585. [Google Scholar] [CrossRef] [Green Version]
- Jones, S.L.; Adams-Selin, R.; Hunt, E.D.; Creighton, G.A.; Cetola, J.D. Update on modifications to WRF-CHEM GOCART for fine-scale dust forecasting at AFWA. In AGU Fall Meeting Abstracts; American Geophysical Union: Washington, DC, USA, 2012. [Google Scholar]
- Bréon, F.M.; Vermeulen, A.; Descloitres, J. An evaluation of satellite aerosol products against sunphotometer measurements. Remote Sens. Environ. 2011, 115, 3102–3111. [Google Scholar] [CrossRef]
- Nabat, P.; Somot, S.; Mallet, M.; Chiapello, I.; Morcrette, J.J.; Solmon, F.; Szopa, S.; Dulac, F.; Collins, W.; Ghan, S.; et al. A 4-D climatology (1979-2009) of the monthly tropospheric aerosol optical depth distribution over the Mediterranean region from a comparative evaluation and blending of remote sensing and model products. Atmos. Meas. Tech. 2013, 6, 1287–1314. [Google Scholar] [CrossRef] [Green Version]
- Levy, R.C.; Remer, L.A.; Kleidman, R.G.; Mattoo, S.; Ichoku, C.; Kahn, R.; Eck, T.F. Global evaluation of the Collection 5 MODIS dark-target aerosol products over land. Atmos. Chem. Phys. 2010, 10, 10399–10420. [Google Scholar] [CrossRef] [Green Version]
- Tanré, D.; Kaufman, Y.J.; Herman, M.; Mattoo, S. Remote sensing of aerosol properties over oceans using the MODIS/EOS spectral radiances. J. Geophys. Res. Atmos. 1997, 102, 16971–16988. [Google Scholar] [CrossRef]
- Kaufman, Y.J.; Koren, I.; Remer, L.A.; Tanré, D.; Ginoux, P.; Fan, S. Dust transport and deposition observed from the Terra-Moderate Resolution Imaging Spectroradiometer (MODIS) spacecraft over the Atlantic Ocean. J. Geophys. Res. D Atmos. 2005, 110, 1–16. [Google Scholar] [CrossRef] [Green Version]
- Pérez, C.; Haustein, K.; Janjic, Z.; Jorba, O.; Huneeus, N.; Baldasano, J.M.; Black, T.; Basart, S.; Nickovic, S.; Miller, R.L.; et al. Atmospheric dust modeling from meso to global scales with the online NMMB/BSC-Dust model – Part 1: Model description, annual simulations and evaluation. Atmos. Chem. Phys. 2011, 11, 13001–13027. [Google Scholar] [CrossRef] [Green Version]
- Haustein, K.; Pérez, C.; Baldasano, J.M.; Jorba, O.; Basart, S.; Miller, R.L.; Janjic, Z.; Black, T.; Nickovic, S.; Todd, M.C.; et al. Atmospheric dust modeling from meso to global scales with the online NMMB/BSC-Dust model—Part 2: Experimental campaigns in Northern Africa. Atmos. Chem. Phys. 2012, 12, 2933–2958. [Google Scholar] [CrossRef] [Green Version]
- Stein, A.F.; Draxler, R.R.; Rolph, G.D.; Stunder, B.J.B.; Cohen, M.D.; Ngan, F. Noaa’s hysplit atmospheric transport and dispersion modeling system. Bull. Am. Meteorol. Soc. 2015, 96, 2059–2077. [Google Scholar] [CrossRef]
- Solomos, S.; Bougiatioti, A.; Soupiona, O.; Papayannis, A.; Mylonaki, M.; Papanikolaou, C.; Argyrouli, A.; Nenes, A. Effects of regional and local atmospheric dynamics on the aerosol and CCN load over Athens. Atmos. Environ. 2019, 197, 53–65. [Google Scholar] [CrossRef]
- Solomos, S.; Kalivitis, N.; Mihalopoulos, N.; Amiridis, V.; Kouvarakis, G.; Gkikas, A.; Binietoglou, I.; Tsekeri, A.; Kazadzis, S.; Kottas, M.; et al. From tropospheric folding to Khamsin and Foehn winds: How atmospheric dynamics advanced a record-breaking dust episode in Crete. Atmosphere 2018, 9, 240. [Google Scholar] [CrossRef] [Green Version]
- Kokkalis, P.; Alexiou, D.; Papayannis, A.; Rocadenbosch, F.; Soupiona, O.; Raptis, P.I.; Mylonaki, M.; Tzanis, C.G.; Christodoulakis, J. Application and Testing of the Extended-Kalman-Filtering Technique for Determining the Planetary Boundary-Layer Height over Athens, Greece. Boundary-Layer Meteorol. 2020, 176, 125–147. [Google Scholar] [CrossRef]
- Lucia, M.; Amodeo, A.; Pandolfi, M.; Pappalardo, G. Saharan dust intrusions in the Mediterranean area: Three years of Raman lidar measurements. J. Geophys. Res. 2006, 111. [Google Scholar] [CrossRef] [Green Version]
- Groß, S.; Freudenthaler, V.; Schepanski, K.; Toledano, C.; Schäfler, A.; Ansmann, A.; Weinzierl, B. Optical properties of long-range transported Saharan dust over Barbados as measured by dual-wavelength depolarization Raman lidar measurements. Atmos. Chem. Phys. 2015, 15, 11067–11080. [Google Scholar] [CrossRef] [Green Version]
- Veselovskii, I.; Goloub, P.; Podvin, T.; Bovchaliuk, V.; Derimian, Y.; Augustin, P.; Fourmentin, M.; Tanre, D.; Korenskiy, M.; Whiteman, D.N.; et al. Retrieval of optical and physical properties of African dust from multiwavelength Raman lidar measurements during the SHADOW campaign in Senegal. Atmos. Chem. Phys. 2016, 16, 7013–7028. [Google Scholar] [CrossRef] [Green Version]
- Müller, D.; Ansmann, A.; Mattis, I.; Tesche, M.; Wandinger, U.; Althausen, D.; Pisani, G. Aerosol-type-dependent lidar ratios observed with Raman lidar. J. Geophys. Res. Atmos. 2007, 112. [Google Scholar] [CrossRef]
- Freudenthaler, V.; Esselborn, M.; Wiegner, M.; Heese, B.; Tesche, M.; Ansmann, A.; Müller, D.; Althausen, D.; Wirth, M.; Fix, A.; et al. Depolarization ratio profiling at several wavelengths in pure Saharan dust during SAMUM 2006. Tellus Ser. B Chem. Phys. Meteorol. 2009, 61, 165–179. [Google Scholar] [CrossRef] [Green Version]
- Groß, S.; Esselborn, M.; Weinzierl, B.; Wirth, M.; Fix, A.; Petzold, A. Aerosol classification by airborne high spectral resolution lidar observations. Atmos. Chem. Phys. 2013, 13, 2487–2505. [Google Scholar] [CrossRef] [Green Version]
- Ansmann, A.; Petzold, A.; Kandler, K.; Tegen, I.; Wendisch, M.; Müller, D.; Weinzierl, B.; Müller, T.; Heintzenberg, J. Saharan Mineral Dust Experiments SAMUM-1 and SAMUM-2: What have we learned? Tellus Ser. B Chem. Phys. Meteorol. 2011, 63, 403–429. [Google Scholar] [CrossRef] [Green Version]
- Tesche, M.; Ansmann, A.; Müller, D.; Althausen, D.; Engelmann, R.; Freudenthaler, V.; Groß, S. Vertically resolved separation of dust and smoke over Cape Verde using multiwavelength Raman and polarization lidars during Saharan Mineral Dust Experiment 2008. J. Geophys. Res. Atmos. 2009, 114, 1–14. [Google Scholar] [CrossRef]
- Groß, S.; Tesche, M.; Freudenthaler, V.; Toledano, C.; Wiegner, M.; Ansmann, A.; Althausen, D.; Seefeldner, M. Characterization of Saharan dust, marine aerosols and mixtures of biomass-burning aerosols and dust by means of multi-wavelength depolarization and Raman lidar measurements during SAMUM 2. Tellus Ser. B Chem. Phys. Meteorol. 2011, 63, 706–724. [Google Scholar] [CrossRef]
- Groß, S.; Gasteiger, J.; Freudenthaler, V.; Müller, T.; Sauer, D.; Toledano, C.; Ansmann, A. Saharan dust contribution to the Caribbean summertime boundary layer—A lidar study during SALTRACE. Atmos. Chem. Phys. 2016, 16, 11535–11546. [Google Scholar] [CrossRef] [Green Version]
- Emde, C.; Buras-Schnell, R.; Kylling, A.; Mayer, B.; Gasteiger, J.; Hamann, U.; Kylling, J.; Richter, B.; Pause, C.; Dowling, T.; et al. The libRadtran software package for radiative transfer calculations (version 2.0.1). Geosci. Model Dev. 2016, 9, 1647–1672. [Google Scholar] [CrossRef] [Green Version]
- Koepke, P.; Gasteiger, J.; Hess, M. Technical Note: Optical properties of desert aerosol with non-spherical mineral particles: Data incorporated to OPAC. Atmos. Chem. Phys. 2015, 15, 5947–5956. [Google Scholar] [CrossRef] [Green Version]
- Sicard, M.; Bertolín, S.; Mallet, M.; Dubuisson, P.; Comerón, A. Estimation of mineral dust long-wave radiative forcing: Sensitivity study to particle properties and application to real cases in the region of Barcelona. Atmos. Chem. Phys. 2014, 14, 9213–9231. [Google Scholar] [CrossRef] [Green Version]
- Anderson, G.; Clough, S.; Kneizys, F. AFGL Atmospheric Constituent Profiles; Tech. Rep. AFGL-TR-86-0110; Air Force Geophys. Lab.: Hanscom, MA, USA, 1986; p. 46. [Google Scholar]
- Raptis, I.-P.; Eleftheratos, K.; Kazadzis, S.; Kosmopoulos, P. The Combined Effect of Ozone and Aerosols on Erythemal Irradiance in an Extremely Low Ozone Event during May 2020. Atmosphere 2021, 12, 145. [Google Scholar] [CrossRef]


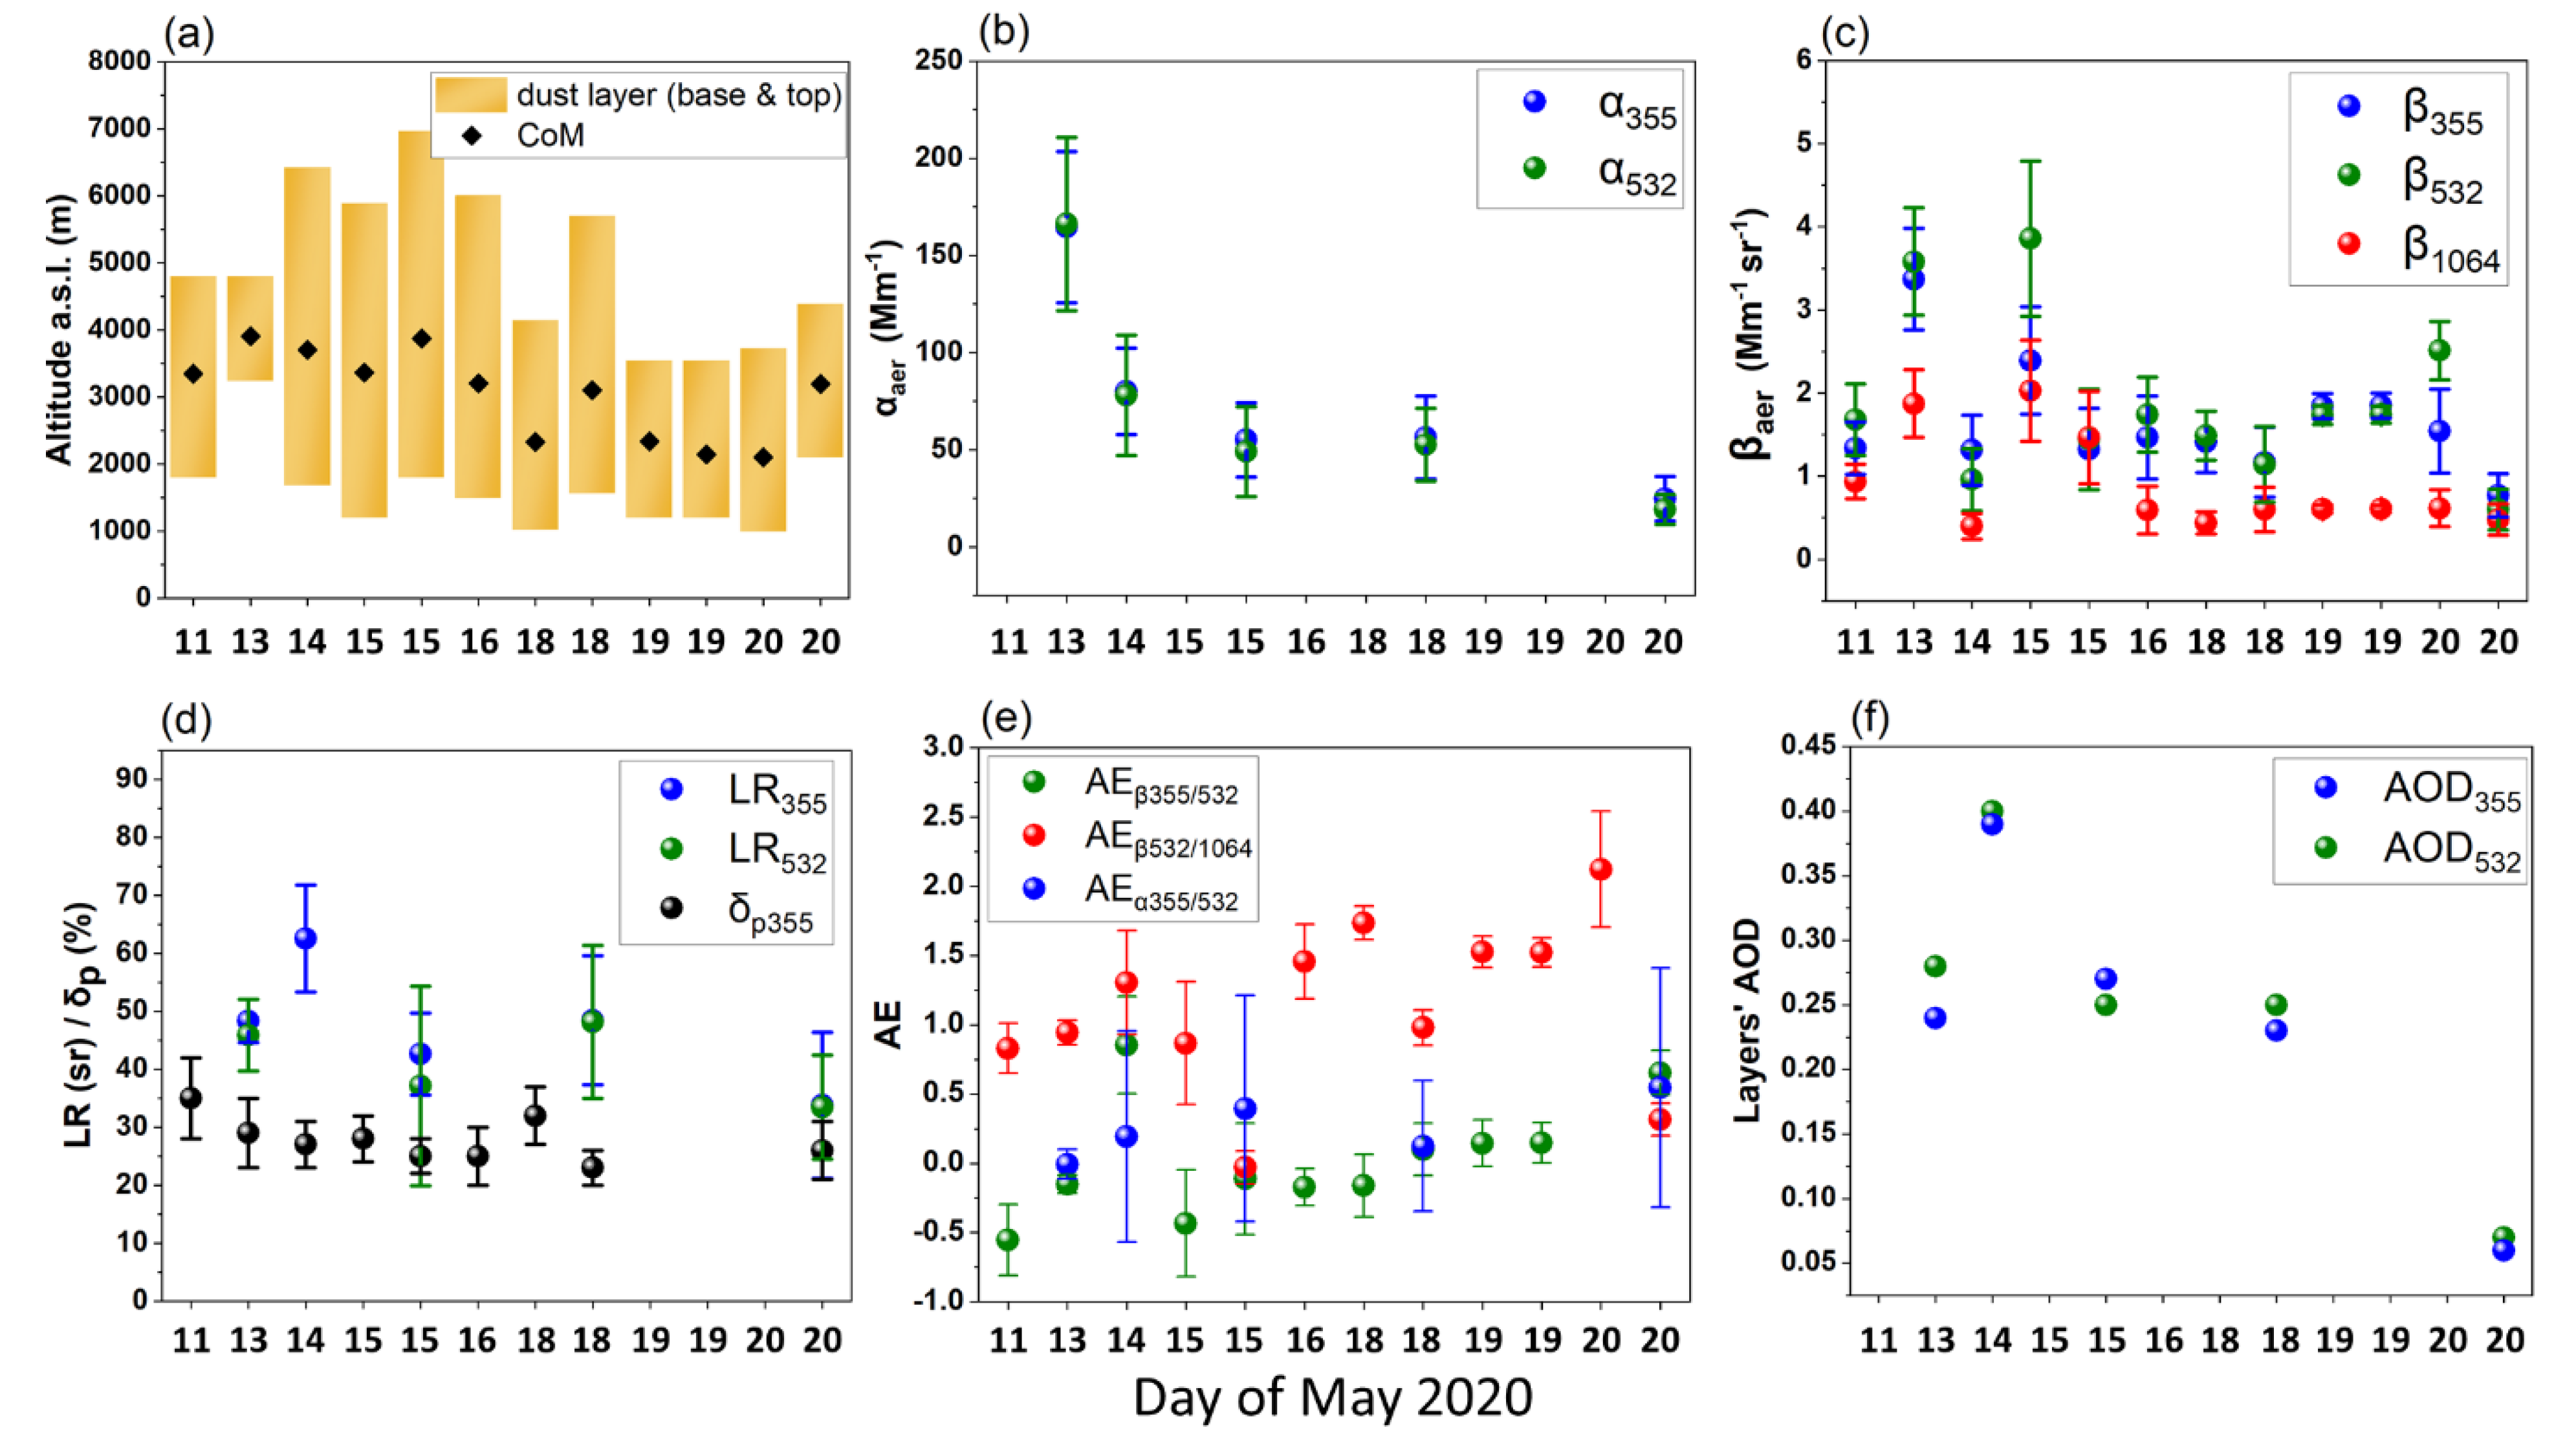
| Parameter | 1st Phase (11 May–15 May Noon) | 2nd Phase (15 May Night–20 May) |
|---|---|---|
| Βase (m) | 1982 ± 879 | 1424 ± 390 |
| Τop (m) | 5476 ± 811 | 4749 ± 1300 |
| CoM (m) | 3579 ± 273 | 2786 ± 645 |
| α355 (Mm−1) | 122 ± 60 | 45 ± 18 |
| α532 (Mm−1) | 122 ± 62 | 40 ± 18 |
| β355(Mm−1 sr−1) | 2.1 ± 1.0 | 1.4 ± 0.4 |
| β532 (Mm−1 sr−1) | 2.5 ± 1.4 | 1.5 ± 0.5 |
| β1064 (Mm−1 sr−1) | 1.3 ± 0.8 | 0.7 ± 0.3 |
| δp355 (%) | 30 ± 4 | 26 ± 3 |
| LR355 (sr) | 55 ± 10 | 42 ± 7 |
| LR532 (sr) | 46 ± 6 | 40 ± 8 |
| AEβ355/532 | −0.07 ± 0.64 | −0.09 ± 0.57 |
| AEβ532/1064 | 0.99 ± 0.22 | 1.20 ± 0.73 |
| AEα355/532 | 0.09 ± 0.14 | 0.36 ± 0.21 |
| AOD532 | 0.34 ± 0.08 | 0.19 ± 0.10 |
| AOD355 | 0.32 ± 0.11 | 0.19 ± 0.11 |
| 18 May 2020, 10:00 UTC | ||
|---|---|---|
| Radiative Effect (RE) | Hypothetical Scenario | Realistic Scenario |
| SW BOA (W/m2) | −155.2 | −159.3 |
| LW BOA (W/m2) | 16.9 | 17.2 |
| Net BOA (W/m2) | −138.3 | −142.1 |
| SW TOA (W m2) | −20.5 | −20.9 |
| LW TOA (W/m2) | 12.3 | 12.8 |
| Net TOA (W/m2) | −8.2 | −8.1 |
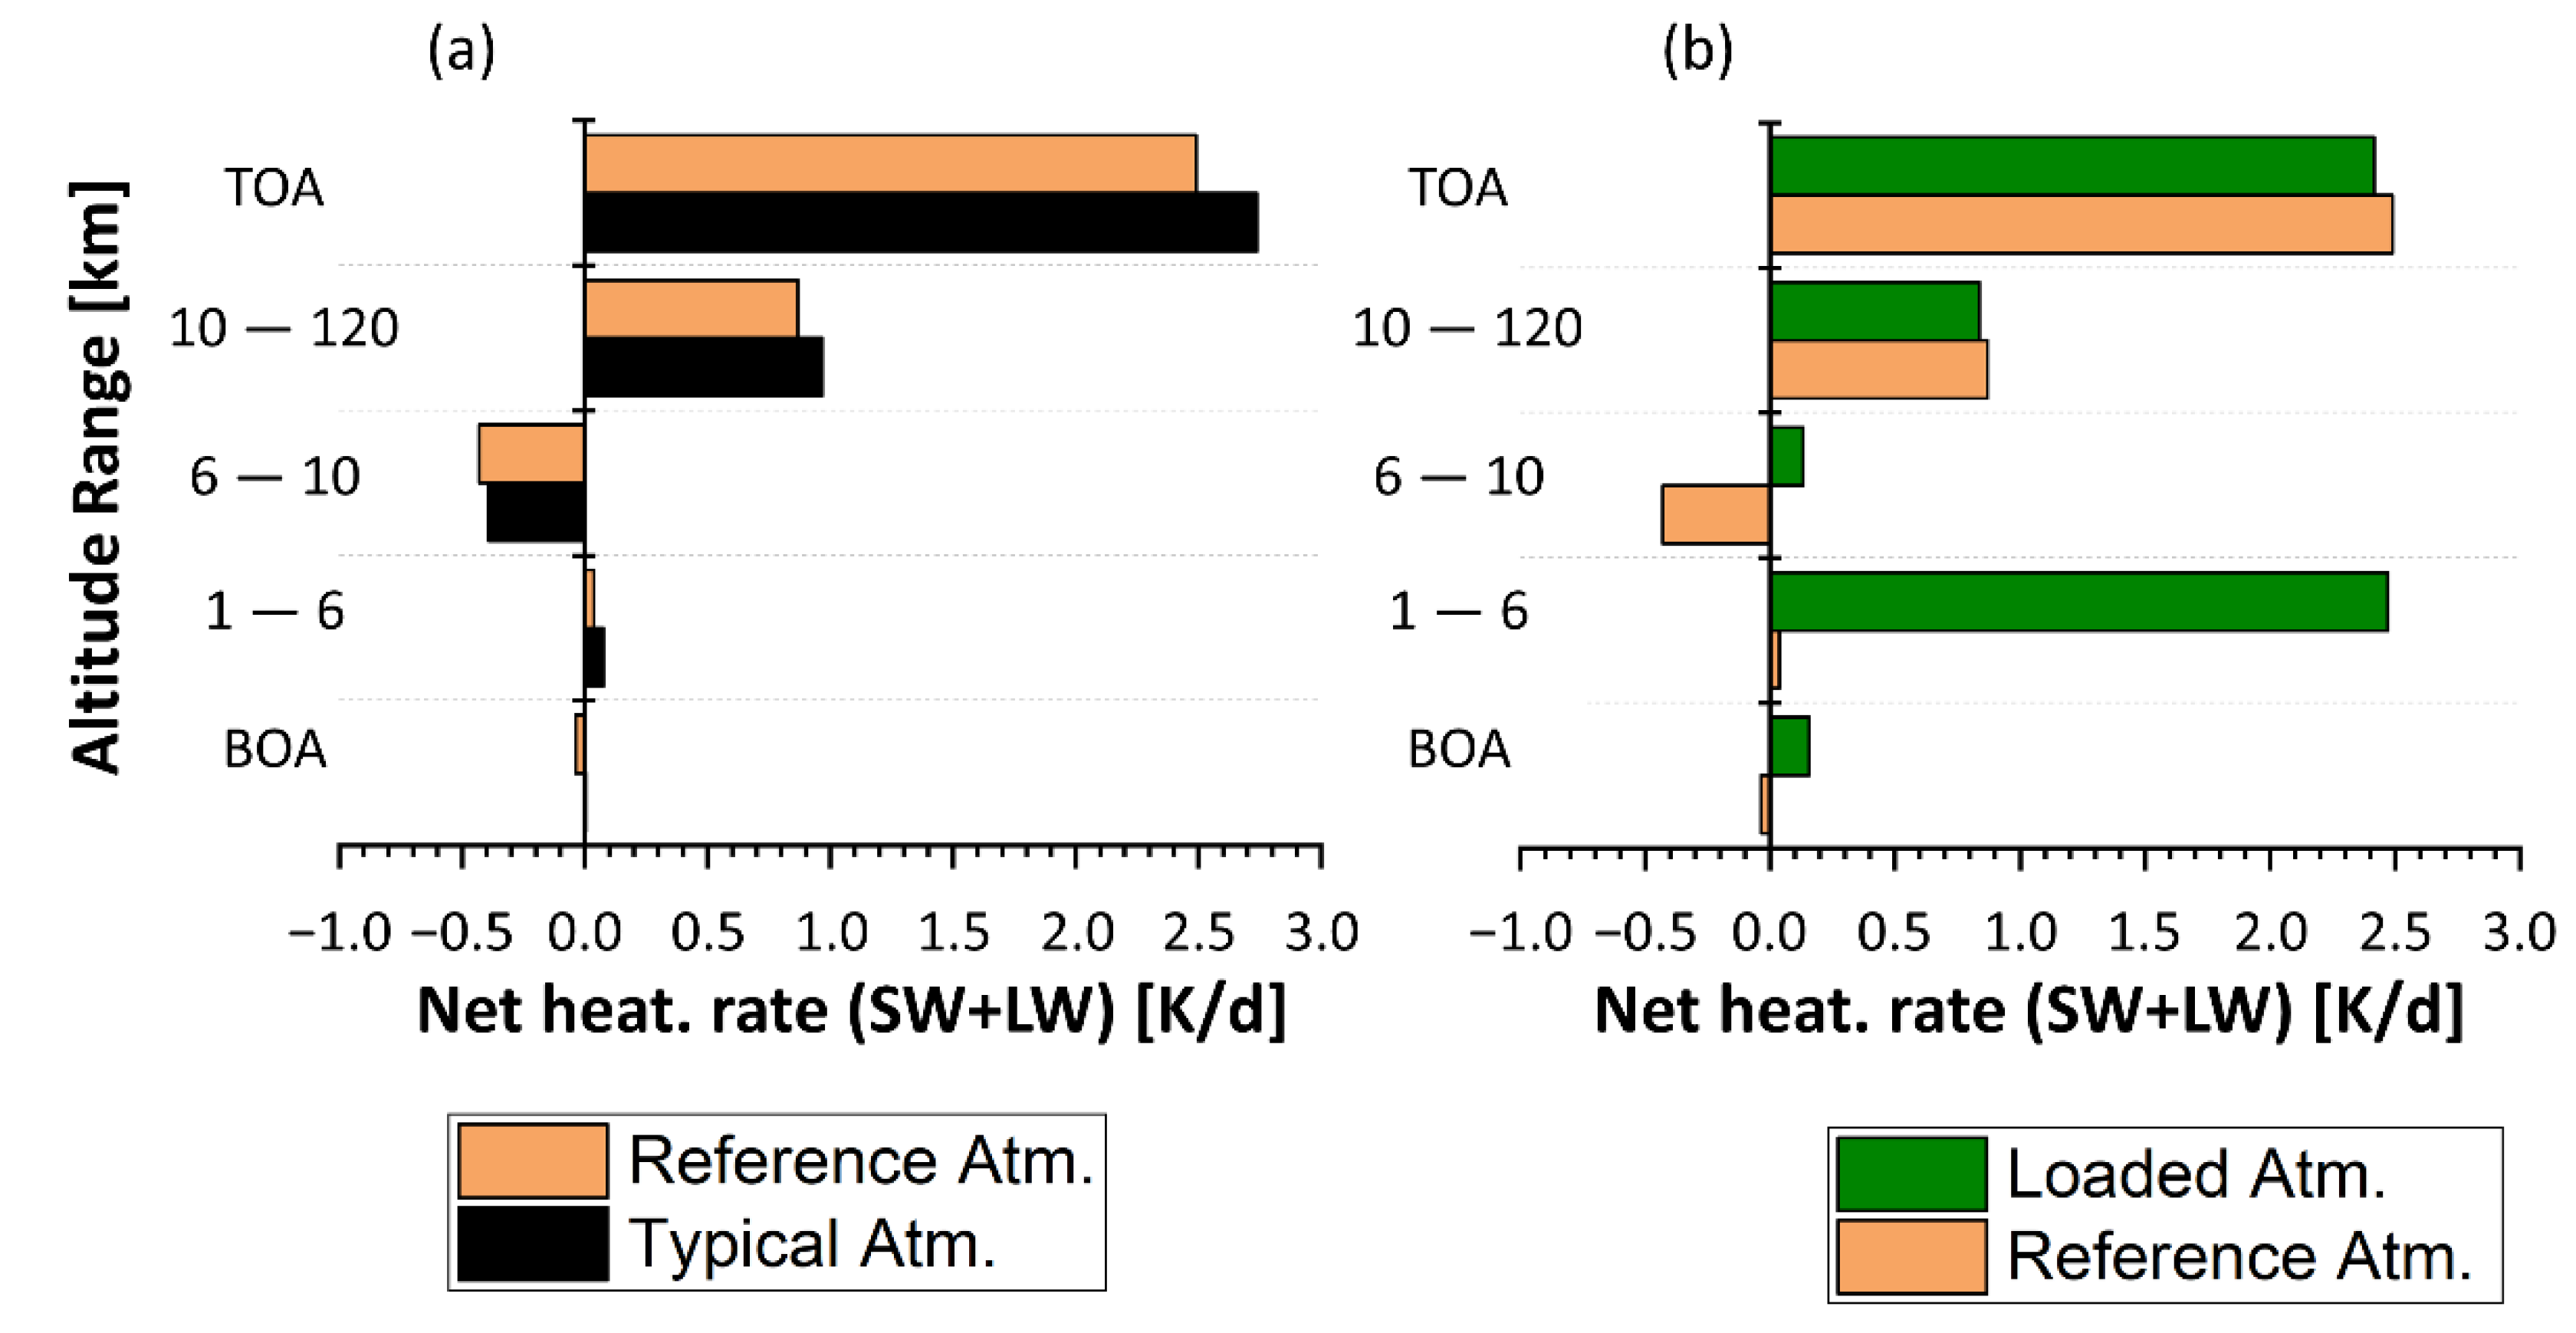
| Atm. Heat. rate (K/d) [1–6 km] | 2.6 | 2.5 |
Publisher’s Note: MDPI stays neutral with regard to jurisdictional claims in published maps and institutional affiliations. |
© 2021 by the authors. Licensee MDPI, Basel, Switzerland. This article is an open access article distributed under the terms and conditions of the Creative Commons Attribution (CC BY) license (http://creativecommons.org/licenses/by/4.0/).
Share and Cite
Kokkalis, P.; Soupiona, O.; Papanikolaou, C.-A.; Foskinis, R.; Mylonaki, M.; Solomos, S.; Vratolis, S.; Vasilatou, V.; Kralli, E.; Anagnou, D.; et al. Radiative Effect and Mixing Processes of a Long-Lasting Dust Event over Athens, Greece, during the COVID-19 Period. Atmosphere 2021, 12, 318. https://doi.org/10.3390/atmos12030318
Kokkalis P, Soupiona O, Papanikolaou C-A, Foskinis R, Mylonaki M, Solomos S, Vratolis S, Vasilatou V, Kralli E, Anagnou D, et al. Radiative Effect and Mixing Processes of a Long-Lasting Dust Event over Athens, Greece, during the COVID-19 Period. Atmosphere. 2021; 12(3):318. https://doi.org/10.3390/atmos12030318
Chicago/Turabian StyleKokkalis, Panagiotis, Ourania Soupiona, Christina-Anna Papanikolaou, Romanos Foskinis, Maria Mylonaki, Stavros Solomos, Stergios Vratolis, Vasiliki Vasilatou, Eleni Kralli, Dimitra Anagnou, and et al. 2021. "Radiative Effect and Mixing Processes of a Long-Lasting Dust Event over Athens, Greece, during the COVID-19 Period" Atmosphere 12, no. 3: 318. https://doi.org/10.3390/atmos12030318