
A Study on the Perception Change of Passengers on Sustainable Air Transport Following COVID-19 Progress


Department of Aviation, Korea Transport Institute, Sejong-si 30147, Korea
*
Author to whom correspondence should be addressed.
Sustainability 2021, 13(14), 8056; https://doi.org/10.3390/su13148056
Submission received: 21 May 2021
/
Revised: 12 July 2021
/
Accepted: 15 July 2021
/
Published: 19 July 2021
(This article belongs to the Special Issue Aviation Management and Air Transport Industry II)
Abstract
:We investigate whether air transport passengers changed their perceptions on the resumption of air transport use as the circumstances of the COVID-19 pandemic have changed. We surveyed 1200 Koreans, and then six months later re-surveyed 840 people among those who participated in the first survey. We built a structural equation model that was configured of five latent variables: COVID-19-related, self-isolation, destination condition, level of preventive measures in the airport/aircraft, and social perception. We performed paired sample t-test, multi-group analysis, and latent mean analysis for two divided groups, based on the survey period. We found that the perception structure on resuming air transportation use over time during the COVID-19 pandemic has not changed, though a significant change has occurred in the responses to the measured and latent variables. In particular, a high variation was found in the awareness of COVID-19-related factors and social perceptions, and we suggest continuous monitoring of the related factors to preemptively respond to the recovery of air transport demand. On the other hand, we propose proactive level setting and the maintaining of sanitary conditions of the destination and preventive measures in the airport/aircraft. We expect that this study will provide effective implications for the recovery of air transport demand during the COVID-19 pandemic.
1. Introduction
We investigated whether air transport passengers have changed their perceptions on the resumption of air transport use in light of the progression of the COVID-19 pandemic. We looked for any changes in the structural equation model for the recovery of air transport use suggested by Song and Choi [1], after six months of changes in the pattern of COVID-19. During the time at which Song and Choi [1] conducted the survey, there was a total of 10,801 confirmed cases and around eight confirmed cases daily in Korea (as of 3 May 2020). At the time of the survey for this study, there was a total of 76,429 confirmed cases with around 554 confirmed cases per day (as of 26 January 2021). In order to investigate whether this led to a change in perception in the resumption of air transport use, we conducted a follow-up survey on the same samples used by Song and Choi [1].
On 13 May 2020, the IATA expected that the recovery of air transport demand to 2019 levels was likely to take place in 2024 [2]. In November 2020, several scenarios were presented, and the recovery period was also expected to occur in 2024. Forecasting the total passenger volume, airlines predicted a recovery of 72% in 2021 due to the commencement of vaccinations, but the ICAO expected the number to be around 57–63% [3]. Even though there were positive signs of demand recovery due to vaccinations, etc., uncertainties over demand recovery have intensified.
It is important to check if there are changes in people’s perceptions when forecasting demand recovery following a change. This is because changes in people’s perception are an important factor for the prospect of demand recovery. For example, demand recovery will show a more dynamic pattern if users’ perceptions of recovery change are in line with changes in COVID-19. On the other hand, the fluctuation in the demand recovery prospect will be small if users do not change their perceptions of recovery, in light of the changes in the circumstances surrounding COVID-19.
From this perspective, we believe that we systemically studied for the first time people’s perceptions changing as COVID-19 transitioned. Based on the results proposed by Song and Choi [1], we conducted a follow-up investigation on the same hypothesis, questionnaire, and surveyed sample as before. Then, we analyzed the dynamics of people’s perception changes that helped us determine the implications in aviation demand revival.
We assumed that people’s perception structures have not changed, but the degree has changed significantly as COVID-19 progressed. This paper is organized in the following manner. Section 2 updates the study on the air transport usage pattern related to COVID-19 by Song and Choi [1] and reviews the existing methodologies for identifying changes, with a follow-up survey to examine changes in people’s perception of air transport use according to the developments of COVID-19. Section 3 describes the building of a cognitive model using structural equations and suggests a methodology to compare the results with those of the study by Song and Choi [1]. Section 4 presents the surveyed data and the verification results, and Section 5 presents a discussion and the conclusions.
2. Literature Review
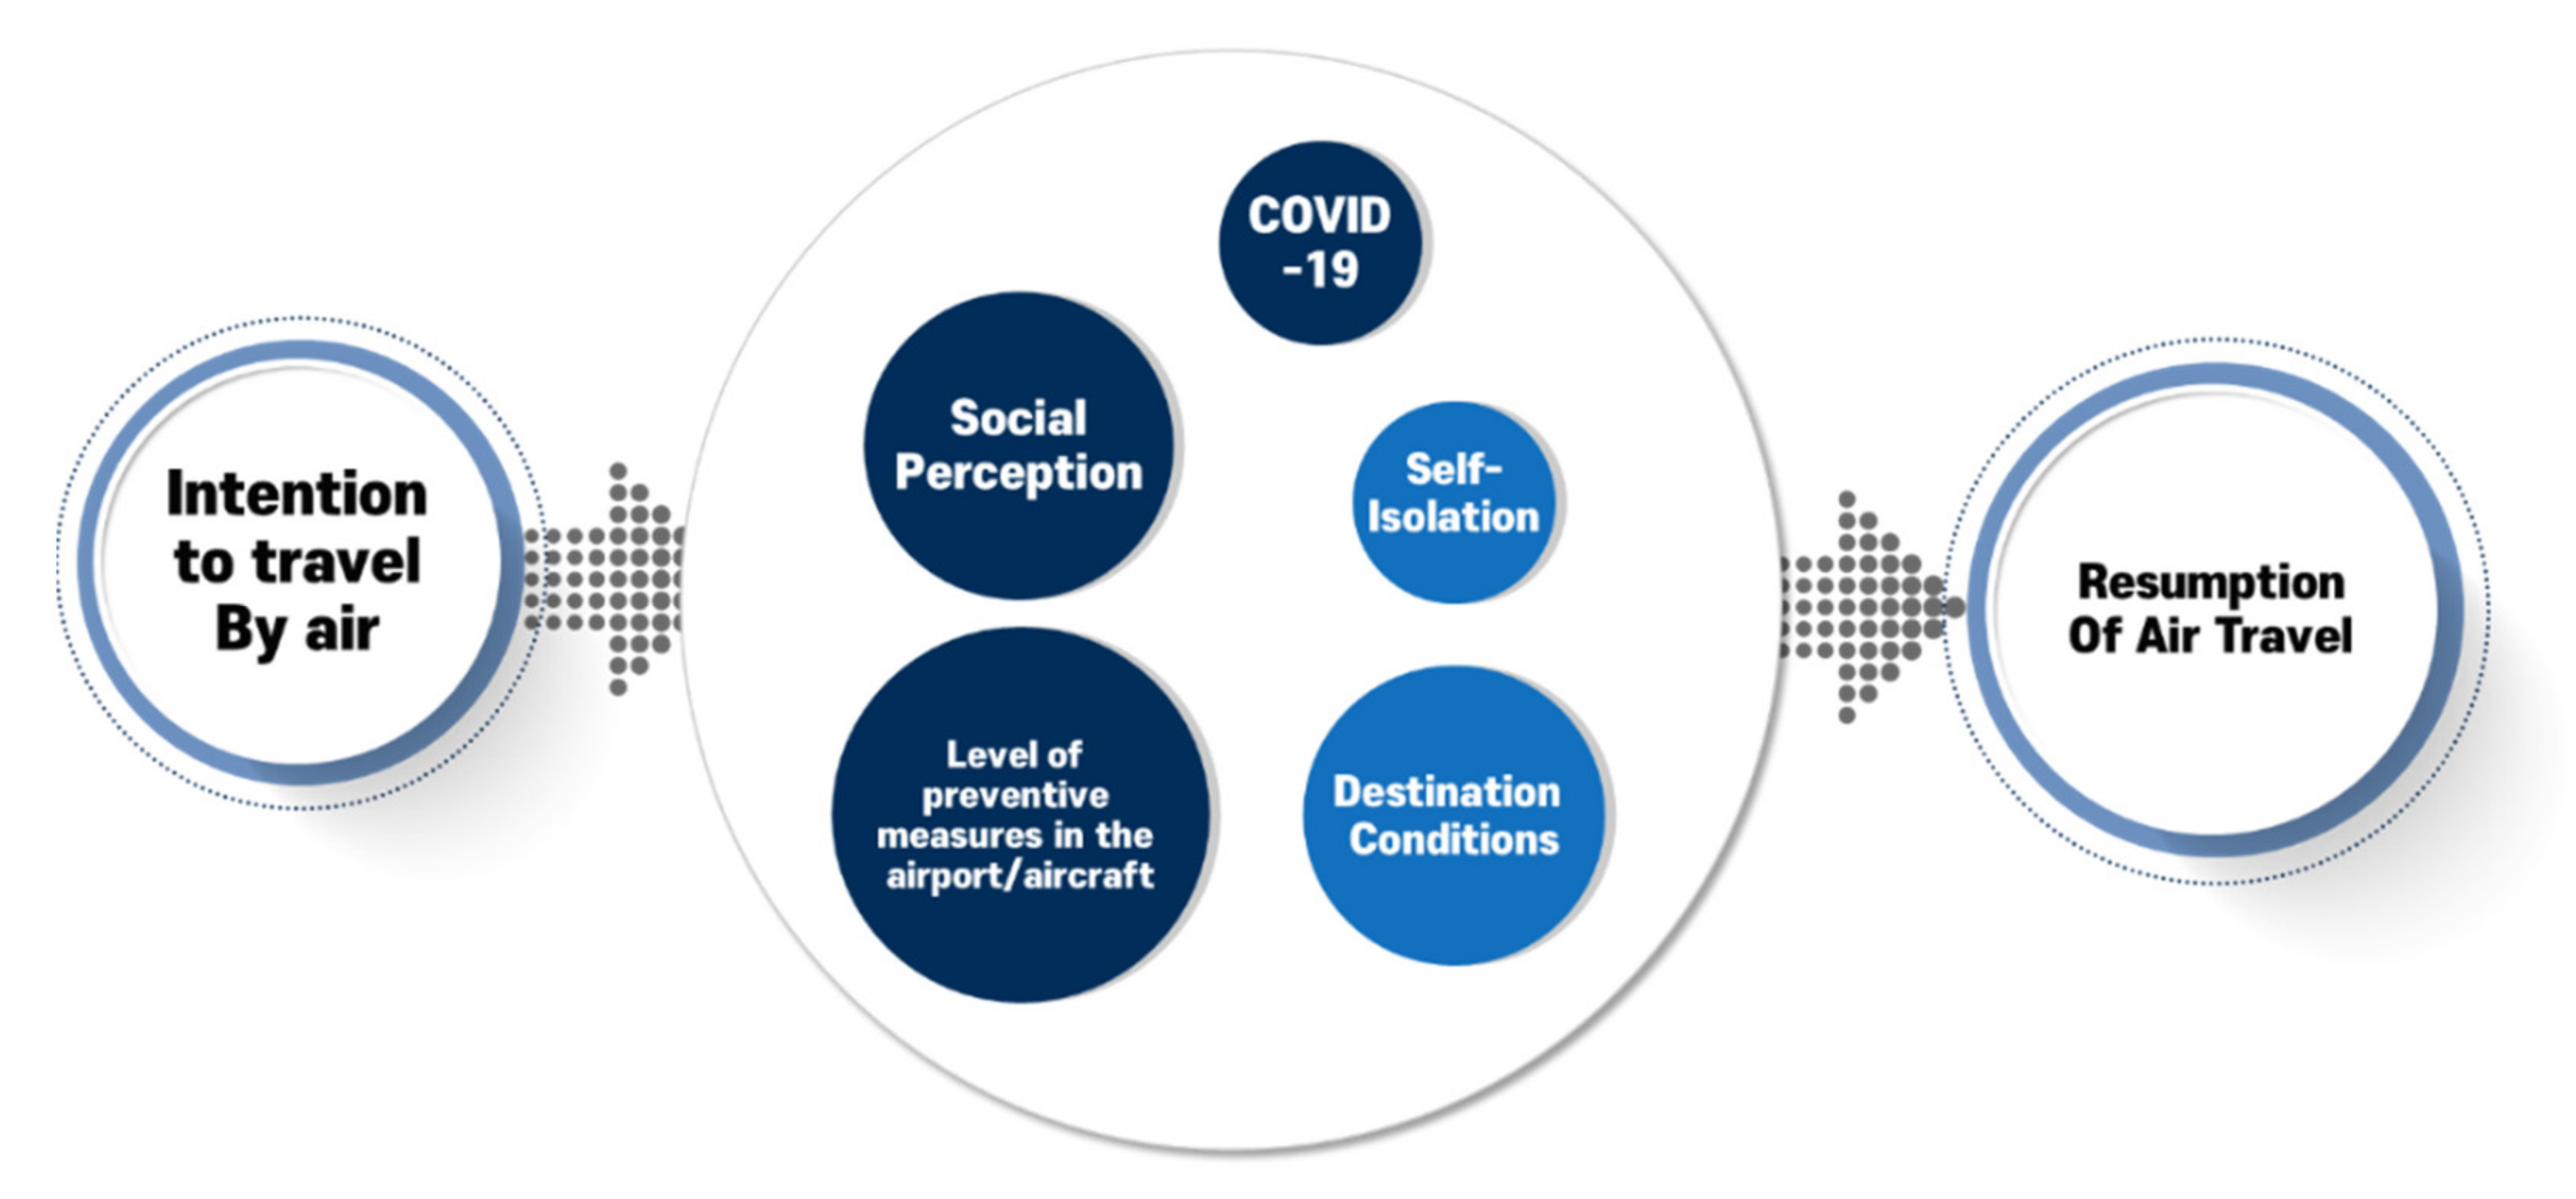
Song and Choi [1] explained people’s perceptions of the resuming of air transport use after COVID-19 using a structural equation model with five factors: COVID-19 related, self-isolation, destination condition, level of preventive measures in the airport/aircraft, and social perception (Figure 1). They found these factors based on previous studies [1] and discussions with an advisory panel of 30 aviation experts. They analyzed the relationships between the factors using the structural equation model. They showed the perception structure of air transport users related to the resumption of air transport use as it related to COVID-19. Since then, Dube et al. [4] also proposed the need to develop an airport operation model to overcome the seriousness and uncertainty of the impact of COVID-19 and determined that considering the recovery factor of the aviation industry is important.
Additional studies related to air transport users’ perceptions concerning COVID-19 have been published since Song and Choi [1]. Sotomayor-Castillo et al. [5] conducted an online questionnaire survey of whether factors related to infection prevention and disease control influenced the attitudes of airline passengers. Antwi et al. [6] studied the effects and necessity of removing the operational inefficiencies of self-service technology (SST) in post-COVID-19 airport operations, in connection with the characteristics of improving passenger experience. These studies can be related to COVID-19 and the level of preventive measures in airports/aircraft according to the five factors suggested by Song and Choi [1], but we could not find any studies that were related to the other four factors.
Customer-perception-related studies have frequently used structural equation models. Zeithaml et al. [7] suggested an early structural equation model for the analysis of customer behavior responses to service quality. Based on the results, Cronin et al. [8] evaluated the direct impact and structural relation of service factors, such as quality, satisfaction, and preferences, on people’s perception and behavior. Baker et al. [9] extended the scope of customer perception and behavior. In terms of customer behavior, they confirmed the hypothesis that perceived performance quality is more impactful than satisfaction. On the other hand, Dawn [10] determined that satisfaction measurement variable were more affected in terms of medical service. In the case of self-service technology service quality, Lin and Hsieh [11] proposed a structural model, related key factors, and measurement variables, such as function, enjoyment, security, design, convenience, and so on. Finally, Kim and Park [12] applied previous service variables in the case of airports. From the previous stimulus organization response model [13], they studied perceived value and satisfaction in terms of customer behavior, and concluded that most important factors were functionality, enjoyment, customization, and convenience.
The uncertainty of COVID-19 has not decreased as the number of daily confirmed cases around the world has risen once again from the decline starting in April 2021, approx. three month since the start of vaccinations. Accordingly, various studies have attempted to forecast aviation demand. Gudmundsson et al. [14] used the ARIMAX (auto regressive integrated moving average) methodology to forecast air transport passenger demand for each region worldwide. It predicted that it would take approx. 2.4 years for the worldwide average to recover to pre-COVID-19 levels and 2.2 years in the Asia-Pacific region. Zhang et al. [15] used a methodology that amalgamated the quantitative auto regressive distributed lag model (ARDL) and the error correction model (ECM) methodologies and the qualitative Delphi scenario adjustment methodology to analyze three recovery scenarios for the effect of COVID-19 on tourism demands, and predicted recovery within about two years. Moreover, there are ongoing studies on changes in aviation demands, indicating the importance of continuous studies according to the change in the patterns of COVID-19.
We conducted a follow-up survey of the same sample as a previous study [1] to analyze the change in air transport users’ perceptions of the resumption of air transport use. Follow-up surveys have been used in clinical pathology and social science fields to identify behavioral and phenomenal changes over time. The methodology for this can be divided into additional experiments and additional surveys. Additional experimental methodologies mostly involve clinical measurements according to time differences. Dubowitz et al. [16] identified a correlation between infant malnutrition and family and school behavior through a follow-up survey, and Rubio et al. [17] analyzed the relationship between alcohol dependence syndrome and impulsivity through a comparative analysis.
Alternatively, follow-up questionnaire surveys have been conducted based on comparative analyses of follow-up questionnaire surveys and their preceding surveys. Chen et al. [18] conducted a questionnaire survey on childhood injury prevention counseling in 1994, and Bae et al. [19] conducted a two-stage questionnaire survey as the methodology to evaluate the prevalence of adolescent health-threatening behaviors and the reliability of the questionnaire.
It is necessary to review whether there are changes in the air transport users’ perception model developed during this period of unprecedented uncertainty with COVID-19 that are in line with further developments of COVID-19. This requires analyzing the robustness of the developed model and the causes of the differences at each time point. A methodology for this can apply multi-group equation modeling in relation to the structural equation used in a previous study [1]. This methodology has been performed to test the invariance of causal structures due to constraints on the same model structure across multiple groups [20]. For example, Ren and Kwan [21] investigated complex interactions between the Internet and physical activities, focusing on gender differences, Internet maintenance, and leisure activities using a multi-group structural equation. Lau et al. [22] used a multi-group structural equation approach to investigate the relationship between maternal characteristics, health-related quality of life, and breastfeeding attitudes among normal and overweight pregnant women.
Therefore, we determined that it was appropriate to apply a multi-group structural equation model as the follow-up survey methodology for this study.
3. Methodology
We applied the same five factors, COVID-19, social perception, self-isolation, level of preventive measures in airports/aircraft, and destination conditions, suggested by Song and Choi [1]. We built a structural equation model using the same methodology for the five factors, based on the same subjects, as the previous study, and the same questionnaire was conducted in this study; multi-group analysis was performed. The questionnaire questions for each factor consisted of a total of 45 questions, and the initial model suitability was investigated through the suitability criteria. We applied the same methodology as that proposed by Song and Choi [1] to build the structural equation model. The significance of the p-value of the regression weight in the initial model, including all of the questionnaire items, was determined. A measured variable was removed if the standardized regression weight was less than 0.5 or if the squared multiple correlations value was less than 0.4. A measured variable and its measurement error were removed if the variance was negative. The final model suitability criteria included TLI (the Tucker–Lewis index) being 0.9 or higher, CFI (comparative fit index) being 0.9 or higher, and RMSEA (root mean square of error approximation) to be between 0.05 and 0.08. (RMSEA and the chi square statistic were applied as the fix index to compensate for the fact that it could be determined statistically and reasonably when the sample size was 400 or more) [23,24,25].
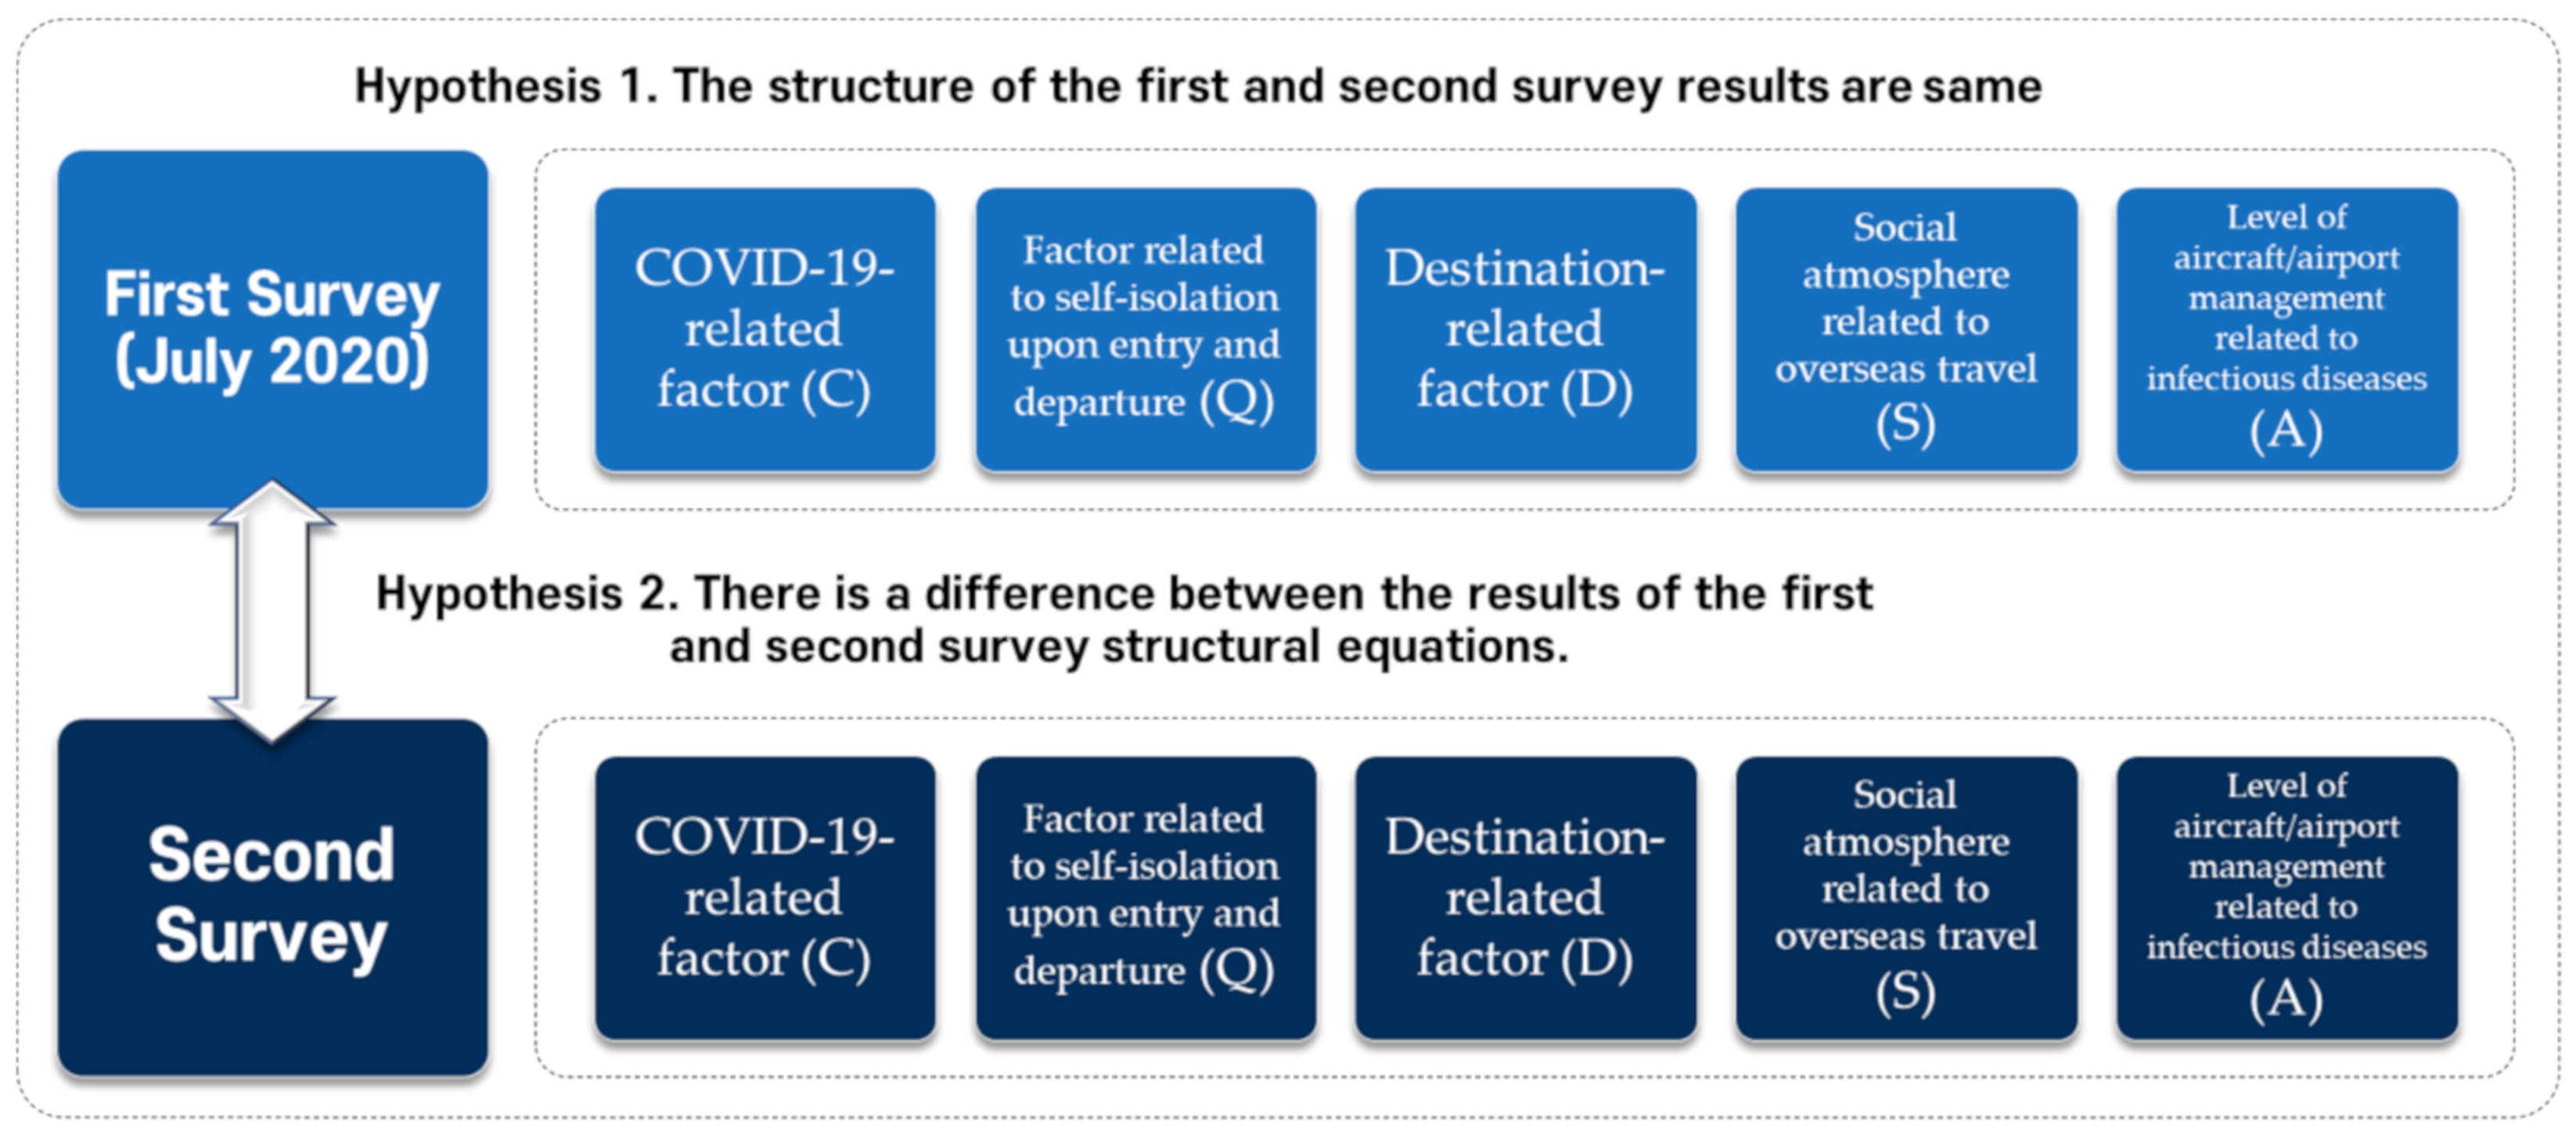
We verified whether there was a change in perception of the resumption of air transport use with the changing circumstances of COVID-19 over time. Therefore, to compare the survey results between the first and second period, we used two hypotheses. The first hypothesis was: “The structure of the first and second survey results are same”. The second hypothesis was: “There is a difference between the results of the first and second survey structural equations”.
To verify above hypotheses, we studied methods of comparison analysis and verification between multiple parties. Pair-wise sample t-test was used to investigate the differences in the individual questionnaires, and multi-group analysis was used to check if mutual comparisons between the survey groups are possible. The latent average analysis verified the final difference from the perspective of the structural equation model for the resumption of air transport use. The first survey was conducted in July 2020 [1]; the second survey conducted for this study, which used the same questionnaire, were assumed as individual groups (same as the first survey).
Hypothesis 1 (H1):
The structure of the first and second survey results are same.
Hypothesis 2 (H2):
There is a difference between the results of the first and second survey structural equations (Figure 2).
Subsequent multiple group analysis was used to verify whether the parameter values of one group and those of another group were the same in the measurement model or structural equation model [26]. Sörbom [27] presented a multi-sample structural equation model. According to Steenkamp and Baumgartner [28], Equation (1) is a latent or structural equation model that specifies a structural relationship. Vector includes the endogenous latent variables of , while vector consists of the exogenous latent variables of . is a coefficient matrix showing the mutual effects of endogenous structures, while is a coefficient matrix showing the influence of exogenous latent variables on the endogenous structure. is a vector of constant equation intercepts, while represents disturbances or errors of the equation. Equations (2) and (3) are the measurement model for and . is the vector of observed indicators of , while is the vector () of measured variable of . and refer to matrices and of the slope coefficient or factor loading related to the observed indicator and latent variable. Moreover, and represent the measurement error vectors, while and refer to the constant item intercepts [28] and that equations can specify the general multi-sample structural equation model with latent variables [28].
Since the t-test and multivariate analysis are affected by measurement errors, they often require accurate comparisons [29,30]. On the other hand, regardless of the measurement errors, the latent mean analysis is more sensitive than conventional analysis methods and is more likely to detect differences between groups [31]. Therefore, this study performed latent mean analysis to check if there were differences between the groups and the measurement models.
Since latent mean analysis requires the latent variable to be on the same scale in all groups, it should satisfy a series of progressive limiting assumptions and structural model invariances (morphological identity of the measurement model, measurement identity, and intercept identity) [28,31]. Moreover, since the results of the latent mean analysis can meet the general measurement criteria (Table 1) only through Cohen’s d (effect size) [29,30], we performed an analysis that conforms to all of them based on the studies above.
Cohen’s d value refers to the value obtained by dividing the difference between the mean values of two groups by the variance of the entire group. Equation (4) represents the detailed formula for the d value, and Equation (5) represents the detailed formula for s, which is the pooled standard deviation.
4. Analysis Results
4.1. Data and Statistics
The second questionnaire survey was conducted on 1200 people and a follow-up survey was conducted with 840 people who participated in the first survey. As with the characteristics of the first survey sample, the survey criteria were those who experienced an overseas departure within the last one year, or those who were 18 years of age or older who planned to leave the country within the next year, as of the time of the first survey (July 2020). It was conducted as an online questionnaire survey. The proportions of gender (male/female) and age groups (20–29, 30–39, 40–49, 50–59, and aged 60 or over) were reflected in the sampling. A 5-point Likert scale was used to reflect the characteristics of each factor.
The survey results showed that Q-1 (I will travel abroad if there are no entry/exit restrictions even if I will be subject to self-isolation), Q-2 (I will travel abroad if the self-isolation period decreases to less than 2 weeks), and Q-5 (I will travel abroad if I can regardless of the period of self-isolation) were questions that the respondents considered the least in average as a factor for the recovery of travel. Q-4 (I will travel abroad if there is no self-isolation period) was the most important measured variable to consider in the factor of the isolation period at entry/exit (Q). The most impact variable to consider in the COVID-19 factor (C) was C-2 (I will travel abroad if a treatment drug is developed), and the answer to consider the least was C-4 (I will travel abroad if the daily new confirmed cases number fewer than 100).
The most effective variable to consider in the overseas destination condition factor (D) was D-1 (I will travel abroad if the tourist destination has good hygiene conditions), and the variable to consider the least was D-10 (I will travel abroad if I can regardless of the conditions of the destination). The most important variable to consider in the social perception factor (S) was S-4 (I will travel abroad if there is no concern about COVID-19 infections), and the variable to consider the least was S-7 (I will travel abroad if I can regardless of how others perceive). The most concerning variable to consider in the level of preventive measures in airports/aircraft factor (A) was A-11 (I will travel abroad if I do not have to wear a mask inside the aircraft) and the variable to consider the least was A-10 (I will travel abroad regardless of the aircraft/airport situation).
4.2. SEM Result
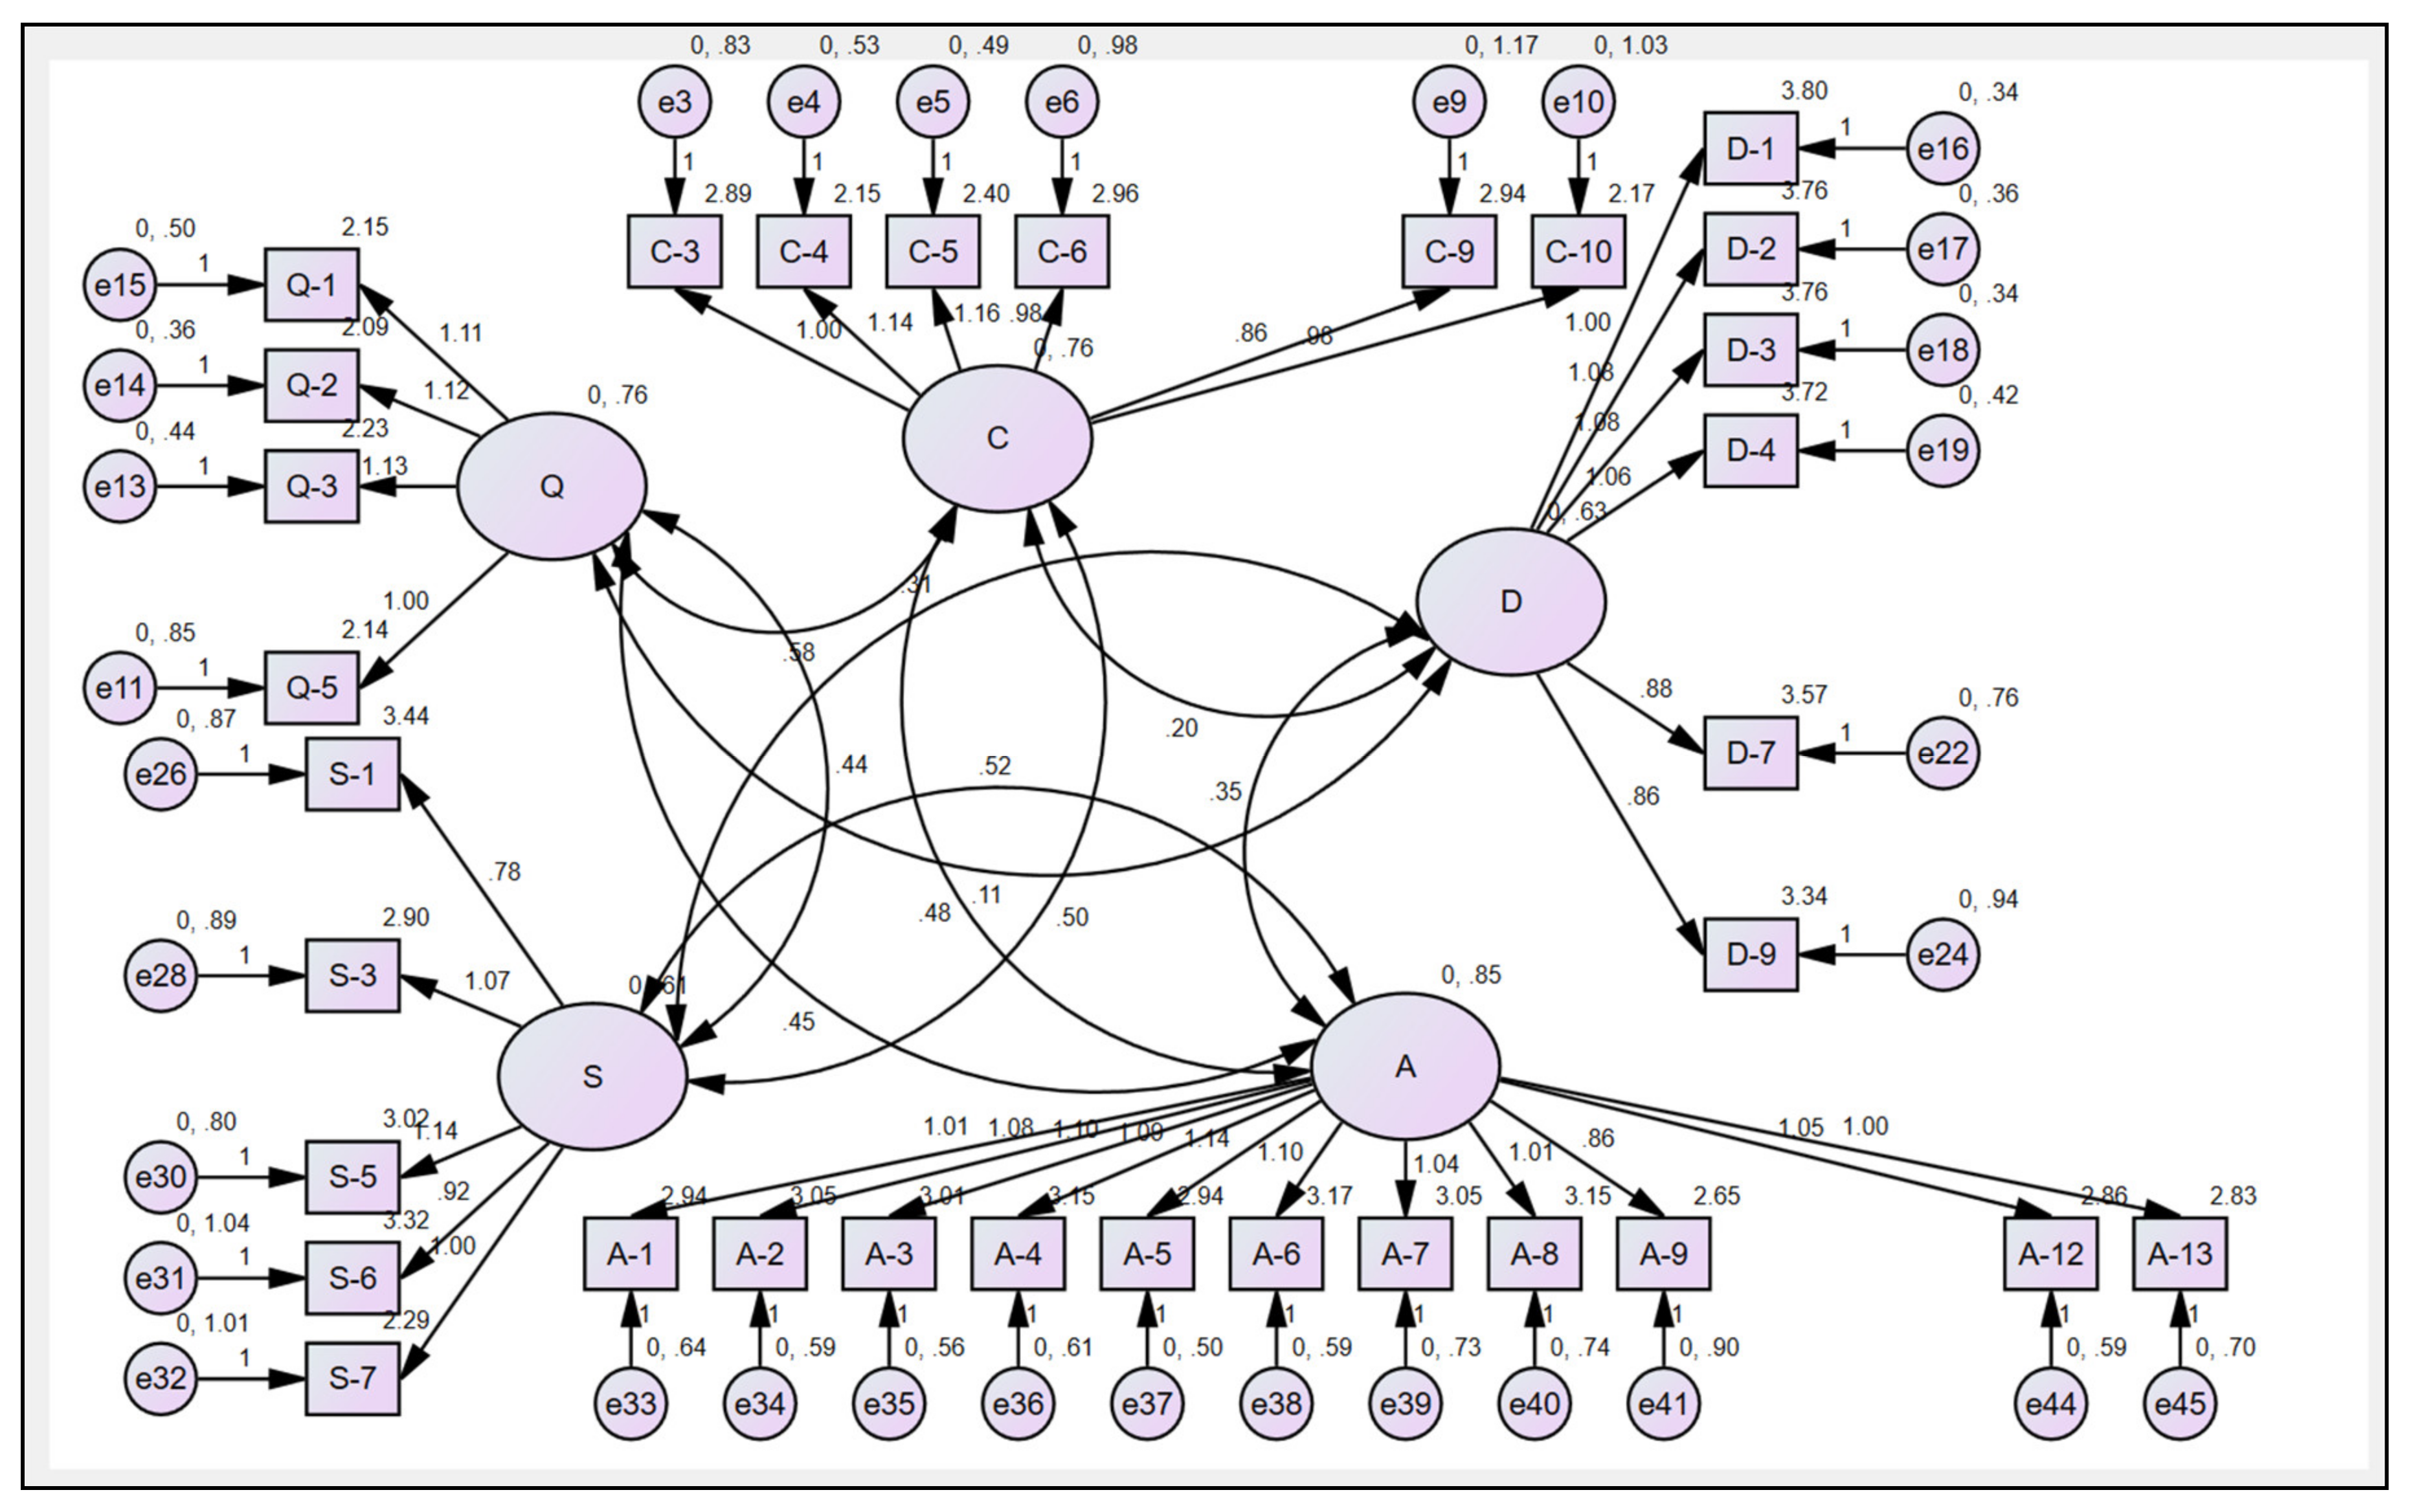
We constructed a structural equation model by combining the samples of the first survey (n = 1200) and the samples of the second survey (n = 840). In this process, C-1, C-2, C-8, Q-4, D-5, D-6, D-8, D-10, S-1, and S-4, for which the standardized factor loading was less than 0.5, and C-7, A-10, and A-11, for which the squared multiple correlations (SMC) were less than 0.4, were removed. The fitness of the final model (Figure 3) showed X2: 3942.604 (p < 0.001), TLI: 0.901, CFI: 0.909, and RMSEA: 0.061, with which the general fitness criteria [34] of the overall conformity indices, CFI < 0.9, TLI < 0.9, and RMSEA > 0.08, were satisfied (Table 2). The confirmatory factor analysis showed that the paths from the latent variables to the measured variables were all significant in the COVID-19 prevalence factor (C); the factor of the self-isolation period upon entry and departure (Q); the factor of conditions at overseas travel destinations (D); the factor of social atmosphere related to overseas travel (S); and the factor of the level of aircraft/airport management (A) (Table 3). Moreover, the review of the correlation coefficient and standard error between factors confirmed the validity of the discrimination.
Based on the standardized coefficient value for each measured latent variable, the C-5 question and the Q-2 question were relatively important in the COVID-19 prevalence factor (C) and the factor of the self-isolation period upon entry and departure (Q), respectively. The D-3 question and the S-7 question were relatively important in the factor of conditions at the overseas travel destinations (D) and the factor of social atmosphere related to overseas travel, respectively. The standardized coefficient value of the A-5 question was relatively high for the factor of the level of aircraft/airport management (A). The total standardization coefficient values were 0.546–0.851, and they were all significant since they were over 0.35.
Table 4 shows the path analysis results. The values of the standardization coefficient (β) for the paths of C→Q, C→D, C→S, Q→S, and S→A were 0.35 or more, and the p-value of C.R. was less than 0.01, indicating statistically significant results. The path in which the standardization factor (β) value was the most significant was path C→Q, which links the COVID-19 prevalence factor (C) and the factor of the self-isolation period upon entry and departure (Q). As in the first survey, these results mean that the faster the recovery period for COVID-19, and when there are more countries where self-isolation measures are lifted, the more significant the influence is on the possibility of the resumption of air transport. However, even if the self-isolation period upon entry and departure (Q) is reduced, it negatively affects the judgment on the resumption of air transport if the conditions at overseas travel destinations (D) are negative. This is because the standardization coefficient of the path from the factor of the self-isolation period upon entry and departure (Q) to the factor of conditions at overseas travel destinations (D) was negative. Furthermore, it can be inferred that, even if more countries relieve self-isolation measures, it is likely to negatively affect the resumption of air transport if the destination conditions are not sound. All paths except these were positive, indicating a mutual synergy effect on the resumption of air transport use.
4.3. Multi-Group Analysis Result
Results of the second survey conducted in this study and the response sample t-test results for the first survey conducted in July 2020 [1] (Table S9) showed that the p-value of each question, except for 17 out of 45 questions (D-2, D-6, D-7, S-1, S-2, S-7, A-1, A-2, A-3, A-4, A-5, A-6, A-7, A-8, A-9, A-10, and A-12) and the p-value of each questionnaire was determined to be less than 0.05. These results reject the hypothesis that there is no difference in the average of each response, except for some sub-items, although it is difficult to consider that the average of the factor of the level of aircraft/airport management (A) differs between the first and second surveys. This indicates that it is possible that the perception of those participating in the surveys changed over time, and it suggested that it was necessary to check if there were significant differences in the perception mode perspective.
Table 5 shows the results of the multi-group analysis. The results of the configural invariance test to evaluate whether the measurement model between groups was the same were TLI = 0.897, CFI = 0.906, and RMSEA = 0.044. Although TLI was close to 0.9, it was shown that the overall goodness-of-fit index was high, indicating that invariance was confirmed [20]. As configural invariance was satisfied, we conducted metric invariance verification as the next step. Metric invariance verification determines whether a latent variable is interpreted in the same way in each group. We applied invariance constraints so that the factor coefficient of each of the survey results was the same in the developed model and then compared the X2 value and the degrees of freedom between the metric invariance model and the configural invariance model (base model). When the difference in the degrees of freedom between the configural invariance model (base model) and the metric invariance model was 27, the difference of χ2 was 33.131 and the p-value of the chi-square distribution test was 0.193 (p > 0.05). The results indicated that the measurement tools were operating in the same way in the first and second survey groups [25]. The results of the fitness index were TLI = 0.9, CFI = 0.905, and RMSEA = 0.044, meeting the metric invariance criteria [28,35,36]. Then, we tested scalar invariance, which added the invariance constraints to intercept the scalar invariance and the strict invariance, which added the invariance constraints to the variance of each group’s latent variables. The goodness-of-fit indices of the scalar invariance (TLI = 0.899, CFI = 0.902, and RMSEA = 0.044) and the strict invariance (TLI = 0.9, CFI = 0.905, and RMSEA = 0.044) were appropriate and similarly derived for each model. Therefore, the scalar invariance and strict invariance were established. Additionally, based on these results, the first hypothesis could be satisfied [25].
Since the configural invariance, metric invariance, scalar invariance, and strict invariance hypotheses were all established, this study performed latent mean analysis to check if there was a mean difference between the factors (C, Q, D, S, and A) based on the first and second surveys. Table 6 shows the results of this latent mean analysis.
Cohen [25] suggested an effect-size d value of 0.2 as a small level, 0.5 as an intermediate level, and 0.8 as a large level. The COVID-19-related factor (p < 0.001), the factor related to self-isolation upon entry and departure (p < 0.001), the destination-related factor (p < 0.001), the social atmosphere related to overseas travel (p < 0.01), and the level of aircraft/airport management related to infectious diseases (p < 0.05) all showed statistically significant differences in the second survey. The comparison of the effect sizes (d) showed the COVID-19-related factor d value to be the largest at 440, followed by the factor of the social atmosphere related to overseas travel at 319, and the factor related to self-isolation upon entry and departure at 234, indicating the effect size to be more than 0.2. However, the effect size for the destination-related factor was 0.123 and that for the level of aircraft/airport management related to infectious disease was 0.086, indicating the effect size to be less than 0.2. For the latency mean difference, there was a change in perception of the resumption of air transport use according to the change in the circumstances of COVID-19, but the changes in the destination-related factor and the level of aircraft/airport management related to infectious diseases were not clear. Therefore, these results showed that the second hypothesis could only be partially satisfied.
5. Conclusions
Although we find no clear change in the perception structure on resuming air transport use over time amid the circumstances surrounding COVID-19, a significant change in the measured and latent variables of the perception has been occurred. We presented the perception structure for the resumption of air transport use amid the circumstances surrounding COVID-19 by deriving a suitable final structural equation model for the entire sample. We confirmed that the entire sample model could be applied equally in the multi-group analysis of the first and second surveys. We also showed changes in the measured variable and the latent variable through a pairwise comparison of the corresponding samples and the latent mean between first and second surveys.
The developed structural equation model showed that there is a mutual synergy effect on the significant resumption of air transport use in the relationship between all factors, except for self-isolation and destination factors. The investigation showed that even if the self-isolation conditions were eased, the perception of resuming air transport use was negative if the destination conditions were not positive from the perspective of resuming air transport use. On the other hand, other factors were reviewed to play mutually complementary roles. These results serve as the basis for the opinion that all five factors should be considered in combination to recover the air transport demand.
The latent mean analysis showed that there were changes in the level of influence of each latent variable on the resumption of air transport use, despite the period difference being less than one year. The difference was the largest in the factor related to COVID-19, showing results that were consistent with the expectation that changes in the circumstances of COVID-19 would be the most influential. Moreover, the social atmosphere for overseas travel showed a large change. It is inferred that this was due to the perception of volatile social changes in the circumstances surrounding COVID-19. For example, unlike in the early days of the COVID-19 pandemic in Korea, the recovery of demand for the Jeju route and the reduced intensity of criticism surrounding the route can be an indirect aviation demand research basis. On the other hand, the destination factor and the perception of the level of preventive measures in airports/aircraft did not respond to changes in the circumstances surrounding COVID-19 as sensitively as other factors. These results can be interpreted that the same level is expected in the circumstances surrounding COVID-19 and lead to the conclusion that it is necessary to maintain the level of preventive measures to resume the use of air transport.
Although potential demand for air transport exists, the perception structure for the decision to use air transport is highly uncertain. Uncertainty on recovery of air transport demand has increased since the factors related to COVID-19 have a very high variance depending on the circumstances surrounding COVID-19, and even people’s perceptions may change. For this reason, it seems that various prospects for demand recovery under the circumstances of COVID-19 are drawn. Moreover, social perception, which showed high variance according to the circumstances of COVID-19, is based on the consensus formed within the group. Such consensus is highly uncertain since it is made up of collective psychological factors. In conclusion, it is necessary to closely monitor potential factors related to COVID-19 and social perception to ensure a rapid recovery of air transport demand and a preemptive response.
Moreover, though potential factors related to destination sanitation and the level of preventive measures in airports/aircraft are significant factors in the resumption of air transport use, changes in perception level according to the circumstances of COVID-19 ware found to be smaller than other factors. Since it is interpreted that the same level was expected from the beginning of the coronavirus outbreak, these potential factors should focus on maintaining the necessary level rather than monitoring. We suggest that an approach that can be consistent in the long term is required.
This study has the following limitations. This study only investigated the structural relations between perception factors and aviation demand recovery, so it needs to consider external variables, such as economic recovery for demand forecasting. Moreover, the current situation has not fully recovered from COVID-19, and the second survey was conducted before game-changing vaccinations began at a full scale. Therefore, additional follow-up surveys on changes in COVID-19 are necessary to solidify the arguments asserted in this study. We expect continued follow-up surveys to secure sufficient panel data and verify the expanded model.
We supported the perception structure model for the resumption of air transport use suggested in Song and Choi [1] and validated the availability of the perception model suggested by Song and Choi [1] through presenting no changes in the perception structure, but significant changes in the perception level with changes in the circumstances surrounding COVID-19. We expect that this study will provide fruitful implications for the recovery of air transport demand amid the COVID-19 pandemic.
Supplementary Materials
The following are available online at https://www.mdpi.com/article/10.3390/su13148056/s1, Table S1. Survey Questions in Study, Table S2. Survey results for COVID-19-related factors (C), Table S3. Survey results for destination factors (Q), Table S4. Survey results for destination factors (D), Table S5. Survey results for social atmosphere related to overseas travel (S), Table S6. Survey results for level of aircraft/airport management related to infectious diseases (A), Table S7. Survey results for respondent properties, Table S8. Verified the validity of determination using correlation coefficients and standard errors, Table S9. Correspondence sample test (t-test) results between individual questions of two surveys, Table S10. Results of multi-group analysis between questionnaire surveys (final model).
Author Contributions
Conceptualization, K.-H.S.; methodology, K.-H.S. and S.C.; software, K.-H.S. and S.C.; investigation, S.C.; resources, S.C.; formal analysis, K.-H.S. and S.C.; data curation, S.C.; writing—original draft preparation, S.C. and K.-H.S.; writing—review and editing, K.-H.S. and S.C.; supervision, K.-H.S.; project administration K.-H.S. All authors have read and agreed to the published version of the manuscript.
Funding
This study was funded by Korea Transport Institute for its task to “Research project for enhancement of airport competitiveness and regional development in Korea by the year 2020,” grant number 31-20-014 And The APC was funded by Korea Transport Institute.
Institutional Review Board Statement
Not applicable.
Informed Consent Statement
Not applicable.
Data Availability Statement
The data presented in this study are available on request from the corresponding author.
Conflicts of Interest
The authors declare no conflict of interest.
References
- Song, K.-H.; Choi, S. A Study on the Behavioral Change of Passengers on Sustainable Air Transport After COVID-19. Sustainability 2020, 12, 9207. [Google Scholar] [CrossRef]
- International Air Transport Association. Outlook for Air Transport and the Airline Industry. Available online: https://www.iata.org/en/iata-repository/pressroom/presentations/outlook/ (accessed on 18 May 2021).
- International Civil Aviation Organization. Effects of Novel Coronavirus (COVID-19) on Civil Aviation: Economic Impact Analysis. 2021. Available online: https://www.icao.int/sustainability/Documents/COVID-19/ICAO_Coronavirus_Econ_Impact.pdf (accessed on 18 May 2021).
- Dube, K.; Nhamo, G.; Chikodzi, D. COVID-19 pandemic and prospects for recovery of the global aviation industry. J. Air Transp. Manag. 2021, 92, 102022. [Google Scholar] [CrossRef]
- Shaban, R.Z.; Sotomayor-Castillo, C.F.; Malik, J.; Li, C. Global commercial passenger airlines and travel health information regarding infection control and the prevention of infectious disease: What’s in a website? Travel Med. Infect. Dis. 2020, 33, 101528. [Google Scholar] [CrossRef] [PubMed]
- Antwi, C.O.; Ren, J.; Owusu-Ansah, W.; Mensah, H.K.; Aboagye, M.O. Airport Self-Service Technologies, Passenger Self-Concept, and Behavior: An Attributional View. Sustainability 2021, 13, 3134. [Google Scholar] [CrossRef]
- Zeithaml, V.A.; Berry, L.L.; Parasuraman, A. The Behavioural Consequence of Service Quality. J. Mark. 1996, 60, 31–46. [Google Scholar] [CrossRef]
- Cronin, J.J.; Brady, M.K.; Hutl, G.T.M. Assessing the Effects of Quality, Value, and Customer Satisfaction on Customer Behavioral Intentions in Service Environments. J. Retail. 2000, 76, 193–218. [Google Scholar] [CrossRef]
- Baker, D.A.; Crompton, J.L. Quality, Satisfaction and Behavioral Intentions. Ann. Tour. Res. 2000, 27, 785–804. [Google Scholar] [CrossRef]
- Dawn, B.L.; Thomas, L.P. The Impact of Structure and Process Attributes on Satisfaction and Behavioral Intentions. J. Serv. Mark. 2004, 18, 114–121. [Google Scholar]
- Lin, C.; Hsieh, P.L. Assessing the Self-Service Technology Encounters: Development and Validation of SSTQUAL scale. J. Retail. 2011, 87, 194–206. [Google Scholar] [CrossRef]
- Kim, J.H.; Park, J.W. The effect of airport self-service characteristics on passengers’ perceived value, satisfaction, and behavioral intention: Based on the SOR model. Sustainability 2019, 11, 5352. [Google Scholar] [CrossRef] [Green Version]
- Arora, R. Validation of an SOR model for situation, enduring, and response components of involvement. J. Mark. Res. 1982, 19, 505–516. [Google Scholar] [CrossRef]
- Gudmundsson, S.V.; Cattaneo, M.; Redondi, R. Forecasting temporal world recovery in air transport markets in the presence of large economic shocks: The case of COVID-19. J. Air Transp. Manag. 2021, 91, 102007. [Google Scholar] [CrossRef]
- Zhang, H.; Song, H.; Wen, L.; Liu, C. Forecasting tourism recovery amid COVID-19. Ann. Tour. Res. 2021, 87, 103149. [Google Scholar] [CrossRef]
- Dubowitz, H.; Black, M.; Harrington, D.; Verschoore, A. A follow-up study of behavior problems associated with child sexual abuse. Child. Abus. Negl. 1993, 17, 743–754. [Google Scholar] [CrossRef]
- Rubio, G.; Jiménez, M.; Rodríguez-Jiménez, R.; Martínez, I.; Ávila, C.; Ferre, F.; Palomo, T. The role of behavioral impulsivity in the development of alcohol dependence: A 4-year follow-up study. Alcohol. Clin. Exp. Res. 2008, 32, 1681–1687. [Google Scholar] [CrossRef]
- Chen, J.; Kresnow, M.J.; Simon, T.R.; Dellinger, A. Injury-prevention counseling and behavior among US children: Results from the second Injury Control and Risk Survey. Pediatrics 2007, 119, e958–e965. [Google Scholar] [CrossRef] [Green Version]
- Bae, J.S.; Joung, H.J.; Kim, J.Y.; Kwon, K.N.; Kim, Y.T.; Park, S.W. Test-retest reliability of a questionnaire for the Korea Youth Risk Behavior Web-based Survey. J. Prev. Med. Public Health 2010, 43, 403–410. [Google Scholar] [CrossRef]
- Bollen, K.A. A new incremental fit index for general structural equation models. Sociol. Methods Res. 1989, 17, 303–316. [Google Scholar] [CrossRef]
- Ren, F.; Kwan, M.P. The impact of the Internet on human activity–travel patterns: Analysis of gender differences using multi-group structural equation models. J. Transport. Geogr. 2009, 17, 440–450. [Google Scholar] [CrossRef]
- Lau, Y.; Htun, T.P.; Im Lim, P.; Ho-Lim, S.S.T.; Chi, C.; Tsai, C.; Klainin-Yobas, P. Breastfeeding attitude, health-related quality of life and maternal obesity among multi-ethnic pregnant women: A multi-group structural equation approach. Int. J. Nurs. Stud. 2017, 67, 71–82. [Google Scholar] [CrossRef] [PubMed]
- Bentler, P.M. Comparative fit indexes in structural models. Psychol. Bull. 1990, 107, 238–246. [Google Scholar] [CrossRef] [PubMed]
- Bentler, P.M.; Bonett, D.G. Significance tests and goodness of fit in the analysis of covariance structures. Psychol. Bull. 1980, 88, 588–606. [Google Scholar] [CrossRef]
- Tucker, L.R.; Lewis, C. A reliability coefficient for maximum likelihood factor analysis. Psychometrika 1973, 38, 1–10. [Google Scholar] [CrossRef]
- Hsieh, J.P.A.; Rai, A.; Keil, M. Understanding digital inequality: Comparing continued use behavioral models of the socio-economically advantaged and disadvantaged. MIS Q. 2008, 32, 97–126. [Google Scholar] [CrossRef]
- Sörbom, D. A general method for studying differences in factor means and factor structure between groups. Br. J. Math. Stat. Psychol. 1974, 27, 229–239. [Google Scholar] [CrossRef]
- Baumgartner, H.; Steenkamp, J.B.E. Multi-group latent variable models for varying numbers of items and factors with cross-national and longitudinal applications. Mark. Lett. 1998, 9, 21–35. [Google Scholar] [CrossRef]
- Cole, D.A.; Maxwell, S.E.; Arvey, R.; Salas, E. Multivariate group comparisons of variable systems: MANOVA and structural equation modeling. Psychol. Bull. 1993, 114, 174. [Google Scholar] [CrossRef]
- Hancock, G.R. Structural equation modeling methods of hypothesis testing of latent variable means. Meas. Eval. Couns. Dev. 1997, 30, 91–105. [Google Scholar] [CrossRef]
- Hong, S.; Malik, M.L.; Lee, M.K. Testing configural, metric, scalar, and latent mean invariance across genders in sociotropy and autonomy using a non-Western sample. Educ. Psychol. Meas. 2003, 63, 636–654. [Google Scholar] [CrossRef]
- Cohen, J. Statistical Power Analysis for the Behavioral Sciences, 2nd ed.; Erlbaum: Hillsdale, NJ, USA, 1988. [Google Scholar]
- Sawilowsky, S.S. New effect size rules of thumb. J. Mod. Appl. Stat. Methods 2009, 8, 26. [Google Scholar] [CrossRef]
- Hong, S.H. The Criteria for Selecting Appropriate Fit Indices in Structural Equation Modeling and Their Rationales. Korean J. Clin. Psychol. 2000, 19, 161–177. [Google Scholar]
- Anderson, J.C.; Gerbing, D.W. Structural equation modeling in practice: A review and recommended two-step approach. Psychol. Bull. 1988, 103, 411. [Google Scholar] [CrossRef]
- Marsh, H.W.; Grayson, D. Public/Catholic differences in the high school and beyond data: A multigroup structural equation modeling approach to testing mean differences. J. Educ. Stat. 1990, 15, 199–235. [Google Scholar] [CrossRef]
Figure 1.
Perception structure suggested by Song and Choi [1].
Figure 1.
Perception structure suggested by Song and Choi [1].

Figure 2.
Research Hypothesis.

Figure 3.
Structural equation model. Note: C = COVID-19 prevalence factor; Q = factor of self-isolation period upon entry and departure; D = factor of conditions at overseas travel destination; S = factor of social atmosphere related to overseas travel; A = factor of the level of aircraft/airport management.


| Effect Size | d | Reference |
|---|---|---|
| Very Small | 0.01 | Sawilowsky, 2009 |
| Small | 0.2 | Cohen, 1988 |
| Medium | 0.5 | Cohen, 1988 |
| Large | 0.8 | Cohen, 1988 |
| Very Large | 1.2 | Sawilowsky, 2009 |
| Huge | 2.0 | Sawilowsky, 2009 |
Table 2.
Model’s goodness of fit index.
| Model’s Goodness of Fit Index | |||||
|---|---|---|---|---|---|
| All | (CMIN) | RMSEA | TLI | CFI | CMIN/DF |
| 3942.604 | 0.061 | 0.901 | 0.909 | 8.684 | |
Table 3.
Results of confirmatory factor analysis.
| Latent Variable | Measurement Variable | Estimate | S.E. | C.R. | |
|---|---|---|---|---|---|
| B | β | ||||
| COVID-19-related factor (C) | C-3 | 1 | 0.691 | ||
| C-4 | 1.143 | 0.807 | 0.035 | 32.701 *** | |
| C-5 | 1.164 | 0.822 | 0.035 | 33.231 *** | |
| C-6 | 0.983 | 0.655 | 0.036 | 27.060 *** | |
| C-9 | 0.863 | 0.572 | 0.036 | 23.816 *** | |
| C-10 | 0.984 | 0.645 | 0.037 | 26.710 *** | |
| Factor of self-isolation upon entry and departure (Q) | Q-5 | 1 | 0.686 | ||
| Q-3 | 1.128 | 0.829 | 0.034 | 33.341 *** | |
| Q-2 | 1.119 | 0.851 | 0.033 | 34.072 *** | |
| Q-1 | 1.108 | 0.807 | 0.034 | 32.622 *** | |
| Destination-related factor (D) | D-1 | 1 | 0.804 | ||
| D-2 | 1.078 | 0.817 | 0.027 | 40.493 *** | |
| D-3 | 1.084 | 0.827 | 0.026 | 41.119 *** | |
| D-4 | 1.060 | 0.793 | 0.027 | 39.014 *** | |
| D-7 | 0.884 | 0.625 | 0.030 | 29.133 *** | |
| D-9 | 0.860 | 0.574 | 0.033 | 26.363 *** | |
| Social atmosphere related to overseas travel (S) | S-7 | 1 | 0.613 | ||
| S-6 | 0.920 | 0.576 | 0.043 | 21.174 *** | |
| S-5 | 1.141 | 0.706 | 0.046 | 24.586 *** | |
| S-3 | 1.070 | 0.663 | 0.045 | 23.528 *** | |
| S-1 | 0.781 | 0.546 | 0.038 | 20.317 *** | |
| Level of aircraft/airport management related to infectious diseases (A) | A-13 | 1 | 0.740 | ||
| A-12 | 1.046 | 0.781 | 0.029 | 36.074 *** | |
| A-9 | 0.859 | 0.639 | 0.030 | 29.034 *** | |
| A-8 | 1.006 | 0.733 | 0.030 | 33.640 *** | |
| A-7 | 1.044 | 0.749 | 0.030 | 34.427 *** | |
| A-6 | 1.100 | 0.796 | 0.030 | 36.851 *** | |
| A-5 | 1.143 | 0.831 | 0.030 | 38.653 *** | |
| A-4 | 1.093 | 0.791 | 0.030 | 36.573 *** | |
| A-3 | 1.104 | 0.806 | 0.030 | 37.369 *** | |
| A-2 | 1.084 | 0.792 | 0.030 | 36.618 *** | |
| A-1 | 1.008 | 0.757 | 0.029 | 34.863 *** | |
* < 0.1; ** < 0.05; *** < 0.001 (two-tailed).
Table 4.
Analysis of structural model (paths) per factor.
| Factor | Estimate | S.E. | C.R. | |||
|---|---|---|---|---|---|---|
| B | β | |||||
| COVID-19-related factor (C) | → | Factor related to self-isolation upon entry and departure (Q) | 0.776 | 19.158 *** | 0.747 | 14.577 *** |
| COVID-19-related factor (C) | → | Destination-related factor (D) | 0.362 | 6.033 *** | 0.408 | 5.853 *** |
| COVID-19-related factor (C) | → | Social atmosphere related to overseas travel (S) | 0.413 | 7.712 *** | 0.434 | 6.909 *** |
| COVID-19-related factor (C) | → | Level of aircraft/airport management related to infectious diseases (A) | 0.100 | 2.020 ** | 0.063 | 0.997(0.319) |
| Factor related to self-isolation upon entry and departure (Q) | → | Destination-related factor (D) | −0.128 | −2.183 ** | −0.134 | −2.012 ** |
| Factor related to self-isolation upon entry and departure (Q) | → | Social atmosphere related to overseas travel (S) | 0.271 | 5.435 *** | 0.290 | 5.094 *** |
| Factor related to self-isolation upon entry and departure (Q) | → | Level of aircraft/airport management related to infectious diseases (A) | 0.116 | 2.598 ** | 0.252 | 4.594 *** |
| Destination-related factor (D) | → | Social atmosphere related to overseas travel (S) | 0.331 | 10.968 *** | 0.339 | 8.921 *** |
| Destination-related factor (D) | → | Level of aircraft/airport management related to infectious diseases (A) | 0.240 | 7.984 *** | 0.145 | 3.593 *** |
| Social atmosphere related to overseas travel (S) | → | Level of aircraft/airport management related to infectious diseases (A) | 0.467 | 8.646 *** | 0.422 | 5.349 *** |
* < 0.1; ** < 0.05; *** < 0.001 (two-tailed).
Table 5.
Goodness-of-fit index for invariance verification.
| Model | χ2 (CMIN) | DF | TLI | CFI | RMSEA | Δχ2 | Δdf | Sig | |
|---|---|---|---|---|---|---|---|---|---|
| Model 1 | Configural invariance (base model) | 4536.911 | 908 | 0.897 | 0.906 | 0.044 | |||
| Model 2 | Measurement invariance | 4570.042 | 935 | 0.9 | 0.905 | 0.044 | 33.131 | 27 | 0.193 |
| Model 3 | Scalar invariance | 4735.735 | 967 | 0.899 | 0.902 | 0.044 | 198.824 | 59 | 0.000 *** |
| Model 4 | Strict invariance | 4586.692 | 940 | 0.9 | 0.905 | 0.044 | 49.781 | 32 | 0.023 ** |
* < 0.1; ** < 0.05; *** < 0.001 (two-tailed).
Table 6.
Results of latent mean difference analysis.
| Latent Variable | 1st Survey | 2nd Survey | Pooled Estimation Variance | Effect Size (d) |
|---|---|---|---|---|
| COVID-19-related factor(C) | 0 | 0.331 *** | 0.753 | 0.440 |
| Factor related to self-isolation upon entry and departure (Q) | 0 | 0.176 *** | 0.752 | 0.234 |
| Destination-related factor (D) | 0 | 0.077 *** | 0.626 | 0.123 |
| Social atmosphere related to overseas travel (S) | 0 | 0.194 * | 0.608 | 0.319 |
| Level of aircraft/airport management related to infectious diseases (A) | 0 | 0.073 ** | 0.846 | 0.086 |
* < 0.1; ** < 0.05; *** < 0.001 (two-tailed).
Publisher’s Note: MDPI stays neutral with regard to jurisdictional claims in published maps and institutional affiliations. |
© 2021 by the authors. Licensee MDPI, Basel, Switzerland. This article is an open access article distributed under the terms and conditions of the Creative Commons Attribution (CC BY) license (https://creativecommons.org/licenses/by/4.0/).
Share and Cite
MDPI and ACS Style
Song, K.-H.; Choi, S. A Study on the Perception Change of Passengers on Sustainable Air Transport Following COVID-19 Progress. Sustainability 2021, 13, 8056. https://doi.org/10.3390/su13148056
AMA Style
Song K-H, Choi S. A Study on the Perception Change of Passengers on Sustainable Air Transport Following COVID-19 Progress. Sustainability. 2021; 13(14):8056. https://doi.org/10.3390/su13148056
Chicago/Turabian StyleSong, Ki-Han, and Solsaem Choi. 2021. "A Study on the Perception Change of Passengers on Sustainable Air Transport Following COVID-19 Progress" Sustainability 13, no. 14: 8056. https://doi.org/10.3390/su13148056
Note that from the first issue of 2016, this journal uses article numbers instead of page numbers. See further details here.