


Introduction
On 31 December 2019, local hospitals in Wuhan, China reported that they had detected a series of cases of Novel Coronavirus-infected pneumonia to the World Health Organization (WHO) [Reference Li1]. On 7 January, the causative agent was identified by the Chinese Centre for Disease Control and Prevention as a Novel Coronavirus and designated ‘2019-nCoV’ and finally as "SARS-COV-2". Epidemiological investigations identified the local Huanan seafood wet market as the location of an initial exposure event [Reference Chen2]. The market was closed on 31 December 2019 [Reference Chen2, 3] and wildlife market activity was banned countrywide. Despite travel restrictions to and from the city imposed by Chinese authorities to limit the potential dispersion of the virus beyond the region [Reference Wu, Leung and Leung4, Reference Bogoch5], international cases continue to be reported.
As of 5 February 2020, there were 24 554 confirmed Novel Coronavirus-infected pneumonia (COVID-19) cases in 27 countries or territories, of which 24 363 (99.2%) were within mainland China [6]. The locations of internationally imported cases are consistent with risk models generated from flight data out of Wuhan city. Transmission from mildly symptomatic (i.e. cough, lethargy, myalgia) infected individuals was identified early in the course of this outbreak, with human-to-human transmission detected in international case series [Reference Rothe7].
The timing of this outbreak around the lunar new year widely celebrated in China coincides with a period of highest annual human movement patterns in the region and between China and globally [Reference Wang8], increasing the potential for rapid geographic dispersal of the infection. Further, recent investment in the African continent by the Chinese state and private investors has led to an increasing Chinese diaspora [Reference Brautigam, Xiaoyang and Xia9] and a greater number of direct and indirect flight connections to the African continent from China [Reference Wang, Yang and Wang10].
There are few studies available on global risk of 2019-nCoV spread [Reference Wu, Leung and Leung4, Reference Bogoch5, Reference Chinazzi11]. Bogoch et al. [Reference Bogoch5] and Chinazzi et al. [Reference Chinazzi11] estimated the risk of importation of 2019-nCoV from major Chinese cities to the most frequent international destinations. Wu et al. estimated the risk of international spread compared to domestic outbound flights [Reference Wu, Leung and Leung4]. These articles do not model the cumulative risk of importation of 2019-nCoV in a country and instead focus on specific points of entry. Here, we considered all the end destinations of flights from four important cities of China involving 168 countries/territories around the world and calculated the total risk of transmission into a country by aggregating the risk associated with all the entry airports of the country. We further looked in more detail at the risk to Africa where the health infrastructure would be challenged tracking a new epidemic across its 54 countries.
The aim of the current study was to explore the effect of sustained transmission from the four Chinese cities of Wuhan, Beijing, Shanghai and Guangzhou on international disease importation risk to 168 countries and territories, with a specific focus on Africa where current levels of healthcare infrastructure could provide a significant challenge for managing this novel epidemic.
Methods
Data
We extracted modelled flight data for the final destination of passengers travelling from four Chinese cities (including domestic and international destinations) from the FLIRT database [Reference Huff12, Reference Alliance13]. FLIRT was designed to predict the flow and likely destination of infected travellers through the air travel network. It uses a database of flight schedules from over 800 airlines and displays direct flight connections in addition to a modelled end destination (three-letter IATA code for airports). Flight connection data and passenger numbers are based on the data collected since October 2014 [Reference Huff12]. We extracted the simulated passenger's data for each week for the period of 1 January to 31 January 2020 from four major Chinese cities: Wuhan, Beijing, Shanghai and Guangzhou. The simulation can process up to 20 000 passengers' information for a particular time frame from any city (including surrounding airports). We collected the reported 2019-nCoV case data from the WHO's daily situation update website [14].
Estimation of risk of transmission
To estimate the relative risk of 2019-nCoV transmission, we considered all infected passengers who travelled between 1 January and 31 January to possess a maximum risk of transmission 1 (and no infected passengers means no risk) and estimated the relative risk of each country based on the number of passengers who travelled from each of the four cities. Thus countries with a higher number of passengers travelling from any of these cities had a higher risk of transmission. We then weighted the risk estimated for each city with the number of reported infected people in each city by 31 January 2020 [14] and estimated the mean average risk of transmission termed as ‘Risk index’ which follows the equation below:

where x is the destination country, Risk index (x) is the risk of infection importation in country x, P(x)n is the number of passengers to country x from city n, P n is the total number of passengers who left city n, I n is the number of infected people in city n and C n is the population size of city n. The risk index denotes the risk of at least one case being imported into a country or territory where 1 means an absolute certainty and 0 means no risk at all. Our model assumed that there is no case outside China and thus ignored if any country already had imported case(s). In countries where 2019-nCoV is already detected, the risk index would explain the risk of importing additional infected individuals from China.
We performed a Pearson correlation coefficient test between the risk index of the country and the WHO's reported case number from the country. We grouped the countries in four quantiles based on the risk index where high-risk countries were grouped as the 4th (>75th percentiles) and the 3rd (>50th to ⩽75th percentiles) quantiles and low-risk countries were grouped as the 2nd (>25th to ⩽50th percentiles) and the 1st (⩽25th percentile) quantiles (Table 1).
Table 1. The list of countries or territories based on their risk index in different quantiles for 2019-nCoV (SARS-COV-2) transmission

Results
We modelled 388 287 passengers travelling to 1297 airports in 168 countries or territories. The risk index of 2019-nCoV for these countries is presented in Figure 1. A regularly updated risk map is hosted on PANDORA's website ( https://ncovdata.io/import/).
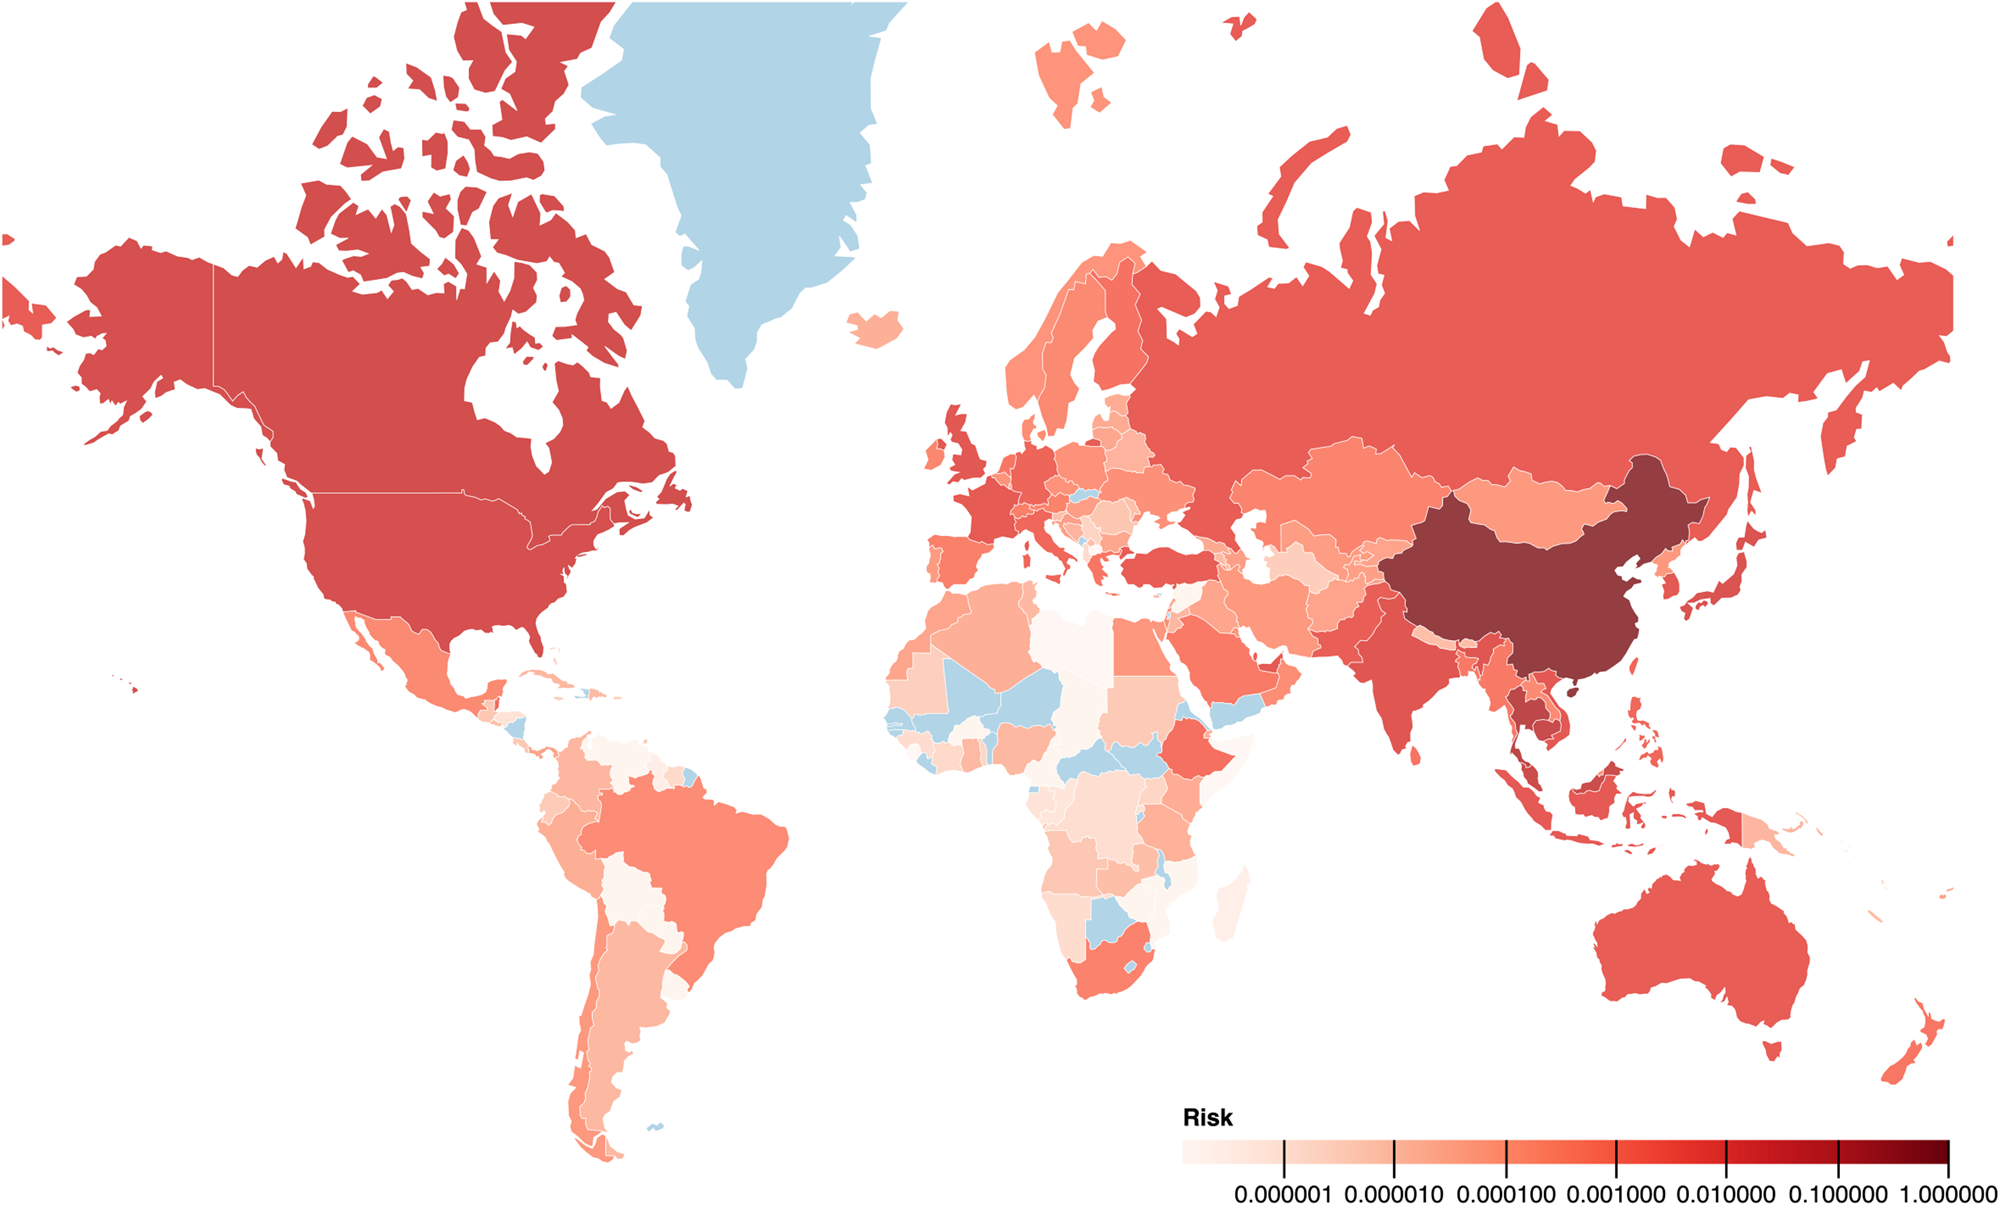
Fig. 1. The map with the risk index of countries or territories with 2019-nCoV (SARS-COV-2) infection (0-1). The darker colour indicates higher risk and light blue colour indicates the absence of data. In general, China and neighbouring countries have a higher risk of transmission of 2019-nCoV infection. Africa and South America generally have a low risk of transmission. Ethiopia, South Africa, Egypt, Mauritius and Brazil have a similar risk of transmission to countries where at least one case has been detected. For example, the risk index of 0.1 for Thailand indicates that based on travel patterns observed during 1–31 January 2020 from four major cities of China, Thailand has 10% risk of importing a 2019-nCoV-infected person from China.
Outside China, the countries with the highest risk of 2019-nCoV transmission from our model were Thailand, Cambodia, Malaysia, Canada and the USA, all of which have reported at least one case. Among the top 25 countries identified with the highest risk of 2019-nCoV transmission (Fig. 2), all countries except four (Indonesia, Turkey, Pakistan and Qatar) have detected at least one case as of 5 February 2020 (Table 1).

Fig. 2. Chart showing the relative risk of countries outside China being exposed to coronavirus ( SARS-COV-2) transmission. The second Y-axis indicates the number of confirmed COVID-19 cases reported by the WHO as of 5 February 2020. Twenty-one of the top 25 at-risk countries (except Indonesia, Turkey, Pakistan and Qatar) reported at least one COVID-19 case by 5 February 2020.
According to our risk score classification, of the countries that reported at least one 2019-nCoV case as of 5 February 2020, 24 countries were in the 4th quantile of the risk index, two (Sweden and Belgium) in the 3rd quantile, one (Nepal) in the 2nd quantile and none in the 1st quantile [14]. Asian and European countries are dominant in the 3rd and 4th quantile (high-risk index) while African and South American Countries are the majority in the 1st and 2nd quantiles (low-risk index) (Table 1). Out of 43 countries in the 4th quantile, 22 were from Asia and 13 from Pan-Europe, whereas in the 1st quantile, 19 out of 42 countries were from Africa (Table 1).
The overall risk of transmission of the virus into Africa is low. However, Ethiopia, South Africa, Egypt and Mauritius have a similar risk score as countries where at least one case was detected. In South America, only Brazil has a similar or greater risk than countries currently reporting cases. In North America, both the USA and Canada have high risk and had imported cases reported early in the outbreak. Australia and New Zealand have risk similar to the countries where at least one case is detected. Although there are few direct flights from China to African destinations, a large number of indirect flights operate via Dubai, an international airport hub in the United Arab Emirates.
The correlation coefficient between the estimated risk index of the countries and the WHO-reported confirmed cases was 0.97.
Discussion
Our analysis showed a high risk of transmission of 2019-nCoV through air flights from four Chinese cities to neighbouring Asian countries. The risk of 2019-nCoV (SARS-COV-2) transmission was relatively low in Africa and South America. Several countries in both North America and Oceania showed high risk with these countries reporting at least one case of 2019-nCoV. Our risk index showed a very high correlation with the WHO's reported COVID-19 cases.
China has four times as many air passengers now than it had during SARS outbreaks in 2003. A large number of workers now travel internationally where China is heavily investing in infrastructure development in Africa, parts of Asia and Latin America. A significant and mobile Chinese population live in Europe and North America alongside an increasing amount of Chinese tourism. This travel poses a high risk of 2019-nCoV travelling across international borders. Although acquiring a case is low for these countries, the consequences are likely to be higher because of the country's capacity to control such situations [15].
Based on our model, the countries with the highest risk index but have not reported any case of 2019-nCoV as yet are Indonesia, Pakistan, Turkey, Qatar and Ethiopia. These countries are at risk and they should be the priorities for investment in case detection and airport screening. Compared to the SARS outbreak of 2003, the situation in 2020 differs due to the increased frequency and volume of international air travel.
During these early stages of the epidemic, case numbers have doubled on average every 7.4 days with an estimated basic reproduction number (R 0) of 2.2 (1.4–3.9) [Reference Li1]. Although the data so far suggest that the disease is mild in most cases and that the case fatality rate is currently reported to be lower than SARS or MERS, the situation is likely to go on for months and could cause severe disruption in countries that are not well prepared. Hence countries ranked as high risk in our model (4th and 3rd quantiles) should take all steps necessary to ensure prompt detection of cases and the capacity to manage these cases to prevent ongoing spread. International investment needs to be directed especially to countries with limited healthcare and public health surveillance capacity to enable the detection of cases and disease control [Reference Hui16, Reference Mccloskey and Heymann17]
Our estimation showed a lower risk of transmission in Africa and South America. Nevertheless, low and middle countries on these continents are more likely to see the ongoing spread and major disruption from the introduction of a single case, even if the risk of importation is lower. Direct flights between Chinese cities and African countries are few which has contributed to a lower estimated risk of 2019-nCoV transmission. As of 5 February 2020, five cases have been reported from the United Arab Emirates (UAE) which acts as an important travel hub for onward journeys to the African continent. Implementation of mildly symptomatic passenger screening in the UAE may reduce the potential for 2019-nCoV to enter Africa. Screening and diagnostic capacity in Africa has been supported by a rapid grant from the Bill and Melinda Gates Foundation to the African CDC, mitigating the consequences of an importation.
The current situation is extremely dynamic and since then some countries have instigated flight restrictions and closed borders (e.g. Russia). These decisions were relevant for these locations but not based on probabilities. WHO has not recommended a cessation of transportation to free countries but suggested preventive measures. This would seem appropriate for Africa and South America with the caveat that only one case is needed to initiate a local epidemic without proper biosecurity and quarantine measures, whilst other regions will need to decide on a case-by-case basis through appropriate risk assessment.
Our study has several limitations. We considered flights from four cities of China, three of which (Beijing, Shanghai and Guangzhou) are ranked among top five busiest airports (based on the number of flights) in China and Wuhan as the site of origin of outbreaks. While including further cities in our analysis would have added further information, Beijing and Shanghai cover most of the international destinations to which other airports are connected. Further, we have adjusted for the number of reported cases in each departure. When developing the model, we initially explored using only Wuhan as the departure airport, the rank of top 10 at-risk countries remained the same. Thus our findings are still representative of the total risk posed by other airports or cities. We did not consider the risk associated with the travel route through water and land which might have an impact in the spread of 2019-nCoV. Another limitation is that the model does not account for travel patterns in other affected countries. For example, some cases have started acquiring the disease outside of China: the third case notified in the UK acquired the disease in Singapore. However overall, the risk compared with the risk of acquisition in China is very low, therefore it probably would not change the order of countries.
Conclusion
The risk of transmission of SARS-COV-2 from China on 31 January 2020 was highest to neighbouring countries in Asia (Thailand, Cambodia, Malaysia), followed by Europe (UK, France, Russia and Germany), Oceania (Australia and New Zealand) and North America (USA and Canada). The situation is dynamic and may have changed with the closure of flights and borders since this analysis was done. The higher correlation coefficient with travellers and case detection data indicate that 2019-nCoV will remain a significant threat from the air-borne movement of people. The authors suggest an ongoing risk-based approach to the prioritisation of and investment by international and national agencies and authorities, in emergency interventions for the prevention of movement of 2019-nCoV (SARS-COV-2) through human travel. This is achieved by appropriate actions at high-risk points of departure and at highly used ports of entry from these infected zones. Closure of certain routes, targeted airport screening, risk communication, public awareness and targeted training and vigilance of health workers associated with the portals of entry of visitors to their countries will help mitigate the force of further spread of 2019-nCoV.
Acknowledgements
All authors are part of PANDORA-ID-NET Consortium (EDCTP Reg/Grant RIA2016E-1609) funded by the European and Developing Countries Clinical Trials Partnership (EDCTP2) programme which is supported under Horizon 2020, the European Union's Framework Programme for Research and Innovation. AZ is in receipt of a National Institutes of Health Research (NIHR) senior investigator award and the PANDORA-ID-NET. FN and AZ acknowledge support from EDCTP (CANTAM2). We acknowledge the Eco Health Alliance for making FLIRT data publicly available.
Conflict of interest
The authors declare that they have no conflict of interest.


 Open access