Advertisement
Grab your lab coat. Let's get started
Welcome!
Welcome!
Create an account below to get 6 C&EN articles per month, receive newsletters and more - all free.
It seems this is your first time logging in online. Please enter the following information to continue.
As an ACS member you automatically get access to this site. All we need is few more details to create your reading experience.
Not you? Sign in with a different account.
Not you? Sign in with a different account.
ERROR 1
ERROR 1
ERROR 2
ERROR 2
ERROR 2
ERROR 2
ERROR 2
Password and Confirm password must match.
If you have an ACS member number, please enter it here so we can link this account to your membership. (optional)
ERROR 2
ACS values your privacy. By submitting your information, you are gaining access to C&EN and subscribing to our weekly newsletter. We use the information you provide to make your reading experience better, and we will never sell your data to third party members.
Greenhouse Gases
Covid-19
Pandemic experiments prove CO₂ monitoring networks provide real-time emission information
Real-time monitoring shows emissions fell in the Los Angeles and DC-Baltimore areas
by Katherine Bourzac
June 10, 2021
| A version of this story appeared in
Volume 99, Issue 22

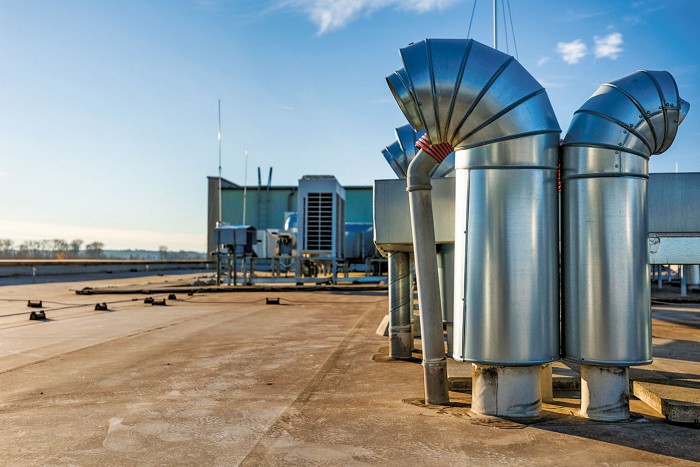
Credit: Vince360/Shutterstock
A decrease in traffic during pandemic lockdowns in April 2020 was a major reason CO2 emissions fell during that time in places like Los Angeles.
In April 2020, during the height of lockdowns designed to slow the spread of SARS-CoV-2, carbon dioxide emissions in the Los Angeles and Washington, DC–Baltimore areas fell by about 30% relative to the 2 previous years (Geophys. Res. Lett. 2021, DOI: 10.1029/2021GL092744). The data come from CO2 sensor networks established in the two regions by researchers at the Jet Propulsion Laboratory and the National Institute of Standards and Technology (NIST).
Support nonprofit science journalism
C&EN has made this story and all of its coverage of the coronavirus epidemic freely available during the outbreak to keep the public informed. To support us:
Donate Join Subscribe
A previous study measured the same drop in CO2 emissions in the San Francisco Bay Area during that region’s shelter-in-place order (Geophys. Res. Lett. 2020, DOI: 10.1029/2020GL090037). In all three cases, a decrease in passenger-vehicle traffic appears to have been the biggest reason for the reductions, which have since been reversed as people again ventured out of their homes.
These transient but dramatic emission changes gave chemists an opportunity to demonstrate the capabilities of their CO2 monitoring networks. Urban CO2 emissions are typically tallied indirectly each year using indicators, like gasoline sales, that don’t detect emission changes from day to day or week to week. The pandemic-era studies show that sensor networks that directly measure changes in CO2 concentration in cities can make information available much more rapidly—in near real time, says NIST’s Kimberly Mueller, one of the new study’s authors. “We’re trying to get data that could be useful for cities and city stakeholders,” she says.
Chemical & Engineering News
ISSN 0009-2347
Copyright © 2024 American Chemical Society
You might also like...
The power is now in your (nitrile gloved) hands
Sign up for a free account to get more articles. Or choose the ACS option that’s right for you.
Already have an ACS ID? Log in
Join the conversation
Contact the reporter
Submit a Letter to the Editor for publication
Engage with us on Twitter