
The Dysregulation of the Renin–Angiotensin System in COVID-19 Studied by Serum Proteomics: Angiotensinogen Increases with Disease Severity


Abstract
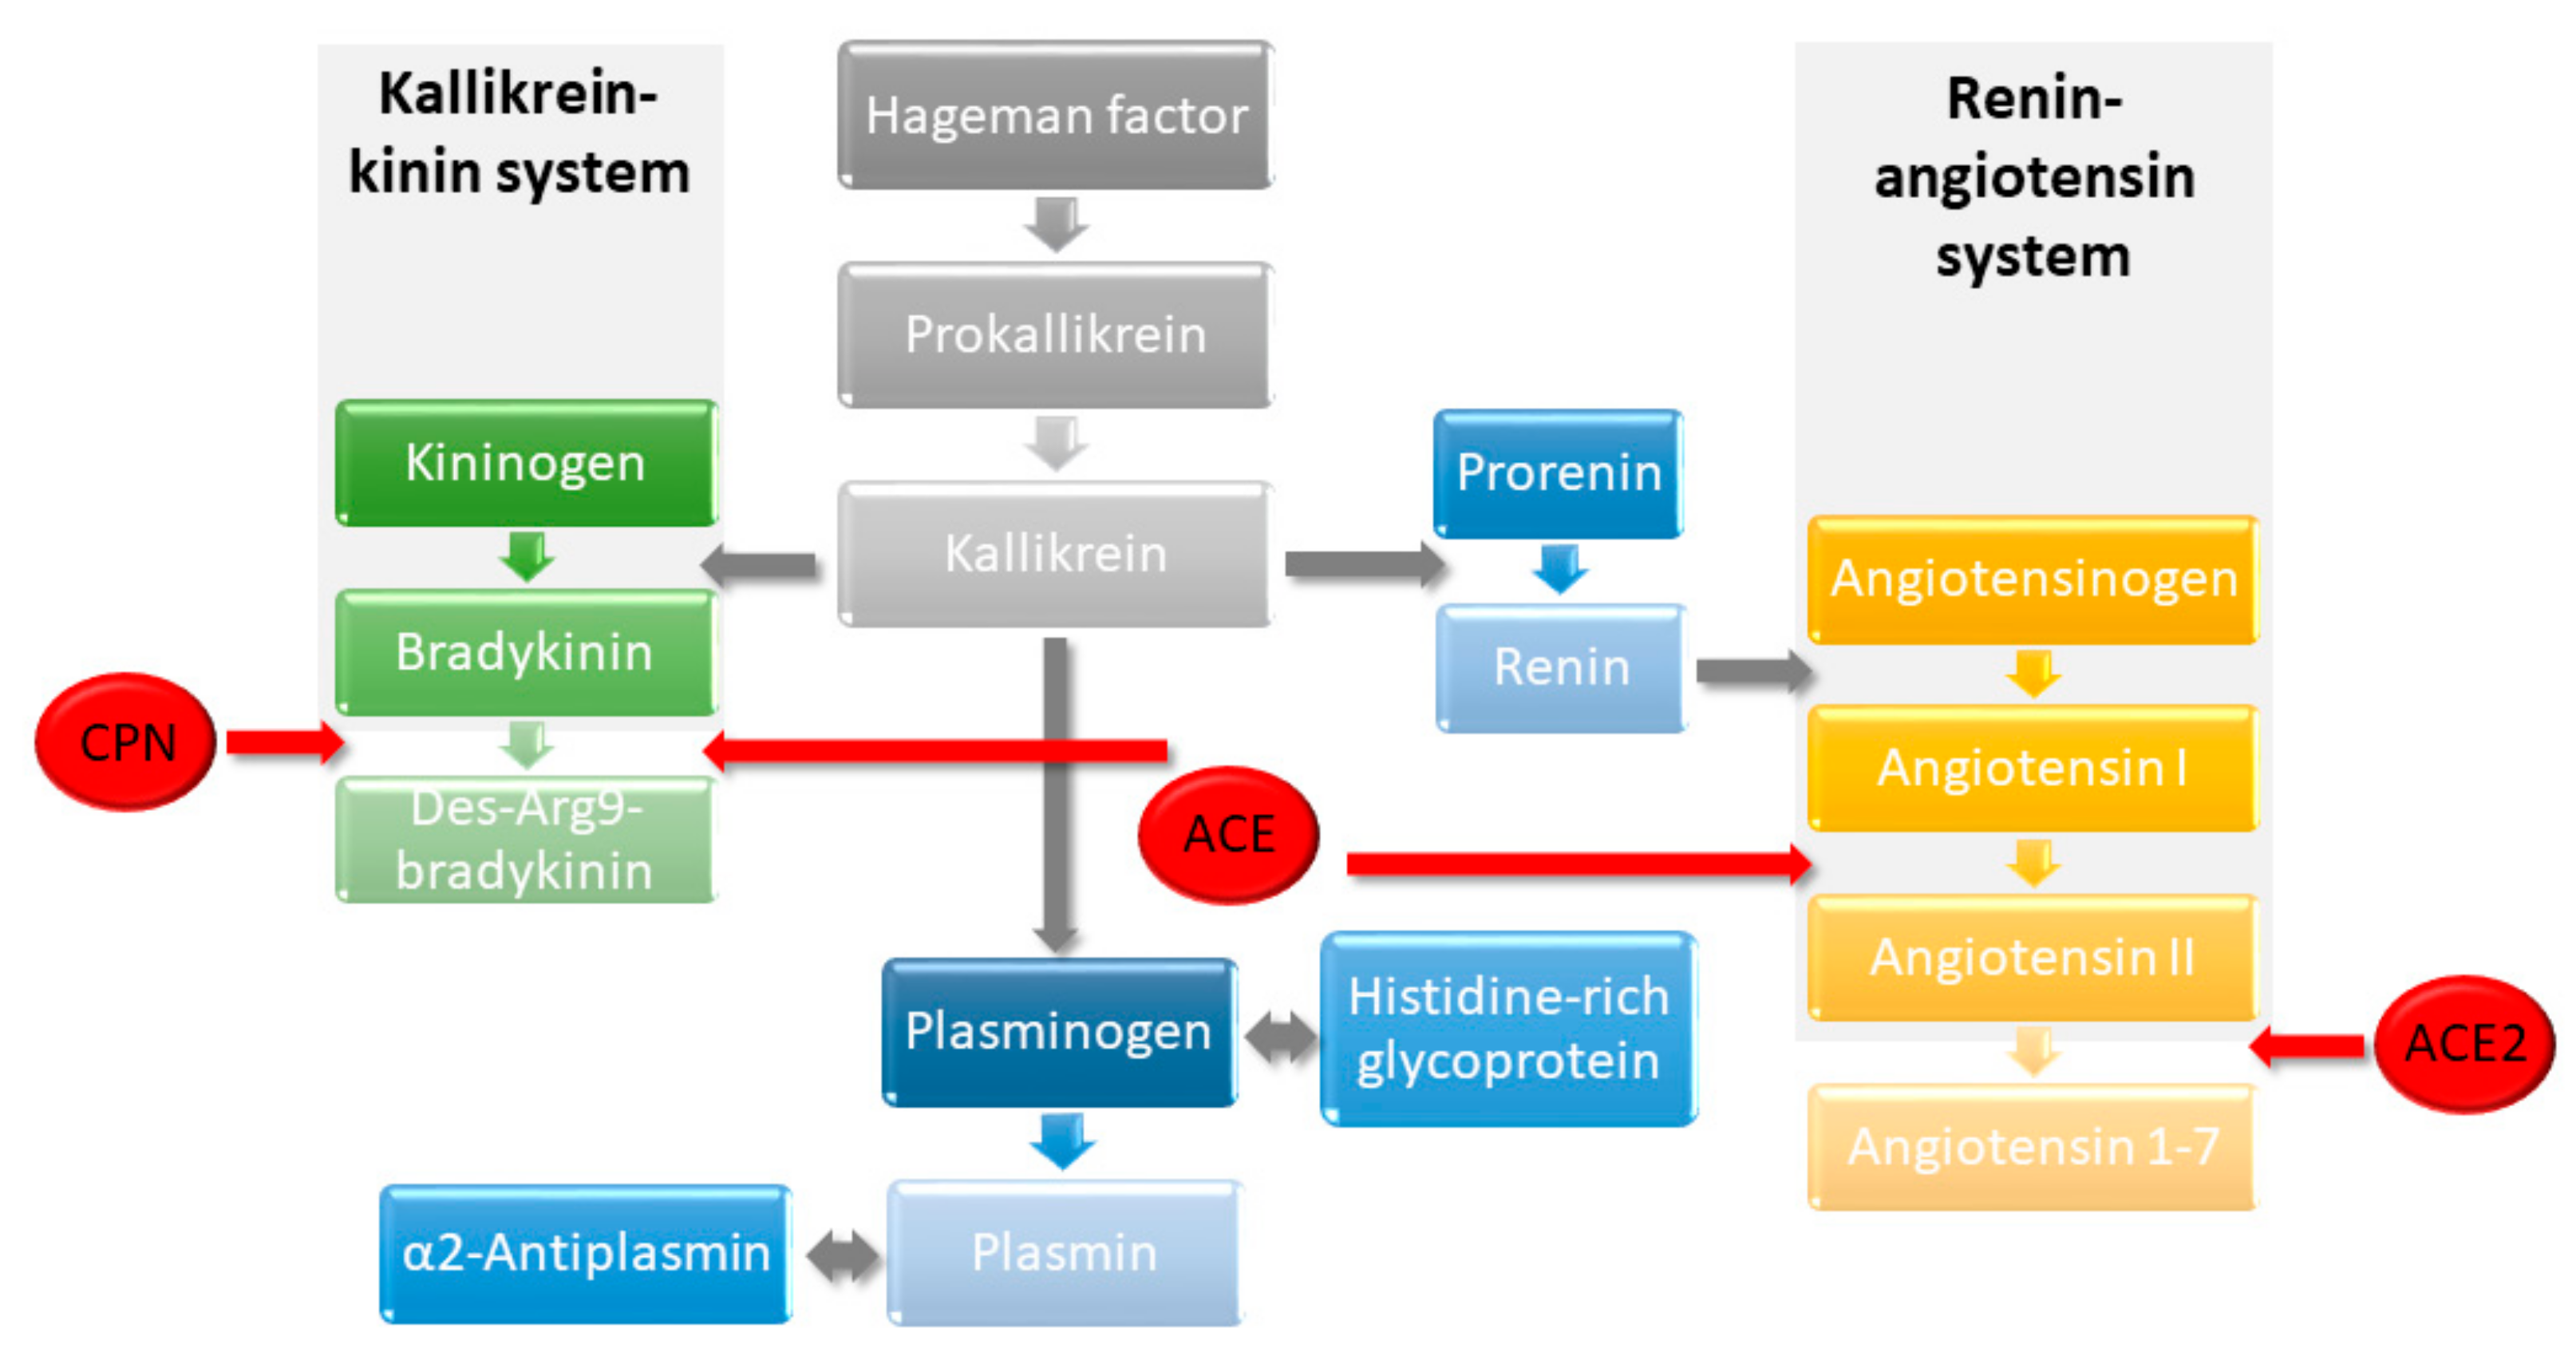
:1. Introduction
2. Results
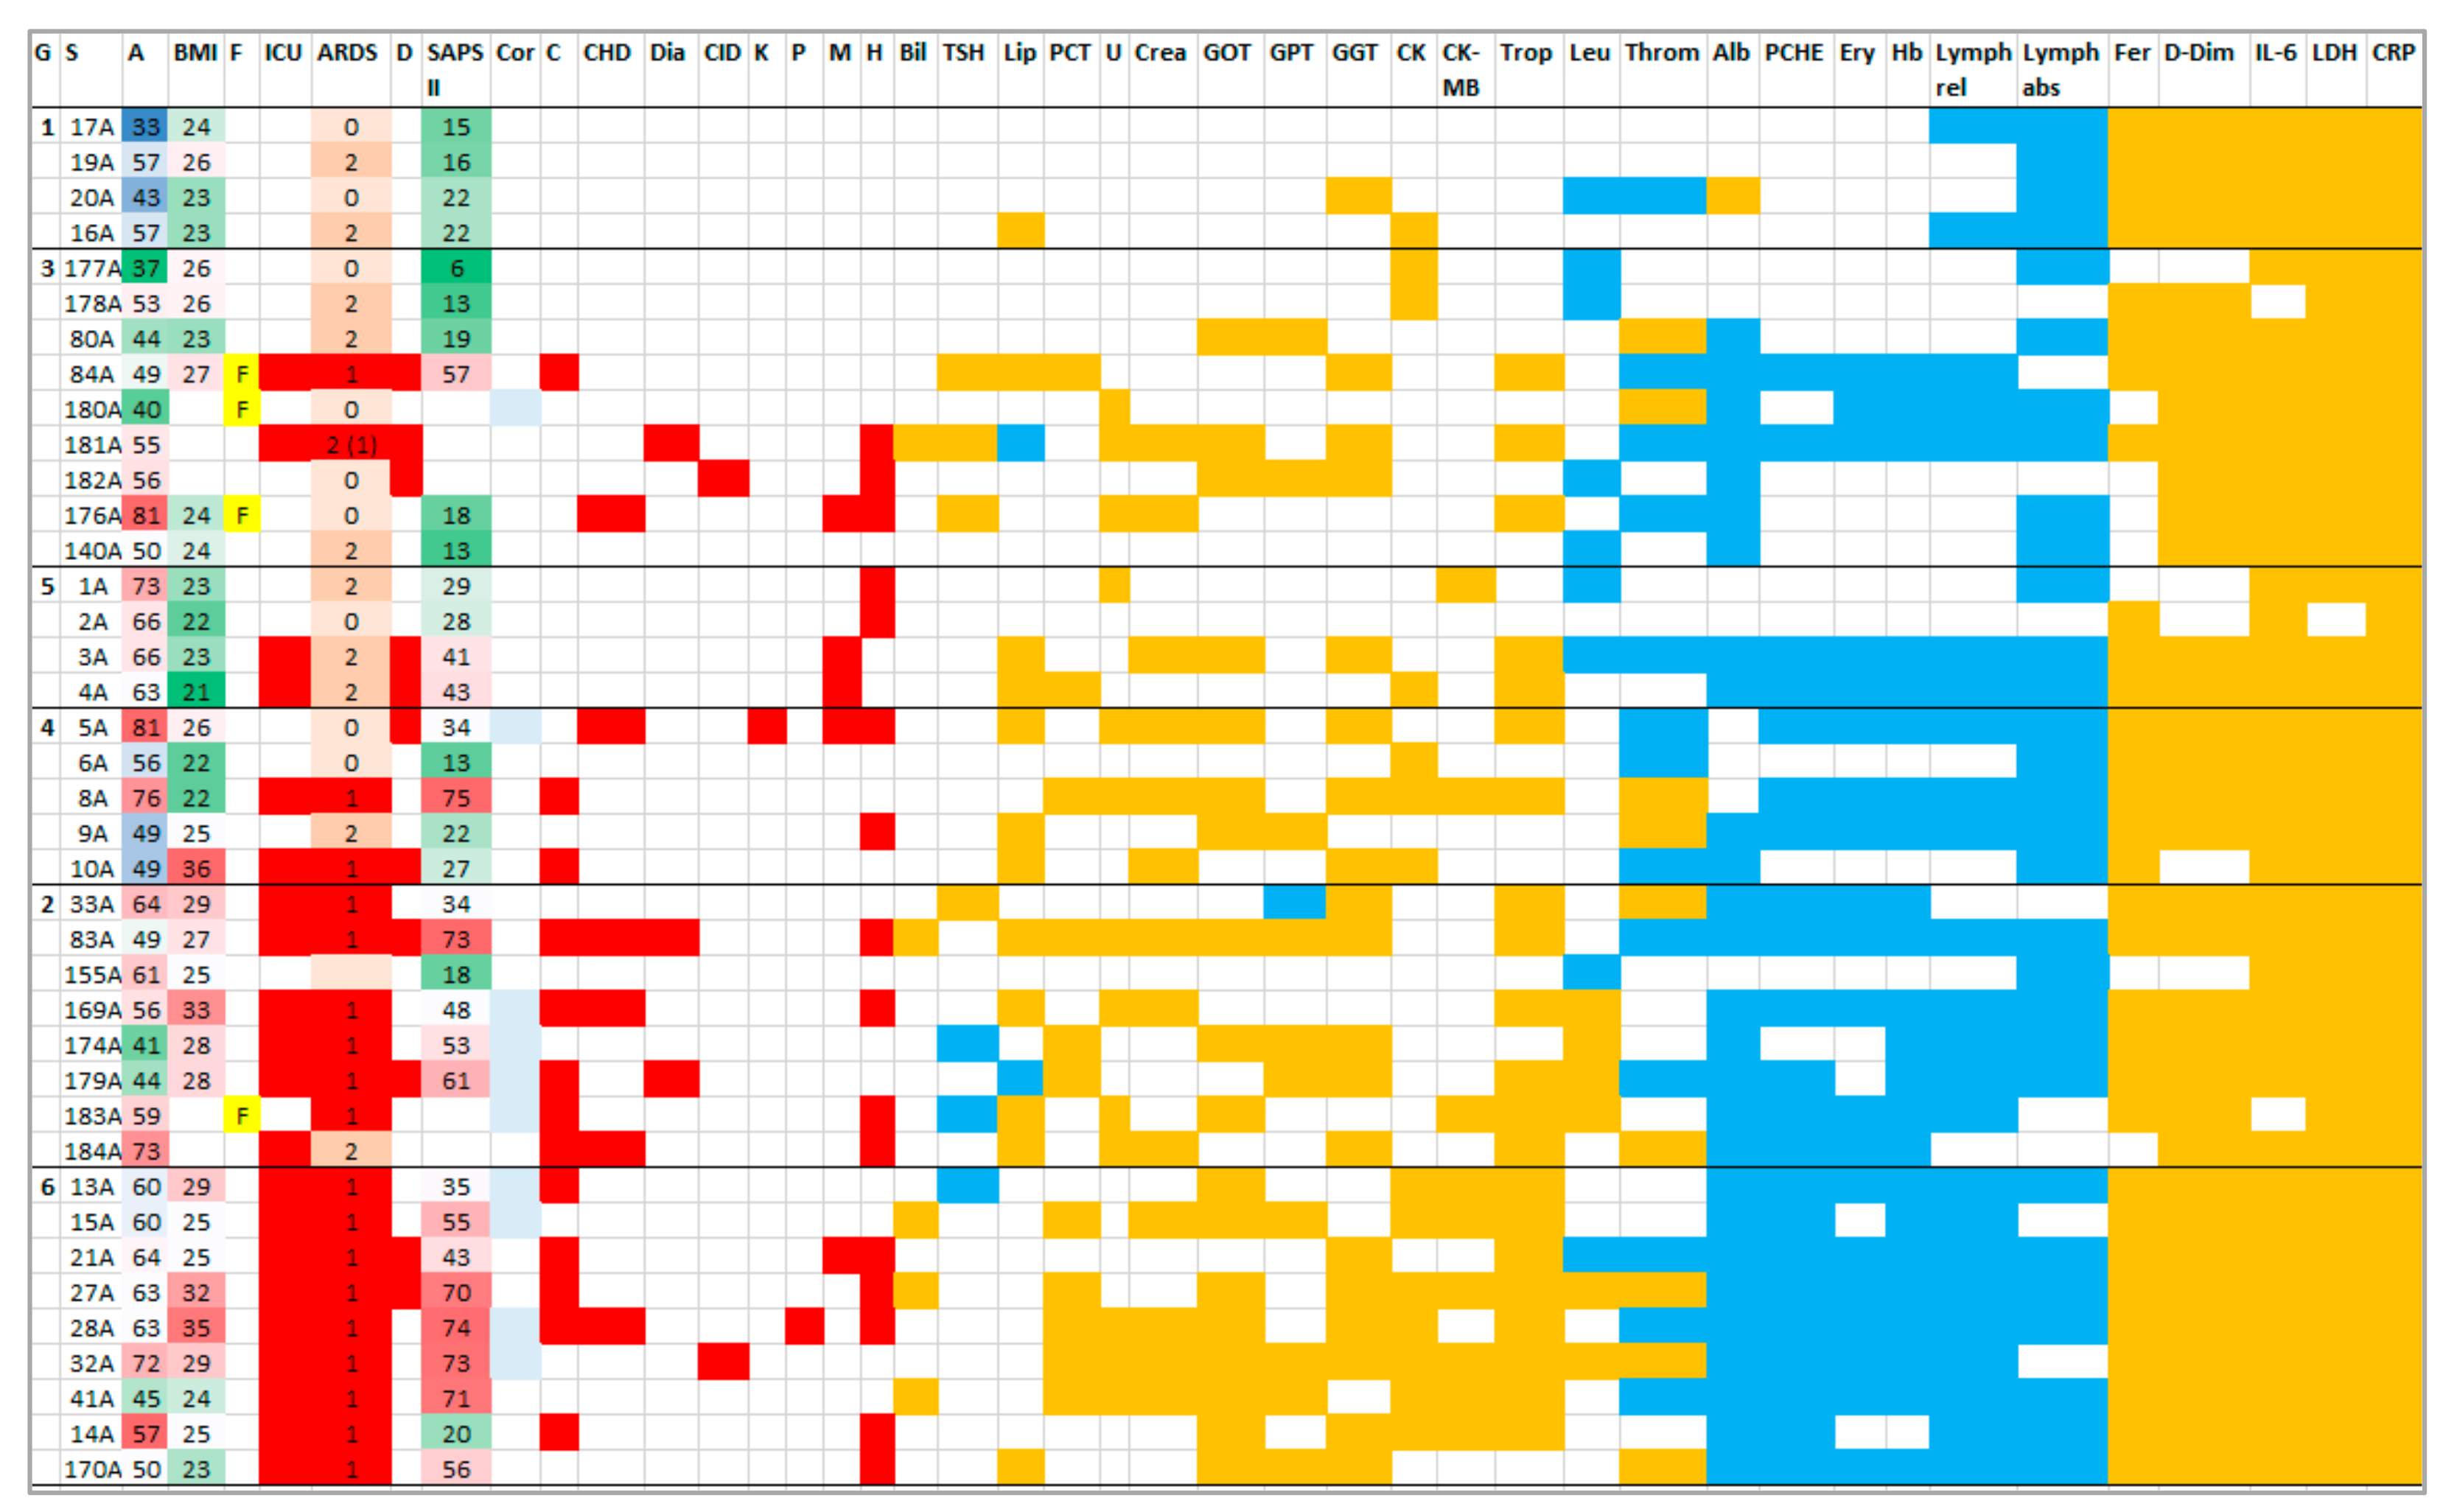
2.1. Patients
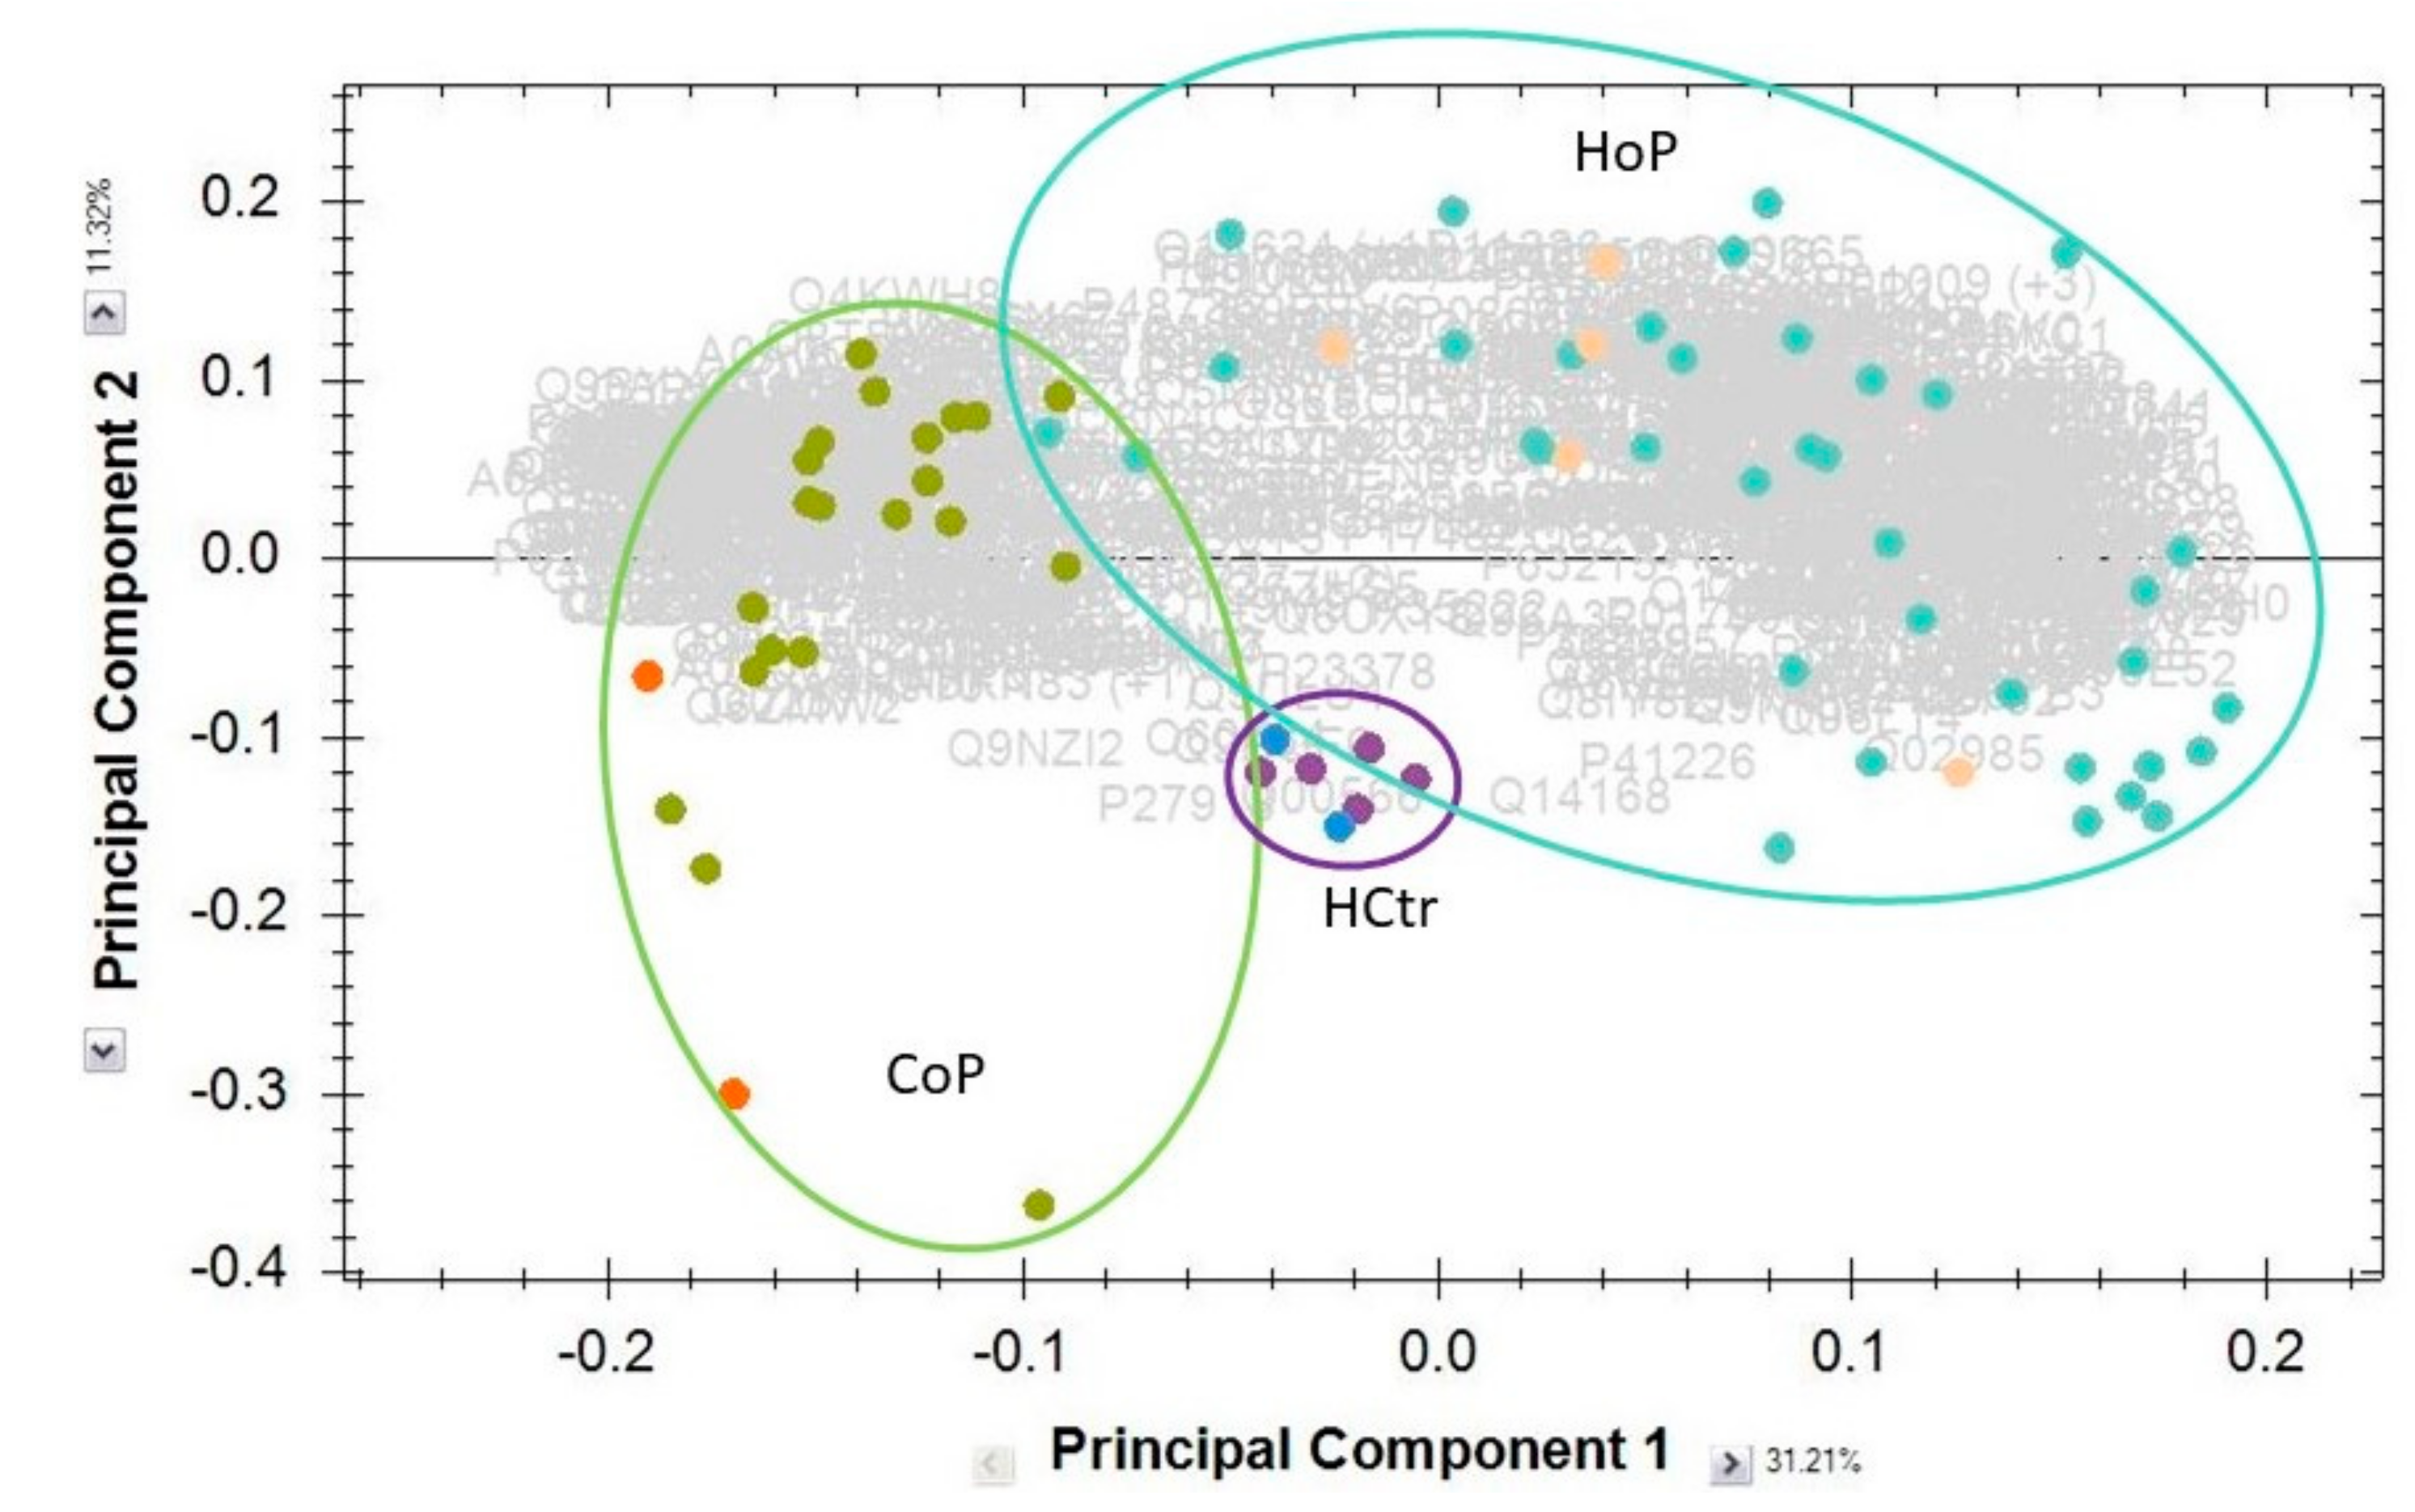
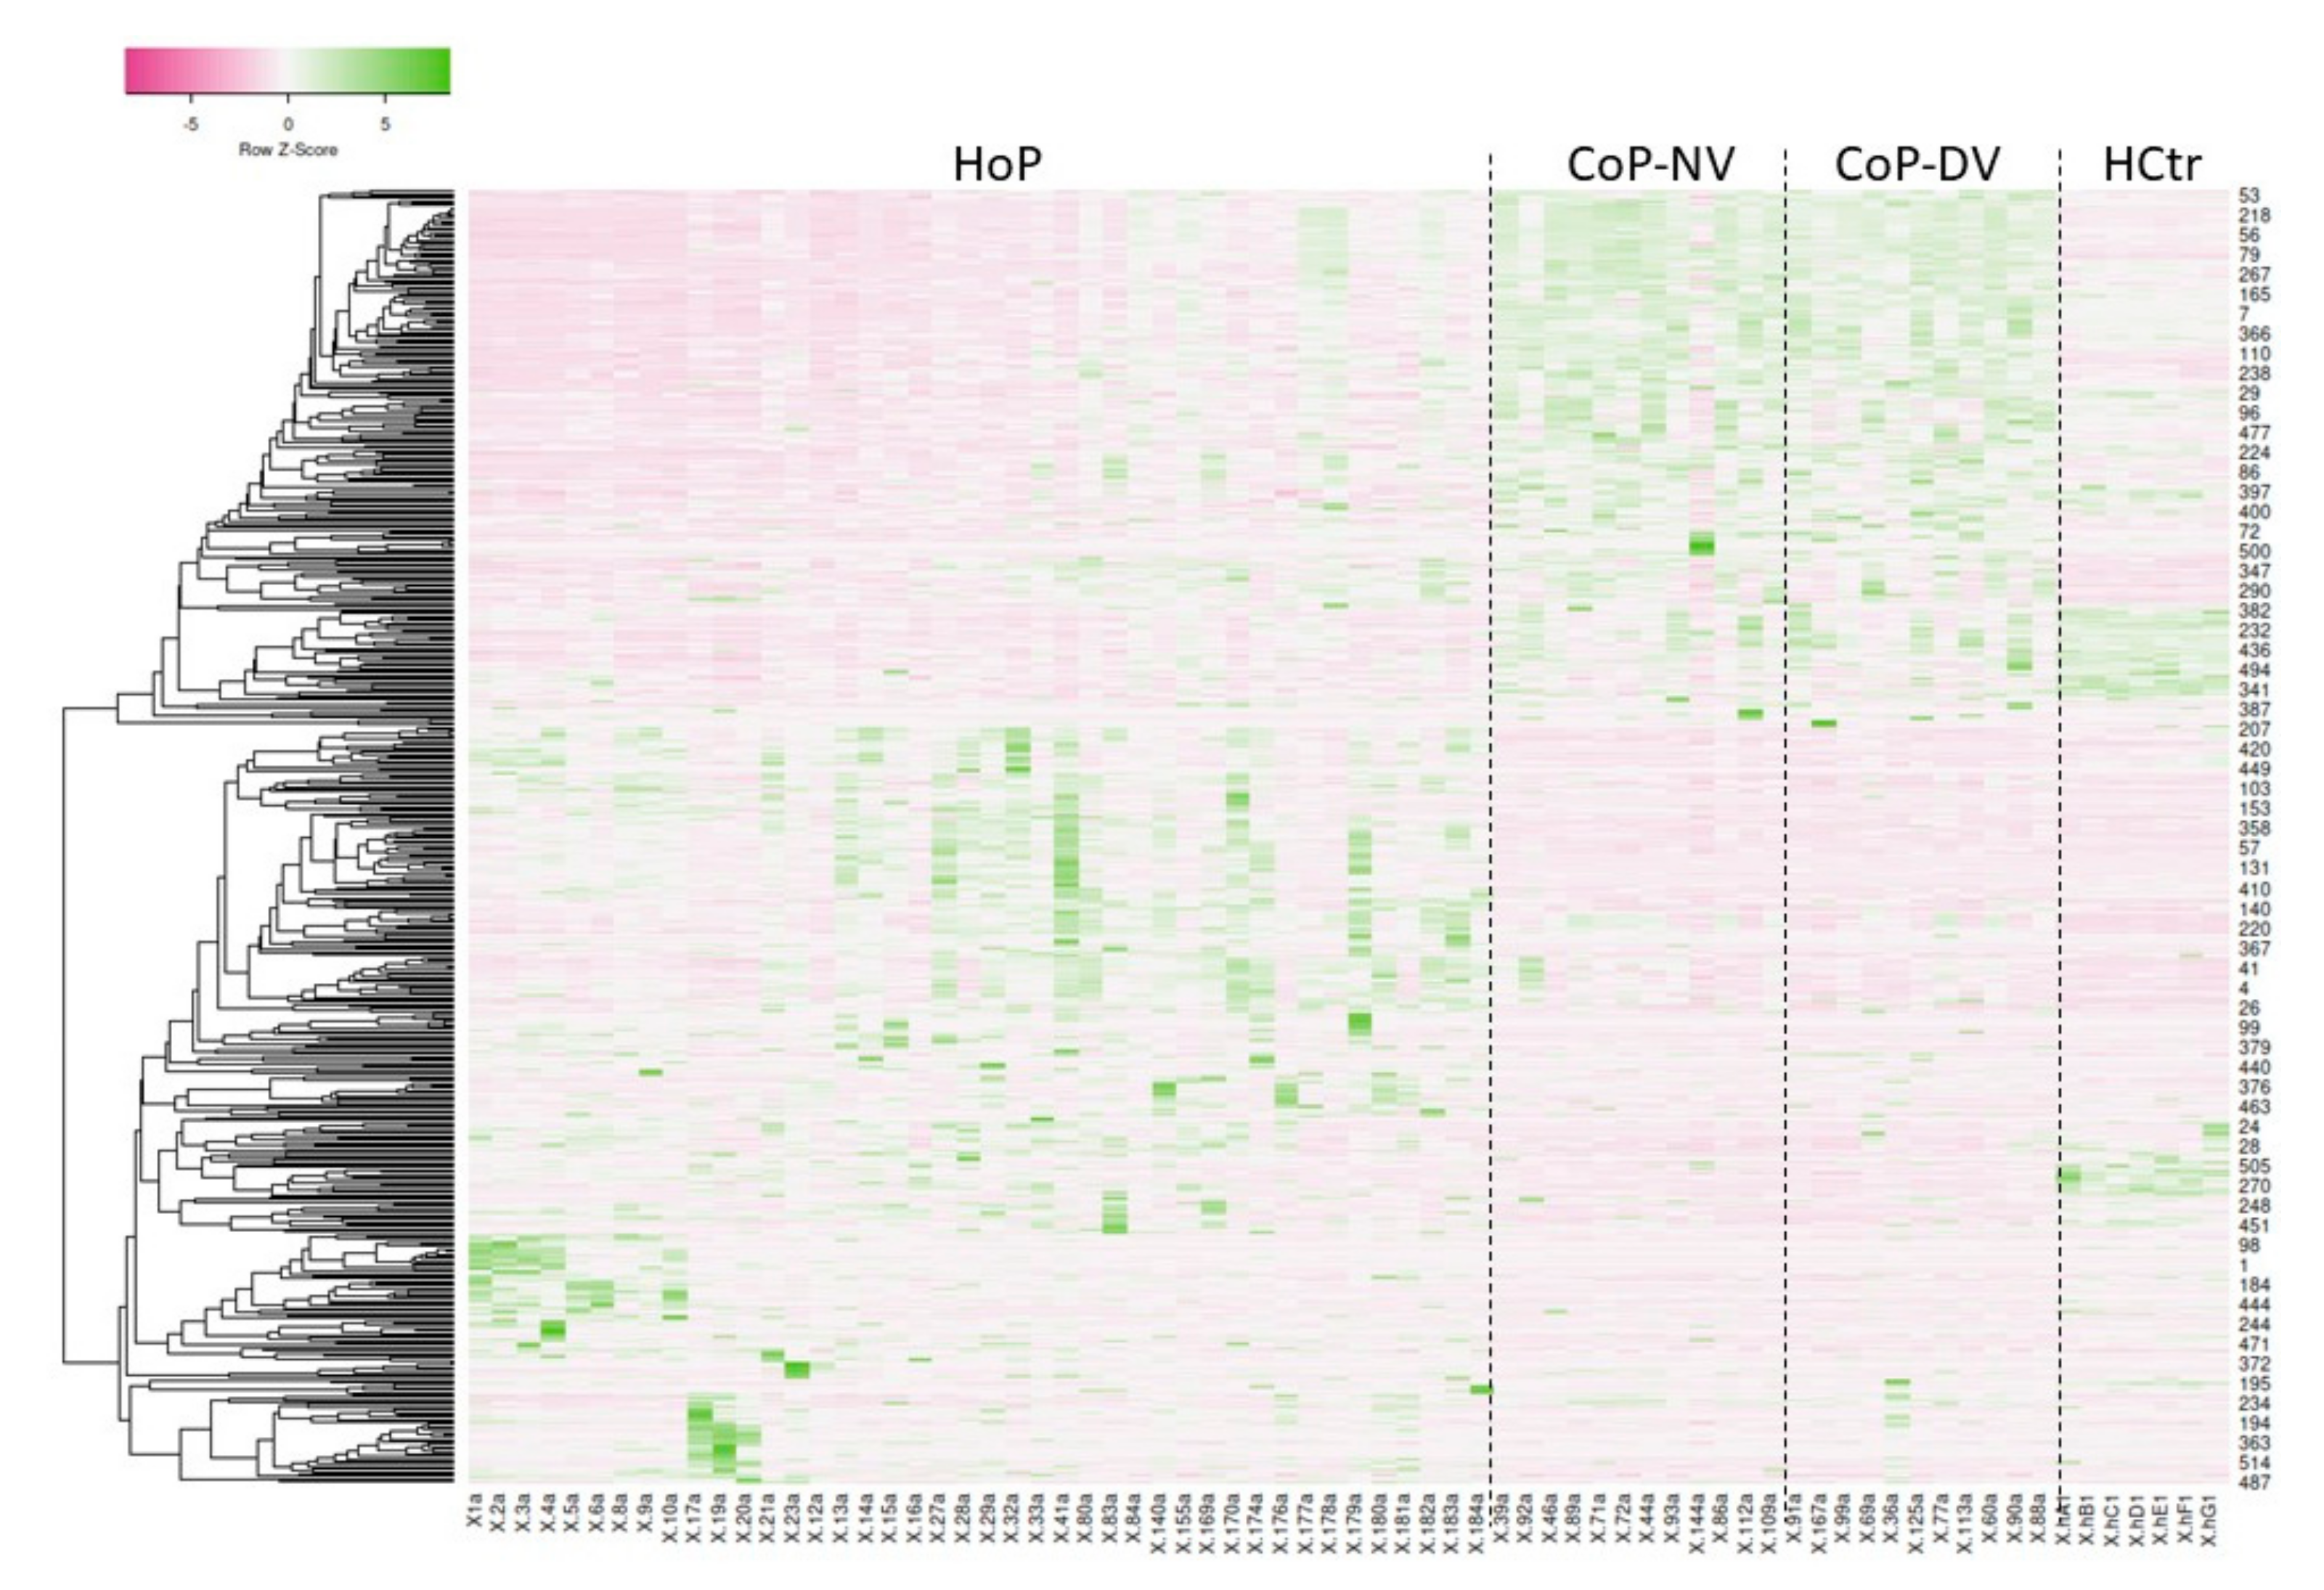
2.2. Serum Protein Expression
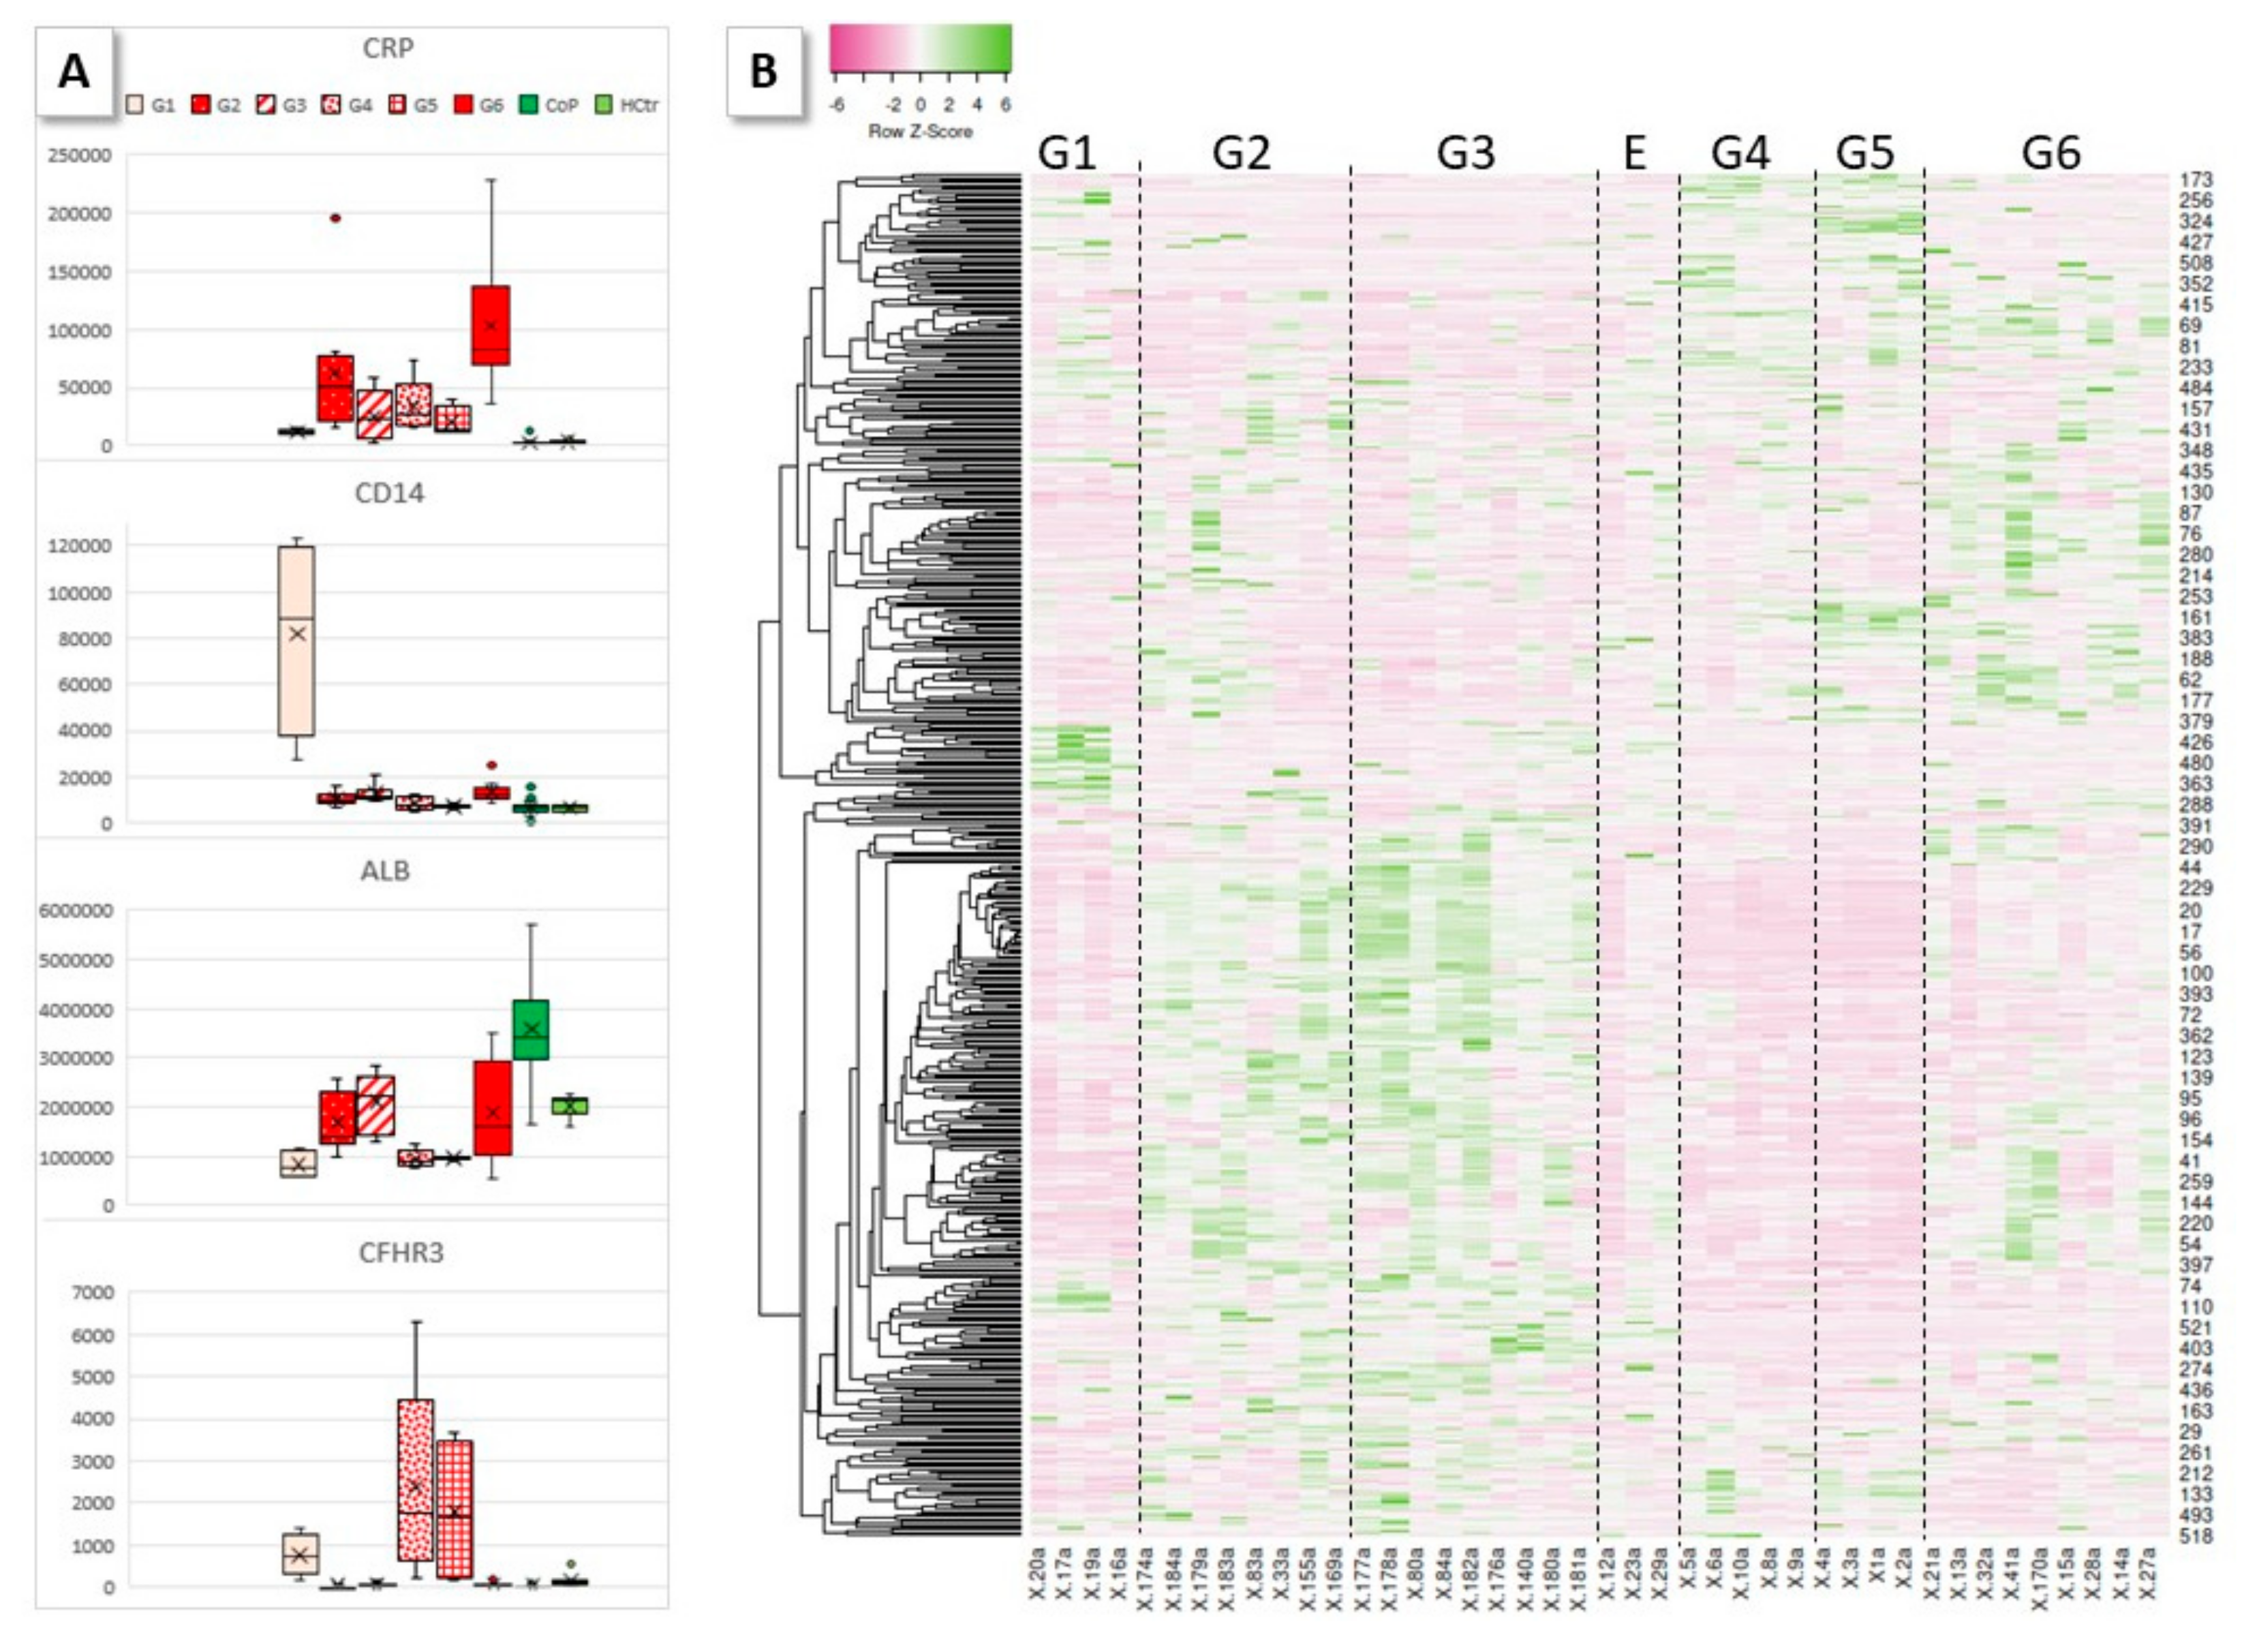
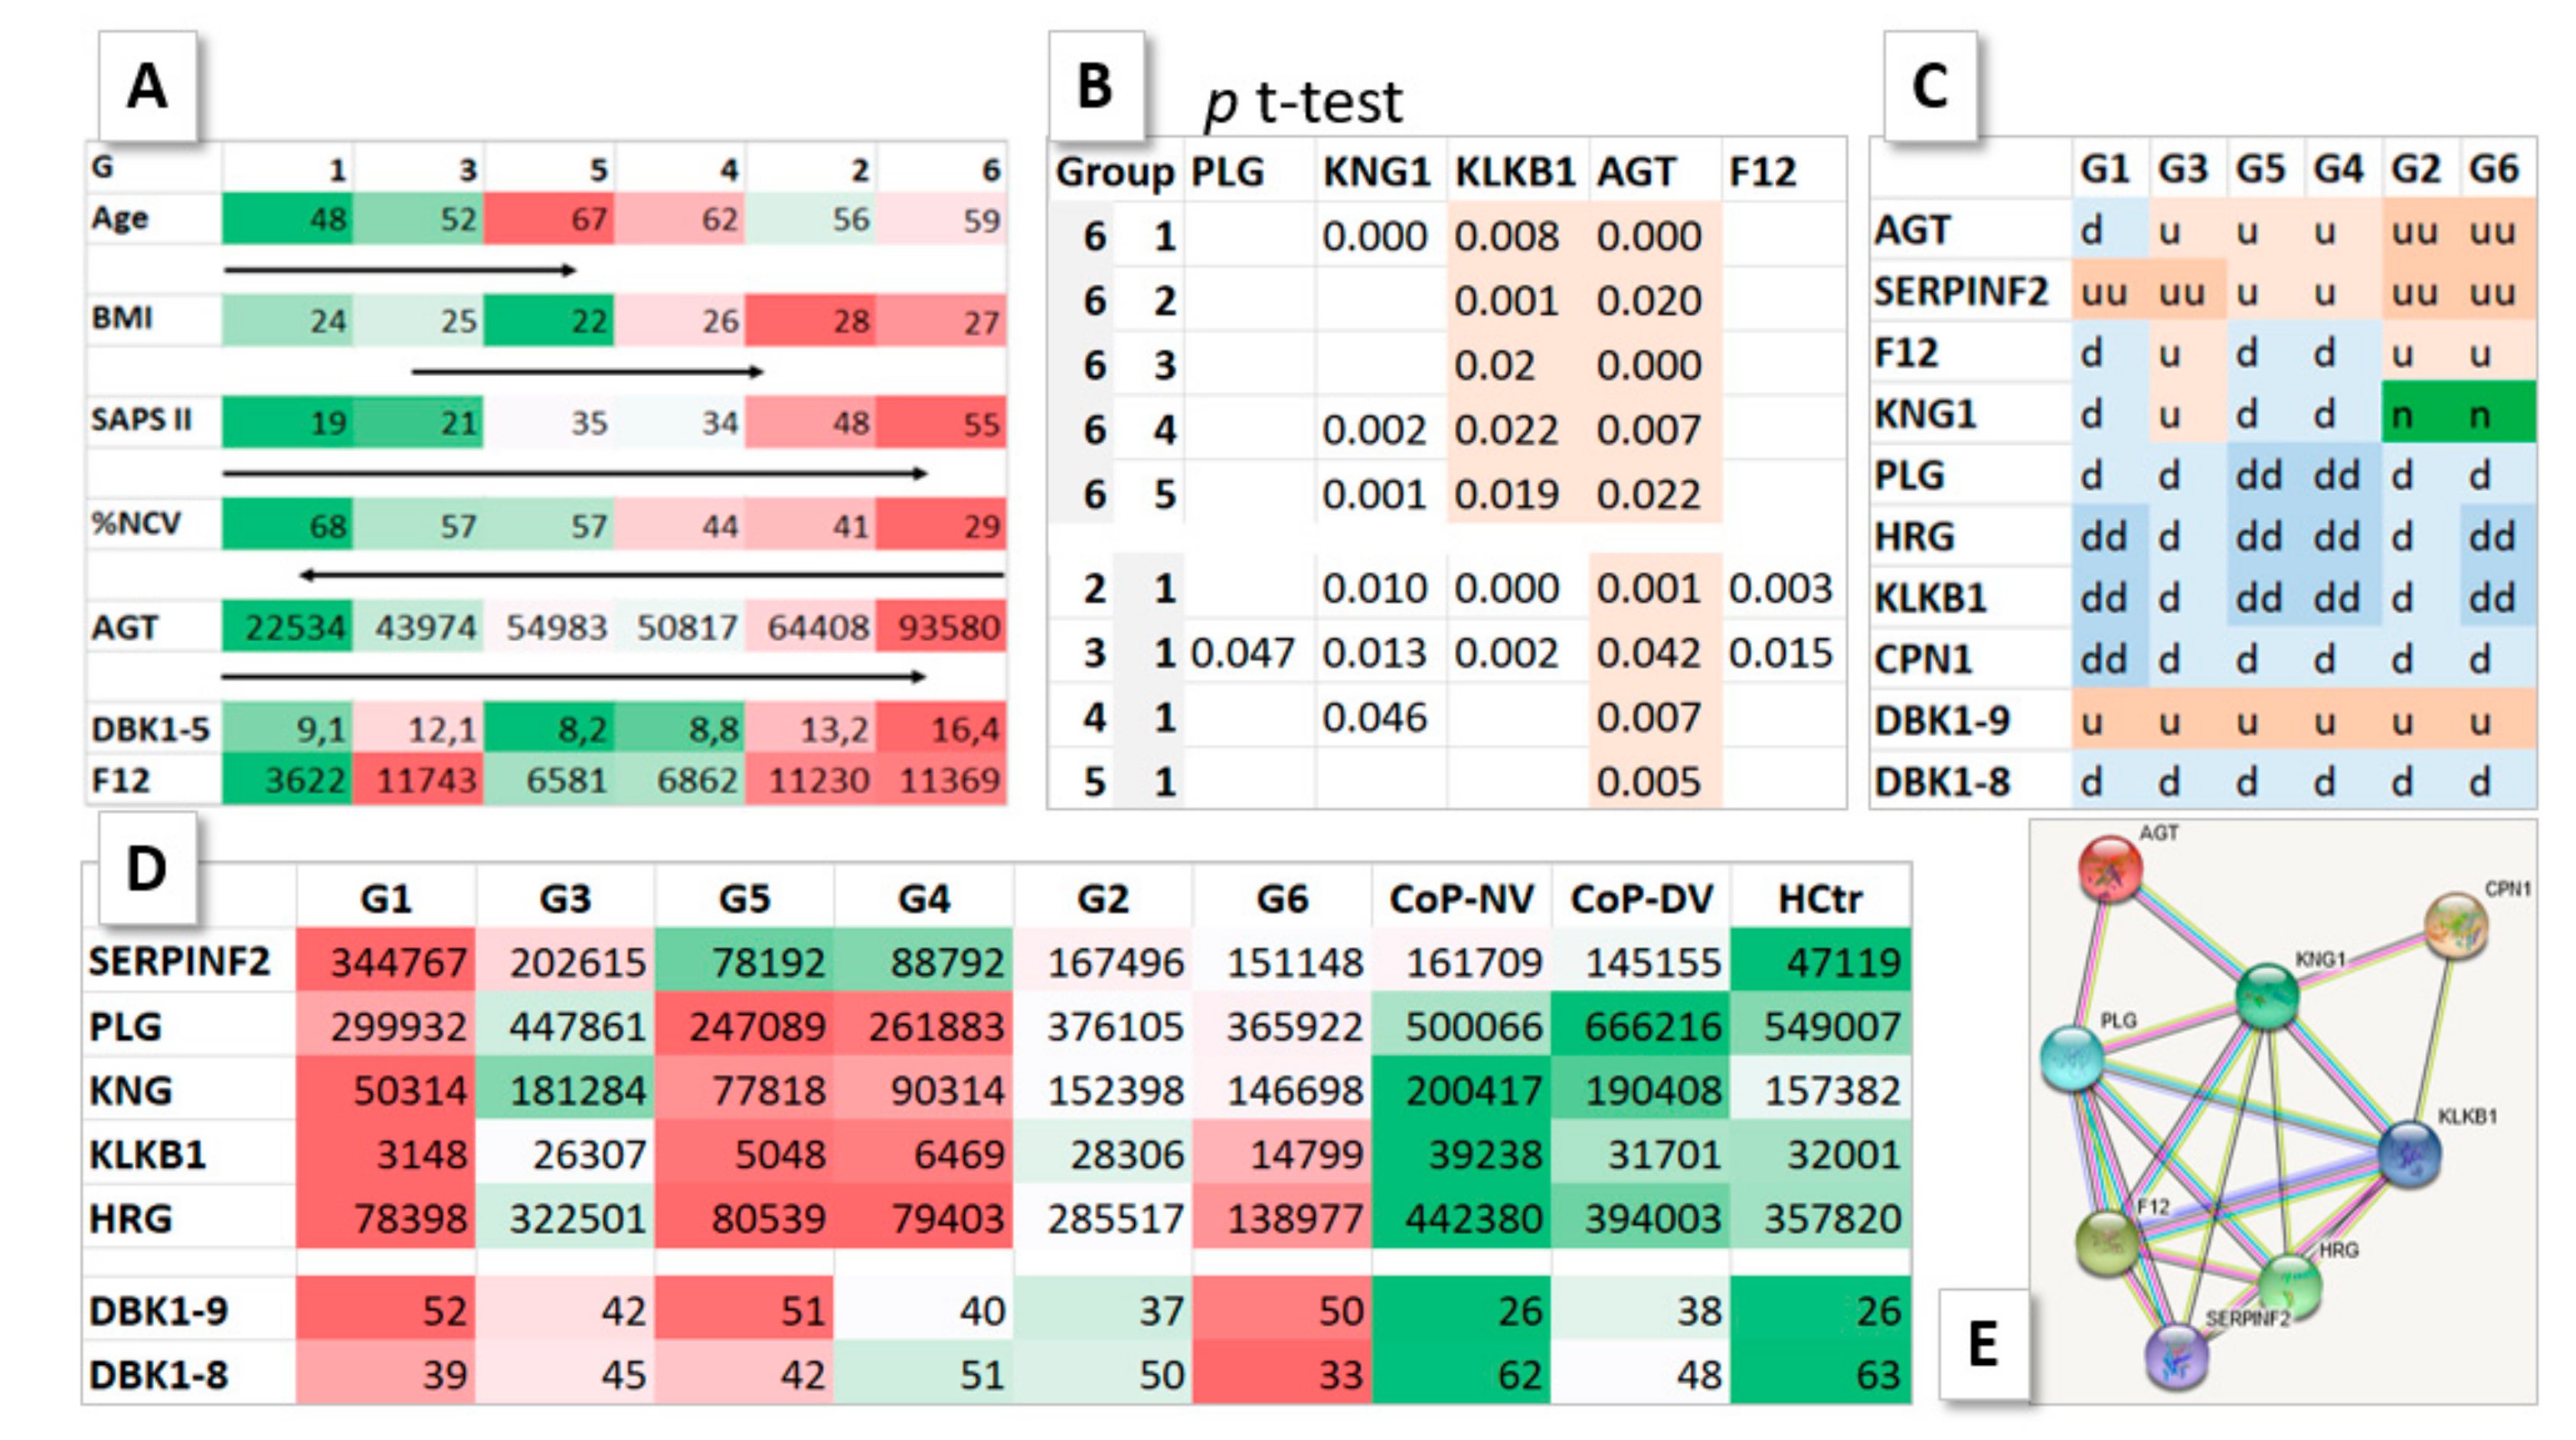
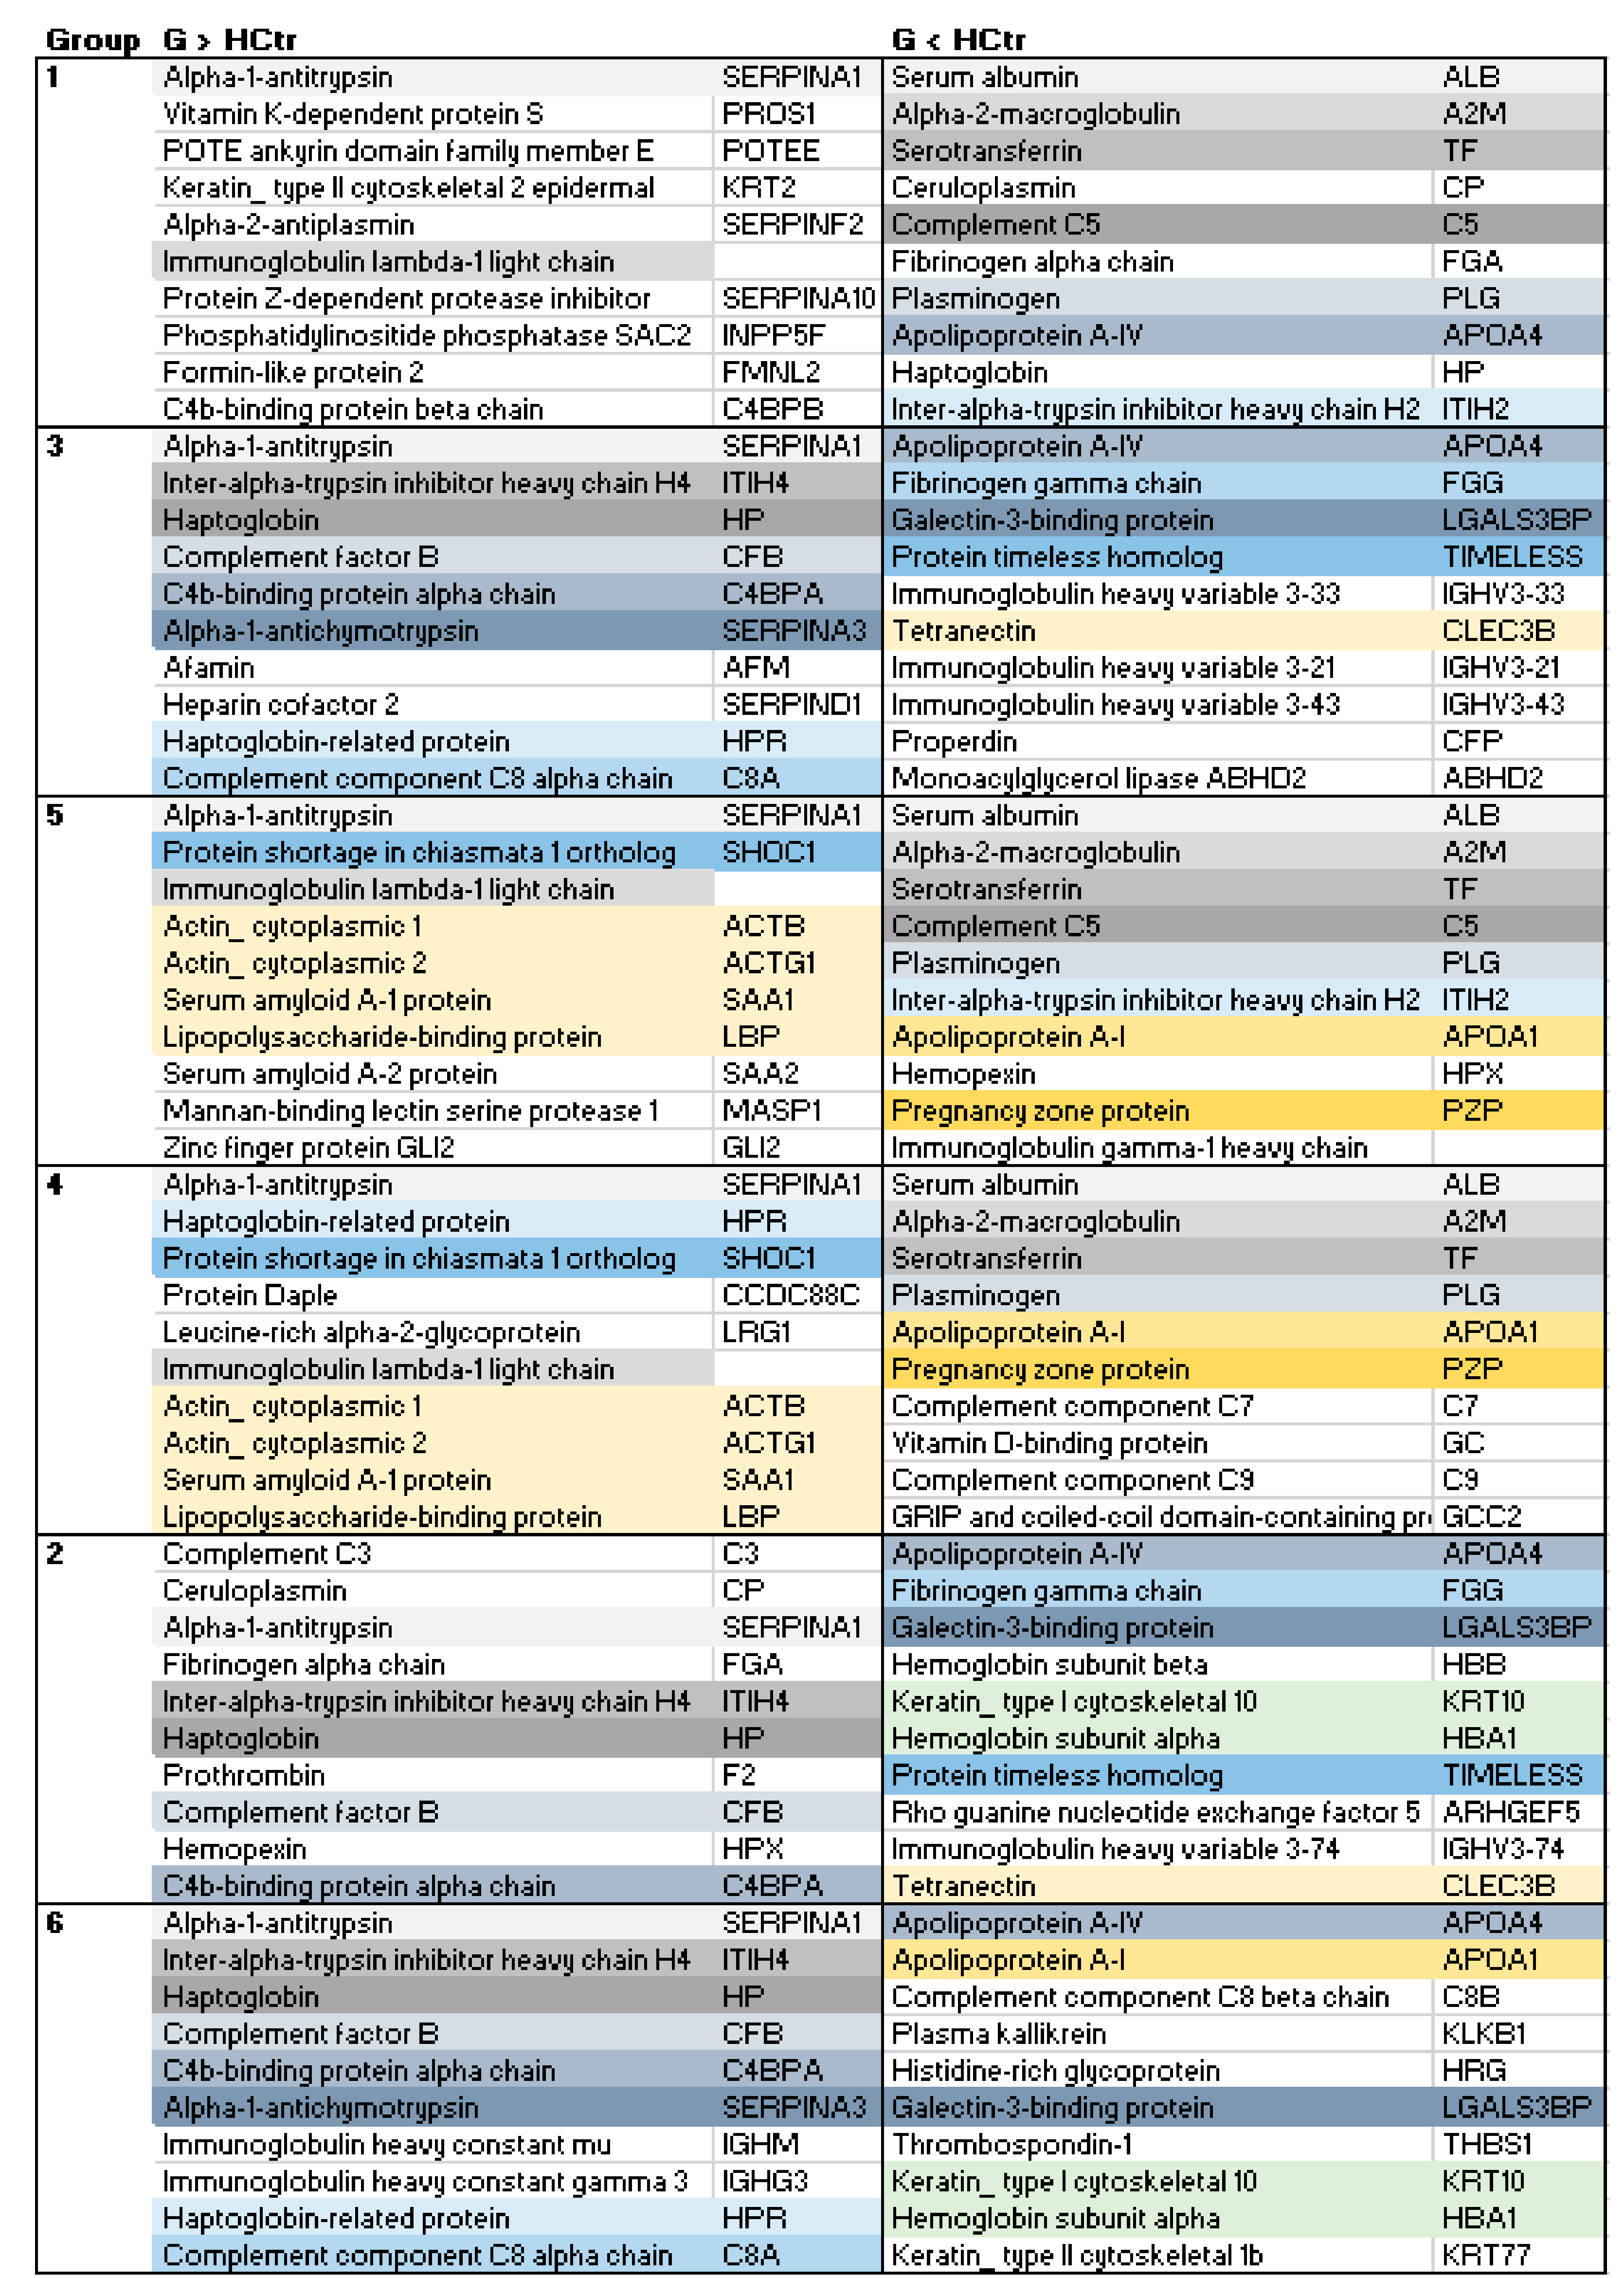
2.3. HoP Serum Protein Profile Groups
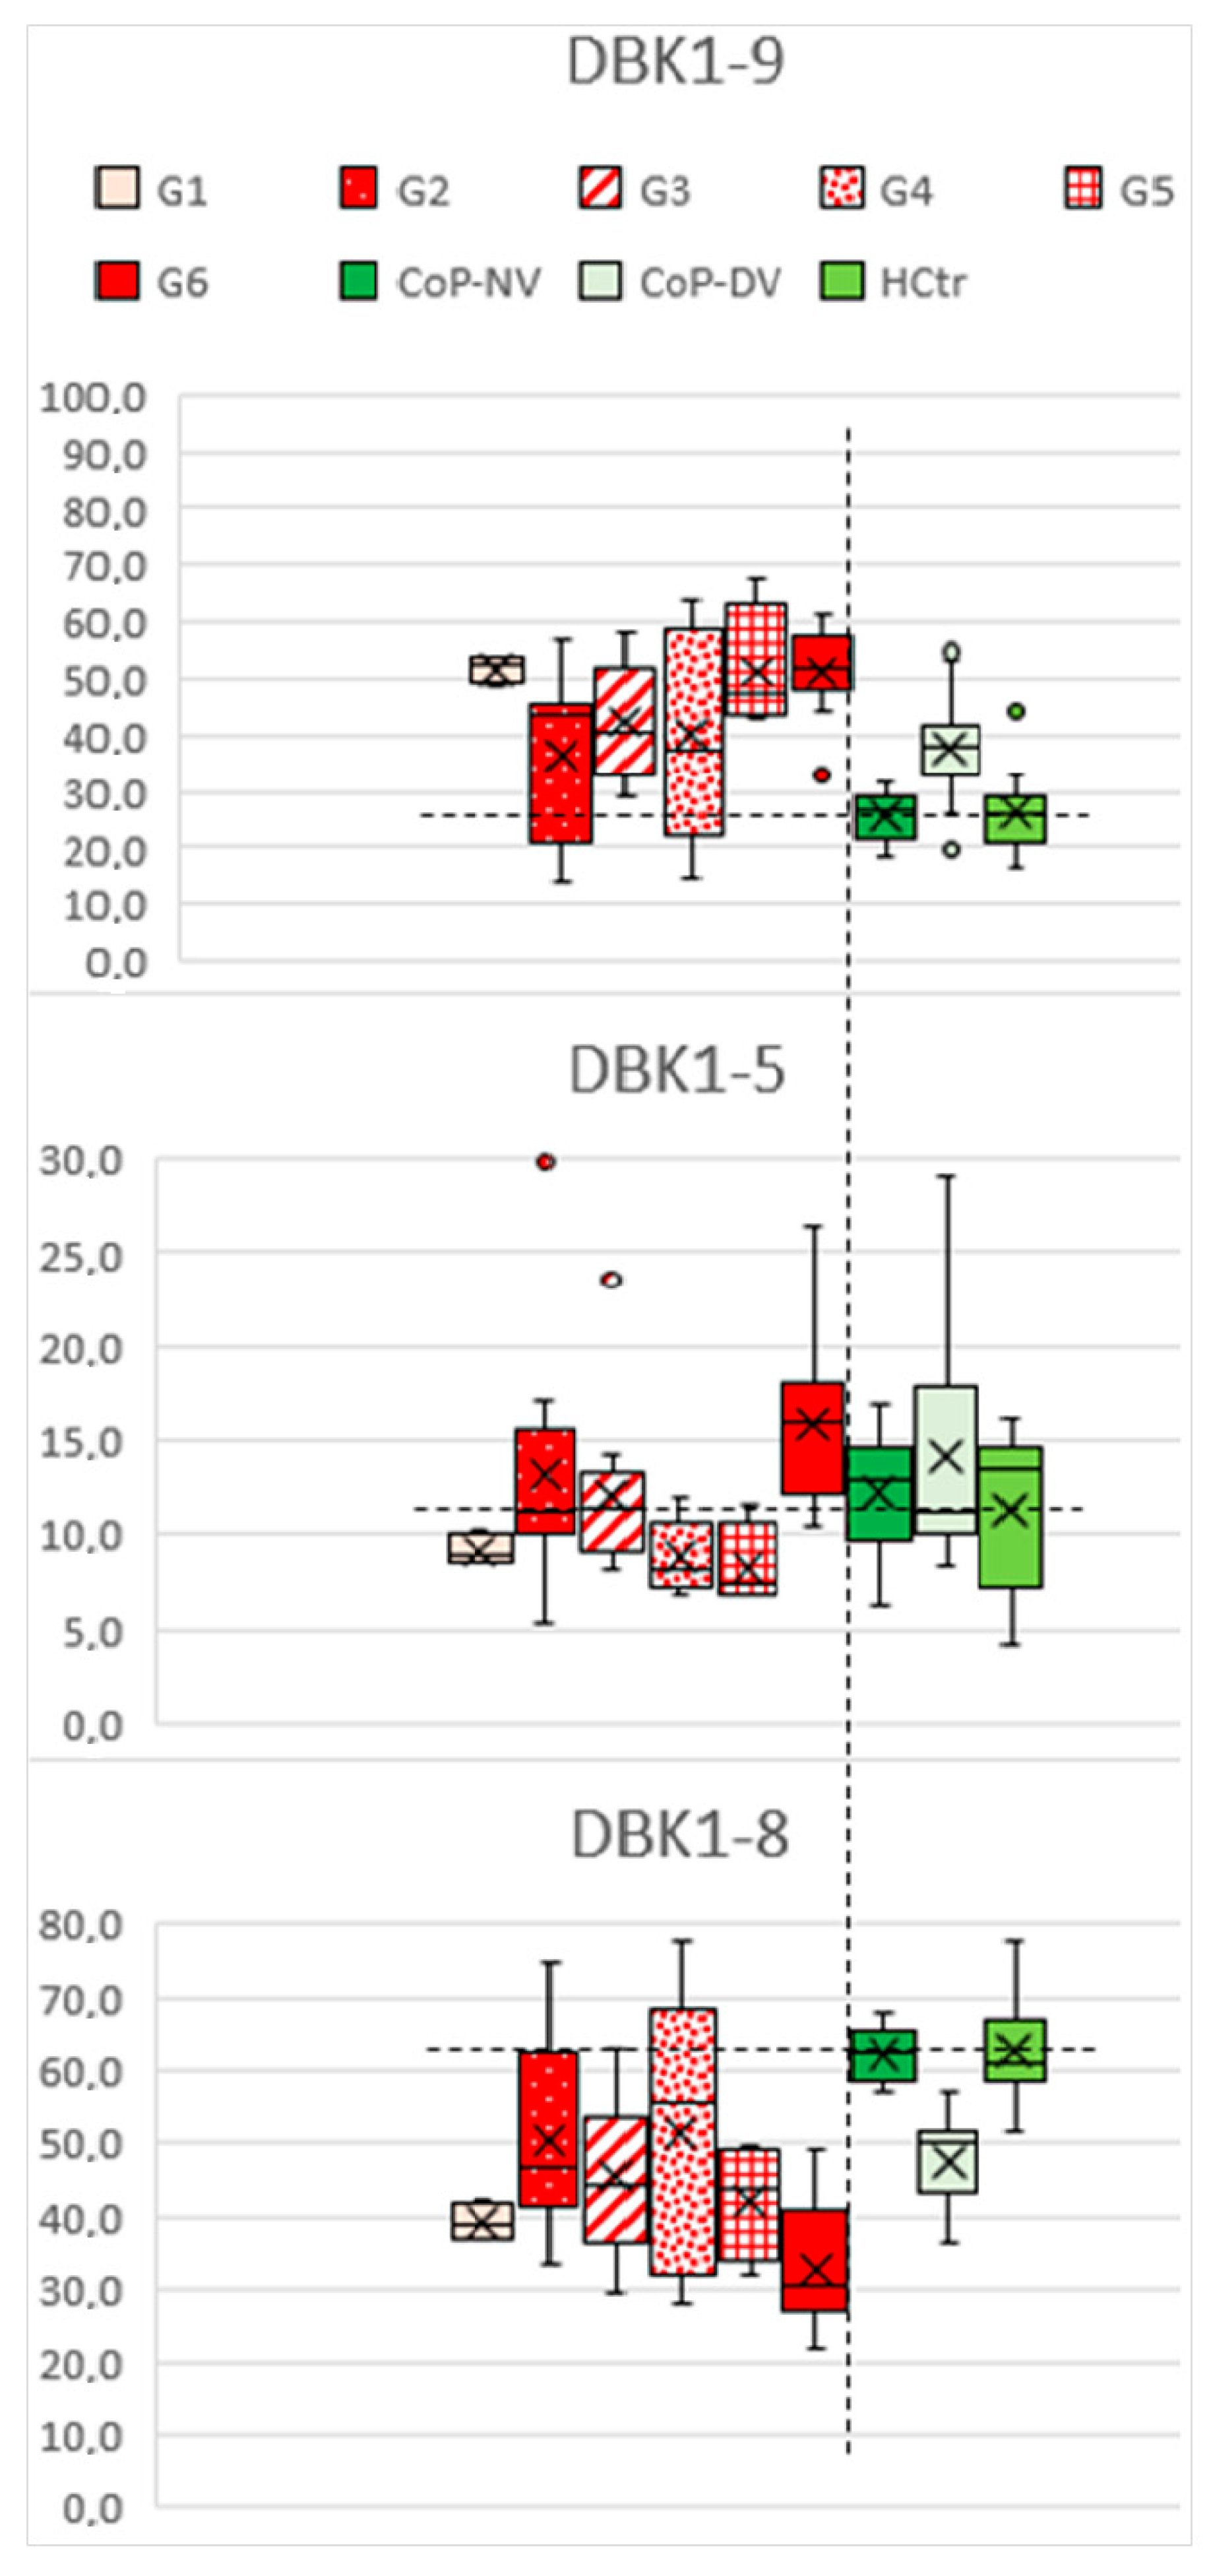
2.4. DBK Degradation and Protein Expression
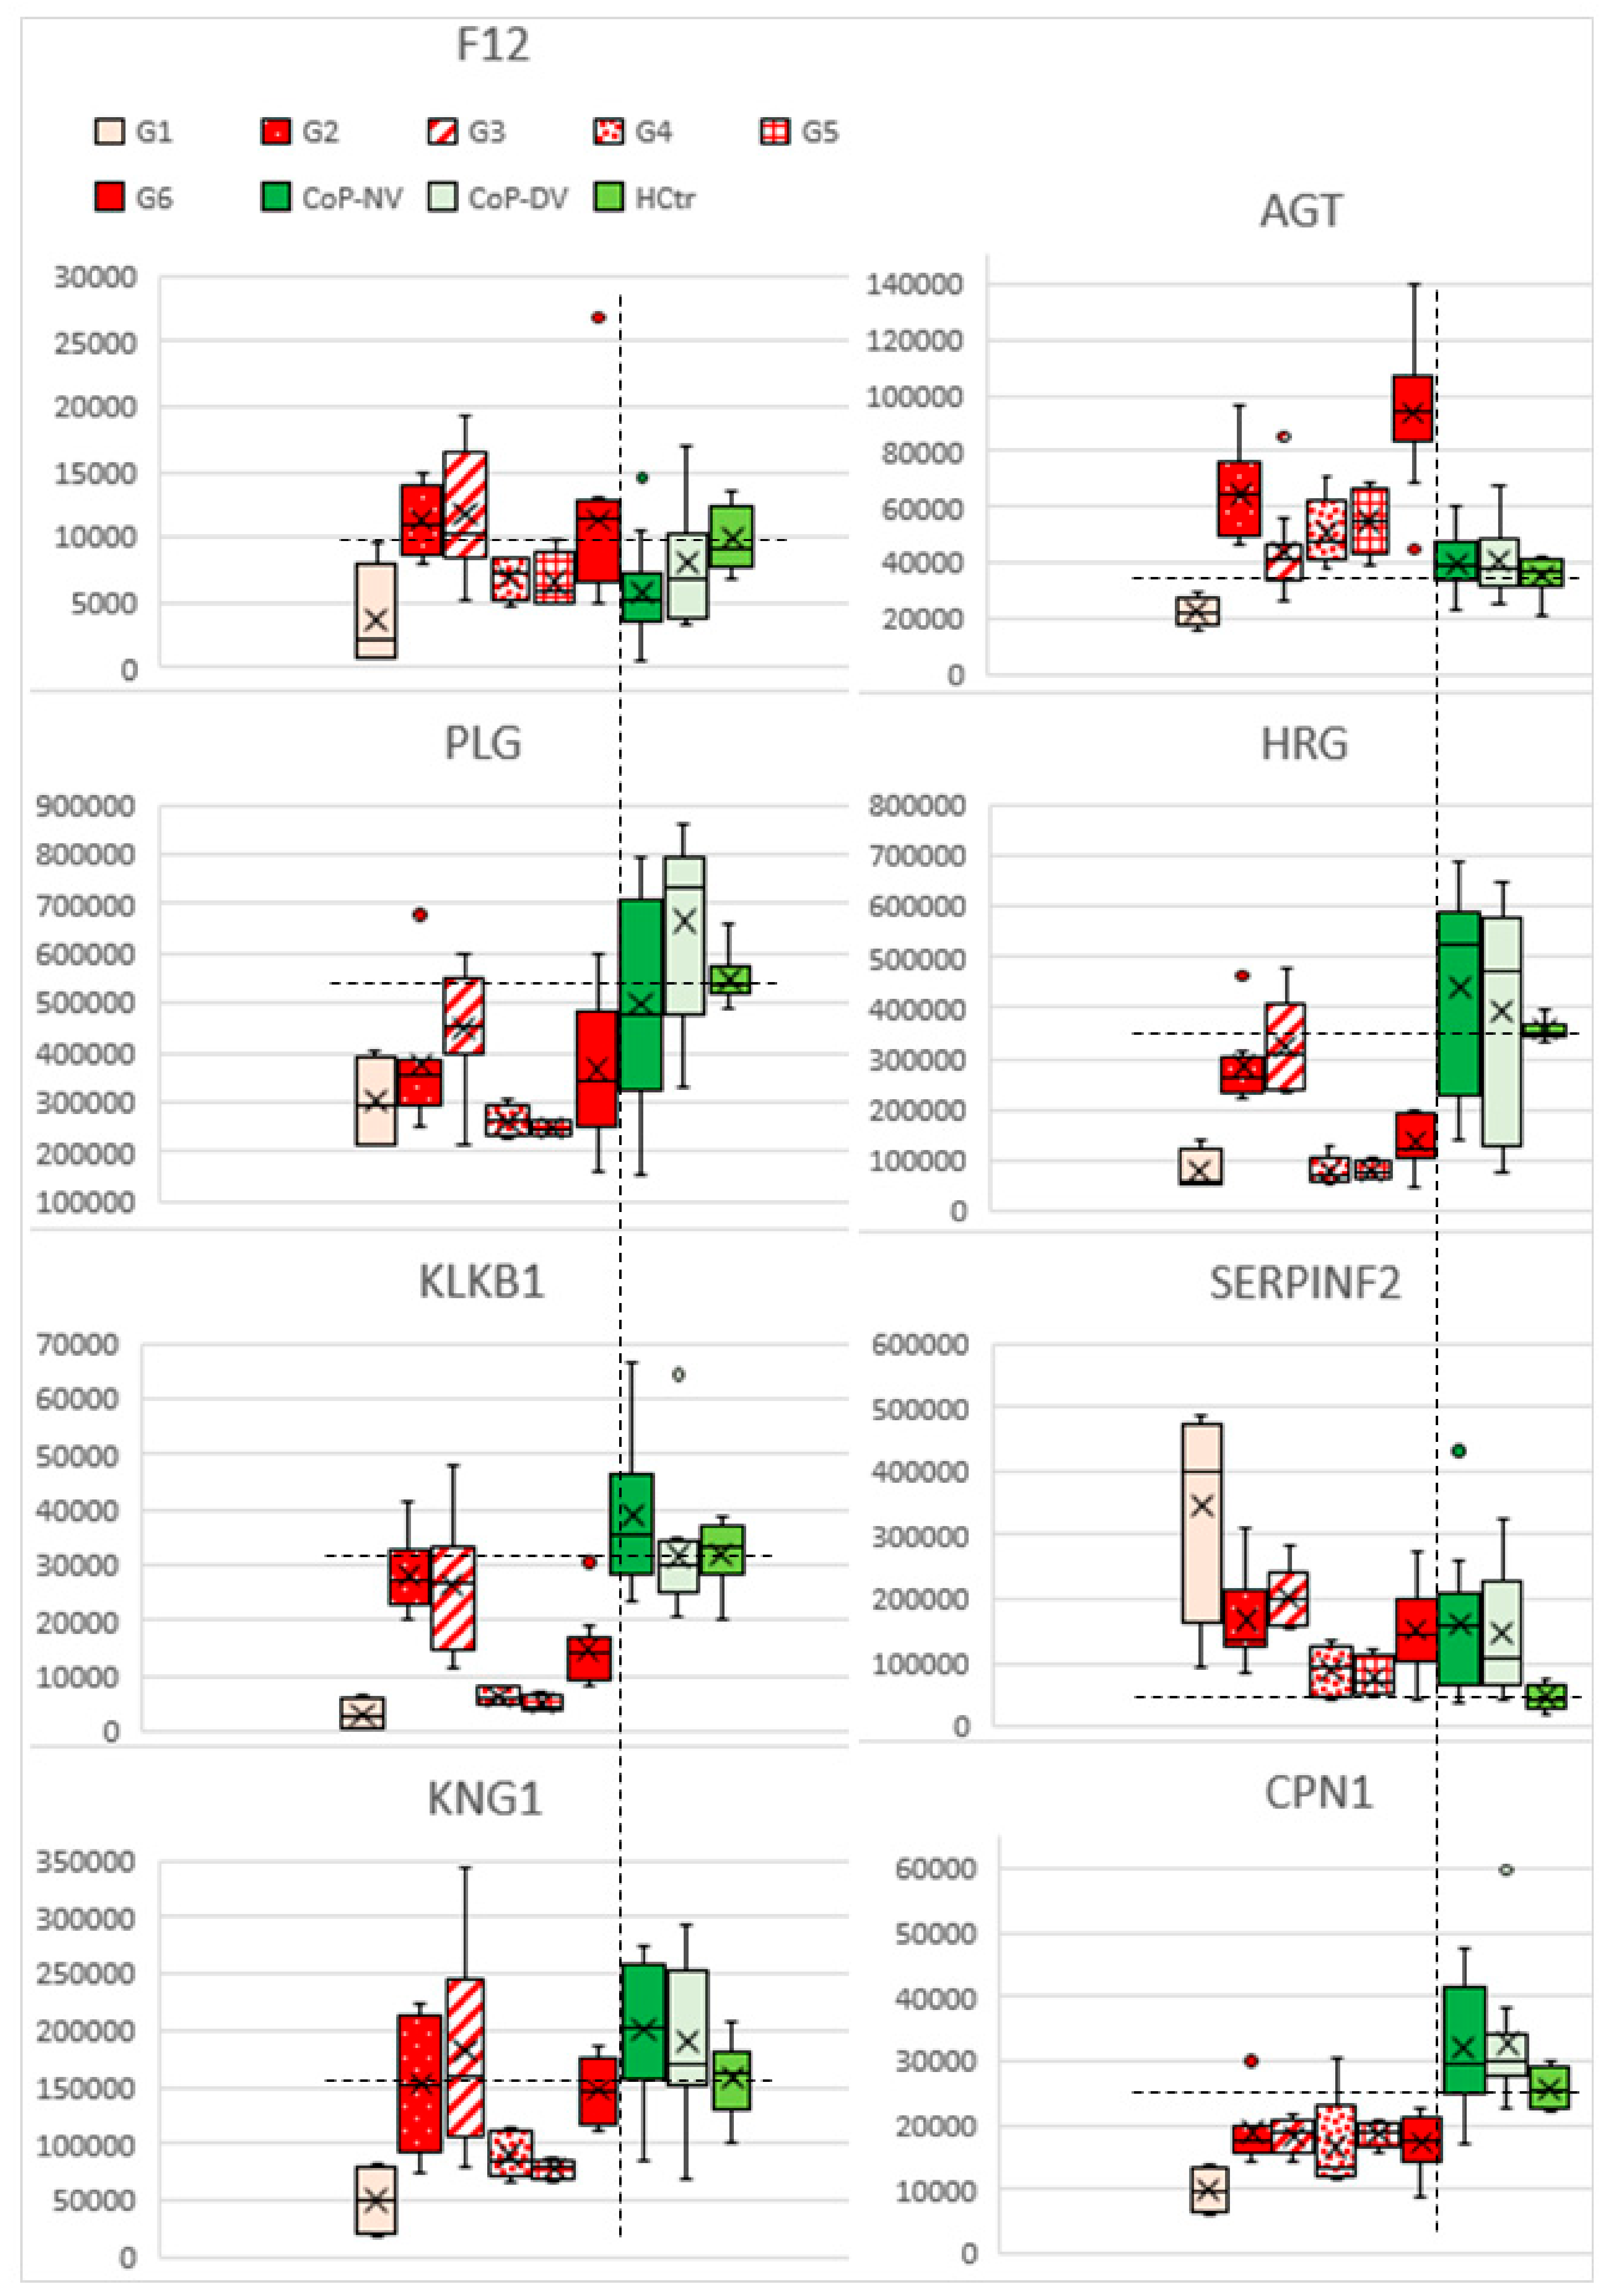
2.5. Profiles of Regulated Proteins
3. Discussion and Conclusions
4. Materials and Methods
4.1. Patients and Samples
4.2. Protein Isolation and Analysis
4.3. Data Analysis/Statistics
Supplementary Materials
Author Contributions
Funding
Institutional Review Board Statement
Informed Consent Statement
Data Availability Statement
Conflicts of Interest
Sample Availability
References
- Arnold, R.G. COVID-19—Does this disease kill due to imbalance of the renin angiotensin system (RAS) caused by genetic and gender differences in the response to viral ACE2 attack? Heart Lung Circ. 2020, 29, 964–972. [Google Scholar] [CrossRef] [PubMed]
- Tepasse, P.-R.; Vollenberg, R.; Steinebrey, N.; König, S. High angiotensin-converting enzyme and low carboxypeptidase N activity correlate with disease severity in COVID-19 patients. J. Pers. Med. 2022, 12, 406. [Google Scholar] [CrossRef] [PubMed]
- Anderson, N.L.; Anderson, N.G. The human plasma proteome: History, character, and diagnostic prospects. Mol. Cell. Proteom. 2002, 1, 845–867. [Google Scholar] [CrossRef] [PubMed] [Green Version]
- Ranieri, V.M.; Rubenfeld, G.D.; Thompson, B.T.; Ferguson, N.D.; Caldwell, E.; Fan, E.; Camporota, L.; Slutsky, A.S. Acute respiratory distress syndrome: The Berlin Definition. JAMA 2012, 307, 2526–2533. [Google Scholar] [PubMed]
- Lucena, J.F.; Alegre, F.; Martinez-Urbistondo, D.; Landecho, M.F.; Huerta, A.; Garcia-Mouriz, A.; Garcia, N.; Quiroga, J. Performance of SAPS II and SAPS 3 in intermediate care. PLoS ONE 2013, 8, e77229. [Google Scholar] [CrossRef] [PubMed]
- Pouwm, R.B.; Gómez Delgado, I.; López Lera, A.; Rodríguez de Córdoba, S.; Wouters, D.; Kuijpers, T.W.; Sánchez-Corral, P. High complement factor H-related (FHR)-3 levels are associated with the atypical hemolytic-uremic syndrome-risk allele CFHR3*B. Front. Immunol. 2018, 9, 848. [Google Scholar]
- Lee, B.; Kwak, S.; Shin, J.; Lee, S.H.; Choi, H.J.; Kang, H.G.; Ha, I.S.; Lee, J.S.; Dragon-Durey, M.; Choi, Y.; et al. Atypical hemolytic uremic syndrome associated with complement factor H autoantibodies and CFHR1/CFHR3 deficiency. Pediatr. Res. 2009, 66, 336–340. [Google Scholar] [CrossRef] [PubMed] [Green Version]
- Silverstein, R.L.; Leung, L.L.; Harpel, P.C.; Nachman, R.L. Platelet thrombospondin forms a trimolecular complex with plasminogen and histidine-rich glycoprotein. J. Clin. Investig. 1985, 75, 2065–2073. [Google Scholar] [CrossRef] [PubMed]
- Dahlbäck, B. Vitamin K-dependent protein S: Beyond the protein C pathway. Semin. Thromb. Hemost. 2018, 44, 176–184. [Google Scholar] [CrossRef] [PubMed]
- Algassim, A.A.; Elghazaly, A.A.; Alnahdi, A.S.; Mohammed-Rahim, O.M.; Alanazi, A.G.; Aldhuwayhi, N.A.; Alanazi, M.M.; Almutairi, M.F.; Aldeailej, I.M.; Kamli, N.A.; et al. Prognostic significance of hemoglobin level and autoimmune hemolytic anemia in SARS-CoV-2 infection. Ann. Hematol. 2021, 100, 37–43. [Google Scholar] [CrossRef] [PubMed]
- Kronstein-Wiedemann, R.; Stadtmüller, M.; Traikov, S.; Georgi, M.; Teichert, M.; Yosef, H.; Wallenborn, J.; Karl, A.; Schütze, K.; Wagner, M.; et al. SARS-CoV-2 Infects red blood cell progenitors and dysregulates hemoglobin and iron metabolism. Stem Cell Rev. Rep. Ahead of print. 1–13. [CrossRef] [PubMed]
- Juárez-Vela, R.; Andrés-Esteban, E.M.; Gea-Caballero, V.; Sánchez-González, J.L.; Marcos-Neira, P.; Serrano-Lázaro, A.; Tirado-Anglés, G.; Ruiz-Rodríguez, J.C.; Durante, Á.; Santolalla-Arnedo, I.; et al. Related factors of anemia in critically ill patients: A prospective multicenter study. J. Clin. Med. 2022, 11, 1031. [Google Scholar] [CrossRef] [PubMed]
- Mi, H.; Ebert, D.; Muruganujan, A.; Mills, C.; Albou, L.-P.; Mushayamaha, T.; Thomas, P.D. PANTHER version 16: A revised family classification, tree-based classification tool, enhancer regions and extensive API. Nucl. Acids Res. 2021, 49, D394–D403. [Google Scholar] [CrossRef] [PubMed]
- Dieplinger, H.; Dieplinger, B. Afamin—A pleiotropic glycoprotein involved in various disease states. Clin. Chim. Acta 2015, 446, 105–110. [Google Scholar] [CrossRef] [PubMed] [Green Version]
- Nielsen, M.J.; Petersen, S.V.; Jacobsen, C.; Oxvig, C.; Rees, D.; Møller, H.J.; Moestrup, S.K. Haptoglobin-related protein is a high-affinity hemoglobin-binding plasma protein. Blood 2006, 108, 2846–2849. [Google Scholar] [CrossRef] [PubMed] [Green Version]
- Silva, S.D., Jr.; Zampieri, T.T.; Ruggeri, A.; Ceroni, A.; Aragão, D.S.; Fernandes, F.B.; Casarini, D.E.; Michelini, L.C. Downregulation of the vascular renin-angiotensin system by aerobic training—Focus on the balance between vasoconstrictor and vasodilator axes. Circ. J. 2015, 79, 1372–1380. [Google Scholar] [CrossRef] [PubMed] [Green Version]
- König, S.; Steinebrey, N.; Herrnberger, M.; Escolano-Lozano, F.; Schlereth, T.; Rebhorn, C.; Birklein, F. Reduced serum protease activity in Complex Regional Pain Syndrome: The impact of angiotensin-converting enzyme and carboxypeptidases. J. Pharmac. Biomed. Anal. 2021, 205, 114307. [Google Scholar] [CrossRef] [PubMed]
- Distler, U.; Kuharev, J.; Navarro, P.; Tenzer, S. Label-free quantification in ion mobility-enhanced data-independent acquisition proteomics. Nat. Prot. 2016, 11, 795–812. [Google Scholar] [CrossRef] [PubMed]
- Babicki, S.; Arndt, D.; Marcu, A.; Liang, Y.; Grant, J.R.; Maciejewski, A.; Wishart, D.S. Heatmapper: Web-enabled heat mapping for all. Nucleic Acids Res. 2016, 44, W147–W153. [Google Scholar] [CrossRef] [PubMed]
- Zhou, G.; Soufan, O.; Ewald, J.; Hancock, R.E.W.; Basu, N.; Xia, J. NetworkAnalyst 3.0: A visual analytics platform for comprehensive gene expression profiling and meta-analysis. Nucleic Acids Res. 2019, 47, W234–W241. [Google Scholar] [CrossRef] [PubMed] [Green Version]


| G1 | G3 | G5 | G4 | G2 | G6 | |
|---|---|---|---|---|---|---|
| Age < 55 | x | x | ||||
| BMI > 25 | x | x | x | |||
| Condition | M S | M S C | M S | M S C | M S C | C |
| SAPS II | 19 | 21 | 35 | 34 | 48 | 55 |
| AGT d | x | |||||
| F12 u | x | x | x | |||
| KNG1 u | x | |||||
| OK | 12 clin. val. | CK-MB | Bil, TSH, GPT | Bil, TSH, Leu | CK |
Publisher’s Note: MDPI stays neutral with regard to jurisdictional claims in published maps and institutional affiliations. |
© 2022 by the authors. Licensee MDPI, Basel, Switzerland. This article is an open access article distributed under the terms and conditions of the Creative Commons Attribution (CC BY) license (https://creativecommons.org/licenses/by/4.0/).
Share and Cite
Tepasse, P.-R.; Vollenberg, R.; Steinebrey, N.; König, S. The Dysregulation of the Renin–Angiotensin System in COVID-19 Studied by Serum Proteomics: Angiotensinogen Increases with Disease Severity. Molecules 2022, 27, 2495. https://doi.org/10.3390/molecules27082495
Tepasse P-R, Vollenberg R, Steinebrey N, König S. The Dysregulation of the Renin–Angiotensin System in COVID-19 Studied by Serum Proteomics: Angiotensinogen Increases with Disease Severity. Molecules. 2022; 27(8):2495. https://doi.org/10.3390/molecules27082495
Chicago/Turabian StyleTepasse, Phil-Robin, Richard Vollenberg, Nico Steinebrey, and Simone König. 2022. "The Dysregulation of the Renin–Angiotensin System in COVID-19 Studied by Serum Proteomics: Angiotensinogen Increases with Disease Severity" Molecules 27, no. 8: 2495. https://doi.org/10.3390/molecules27082495