
Toward Understanding the Variation of Air Quality Based on a Comprehensive Analysis in Hebei Province under the Influence of COVID-19 Lockdown


State Key Laboratory of Earth Surface Processes and Resource Ecology, College of Global Change and Earth System Science, Beijing Normal University, Beijing 100875, China
*
Author to whom correspondence should be addressed.
Atmosphere 2021, 12(2), 267; https://doi.org/10.3390/atmos12020267
Submission received: 30 December 2020
/
Revised: 2 February 2021
/
Accepted: 11 February 2021
/
Published: 17 February 2021
(This article belongs to the Special Issue The Impact of Atmospheric Aerosol Perturbations on Aerosol-Cloud Interactions and Climate Forcing during the COVID-19 Outbreak)
Abstract
:Associated with the outbreak of new coronavirus in 2019 (COVID-19), lockdown measures were taken in spring 2020 in China, providing an ideal experiment to investigate the effects of emission controls on air quality. Using the observation data at 56 stations in Hebei province from the China National Environmental Monitoring Center from January 2019 to May 2020, along with the reanalysis meteorology data from ERA5, this study investigates the spatial and temporal variations of six air pollutants, and the clean and pollution events in COVID-19 period. Compared with the same periods in day and month in 2019 (SP19), the concentrations of sulfur dioxide (SO2), nitrogen dioxide (NO2), particulate matter with an aerodynamic diameter of less than 10 μm (PM10), particulate matter with an aerodynamic diameter of less than 2.5 μm (PM2.5), and carbon monoxide (CO) decreased by 39.2%, 38.2%, 42.1%, 39.8%, and 24.8% for lockdown period, respectively; and decreased by 13.7%, 8.9%, 16.8%, 13.4%, and 10.6% for post-lockdown period, respectively. In contrast, ozone (O3) increased by 8.0% and 5.5% for lockdown and post-lockdown periods, respectively. The diurnal variation analysis shows that the air pollutants other than O3 decrease more in the morning time (6:00–10:00 local time) than in the afternoon time (14:00–18:00 local time) during both lockdown and post-lockdown periods compared to SP19, implying the potential contribution from pollution-meteorology interaction. After lockdown period, SO2 and NO2 resumed quickly in most cities other than in Zhangjiakou, which is a city with few industries making it more sensitive to meteorology. The significant improvement of air quality during the lockdown period suggests that the whole air quality is highly dependent on the pollutant emissions, while the relatively weak reduction of pollution events imply that the pollution events are more dependent on adverse weather conditions.
1. Introduction
After Wuhan as the first city put on lockdown on 23 January 2020 to prevent the spread of the new coronavirus in 2019 (COVID-19), almost all Chinese cities launched lockdown measures starting from different dates [1]. These measures have put the society of China on hold, significantly reducing emissions of air pollutants [2,3,4]. The lockdown period provides us an ideal experiment to examine the effects of emission controls on air quality. The resultant dramatic changes in the atmospheric environments have been of great concern to researchers [5,6].
Air pollutants can affect human health by entering the human body and harming human tissues and organs [7,8]. A large number of studies have found the correlation between air pollutants and infected persons by epidemic [9,10,11,12,13]. Thus, it is necessary for us to understand the characteristics, formation, and evolution of air pollutants, along with the mechanism behind. Many previous studies have investigated the formations, characteristics, and sources of air pollutants [14,15,16,17,18,19], but the challenges to untangle the effects of emissions, meteorology and topography make the science community still lack sufficient understanding about the formation and development of air pollution. In addition, the air pollutants could be removed from the atmosphere by dry and wet depositions [20,21,22], and get dispersed by increased winds and planetary boundary layer heights [14]. The lockdown measures during the COVID-19 period provide us an opportunity to investigate the potential effects of emission reduction on air quality, along with the effects of meteorology on air pollution events.
Many studies have shown that the changes of air pollutants are different for periods before, during and after the outbreak [e.g., 23,24,25], and the changes of pollutants are also diverse in different stages of lockdown periods [26]. Globally, as summarized by Lee et al. [27], there are a consensus about the significant impacts of COVID-19 lockdown on air quality, while with different magnitudes of changes around the word. Particularly, almost all studies showed significant decrease in NO2 during the lockdown time period, with decreasing amount of 42% in UK [27], 50% in Spain [28], 46% in Rome, 30% in Turin, 63% in Nice [29], 54% in New Delhi [30], 24–33% in Rio de Janeiro, Brazil, 54% in Sao Paulo [31], 21% in the whole of China [32], and 53% in Northern China [33]. There are also short time period studies, which show even larger reduction of NO2 [34]. In contrast, almost all studies also found increases of O3 during the COVID-19 lockdown period, which was largely attributed to the reduction in NO emissions [27]. Note that these studies have taken use of different observations with various analysis methods over different locations. In China, previous studies have used satellite and ground-based remote sensing observations to study the changes of air pollutant concentration during lockdown period in Yangtze River Delta, East China, Hubei, Guangzhou, and other cities. These studies found that air pollutants other than ozone (O3) decreased significantly during lockdown period and showed an increasing trend after reopening over most regions in China, particularly for NO2 [35,36,37].
Almost all studies about the air quality during the COVID-19 lockdown period have shown that air quality has improved. However, few studies have investigated the relative changes of the air pollutant variables at different time (such as morning and afternoon) and the variations of pollution events during the COVID-19 lockdown period. In this study, using the air quality observation data at 56 monitoring stations in Hebei Province from January 2019 to May 2020 and the meteorology reanalysis data of ERA5, we make a comprehensive analysis about the spatial and temporal variations of six air pollutants, particularly their relative variations in the morning and afternoon during the COVID-19 lockdown period, along with the variations of clean and pollution events. The six air pollutants investigated here are sulfur dioxide (SO2), nitrogen dioxide (NO2), carbon monoxide (CO), particulate matter with aerodynamic diameters less than 10 μm (PM10), particulate matter with aerodynamic diameters less than 2.5 μm (PM2.5), and ozone (O3). Based on the quantitative analysis results, we further analyzed the potential causes of air quality improvement and pollution events.
2. Data and Method
2.1. Data
The study area is Hebei Province and its 11 prefecture-level cities. The full names and acronyms of the 11 prefecture-level cities are listed in Table 1, along with the ground station number in each city. There are 56 ground stations in the study area, and their distribution is shown in Figure 1. These ground stations are all within cities while there are few emission sources generally within 0.5 km around them. The air quality data used in this study are the hourly concentrations of six air pollutants from the China National Environmental Monitoring Center (https://quotsoft.net/air/ (accessed date 11 February 2021)) during the periods from January to May in 2019 and 2020, which are SO2, NO2, CO, PM10, PM2.5, and O3. SO2 concentrations are measured by ultraviolet (UV) fluorescence; NO2 concentrations are measured by a molybdenum converter and chemiluminescence; PM10 and PM2.5 concentrations are measured by the micro-oscillating balance method and the β absorption method; CO and O3 concentrations are measured using infrared and UV absorption, respectively [2,36].
The meteorological data include 10 m U-wind, 10 m V-wind, vertical profiles of temperature and relative humidity, boundary layer height (BLH), and 2 m air temperature from ERA5 (https://cds.climate.copernicus.eu/cdsapp#!/dataset (accessed date 11 February 2021)). Hourly meteorological data from ERA5 over the study region for periods from January to May in 2019 and 2020 have been adopted in this study with a horizontal spatial resolution of 0.25° × 0.25° and a vertical resolution of 25 hPa for the atmospheric layer between 1000 and 500 hPa. Note that both the spatial distribution and regional average of meteorology have been used in this study, instead of just using the meteorology over the grid closest to the ground station. The reason for choosing ERA5 data is its high data quality and high time resolution (hourly) [38,39].
2.2. Study Periods
To investigate the variations of air pollutants, this study classifies six time periods, pre-lockdown, lockdown, post-lockdown, and their corresponding same periods in 2019 (SP19), which are defined as SP pre-lockdown, SP lockdown, and SP post-lockdown, respectively. A similar comparison method has also been used by previous studies over other locations [33,40]. Note that the lockdown period used here is exactly the date period of lockdown over the study region, which provides the basis for our study period selection. The exact time ranges for these six time periods are listed in Table 2.
2.3. Pollution Classification
According to the China “Ambient Air Quality Standard (GB3095-2012)” on the PM2.5 mass concentration limits for the first and second air quality levels, this study uses the following criteria to define pollution event: the PM2.5 mass concentration exceeds 75 μg m−3 for 24 h and above. On the other hand, when the PM2.5 mass concentration for 24 h and above is less than 35 μg m−3, it is defined as a clean event. When the PM2.5 mass concentration is between 35–75 μg m−3, the air quality condition is defined as moderate. This pollution classification method has also been used by previous studies (e.g., [36]). Using this method, we can investigate the changes of clean and pollution events with the COVID-19 lockdown and then identify their potential causes.
2.4. Statistical Analysis
2.4.1. Decreasing Ratio (DR) of Air Pollution
For each air pollutant, the decreasing ratio (DR) is defined and calculated with the following equations,
where C and CSP represent the mass concentration of air pollutants during the study period (pre-lockdown, lockdown, and post-lockdown) and its SP19, respectively. The DR values can let us quantitatively know the reduction of air pollutants during the study period compared to their SP19.
2.4.2. Probability Distribution Function (PDF)
We also analyzed the probability distribution function (PDF) in this study. The specific formula for the PDF is as follows,
where is the probability of occurrence for air pollutant with values between a and b, and is frequency of occurrence of air pollutant at a specific value of x between a and b. Note that the air pollutant can be SO2, NO2, CO, PM10, PM2.5, and O3.
2.4.3. Significance Test
With the two-sample t-test, the significance of the difference of various air pollutants between two particulate periods has been tested. Note that a significance level of 0.05 has been chosen in this study. Based on the definition of two -sample t-test, the t values are calculated as
where , are the mean values of the two set of samples, , are the standard deviations of the two set of samples, and N1, N2 are the sample volume of the two set of samples. After knowing the t value, the p value can be obtained using the t distribution calculator. If p value is less than 0.05, then significant difference between two sets of samples exists. In other words, a confidence level of 95% is used in this study for the significance test.
In this study, we do the t-test when comparing the changes of a given air pollutant between two study periods. We use the hourly average concentration dataset in two periods as the two samples, and calculate the t value using Equation (3) and obtain the p value from the t distribution calculator.
We should note that the air quality data might not follow a normal distribution, which may cause uncertainties to our significance t-test. In other words, the significance t-test here just gives a rough estimation about the significance with potential uncertainties from the sample distribution.
2.4.4. Occurrence Frequency
With the pollution classification shown in Section 2.3, we define the occurrence frequency of clean, moderate, and pollution events during the study periods of pre-lockdown, lockdown, and post-lockdown in 2020 and their SP19. First, we calculate the day number for clean, moderate, and pollution events in a given study period, which are denoted as Nc, Nm, and Np. Then the occurrence frequency OF for any event (a) is calculated as
where a can be c, m, or p dependent on the event considered.
3. Analysis and Result
3.1. Temporal and Spatial Distribution of Air Pollutants
3.1.1. Statistical Status of Air Pollutants during Six Time Periods
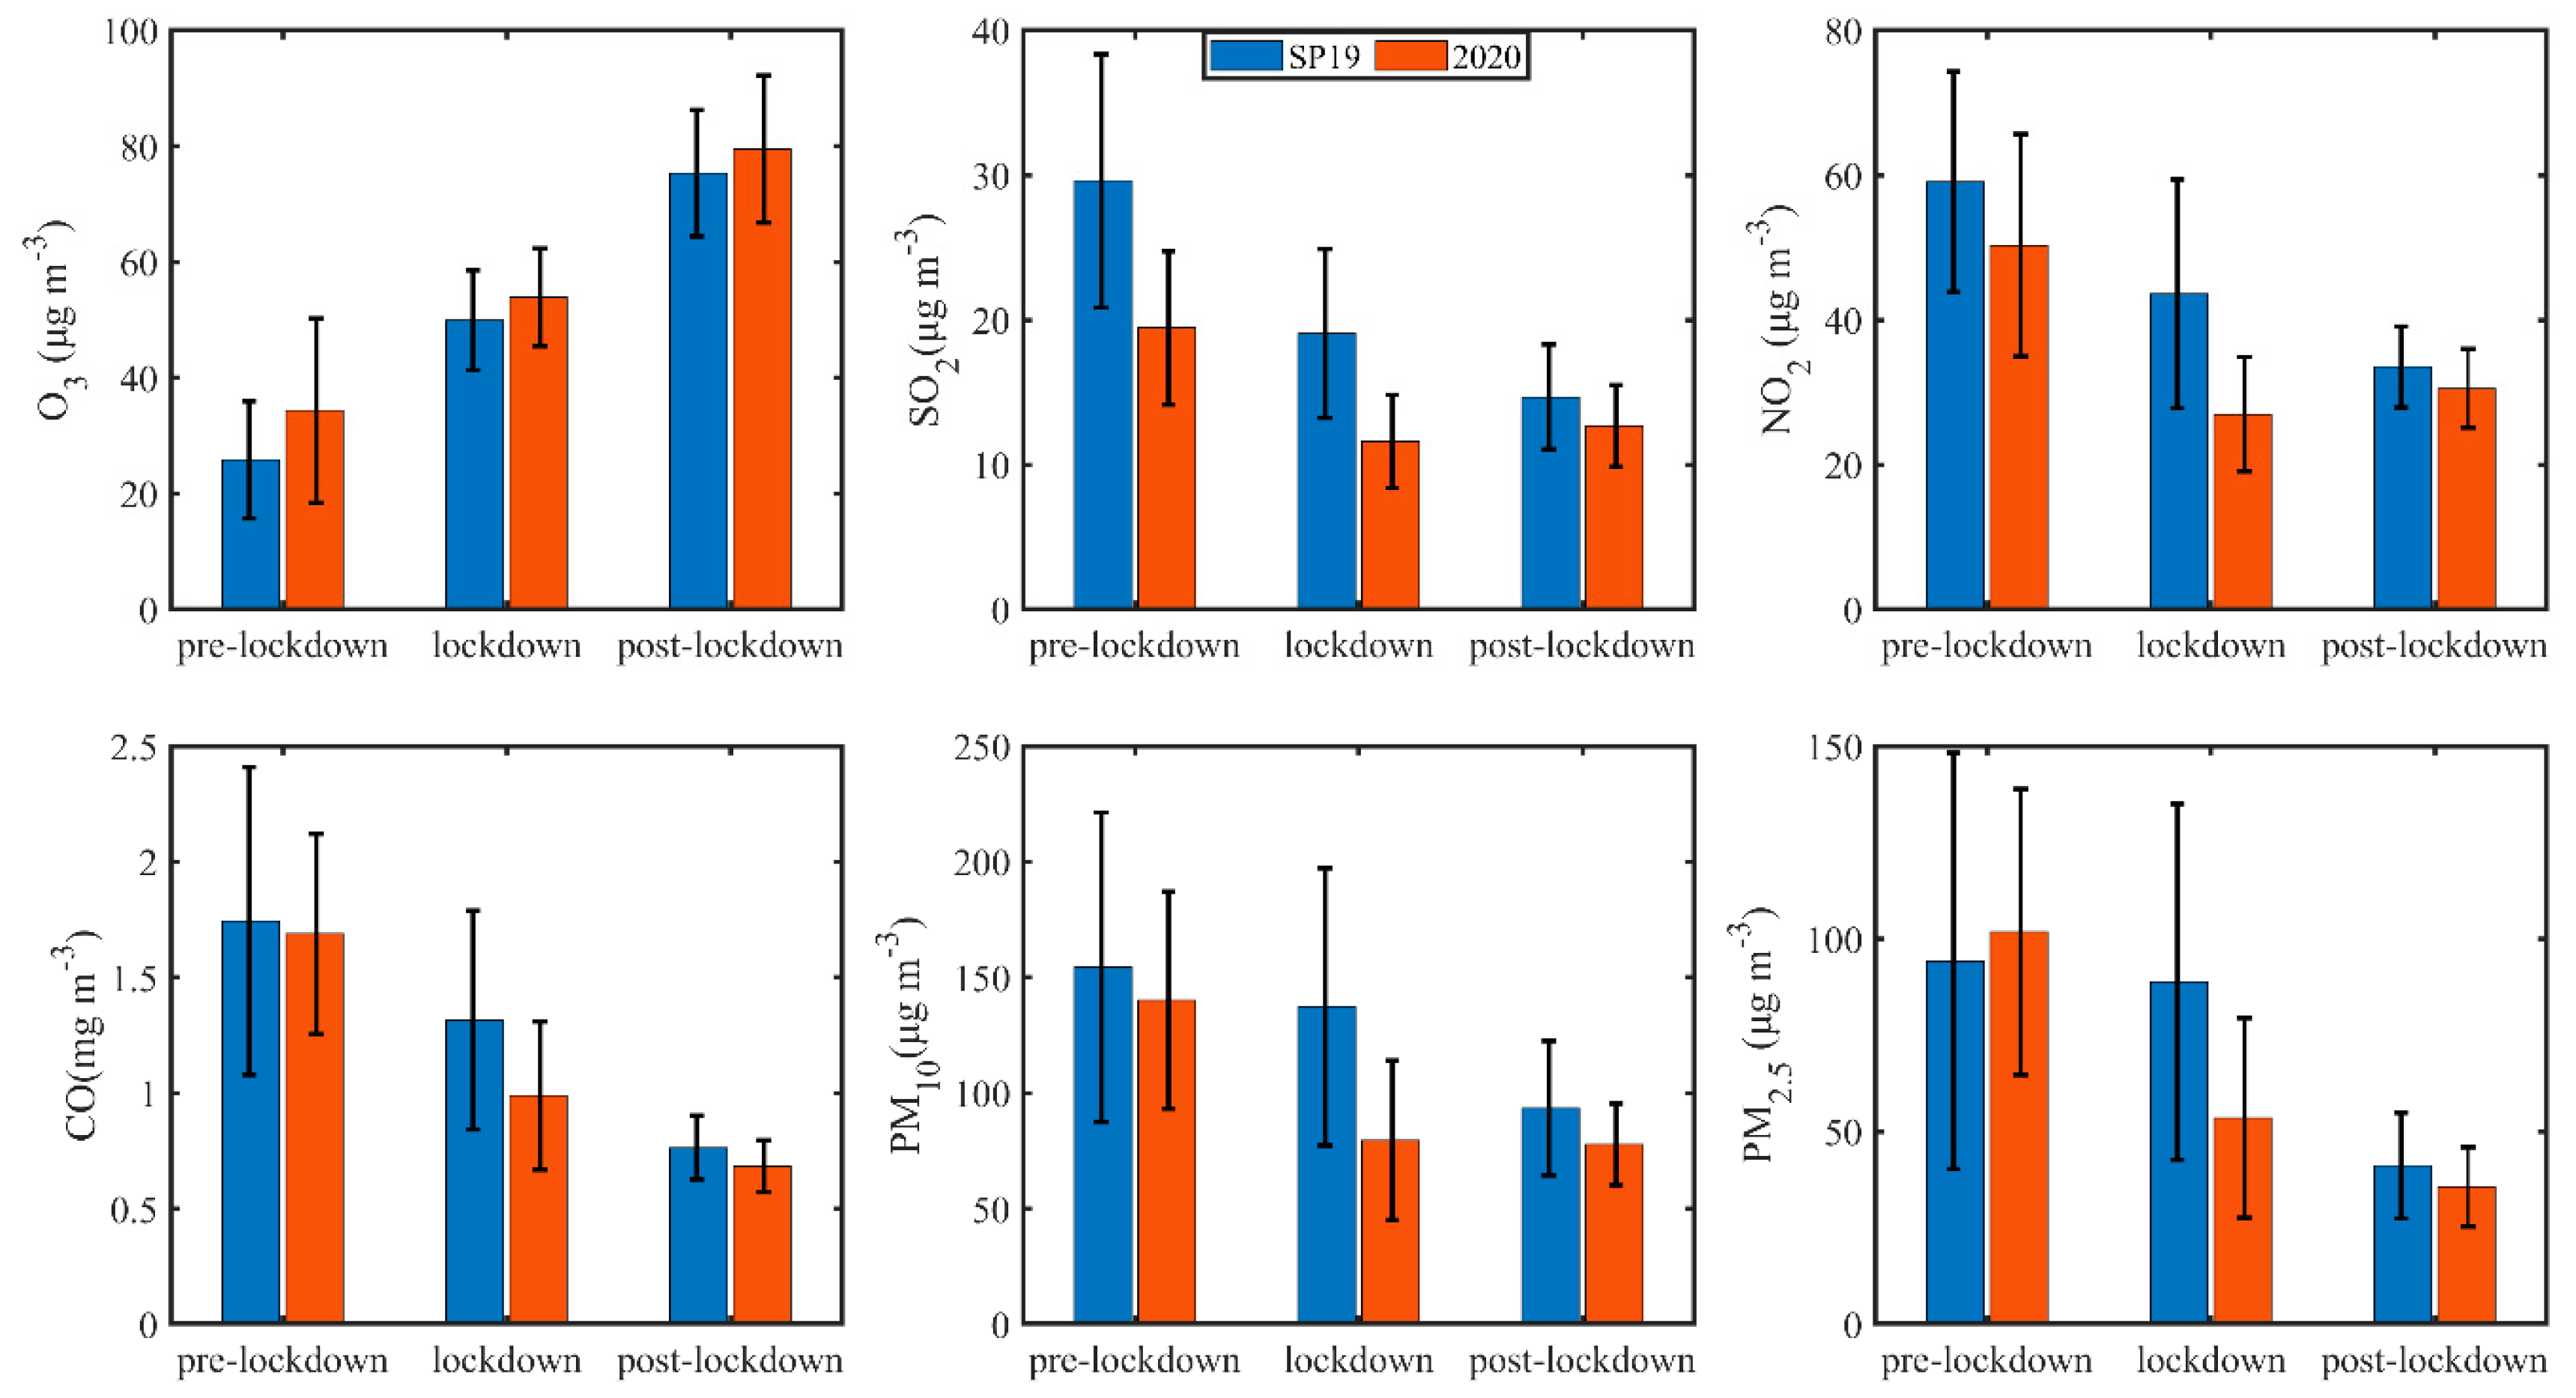
Figure 2 shows the average values of six air pollutants along with their standard deviations during the six different time periods examined. Note that these statistical values are calculated based on the time series of hourly regional averages over all stations within Hebei province for every air pollutant during each study period.
From SP pre-lockdown, SP lockdown, to SP post-lockdown, O3 increases, and the rest of pollutants decreases. This is consistent with our expectation that the gradually increased planetary boundary layer height will make the air pollutants other than O3 decrease from January to May, while the increased solar radiation will make O3 increase instead of decrease from January to May. In contrast, from pre-lockdown to lockdown period, the concentrations of SO2 and NO2 decrease; and from lockdown to post-lockdown period, the concentrations of SO2 and NO2 showed opposite trends, implying the significant reduction of SO2 and NO2 during the lockdown period along with a pickup after the lockdown period. Differently, CO, PM2.5, and PM10 decrease during the three periods.
Table 3 shows the DR values for all air pollutants. By Comparing the concentrations of six air pollutants between pre-lockdown period and its SP19, it shows that SO2, NO2, CO and PM10 decreased as 34.3%, 14.9%, 3.2%, and 9.3% and PM2.5 and O3 increased as 8.0% and 32.7%, respectively. Compared to their SP19, the concentration of SO2, NO2, CO PM10, PM2.5 during lockdown and post-lockdown period decreased by 39.2% and 13.7%, 38.2% and 8.9%, 24.8%, and 10.6%, 42.1% and 16.8%, 39.8%, and 13.4%, respectively. Compared to the SP19, O3 during lockdown (post-lockdown) period increased by 8.0% (5.5%). The reduction of NO2, CO, PM10, and PM2.5 is much larger between lockdown period and SP19 than that between pre-lockdown period and SP19, which should be strongly related to the reduction of emissions from traffic and anthropogenic activities [2,37,41,42]. In contrast, the similar reductions of SO2 during these two periods compared to their SP19 imply the continuous emissions from power plants and heating boilers in winter. For comparison, Higham et al. [43] found significant reduction in NO2 while a double increase of SO2 in United Kingdom.
The above phenomenon indicates the air quality improvement contribution from lockdown measures, with relatively weak variation of meteorology as indicated later in Section 3.2.2. We should note that the SO2, NO2, CO, PM10, and PM2.5 has decreased continuously from 2014 with annual reduction rates around 13%, 6.3%, 5%, 5%, 5.6%, respectively [14]. This is mainly associated with the strict national environmental protection policy and measures in China. In other words, preexisting local environmental policy regulations also contribute to the declining air pollutants. However, the much larger reduction during the lockdown period in 2020 compared to that in SP19 implies the strong air quality impacts by the lockdown measures.
3.1.2. The Probability Density Function of Air Pollutants
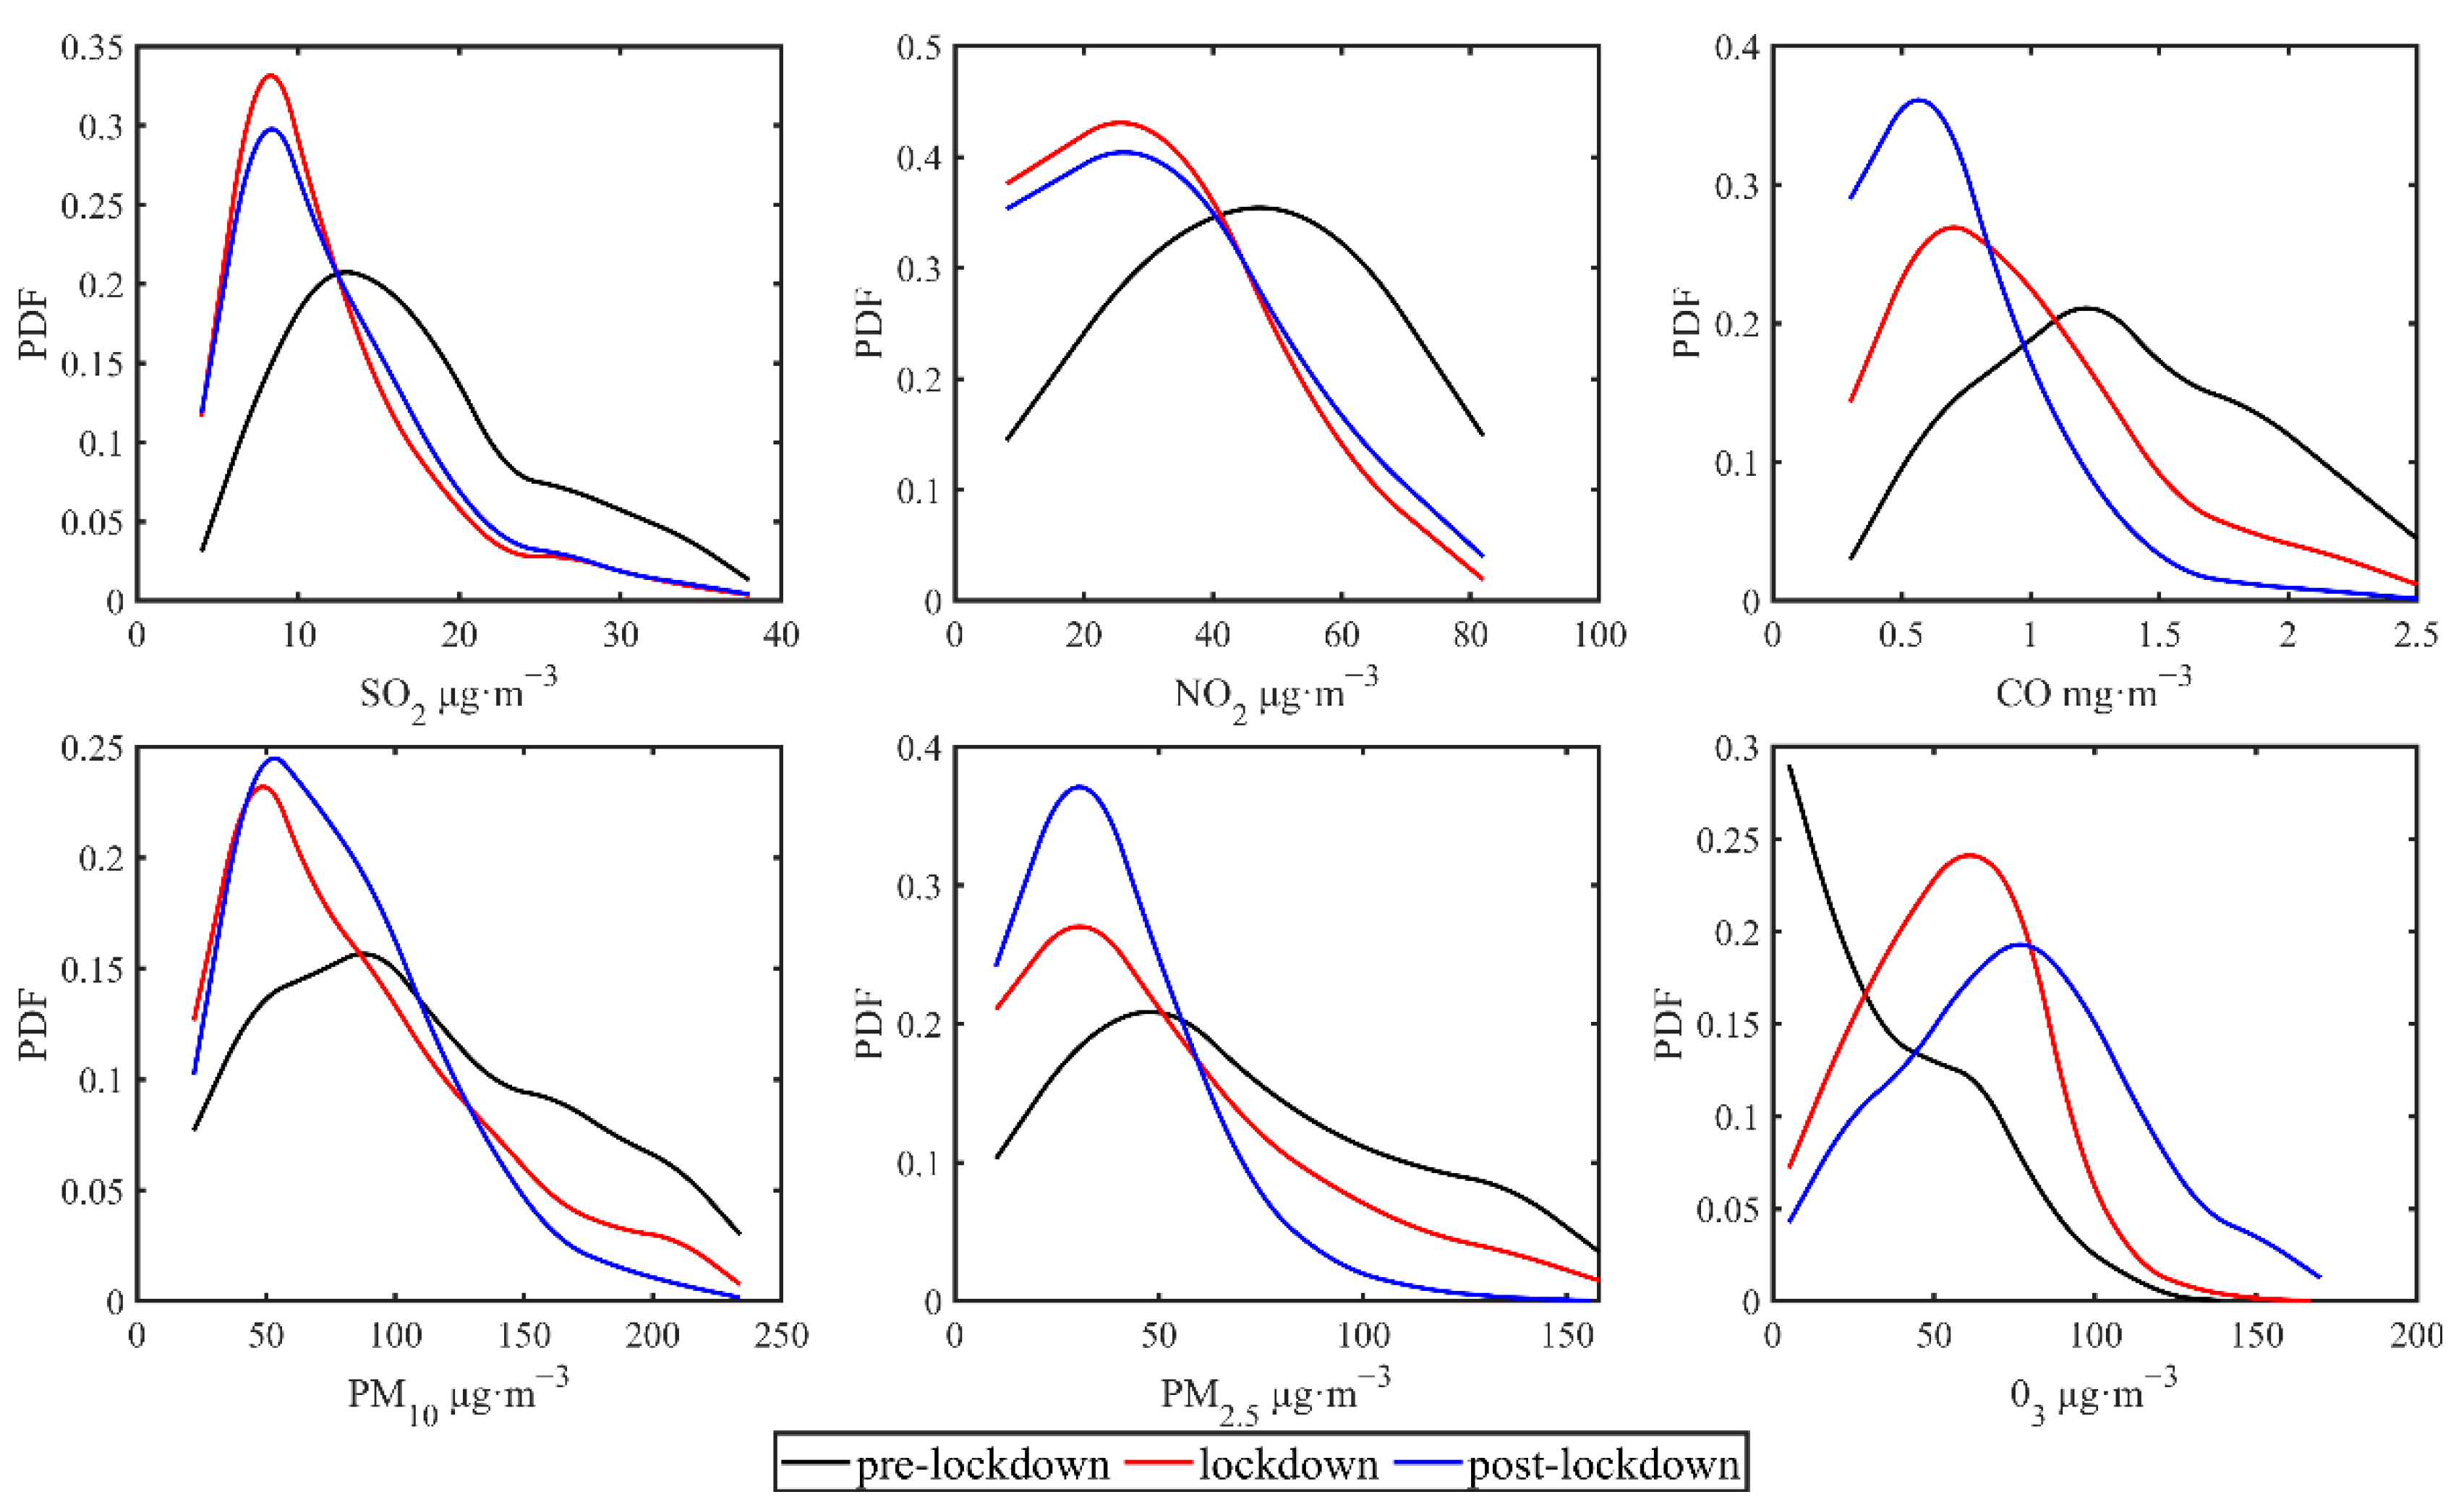
Figure 3 shows the probability density function (PDF) of six air pollutants in pre-lockdown, lockdown, and post-lockdown periods. Note that the PDF analysis in this section is only for data in 2020. In pre-lockdown period, the concentrations of SO2, NO2 and CO are concentrated in 10–20 μg m−3, 40–60 μg m−3 and 1–1.5 mg m−3, respectively. However, in lockdown (post-lockdown) period, the concentrations of SO2, NO2 and CO are mostly concentrated in smaller values, at 8–10 (8–10) μg m−3, 20–40 (20–40) μg m−3, 0.5–1 (0.5–0.7) mg m−3, respectively. Figure 3 shows that PM2.5 and PM10 demonstrate a right skewed distribution in all three periods, and the concentrations are mostly smaller values. The PDF of O3 is also right skewed in pre-lockdown and lockdown periods. Differently, the PDF of O3 is normal distribution in post-lockdown period.
The PDF of air pollutants except O3 in pre-lockdown period is wider than that in lockdown and post-lockdown periods, implying much better air quality caused by reduced anthropogenic activities in lockdown and post-lockdown periods. In general, all of the pollutants except O3 should decrease from January to May associated with increase of boundary layer height and winds. Thus, a PDF shifted to the left should be expected for all air pollutants other than O3, which is exactly what we got in Figure 3. One thing we note is that the CO, PM2.5, and PM10 show the highest frequency at similar concentrations during lockdown and post-lockdown periods, while CO, PM2.5, and PM10 are more with small values during post-lockdown period than during lockdown period. More important, the PDF of both SO2 and NO2 are similar in lockdown and post-lockdown periods. Considering the meteorology variation from February to May, these results most likely imply that emissions during post-lockdown period have not yet reached the level before the lockdown.
3.1.3. Diurnal Variation of Hourly Mean Air Pollutants
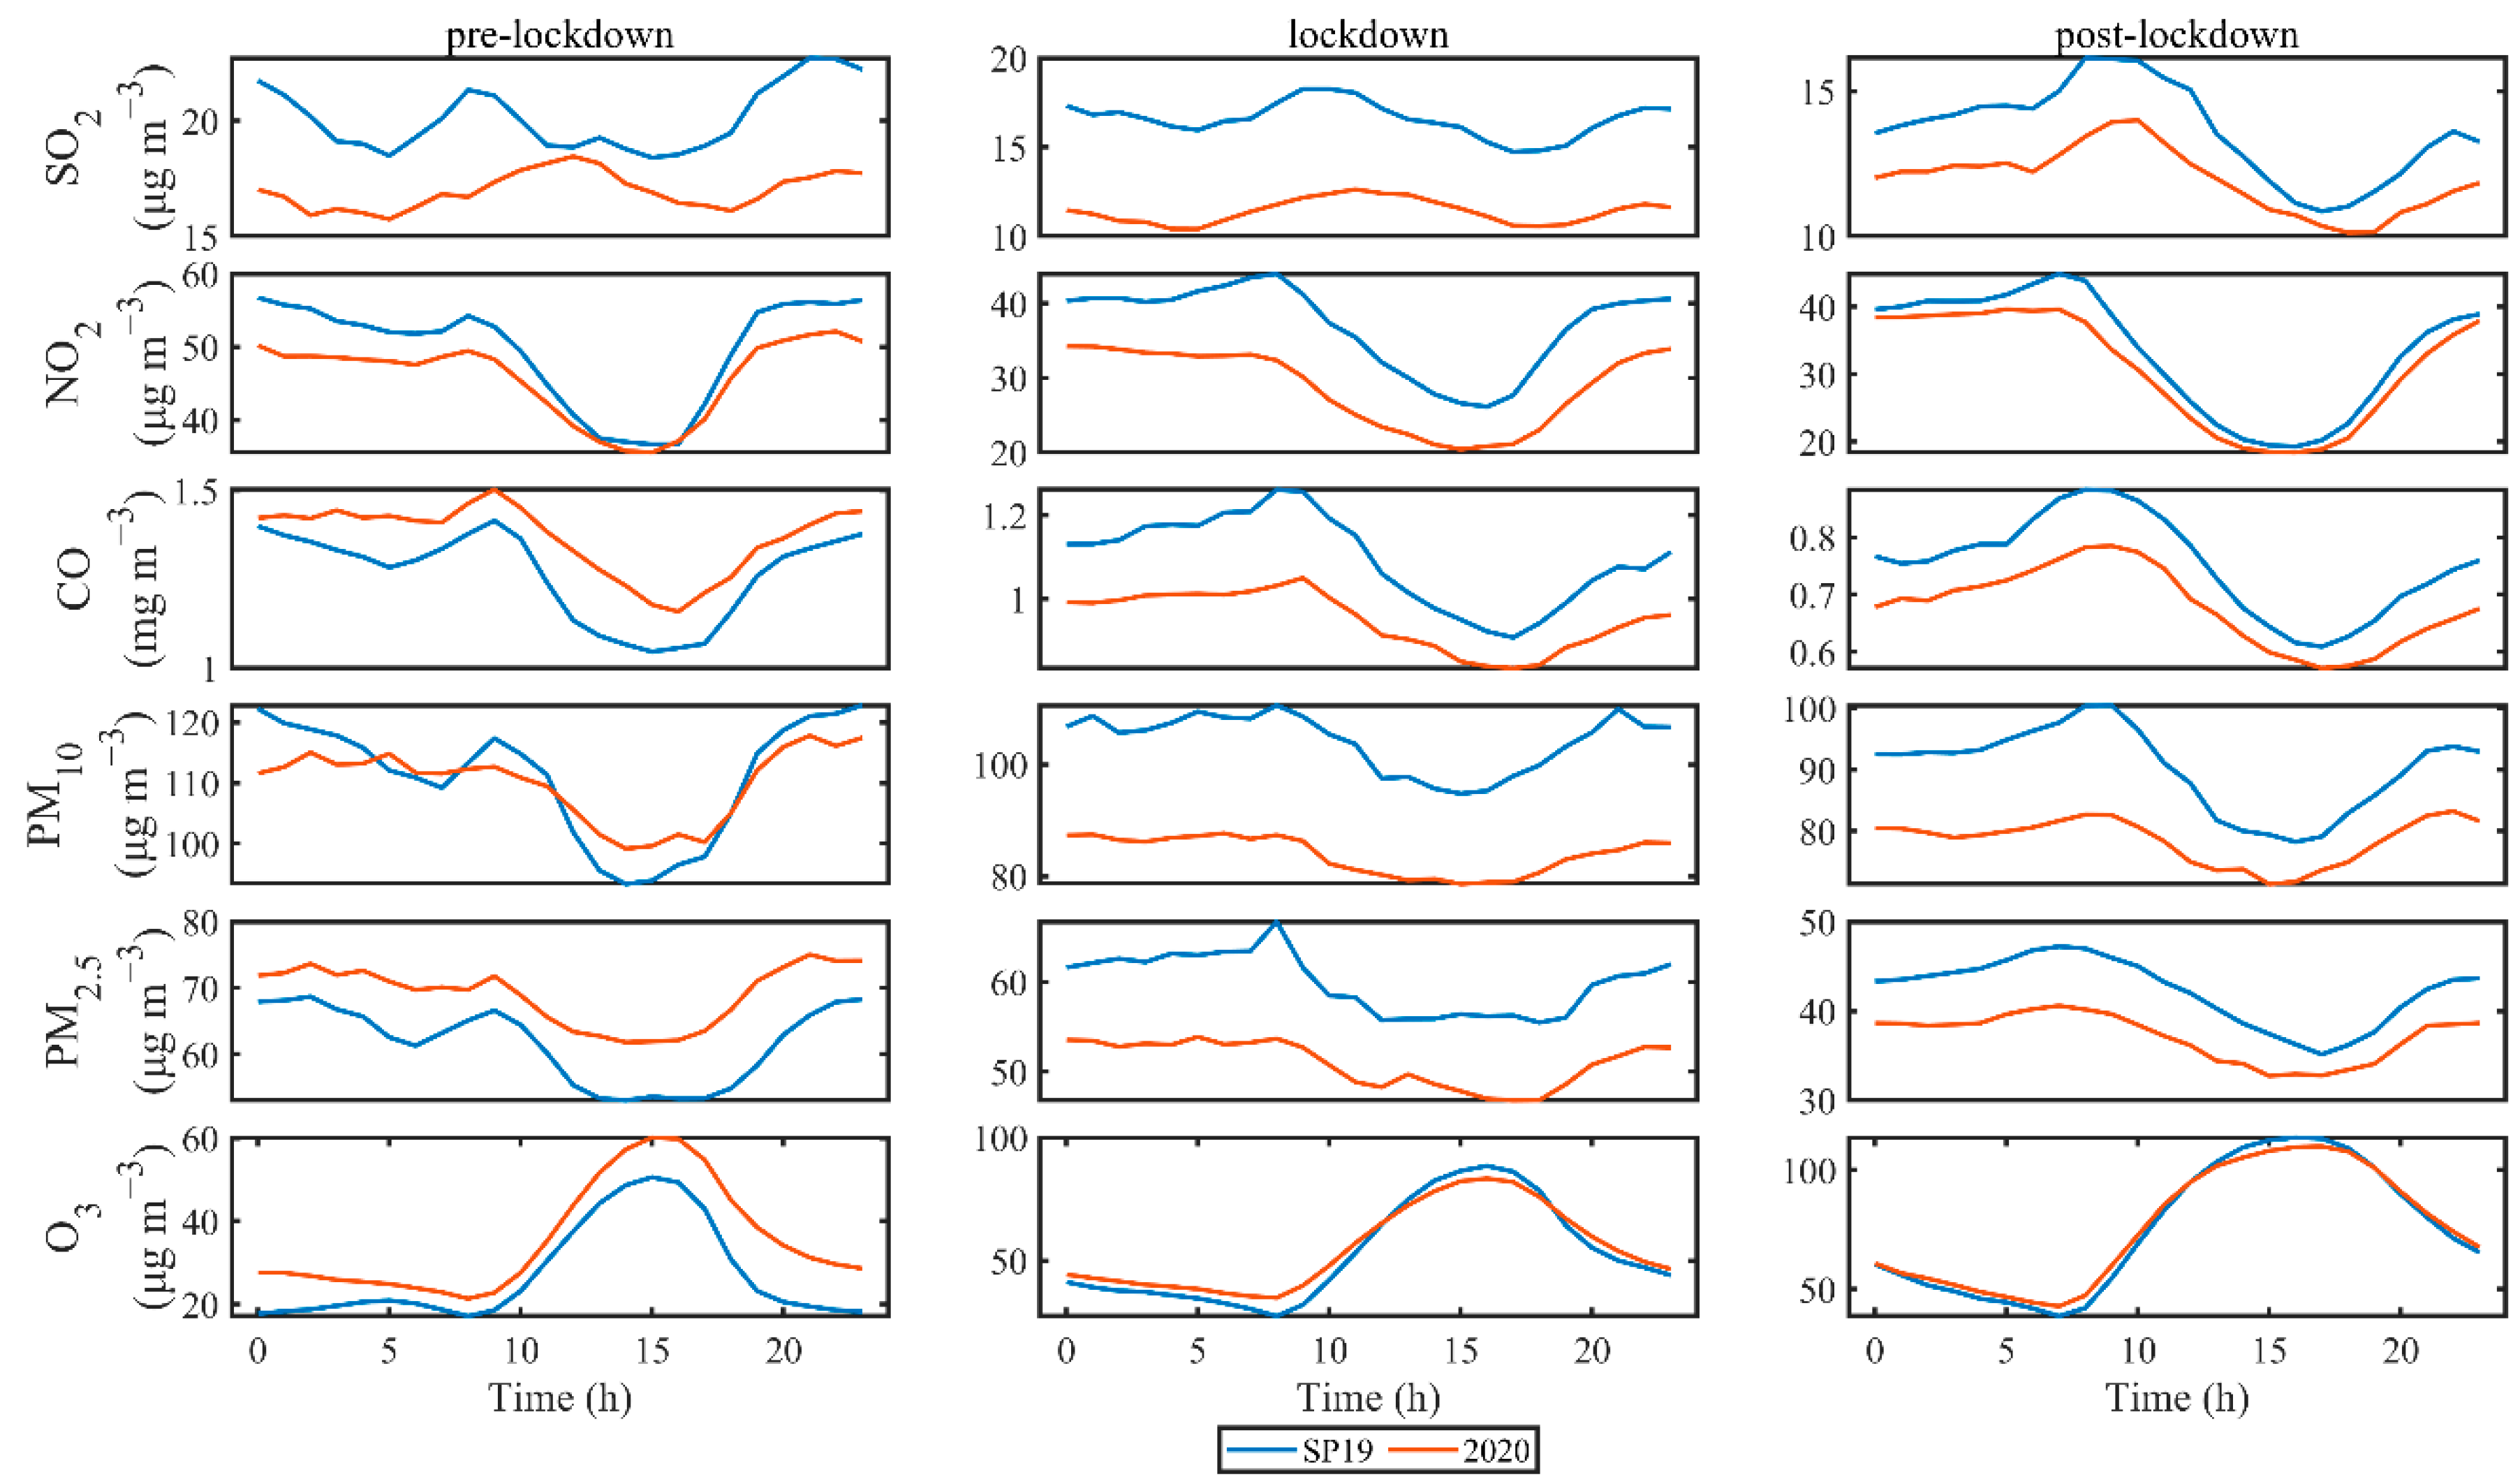
Figure 4 shows the diurnal variation of mass concentrations of six air pollutants (SO2, NO2, CO, PM10, PM2.5 and O3) during the six study periods. Significance tests are carried out between each of the three periods in 2020 and its corresponding SP19 for the air pollutants (not shown here). They show that except O3 (lockdown and post-lockdown), NO2 (post-lockdown) and PM10 (pre-lockdown), other cases have all passed the significance test. The hourly concentrations of SO2 and NO2 in pre-lockdown period are both lower than those in SP19, which is consistent with the results shown in Fig. 3. Compared with SP pre-lockdown period, CO, PM2.5, and PM10 have relatively weaker diurnal variation during the pre-lockdown period. Note that the difference of air pollutants between pre-lockdown period and SP19 is likely a combination effect of continuous reduction of air pollutant emission in China and the changes of meteorology, while other factors such as data uncertainties could also contribute. The comparison analysis between lockdown (post-lockdown) period and the SP19 shows even much larger reductions of air pollutants other than O3, as indicated in Section 3.1.2.
Figure 4 also shows that there are more reductions in relative amount in the morning time from 6:00 to 10:00 local time (LT) than in the afternoon from 14:00 to 18:00 LT for all air pollutants except O3 during both lockdown and post-lockdown periods compared to their SP19, particularly for post-lockdown period. One likely reason is the rapid formation and growth of fine aerosol particles. Specifically, it is hypothesized that the reduction in emissions allows more solar radiation to reach the near-surface air layer, thereby increasing the gas-particle conversion rate in the morning (9:00–11:00 LT) and accelerating the production of large particles in next several hours by rapid growth [44]. Therefore, the improvement of air quality could be larger in the morning than in the afternoon during the lockdown and post-lockdown periods.
Different from other air pollutants, O3 increased in the afternoon, showing a single peak. The peak of O3 occurs at 15:00 LT with values of 60.1 μg m−3 and 50.6 μg m−3 during the pre-lockdown period and its SP19, respectively. In contrast, the peak of O3 occurs at 16:00 LT with peak values of 83.4 μg m−3 and 84. 5 μg m−3 during the lockdown period and its SP19, respectively. The peak of O3 occurs at 17:00 and 16:00 LT with values of 109.9 μg m−3 and 113.7 μg m−3 during the post-lockdown period and its SP19, respectively. The later occurrence time of peak O3 but with higher values from pre-lockdown to post-lockdown periods might be related to the increased daytime length. It is clear that peak value of O3 concentration increased during the pre-lockdown period, but slightly decreased during both the lockdown and post-lockdown periods, which implies the reduction of precursor gases (NOx and VOCs) during the lockdown and post-lockdown periods [35,45].
3.1.4. Variation of Air Pollutants in Different Cities
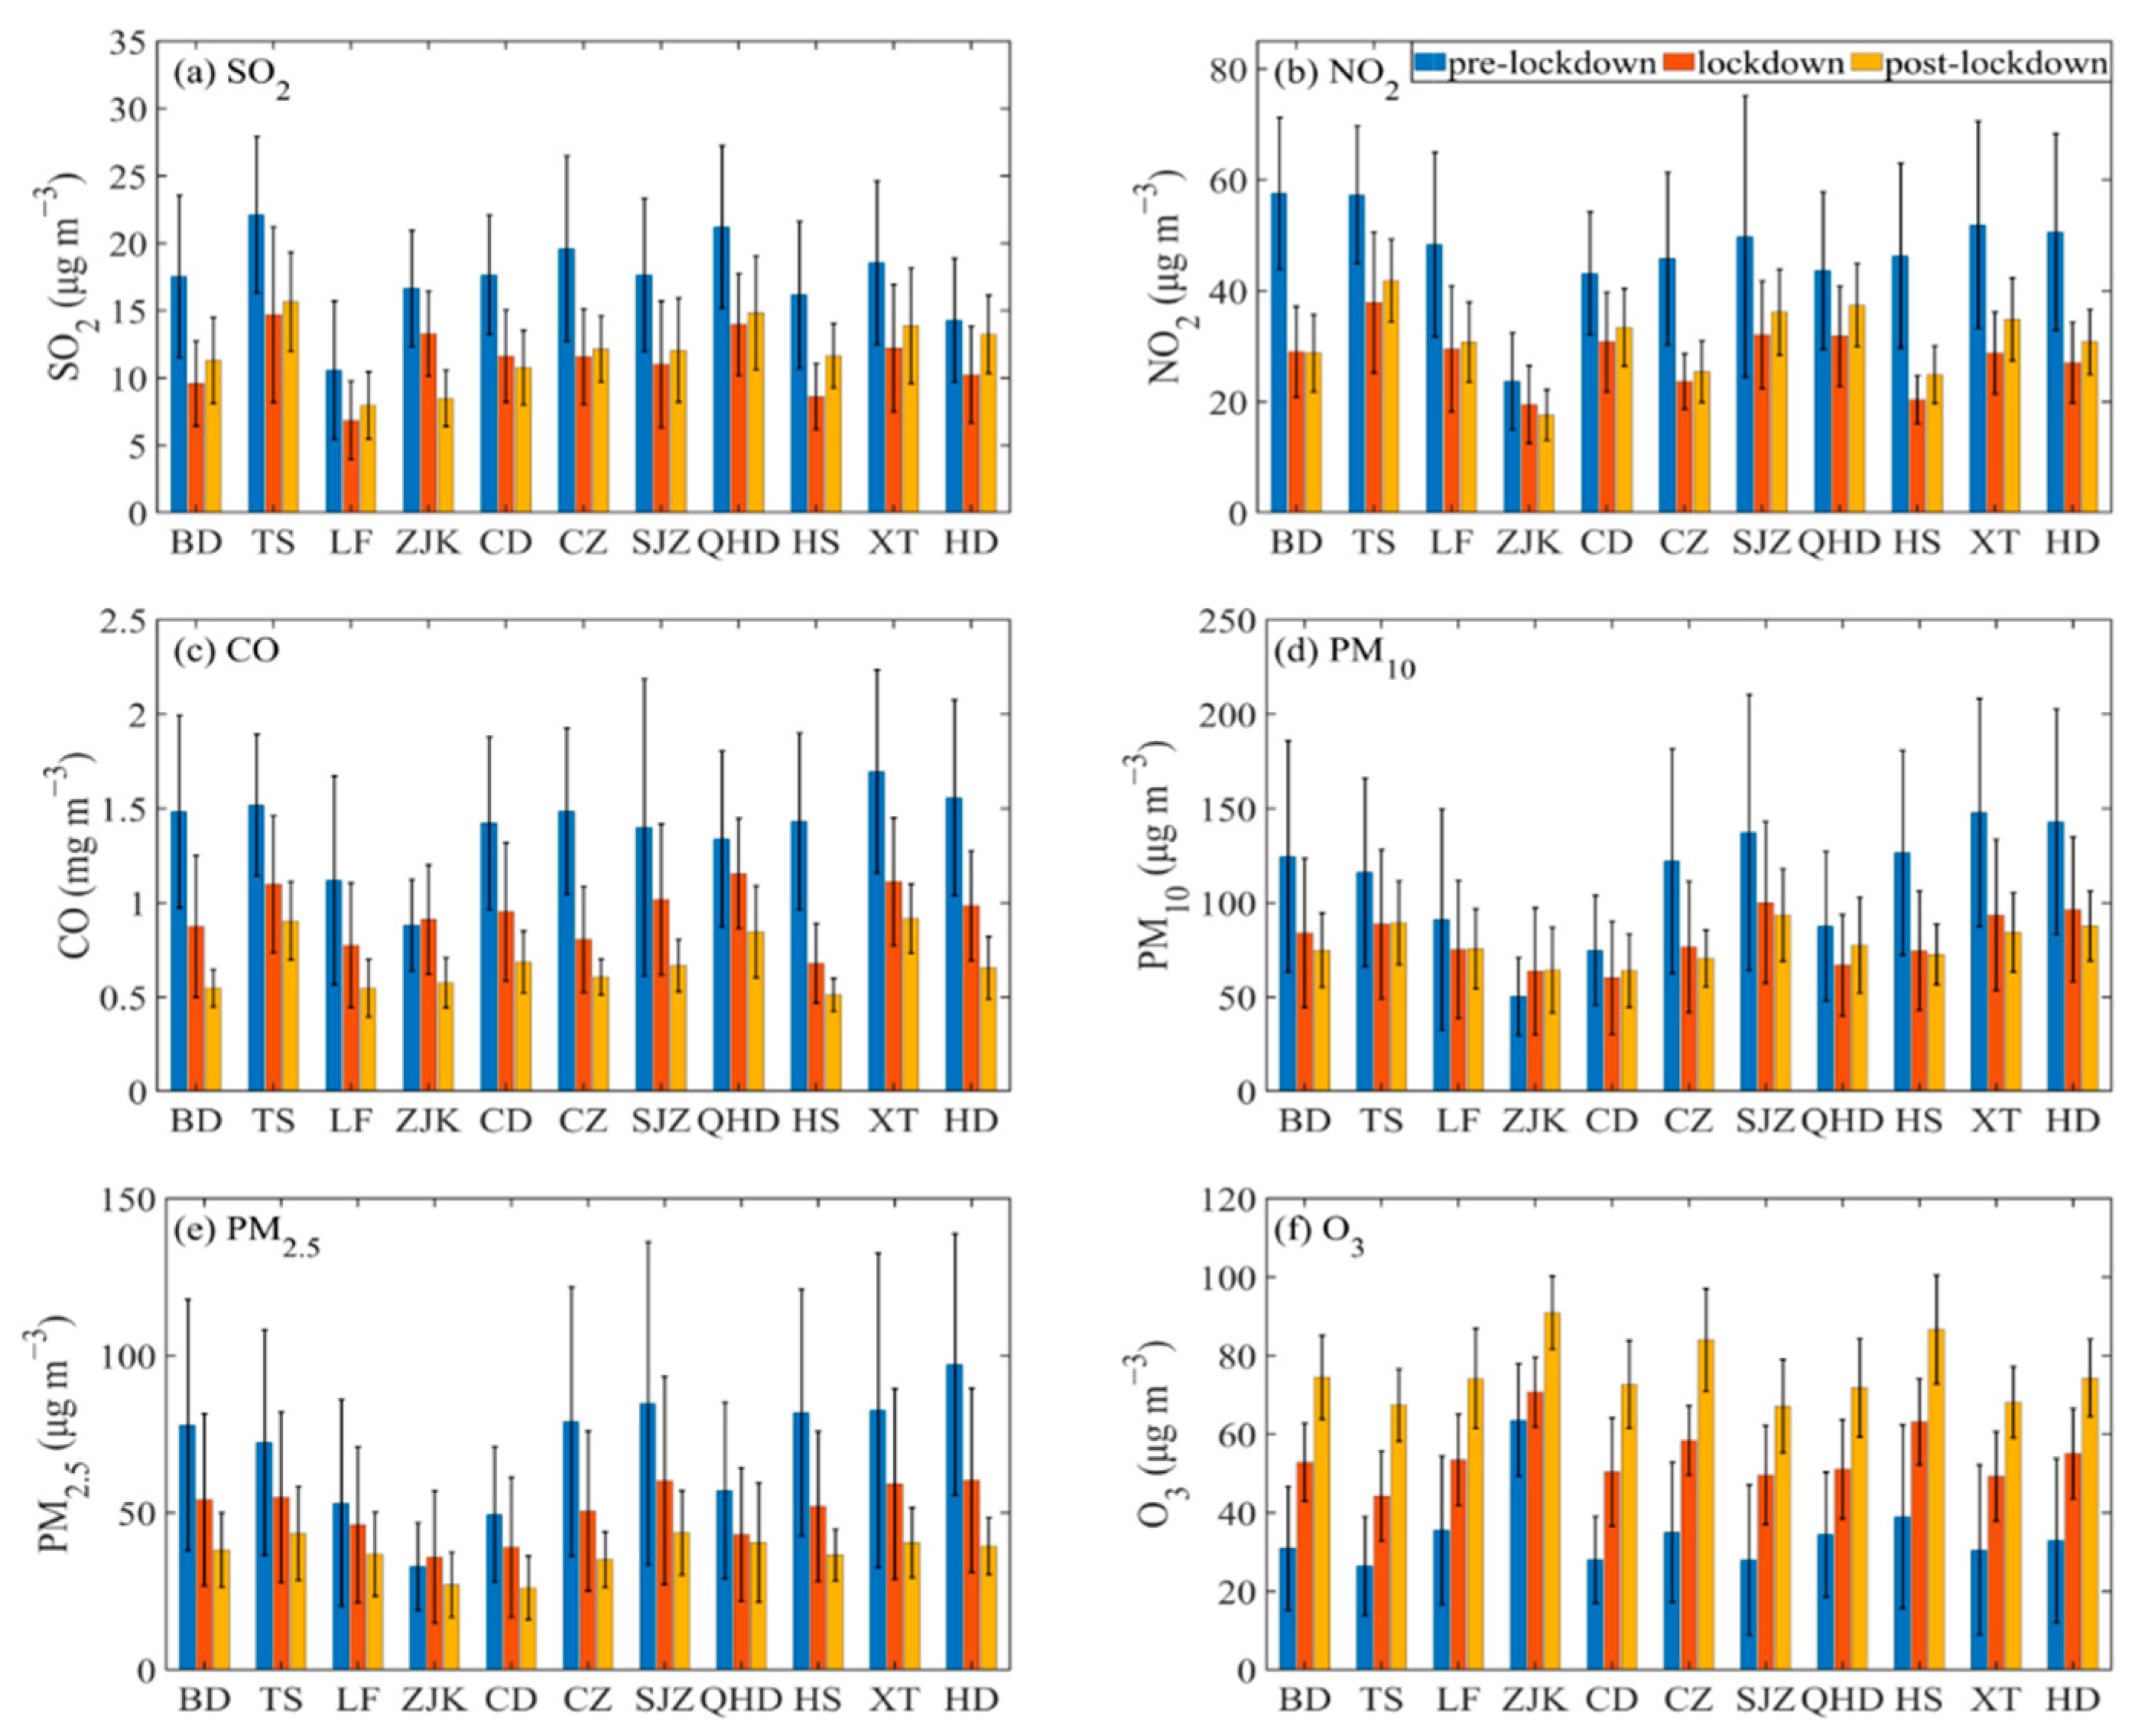
In order to explore the variation characteristics of air pollutants in different cities in Hebei Province, we compared the average concentrations of six air pollutants during the three periods of pre-lockdown, lockdown, and post-lockdown in 2020 for 11 cities in Hebei province, which is shown in Figure 5. Figure 5 shows that except Zhangjiakou (ZJK), Chengde (CD) and Baoding (BD), the concentrations of SO2 and NO2 in other cities show significant reduction from the pre-lockdown to lockdown periods and from the pre-lockdown to post-lockdown periods (passing the student-t significance tests which is analyzed based on hourly average data between two study periods). Note that the concentration of SO2 also showed U-shaped temporal variation among the three periods in Baoding, and the concentration of NO2 showed U-shaped temporal variation among the three periods in Chengde. Among all variables, the SO2 and NO2 have more obvious increase from lockdown to post-lockdown periods. The CO, PM2.5, and PM10 showed a decreasing trend for almost all cities (except PM10 in ZJK, CD, and Qinhuangdao, and PM2.5 in ZJK), which might be related to the increasing meteorological dispersion condition from lockdown to post-lockdown periods, such as the general increase of atmospheric boundary layer height from February to May. Different from other types of air pollutants, O3 in each city increased gradually in these three periods, consistent with the increasing solar radiation.
The variation trend of air pollutant concentration in Zhangjiakou is different from that of other cities in Hebei Province during the three study periods. The mass concentration of PM10 in Zhangjiakou is the largest in spring and the smallest in winter due to strong wind, dust transport and less precipitation in spring [14]. Moreover, CO and PM2.5 even increase slightly from pre-lockdown to lockdown period and then decrease afterward, and SO2 and NO2 show continuous decreasing trend. As known, Zhangjiakou is a clean city with few industries, making the air quality there much more sensitive to the meteorology. With the increases of winds and BLH (from ERA5), SO2 and NO2 show continuous decreasing trend. However, the reason for the slight increase of CO and PM2.5 during the lockdown period is not clear which need further investigation in the future.
3.2. Analysis of Pollution Events
3.2.1. Temporal Variation of Air Pollution Events
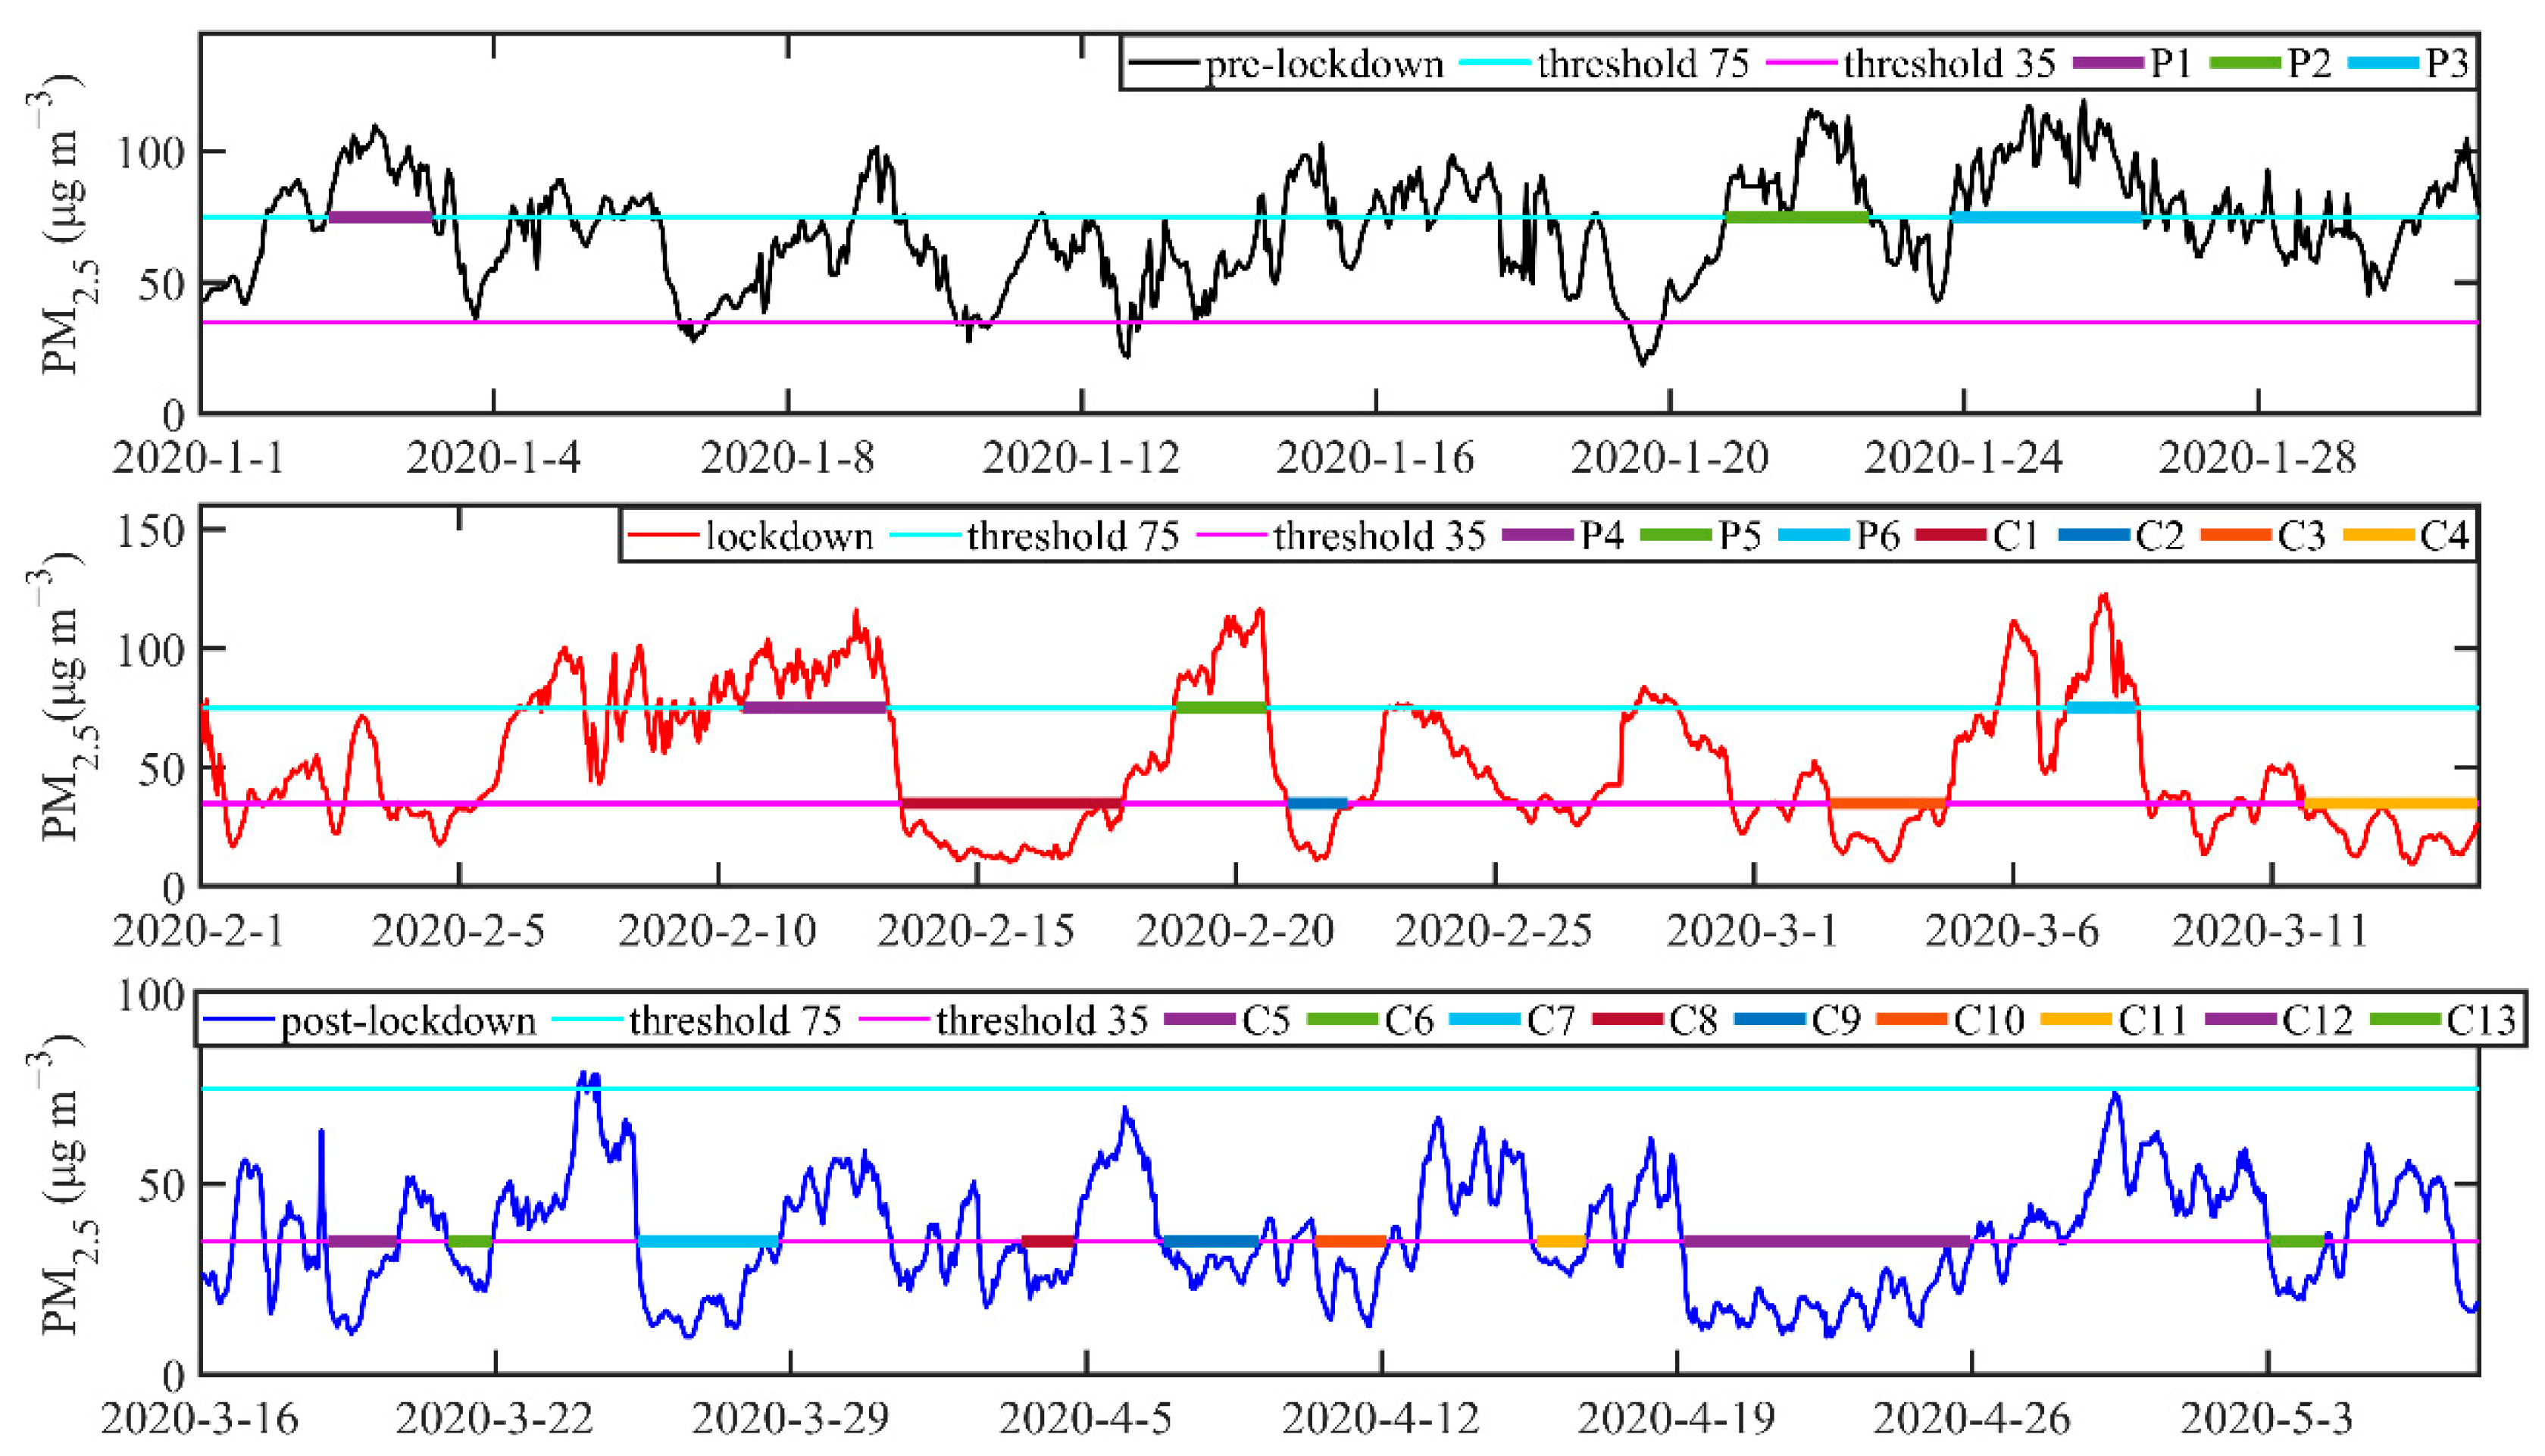
Figure 6 shows the time series of PM2.5 concentration along with the identified pollution and clean events during the pre-lockdown, lockdown, and post-lockdown periods. As shown, the pollution events occur three times both in pre-lockdown and lockdown periods in 2020, and the clean events occur four and nine times, respectively, in lockdown and post-lockdown period in 2020. The same analysis has also been carried out for the corresponding three same periods in 2019, with results shown in Figure S1. Table 4 shows the proportion of clean, moderate, and pollution events in the six time periods. The occurrence probability of clean events in lockdown period (34.1%) is significantly higher (student-t test) than that in pre-lockdown (0%) and SP lockdown periods (11.6%). In contrast, the occurrence frequency of clean days in pre-lockdown is even less than that in corresponding SP19. While the occurrence probability of clean days in post-lockdown period (51.9%) is also higher than that in its SP19 (42.6%), the increasing amount is less than that increase from SP lockdown to lockdown period. The occurrence probability of pollution events in lockdown period (20.5%) is found lower than that in pre-lockdown (32.3%) and SP lockdown periods (23.4%). However, the reduction of pollution events is not as obvious as the increase of clean events during the lockdown period. These results most likely imply that the strong reduction of emission plays the dominant role to the clean air quality, while the meteorology plays a more important role to the formation of pollution events.
3.2.2. Meteorological Analysis
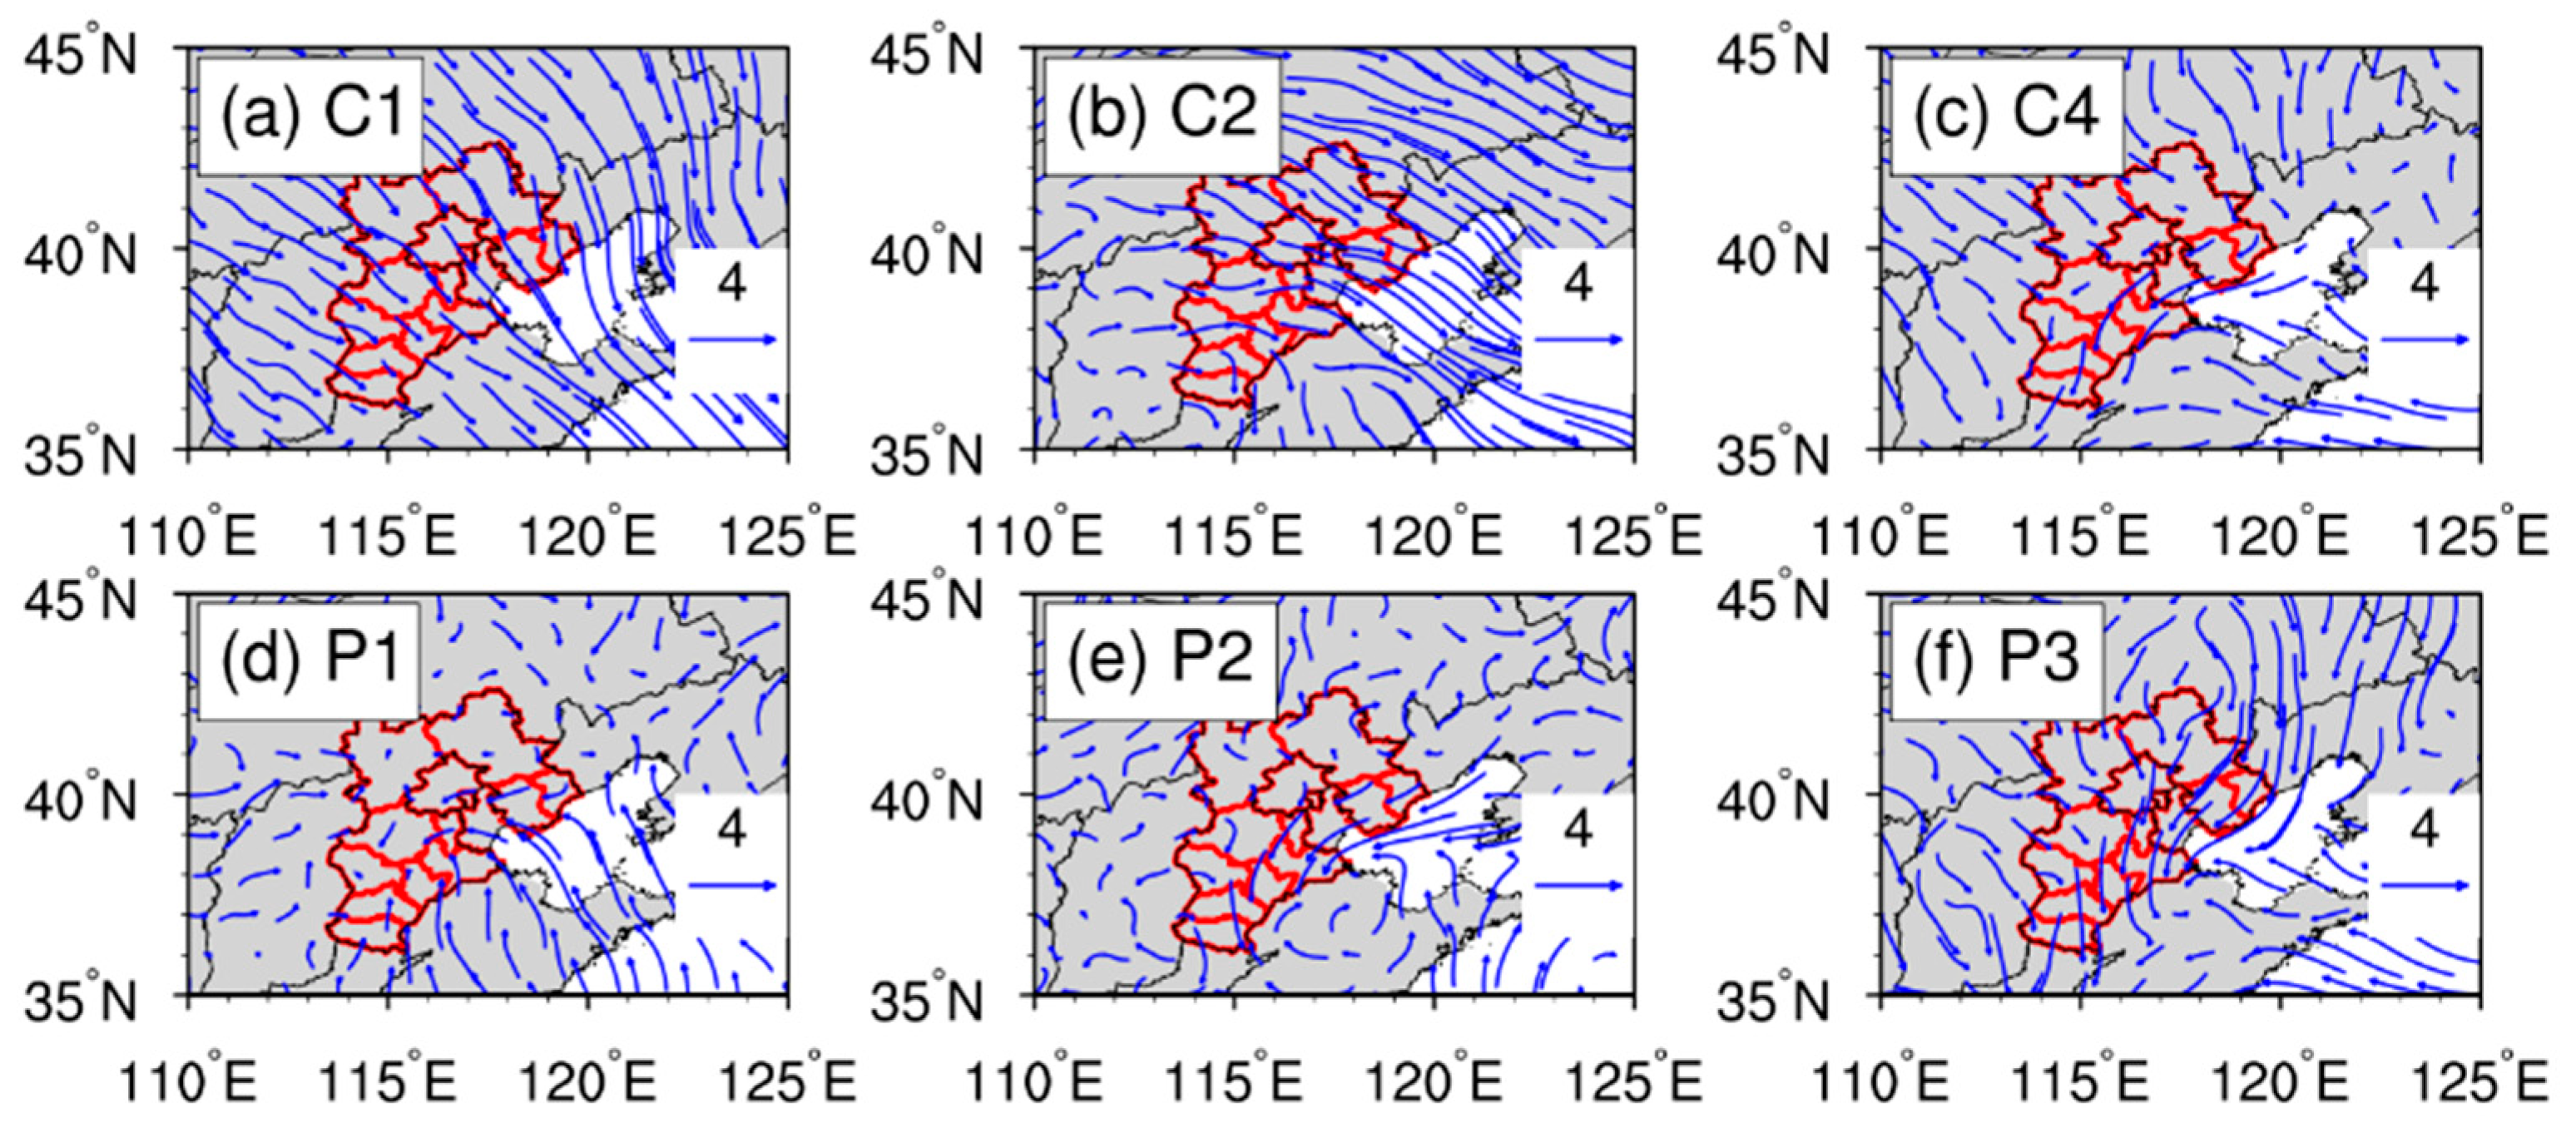
We found that emissions have been greatly reduced during the lockdown period, but pollution events still occurred. In this study, the differences of meteorological elements (BLH, 10m wind, temperature, and humidity profile) under clean and polluted conditions are compared and analyzed, so as to obtain the causes of pollution events during lockdown period. Table 5 shows the statistical information of pollution events and clean events during lockdown period. Generally, the lower the BLH, the more possibility the pollution events [46]. We also find that the duration time length of pollution (clean) events is more likely longer (shorter) when the BLH decreases while the peak values could vary case by case. For example, the duration time for P4 incident is 4 days with BLH as 268.5 m, and for P5 and P6 incidents are 3 and 2 days with BLH close to 500 m; and the duration time for C1 and C4 incidents are 4 days with BLH more than 700 m, and for C2 and C3 incidents are 3 days with BLH slightly above 500 m.
Figure 7 shows the 10 m winds in Hebei Province and its surrounding areas during the lockdown period. The average wind speeds for clean conditions of Figure 7a–c in the study area are 3.4 m/s, 3.7 m/s, and 2.3 m/s, respectively. The average wind speeds for pollution conditions of Figure 7d–f in the study area are 1.6 m/s, 2.3 m/s, and 2.0 m/s, respectively. We clearly found that the average wind speed under clean conditions is generally higher than the average wind speed under polluted conditions. At cases with wind speeds not too high or not too low (such as 2.3 m/s in Figure 7c,e), both pollution and clean events could occur since the air pollution could be more sensitive to factors other than the winds (such as high BLH for C3 incident and low BLH for P5 incident) at these cases. This shows that despite the reduction in pollutant emissions during the lockdown period, a smaller wind speed is still not conducive to the diffusion of air pollutants and may lead to pollution event. For the meteorology during pollution events as shown in Figure 7d–f, convergence of winds which can help air pollutants accumulate also occurs. For example, Figure 7d shows a convergence of winds in Shijiazhuang and Xingtai, and Figure 7e shows a convergence of winds in the southeast of Hebei province.
We also investigated the spatial distribution of hourly average precipitation for both clean events and polluted events (not shown here). It is found that the hourly average precipitation is generally low (<0.015 mm/hour) for both clean and pollution events. The hourly average precipitation during the pollution events is slightly lower than that during the clean events, which might imply a slightly stronger precipitation scavenging effect during the time for clean events. However, the light precipitation during the study periods could also cause a positive effect to air pollution due to the aerosol hygroscopic growth [21,22]. It is challenging to quantify the influence of precipitation, however, it might be reliable to assume a weak or even negligible influence from precipitation considering its low amount.
Although during the lockdown period the emission of pollutants reduced, the frequency of pollution events did not significantly reduce in Hebei Province. This is most likely related to the BLH, wind field, temperature and humidity which are not conducive to the diffusion of pollutants. In contrast, the frequency of moderate events decrease, resulting increase of clean event occurrence frequency. The obvious increase in the frequency of clean conditions during the lockdown period is more caused by the reduction of pollutant emissions, while the frequency of pollution events is not significantly reduced, which is more caused by adverse meteorological factors.
4. Summary and Discussion
Based on the observations at 56 stations, this study analyzes the variation characteristics of six pollutants (SO2, NO2, CO, PM10, PM2.5, O3) in Hebei Province during six periods, and compares the average values of pollutants in each city for the three study periods (pre-lockdown, lockdown, and post-lockdown period). Moreover, by analyzing the clean and pollution events occurred during the lockdown period, the causes are discussed, respectively.
Compared with the SP19, the SO2, NO2, PM10, PM2.5, and CO concentrations during the lockdown (post-lockdown) decreased by 39.2% (13.7%), 38.2% (8.9%), 42.1% (16.8%), 39.8% (13.4%), and 24.8% (10.6%), respectively. In contrast, O3 increased by 8.0% (5.5%). This is consistent with the finding in many places of the word. The concentration of NO2 decreased a lot and O3 increased. The increase of O3 can be attributed to the increase of solar radiation due to reduction of aerosol particles and photochemical repartitioning due to the reduction in NOx [27]. The results about the temporal variation of air pollutants during the lockdown period are consistent with the findings from previous studies over other locations [35,36,37]. Particularly, various studies have found the significant reductions in NO2 and significant increase in O3 while with different magnitudes over different locations in the world [23,24,25,26,27,28,29,30,31,32,33,34]. Moreover, these previous studies have shown no consistent results about the changes of other air pollutants, while more of them show reductions. Although previous studies have checked the impacts on the changes of air pollutants by COVID-19 lockdown, few of them have examined the changes in diurnal variations.
Different from previous studies, we found the different changes of air pollutants during both lockdown and post-lockdown periods between morning and afternoon time. Compared with SP19, the results show that the hourly concentrations of pollutants except O3 decreased more in the morning (6:00–10:00 LT) than in the afternoon (14:00–18:00 LT) during the lockdown and post-lockdown periods, particularly for post-lockdown period. One potential reason is that the formation and growth of fine aerosol particles is more prominent during cleaner time periods or under strong solar radiation conditions. Another potential reason could be related to the more reduction of traffic in the morning time (6:00–10:00 LT) than in the afternoon time (14:00–18:00 LT), as explained by Singh [47] for significant air pollution reduction at normal traffic hours during lockdown period in India.
For 11 cities in Hebei province, the average concentrations of SO2 and NO2 during lockdown period are lower than the pre-lockdown and post-lockdown periods, indicating that emission reduction has an important impact. Differently, CO, PM2.5, and PM10 decrease continuously for these periods, which might be associated with the combination effect of relatively weaker reduction of CO, PM2.5, and PM10 particles during the lockdown period and the continuous increase of mixed BLH during these three periods, while other factors such as data uncertainties could also contribute. Different from other cities, Zhangjiakou is a clean city with few industries, making it much more sensitive to meteorology. Correspondingly, the SO2 and NO2 show a continuous decreasing trend in Zhangjiakou among the three study periods.
We also found that there is a clear increase in clean air events during the lockdown period compared to that during both SP lockdown and pre-lockdown periods, implying the dominant role of emission reduction in whole air quality. This is consistent with previous findings that the emissions are the dominant factor of air quality in east Asia [14,24]. In contrast, the occurrence frequency of pollution events only decreases slightly during the lockdown period compared to that during its SP19, which confirms the dominant role of meteorology in the formation of pollution events. Similarly, Shen et al. [36] also found the significance of meteorology on the pollution events during the city lockdown in Hubei province. We should note that the secondary formation of aerosol particles might also play a role [48].
Supplementary Materials
The following are available online at https://www.mdpi.com/2073-4433/12/2/267/s1, Figure S1: The time series of PM2.5 during the same three study periods of pre-lockdown, lockdown, and post-lockdown in 2019 (SP19), along with the classification of pollution, moderate, and clean days. “threshold 75” represents the value is equal to 75. “threshold 35” represents the value is equal to 35. “P” represents pollution events and “C” represents clean events.
Author Contributions
Methodology, S.J., C.Z.; writing—original draft preparation, S.J.; writing—review and editing, C.Z., H.F. All authors have read and agree to the published version of the manuscript.
Funding
This study is funded by the Beijing Municipal Science and Technology Commission (grant D171100007917001), the National Natural Science Foundation of China (grants 41925022), the Hebei social development science and Technology Division (grant 20375402D), and the State Key Laboratory of Earth Surface Processes and Resource Ecology.
Institutional Review Board Statement
Not applicable.
Informed Consent Statement
Not applicable.
Data Availability Statement
The air quality data presented in this study is openly available in https://quotsoft.net/air/ (accessed date 11 February 2021), and the meteorology data is openly available from ECMWF: https://cds.climate.copernicus.eu/cdsapp#!/dataset/reanalysis-era5-single-levels?tab=form (accessed date 11 February 2021).
Acknowledgments
The air quality data is from China National Environmental Monitoring Center (https://quotsoft.net/air/ (accessed date 11 February 2021)), and the meteorology data is from ERA5 reanalysis dataset (https://cds.climate.copernicus.eu/cdsapp#!/dataset (accessed date 11 February 2021)).
Conflicts of Interest
The authors declare no conflict of interest.
References
- Tian, H.; Liu, Y.; Li, Y.; Wu, C.-H.; Chen, B.; Kraemer, M.U.G.; Li, B.; Cai, J.; Xu, B.; Yang, Q.; et al. An investigation of transmission control measures during the first 50 days of the COVID-19 epidemic in China. Science 2020, 368, 638–642. [Google Scholar] [CrossRef] [PubMed] [Green Version]
- Chu, B.; Zhang, S.; Liu, J.; Ma, Q.; He, H. Significant concurrent decrease in PM2.5 and NO2 concentrations in China during COVID-19 epidemic. J. Environ. Sci. 2021, 99, 346–353. [Google Scholar] [CrossRef] [PubMed]
- Lin, S.; Wei, D.; Sun, Y.; Chen, K.; Yang, L.; Liu, B.; Huang, Q.; Paoliello, M.M.B.; Li, H.; Wu, S. Region-specific air pollutants and meteorological parameters influence COVID-19: A study from mainland China. Ecotoxicol. Environ. Saf. 2020, 204, 111035. [Google Scholar] [CrossRef] [PubMed]
- Nie, D.; Shen, F.; Wang, J.; Ma, X.; Li, Z.; Ge, P.; Ou, Y.; Jiang, Y.; Chen, M.; Chen, M.; et al. Changes of air quality and its associated health and economic burden in 31 provincial capital cities in China during COVID-19 pandemic. Atmos. Res. 2021, 249, 105328. [Google Scholar] [CrossRef]
- Conticini, E.; Frediani, B.; Caro, D. Can atmospheric pollution be considered a co-factor in extremely high level of SARS-CoV-2 lethality in Northern Italy? Environ. Pollut. 2020, 261. [Google Scholar] [CrossRef] [PubMed]
- Gautam, S. The Influence of COVID-19 on Air Quality in India: A Boon or Inutile. Bull. Environ. Contam. Toxicol. 2020, 104, 724–726. [Google Scholar] [CrossRef]
- Copat, C.; Cristaldi, A.; Fiore, M.; Grasso, A.; Zuccarello, P.; Signorelli, S.S.; Conti, G.O.; Ferrante, M. The role of air pollution (PM and NO2) in COVID-19 spread and lethality: A systematic review. Environ. Res. 2020, 191, 110129. [Google Scholar] [CrossRef]
- Wang, B.; Chen, H.; Chan, Y.L.; Oliver, B.G. Is there an association between the level of ambient air pollution and COVID-19? Am. J. Physiol. Cell. Mol. Physiol. 2020, 319, L416–L421. [Google Scholar] [CrossRef]
- Domingo, J.L.; Marques, M.; Rovira, J. Influence of airborne transmission of SARS-CoV-2 on COVID-19 pandemic: A review. Environ. Res. 2020, 188. [Google Scholar]
- Bashir, M.F.; Ma, B.J.; Komal, B.; Bashir, M.A.; Farooq, T.H.; Iqbal, N.; Bashir, M. Correlation between environmental pollution indicators and COVID-19 pandemic: A brief study in Californian context. Environ. Res. 2020, 187. [Google Scholar] [CrossRef]
- Srivastava, A. COVID-19 and air pollution and meteorology-an intricate relationship: A review. Chemosphere 2021, 263, 128297. [Google Scholar] [CrossRef]
- Travaglio, M.; Yu, Y.; Popovic, R.; Selley, L.; Leal, N.S.; Martins, L.M. Links between air pollution and COVID-19 in England. Environ. Pollut. 2021, 268, 115859. [Google Scholar] [CrossRef] [PubMed]
- Zhang, X.; Tang, M.; Guo, F.; Wei, F.; Yu, Z.; Gao, K.; Jin, M.; Wang, J.; Chen, K. Associations between air pollution and COVID-19 epidemic during quarantine period in China. Environ. Pollut. 2021, 268, 115897. [Google Scholar] [CrossRef] [PubMed]
- Fan, H.; Zhao, C.; Yang, Y. A comprehensive analysis of the spatio-temporal variation of urban air pollution in China during 2014–2018. Atmos. Environ. 2020, 220, 117066. [Google Scholar] [CrossRef]
- Chen, C.; Zhang, H.; Li, H.; Wu, N.; Zhang, Q. Chemical characteristics and source apportionment of ambient PM1.0 and PM2.5 in a polluted city in North China plain. Atmos. Environ. 2020, 242, 117867. [Google Scholar] [CrossRef]
- Zhang, K.; Zhao, C.; Fan, H.; Yang, Y.; Sun, Y. Toward Understanding the Differences of PM2.5 Characteristics Among Five China Urban Cities. Asia Pac. J. Atmos. Sci. 2020, 56, 493–502. [Google Scholar] [CrossRef]
- Zhang, Z.; Xue, T.; Jin, X. Effects of meteorological conditions and air pollution on COVID-19 transmission: Evidence from 219 Chinese cities. Sci. Total Environ. 2020, 741, 140244. [Google Scholar] [CrossRef] [PubMed]
- Zhao, C.; Li, Y.; Zhang, F.; Sun, Y.; Wang, P. Growth rates of fine aerosol particles at a site near Beijing in June 2013. Adv. Atmos. Sci. 2018, 35, 209–217. [Google Scholar] [CrossRef]
- Zheng, C.; Zhao, C.; Li, Y.; Wu, X.; Zhang, K.; Gao, J.; Qiao, Q.; Ren, Y.; Zhang, X.; Chai, F. Spatial and temporal distribution of NO2 and SO2 in Inner Mongolia urban agglomeration obtained from satellite remote sensing and ground observations. Atmos. Environ. 2018, 188, 50–59. [Google Scholar] [CrossRef] [Green Version]
- Garrett, T.J.; Zhao, C.; Noel, P.C. Assessing the relative contributions of transport efficiency and scavenging to seasonal variability in Arctic aerosol. Tellus B 2010, 62, 190–196. [Google Scholar] [CrossRef]
- Sun, Y.; Zhao, C.; Su, Y.; Ma, Z.; Li, J.; Letu, H.; Yang, Y.; Fan, H. Distinct Impacts of Light and Heavy Precipitation on PM2.5 Mass Concentration in Beijing. Earth Space Sci. 2019, 6, 1915–1925. [Google Scholar] [CrossRef] [Green Version]
- Zhao, X.; Sun, Y.; Zhao, C.; Jiang, H. Distinct Impact of Precipitation with Different Intensity on PM2.5 over Typical Regions in China. Atmosphere 2020, 11, 906. [Google Scholar] [CrossRef]
- Adams, M.D. Air pollution in Ontario, Canada during the COVID-19 State of Emergency. Sci. Total Environ. 2020, 742, 140516. [Google Scholar] [CrossRef] [PubMed]
- Ghahremanloo, M.; Lops, Y.; Choi, Y.; Mousavinezhad, S. Impact of the COVID-19 outbreak on air pollution levels in East Asia. Sci. Total Environ. 2021, 754, 142226. [Google Scholar] [CrossRef] [PubMed]
- Ju, M.J.; Oh, J.; Choi, Y.-H. Changes in air pollution levels after COVID-19 outbreak in Korea. Sci. Total Environ. 2021, 750, 141521. [Google Scholar] [CrossRef]
- Hashim, B.M.; Al-Naseri, S.K.; Al-Maliki, A.; Al-Ansari, N. Impact of COVID-19 lockdown on NO2, O3, PM2.5 and PM10 concentrations and assessing air quality changes in Baghdad, Iraq. Sci. Total Environ. 2021, 754, 141978. [Google Scholar] [CrossRef]
- Lee, J.D.; Drysdale, W.S.; Finch, D.P.; Wilde, S.E.; Palmer, P.I. UK surface NO2 levels dropped by 42% during the COVID-19 lockdown: Impact on surface O3. Atmos. Chem. Phys. Discuss. 2020, 20, 15743–15759. [Google Scholar] [CrossRef]
- Petetin, H.; Bowdalo, D.; Soret, A.; Guevara, M.; Jorba, O.; Serradell, K.; García-Pando, C.P. Meteorology-normalized impact of the COVID-19 lockdown upon NO2 pollution in Spain. Atmos. Chem. Phys. Discuss. 2020, 20, 11119–11141. [Google Scholar] [CrossRef]
- Sicard, P.; De Marco, A.; Agathokleous, E.; Feng, Z.; Xu, X.; Paoletti, E.; Rodriguez, J.J.D.; Calatayud, V. Amplified ozone pollution in cities during the COVID-19 lockdown. Sci. Total Environ. 2020, 735, 139542. [Google Scholar] [CrossRef]
- Pathakoti, M.; Muppalla, A.; Hazra, S.; Dangeti, M.; Shekhar, R.; Jella, S.; Mullapudi, S.S.; Andugulapati, P.; Vijayasundaram, U. An assessment of the impact of a nation-wide lockdown on air pollution—A remote sensing perspective over India. Atmos. Chem. Phys. Discuss. 2020. [Google Scholar] [CrossRef]
- Dantas, G.; Siciliano, B.; França, B.B.; da Silva, C.M.; Arbilla, G. The impact of COVID-19 partial lockdown on the air quality of the city of Rio de Janeiro, Brazil. Sci. Total Environ. 2020, 729, 139085. [Google Scholar] [CrossRef]
- Bao, R.; Zhang, A. Does lockdown reduce air pollution? Evidence from 44 cities in northern China. Sci. Total Environ. 2020, 731, 139052. [Google Scholar] [CrossRef]
- Shi, X.; Brasseur, G.P. The Response in Air Quality to the Reduction of Chinese Economic Activities During the COVID-19 Outbreak. Geophys. Res. Lett. 2020, 47, 2020–088070. [Google Scholar] [CrossRef] [PubMed]
- Huang, X.; Ding, A.; Gao, J.; Zheng, B.; Zhou, D.; Qi, X.; Tang, R.; Wang, J.; Ren, C.; Nie, W.; et al. Enhanced secondary pollution offset reduction of primary emissions during COVID-19 lockdown in China. Natl. Sci. Rev. 2020, 8, 1–9. [Google Scholar] [CrossRef]
- Pei, Z.; Han, G.; Ma, X.; Su, H.; Gong, W. Response of major air pollutants to COVID-19 lockdowns in China. Sci. Total Environ. 2020, 743, 140879. [Google Scholar] [CrossRef]
- Shen, L.; Zhao, T.; Wang, H.; Liu, J.; Bai, Y.; Kong, S.; Zheng, H.; Zhu, Y.; Shu, Z. Importance of meteorology in air pollution events during the city lockdown for COVID-19 in Hubei Province, Central China. Sci. Total Environ. 2021, 754, 142227. [Google Scholar] [CrossRef]
- Yuan, Q.; Qi, B.; Hu, D.; Wang, J.; Zhang, J.; Yang, H.; Zhang, S.; Liu, L.; Xu, L.; Li, W. Spatiotemporal variations and reduction of air pollutants during the COVID-19 pandemic in a megacity of Yangtze River Delta in China. Sci. Total Environ. 2021, 751, 141820. [Google Scholar] [CrossRef]
- Hersbach, H.; Bell, B.; Berrisford, P.; Hirahara, S.; Horanyi, A.; Munoz-Sabater, J.; Peubey, C.; Radu, R.; Schepers, D.; Simmons, A.; et al. The ERA global reanalysis. Quaterly J. R. Meteorol. Soc. 2020, 146, 1999–2049. [Google Scholar] [CrossRef]
- Ramon, J.; Lledó, L.; Torralba, V.; Soret, A.; Doblas-Reyes, F.J. What global reanalysis best represents near-surface winds? Quaterly J. R. Meteorol. Soc. 2019, 145, 3236–3251. [Google Scholar] [CrossRef] [Green Version]
- Chang, Y.; Huang, R.; Ge, X.; Huang, X.; Hu, J.; Duan, Y.; Zou, Z.; Liu, X.; Lehmann, M.F. Puzzling Haze Events in China During the Coronavirus (COVID-19) Shutdown. Geophys. Res. Lett. 2020, 47, e2020GL088533. [Google Scholar] [CrossRef]
- Chen, Z.; Hao, X.; Zhang, X.; Chen, F. Have traffic restrictions improved air quality? A shock from COVID-19. J. Clean. Prod. 2021, 279, 123622. [Google Scholar] [CrossRef] [PubMed]
- Kanniah, K.D.; Zaman, N.A.F.K.; Kaskaoutis, D.G.; Latif, M.T. COVID-19’s impact on the atmospheric environment in the Southeast Asia region. Sci. Total Environ. 2020, 736, 139658. [Google Scholar] [CrossRef] [PubMed]
- Higham, J.; Ramírez, C.A.; Green, M.; Morse, A.P. UK COVID-19 lockdown: 100 days of air pollution reduction? Air Qual. Atmos. Health 2020, 1–8. [Google Scholar] [CrossRef]
- Zhao, J.; Qiu, Y.; Zhou, W.; Xu, W.; Wang, J.; Zhang, Y.; Li, L.; Xie, C.; Wang, Q.; Du, W.; et al. Organic Aerosol Processing During Winter Severe Haze Episodes in Beijing. J. Geophys. Res. Atmos. 2019, 124, 10248–10263. [Google Scholar] [CrossRef]
- Pan, J.; Yao, Y.; Liu, Z.; Meng, X.; Ji, J.S.; Qiu, Y.; Wang, W.; Zhang, L.; Wang, W.; Kan, H. Warmer weather unlikely to reduce the COVID-19 transmission: An ecological study in 202 locations in 8 countries. Sci. Total Environ. 2021, 753, 142272. [Google Scholar] [CrossRef] [PubMed]
- Yang, X.; Zhao, C.; Zhou, L.; Wang, Y.; Liu, X. Distinct impact of different types of aerosols on surface solar radiation in China. J. Geophys. Res. Atmos. 2016, 121, 6459–6471. [Google Scholar] [CrossRef]
- Singh, V.; Singh, S.; Biswal, A.; Kesarkar, A.P.; Mor, S.; Ravindra, K. Diurnal and temporal changes in air pollution during COVID-19 strict lockdown over different regions of India. Environ. Pollut. 2020, 266, 115368. [Google Scholar] [CrossRef] [PubMed]
- Le, T.; Wang, Y.; Liu, L.; Yang, J.; Yung, Y.L.; Li, G.; Seinfeld, J.H. Unexpected air pollution with marked emission reductions during the COVID-19 outbreak in China. Science 2020, 369, 702–704. [Google Scholar] [CrossRef]
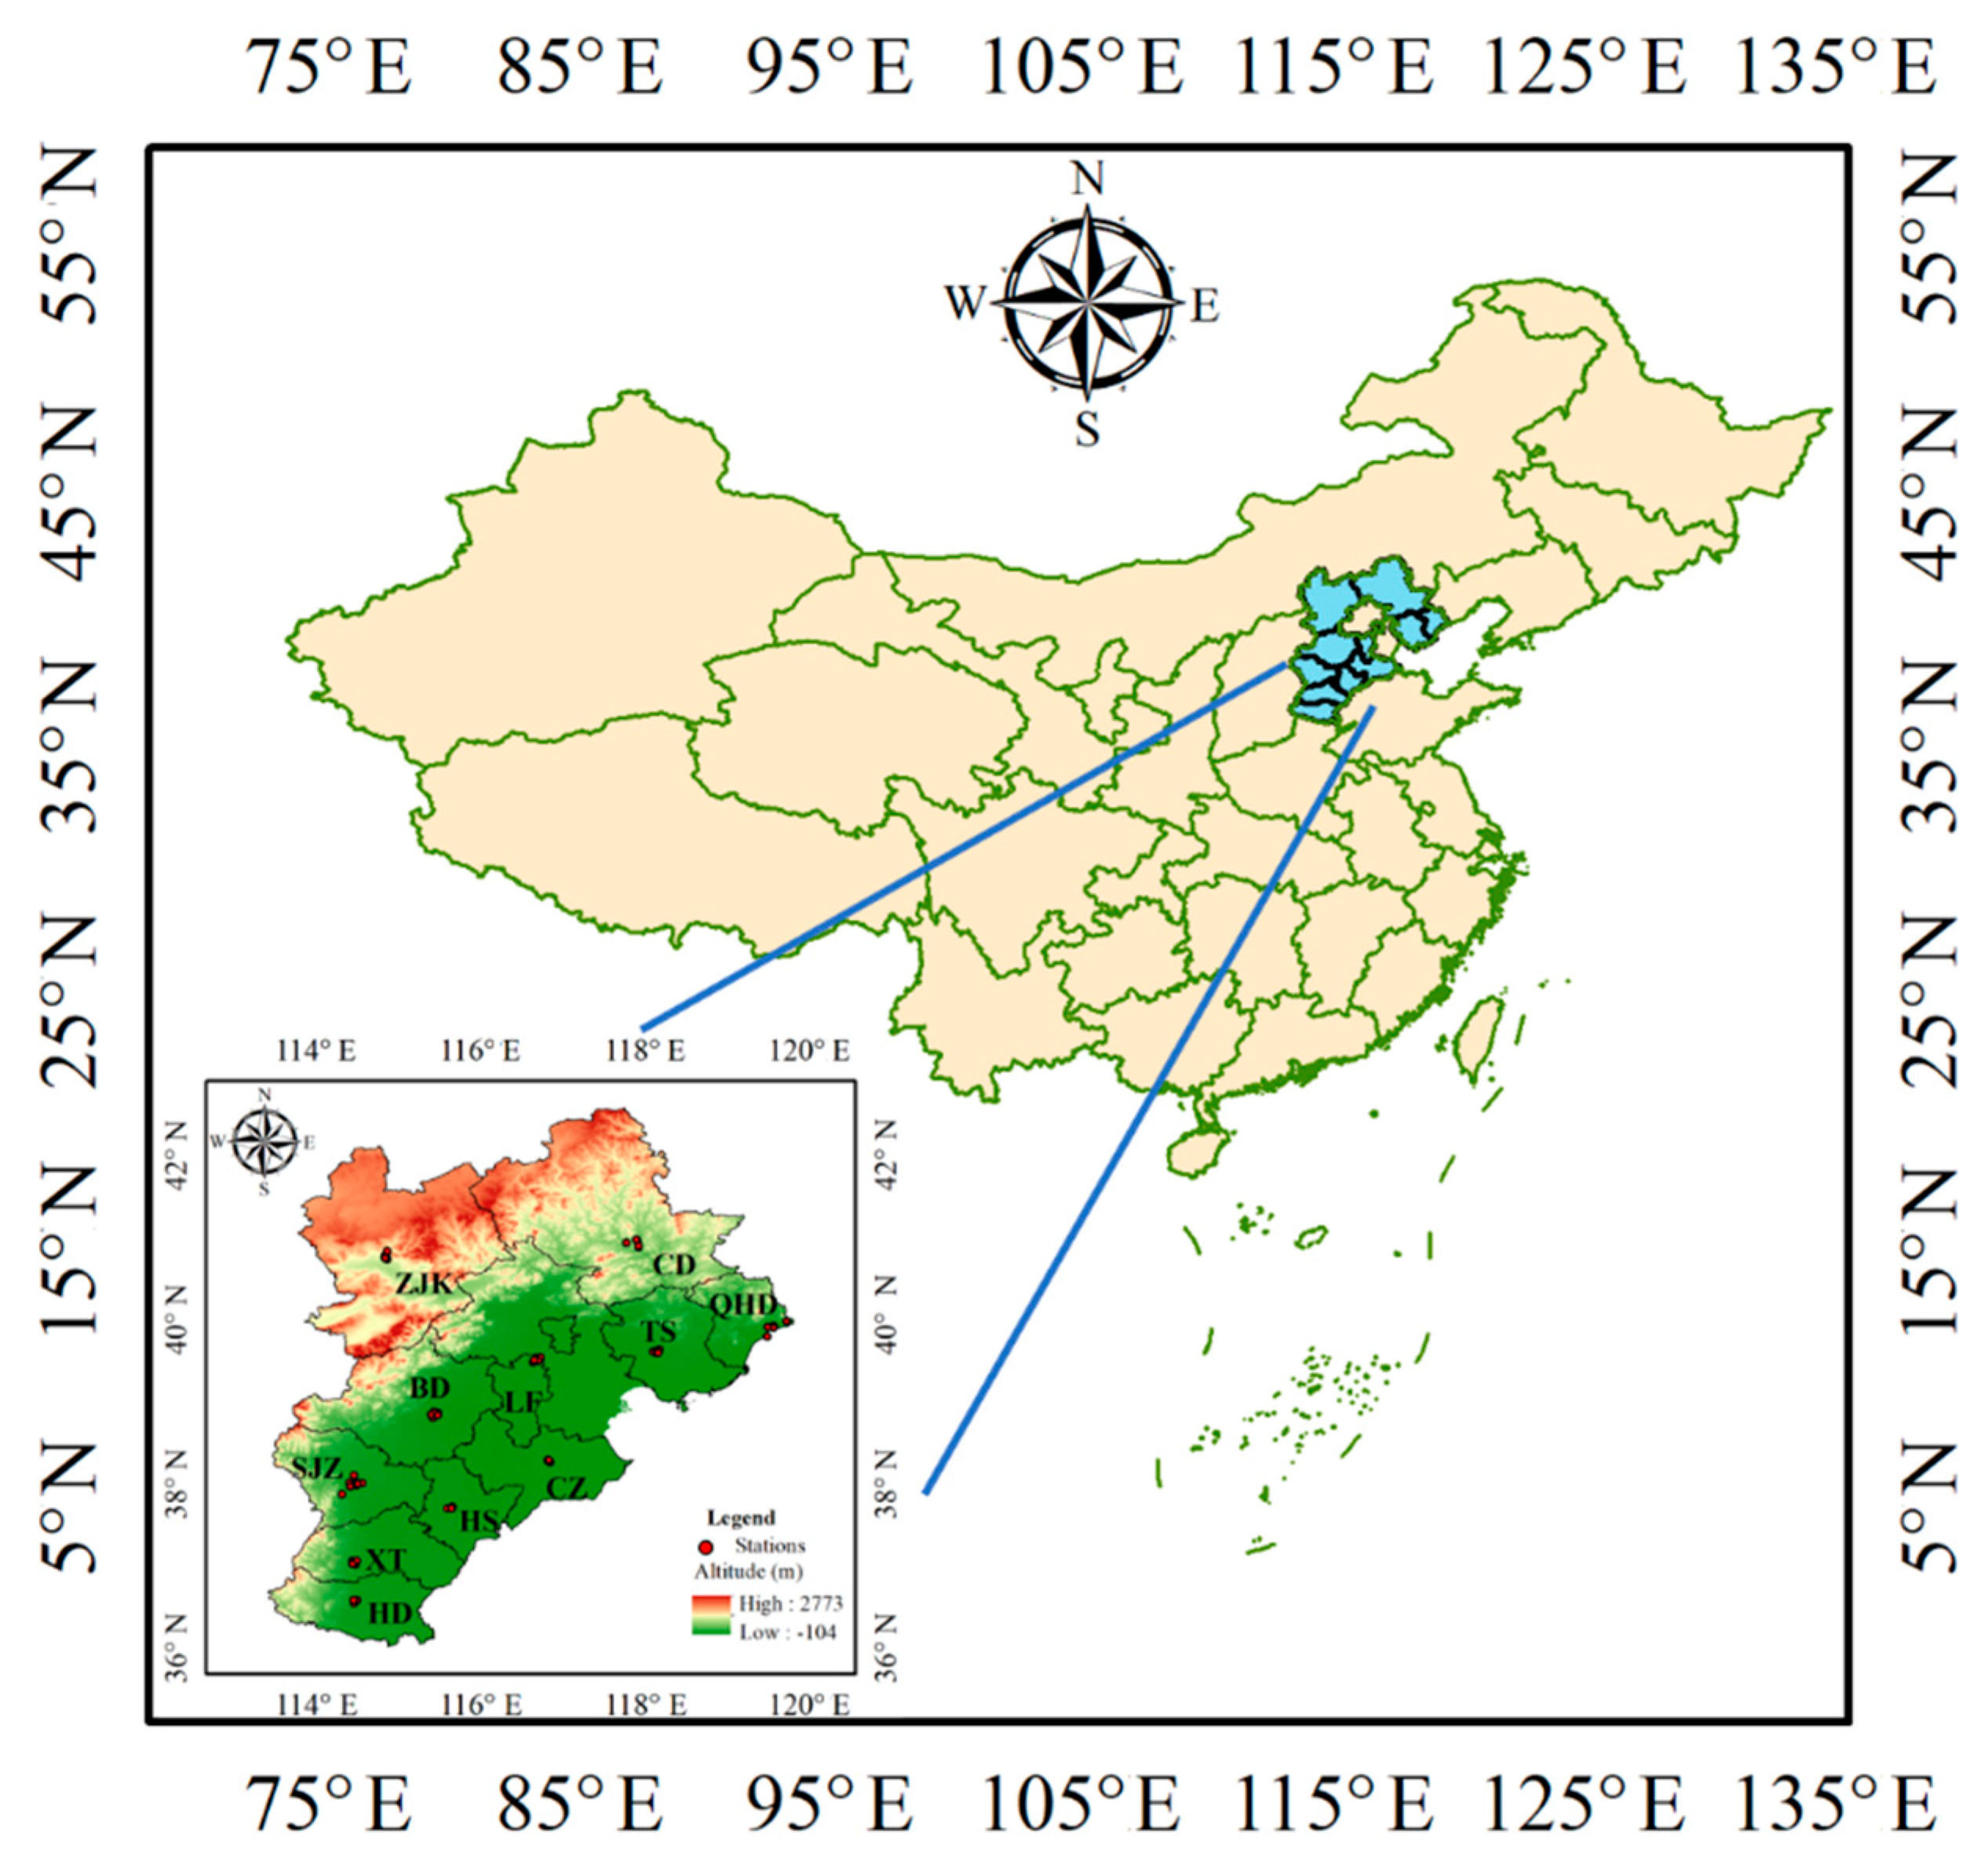
Figure 1.
The study region along with the cities and ground station locations in China. The abbreviations of each city are the first alphabet of the city, which is listed in Table 1 in detail.
Figure 1.
The study region along with the cities and ground station locations in China. The abbreviations of each city are the first alphabet of the city, which is listed in Table 1 in detail.

Figure 2.
The average values (colored columns) and standard deviations (black bars) of six air pollutants during the six different time periods examined. The red and blue colors represent the air pollutant concentrations during the three study periods in 2020, and during the same periods in day and month while in 2019, respectively.

Figure 3.
The probability density function (PDF) of six types of pollutants during the three study periods of pre-lockdown (black color), lockdown (red color), and post-lockdown (blue color).
Figure 3.
The probability density function (PDF) of six types of pollutants during the three study periods of pre-lockdown (black color), lockdown (red color), and post-lockdown (blue color).

Figure 4.
Diurnal variation of six types of pollutants during the six study periods. The lines represent the mean values. The red and blue colors represent the air pollutant concentrations during the three study periods in 2020, and during the same periods in day and month while in 2019, respectively. Each row of subgraphs is for the same pollutant while with different study periods.

Figure 5.
The average values (colored columns) and standard deviations (black bars) of six types of air pollutants during the three study time periods of pre-lockdown (blue color), lockdown (red color), and post-lockdown (orange color) in 2020 for 11 cities in Hebei province in China. See Table 1 for details about the city names.

Figure 6.
The time series of PM2.5 during the three study periods of pre-lockdown (first panel), lockdown (second panel), and post-lockdown (third panel) in 2020, along with the classification of pollution (above the threshold 75 line with 24 h), moderate (between the threshold 75 and threshold 35 lines), and clean days (below threshold 35 lines with 24 h). Prepresents pollution events and C represents clean events with the event numbers indicated.

Figure 7.
Distribution of the 10m winds averaged for clean events C1 (a), C2 (b), and C4 (c), and pollution events P1 (d), P2 (e), and P3 (f) during lockdown period. The red part is the research area of this study, and the reference wind speed is 4 m/s.
Figure 7.
Distribution of the 10m winds averaged for clean events C1 (a), C2 (b), and C4 (c), and pollution events P1 (d), P2 (e), and P3 (f) during lockdown period. The red part is the research area of this study, and the reference wind speed is 4 m/s.


Table 1.
The full name and acronym of the 11 prefecture-level cities, along with the ground station number in each city.
Table 1.
The full name and acronym of the 11 prefecture-level cities, along with the ground station number in each city.
| City Name. | City Acronym | Station Number |
|---|---|---|
| Zhangjiakou | ZJK | 6 |
| Chengde | CD | 5 |
| Baoding | BD | 6 |
| Qinhuangdao | QHD | 5 |
| Tangshan | TS | 6 |
| Langfang | LF | 5 |
| Cangzhou | CZ | 3 |
| Hengshui | HS | 3 |
| Shijiazhuang | SJZ | 8 |
| Xingtai | XT | 4 |
| Handan | HD | 4 |
Table 2.
The time range for 6 study periods.
| Name. | Time |
|---|---|
| pre-lockdown | 1–31 January 2020 |
| lockdown | 1 February–15 March 2020 |
| post-lockdown | 15 March–8 May 2020 |
| SP pre-lockdown | 1–31 January 2019 |
| SP lockdown | 1 February–15 March 2019 |
| SP post-lockdown | 15 March– 8 May 2019 |
Table 3.
Decreasing ratio (DR) values for all air pollutants during pre-lockdown period (DR1), lockdown period (DR2), and post-lockdown period (DR3) compared to their SP19.
Table 3.
Decreasing ratio (DR) values for all air pollutants during pre-lockdown period (DR1), lockdown period (DR2), and post-lockdown period (DR3) compared to their SP19.
| DR. | SO2 | NO2 | CO | PM10 | PM2.5 | O3 |
|---|---|---|---|---|---|---|
| DR1 | −34.3% | −14.9% | −3.2% | −9.3% | 8.0% | 32.7% |
| DR2 | −39.2% | −38.2% | −24.8% | −42.1% | −39.8% | 8.0% |
| DR3 | −13.7% | −8.9% | −10.6% | −16.8% | −13.4% | 5.5% |
Table 4.
The occurrence frequencies of clean days, moderate pollution days and pollution days for the 6 study periods.
Table 4.
The occurrence frequencies of clean days, moderate pollution days and pollution days for the 6 study periods.
| Percentage | Clean | Moderate | Pollution |
|---|---|---|---|
| SP pre-lockdown | 6.5% | 71.0% | 22.6% |
| Pre-lockdown | 0% | 67.8% | 32.3% |
| SP lock-down | 11.6% | 65.1% | 23.3% |
| Lockdown | 34.1% | 45.5% | 20.5% |
| SP post-lockdown | 42.6% | 57.4% | 0% |
| Post-lockdown | 51.9% | 50.7% | 0% |
Table 5.
The information of time period, duration days, and boundary layer height averaged for each clean and pollution event during the lockdown period, along with the peak value of PM2.5 during pollution events. Note that P means pollution event and C means clean event. D is the duration days and PV is the Peak value of PM2.5 during pollution event.
| Incidents | Time | D | PV (μg m−3) | BLH (m) |
|---|---|---|---|---|
| P4 | 2.11–2.14 | 4 | 116.2 | 268.5 |
| P5 | 2.19–2.21 | 3 | 115.6 | 497.4 |
| P6 | 3.8–3.9 | 2 | 122.2 | 476.7 |
| C1 | 2.15–2.18 | 4 | - | 723.6 |
| C2 | 2.21–2.23 | 3 | - | 537.7 |
| C3 | 3.3–3.5 | 3 | - | 534.7 |
| C4 | 3.12–3.15 | 4 | - | 720.9 |
Publisher’s Note: MDPI stays neutral with regard to jurisdictional claims in published maps and institutional affiliations. |
© 2021 by the authors. Licensee MDPI, Basel, Switzerland. This article is an open access article distributed under the terms and conditions of the Creative Commons Attribution (CC BY) license (http://creativecommons.org/licenses/by/4.0/).
Share and Cite
MDPI and ACS Style
Jiang, S.; Zhao, C.; Fan, H. Toward Understanding the Variation of Air Quality Based on a Comprehensive Analysis in Hebei Province under the Influence of COVID-19 Lockdown. Atmosphere 2021, 12, 267. https://doi.org/10.3390/atmos12020267
AMA Style
Jiang S, Zhao C, Fan H. Toward Understanding the Variation of Air Quality Based on a Comprehensive Analysis in Hebei Province under the Influence of COVID-19 Lockdown. Atmosphere. 2021; 12(2):267. https://doi.org/10.3390/atmos12020267
Chicago/Turabian StyleJiang, Shuyi, Chuanfeng Zhao, and Hao Fan. 2021. "Toward Understanding the Variation of Air Quality Based on a Comprehensive Analysis in Hebei Province under the Influence of COVID-19 Lockdown" Atmosphere 12, no. 2: 267. https://doi.org/10.3390/atmos12020267
Note that from the first issue of 2016, this journal uses article numbers instead of page numbers. See further details here.