
COVID-19 Recognition Using Ensemble-CNNs in Two New Chest X-ray Databases
by
 , , , , and
Edoardo Vantaggiato
1 ,
,
Emanuela Paladini
1,
Fares Bougourzi
2,
Cosimo Distante
1,3,* ,
,
Abdenour Hadid
2 and
Abdelmalik Taleb-Ahmed
2,*
1
Department of Innovation Engineering, University of Salento, 73100 Lecce, Italy
2
IEMN UMR CNRS 8520, Université Polytechnique Hauts de France, UPHF, 59300 Famars, France
3
Institute of Applied Sciences and Intelligent Systems, National Research Council of Italy, 73100 Lecce, Italy
*
Authors to whom correspondence should be addressed.
Sensors 2021, 21(5), 1742; https://doi.org/10.3390/s21051742
Submission received: 21 January 2021
/
Revised: 14 February 2021
/
Accepted: 23 February 2021
/
Published: 3 March 2021
(This article belongs to the Section Sensing and Imaging)
Abstract
:The recognition of COVID-19 infection from X-ray images is an emerging field in the learning and computer vision community. Despite the great efforts that have been made in this field since the appearance of COVID-19 (2019), the field still suffers from two drawbacks. First, the number of available X-ray scans labeled as COVID-19-infected is relatively small. Second, all the works that have been carried out in the field are separate; there are no unified data, classes, and evaluation protocols. In this work, based on public and newly collected data, we propose two X-ray COVID-19 databases, which are three-class COVID-19 and five-class COVID-19 datasets. For both databases, we evaluate different deep learning architectures. Moreover, we propose an Ensemble-CNNs approach which outperforms the deep learning architectures and shows promising results in both databases. In other words, our proposed Ensemble-CNNs achieved a high performance in the recognition of COVID-19 infection, resulting in accuracies of 100% and 98.1% in the three-class and five-class scenarios, respectively. In addition, our approach achieved promising results in the overall recognition accuracy of 75.23% and 81.0% for the three-class and five-class scenarios, respectively. We make our databases of COVID-19 X-ray scans publicly available to encourage other researchers to use it as a benchmark for their studies and comparisons.
1. Introduction
Since the appearance of COVID-19 in the city of Wuhan, China, at the end of 2019, great efforts have been made to recognize this disease. Reverse Transcription Polymerase Chain Reaction (RT-PCR) is the definitive test for the recognition of COVID-19 disease. However, RT-PCR test is a time-consuming, laborious, and complicated manual process [1]. In addition, test kits are only available in limited numbers worldwide [1]. On the other hand, the rate of false negatives varies depending on how long the infection has been present. In [2], the false-negative rate was 20% when testing was performed five days after symptoms began, but much higher (up to 100%) earlier in the infection.
Chest X-ray scans show visual indexes associated with COVID-19 [3]. In addition, chest X-ray scans are a fast, effectivem and affordable test to identify COVID-19 infection [4]. Despite the availability of chest X-ray scans, an expert radiologist is needed to identify the COVID-19 infection. Because of the huge number of infections, the healthcare systems have already been overwhelmed around the world. Artificial Intelligence (AI) systems can provide an alternative solution for the automatic diagnosis of COVID-19 infections and differentiate them from other diseases [5].
Many Artificial Intelligence (AI) systems have proved their efficiency in medical images analysis, such as pneumonia detection [6] semantic segmentation [7]. Similarly, many AI systems based on deep learning have been proposed and their performance has shown promising results in the diagnosis of COVID-19 infection from chest X-ray images [4,5,8,9,10]. The ability of deep convolutional neural networks to extract relevant and high-level features directly from data makes them more powerful than Hand-crafted methods [11]. Hand-crafted methods are based on extracting the features using designed models [12].
Since the appearance of COVID-19, great efforts have been made to recognize COVID-19 infection from X-ray scans. However, this field has not achieved great progress in the recognition of COVID-19 infection as a real application, and this is due to two main drawbacks. The first drawback is the limitation of COVID-19 X-ray scans. The second drawback is that there are no unified protocols, classes, and data. In the literature, each work defines its own protocol, classes, and data, and this makes comparison between different methods difficult. In this work, we aim to unify the efforts in this field. First, we created a great number of COVID-19 X-ray scans. In addition, we defined two scenarios for differentiating COVID-19 scans from scans of other lung diseases in three-class and five-class scenarios. Furthermore, we defined train/val/test splits to allow better comparison between different methods. We make our databases of COVID-19 X-ray scans publicly available to encourage other researchers to use them as a benchmark for their studies. The main contributions of this paper are:
- We created the largest COVID-19 X-ray scan database, with 504 scans collected from open sources and 207 new scans collected from the Hospital of Tolga, Algeria.
- We proposed two scenarios to distinguish between COVID-19 disease, other lung diseases, and healthy cases. In the first scenario, we created a three-class X-ray scan database which consists of three classes: Normal, COVID-19, and other Pneumonia diseases. In the second scenario, we created five-class X-ray database which includes the following classes: Normal, COVID-19, Viral Pneumonia, Bacterial Pneumonia, and Lung Opacity No Pneumonia. Furthermore, we divided both databases into training, validation, and test sets. Most of the testing data classes were taken from new sources that were not used to create the training and validation sets.
- In order to distinguish between COVID-19 infection and other Lung diseases, we used deep learning architectures for both scenarios (three classes and five classes). In addition, we proposed an Ensemble-CNNs approach based on the trained deep learning architectures.
- We make our codes and databases of COVID-19 X-ray scans publicly available to encourage other researchers to use it as a benchmark for their studies. (https://github.com/Edo2610/Covid-19_X-ray_Two-proposed-Databases (accessed on 2 March 2021), https://www.kaggle.com/edoardovantaggiato/covid19-xray-two-proposed-databases (accessed on 27 February 2021)).
This paper is organized in following way: In Section 2, we describe some of the state-of-the-art works. Section 3 consists of our proposed evaluation scenarios, illustrations of our proposed databases, and a description of the used methods and evaluation metrics. Our proposed approach is presented in Section 4. Section 5 includes the experimental setup and the results of the two defined scenarios. We compare our results with the state-of-the-art methods in Section 6. Finally, concluding remarks are given in Section 7.
2. Related Works
Motivated by the success of deep learning methods in many computer vision tasks, most of the existing works for the recognition of COVID-19 infection from X-ray scans have used deep leaning methods [4,5,8,9,10,13].
Hemdan et al. [14] tested seven different CNN architectures, including VGG-19 [15], DenseNet-121 [16], Inception-V3 [17], ResNet-V2 [18], InceptionResNet-V2 [19], Xception [20], and Google MobileNet-V2 [21]. Their database contains only 25 COVID-19 cases and they consider a binary classification of positive and negative COVID-19 infection. Their results showed that the VGG-19 and DenseNet-121 models achieved the best performance, where both architectures reached a 0.91 F1-score for COVID-19 infection and 0.89 for non-COVID-19 infection.
Mangal et al. [22] used CheXNet [23], which was trained on the ChestX-ray8 database [24]. They used transfer learning to recognize the COVID-19 infection within three- and four-class scenarios. They achieved a promising result with a recognition rate for COVID-19 infection equal to 90.5% in the three-class scenario.
In [4], Yoo et al. proposed a deep learning-based decision-tree classifier based on three binary decisions. Each binary decision is a trained ResNet-18 [18] architecture:
- First decision tree classifies the input image as normal or abnormal. The accuracy of this decision tree is 98%.
- Second decision tree identifies abnormal images that contain signs of tuberculosis (TB) or not. The accuracy of this decision tree is 80%.
- Third decision tree classifies abnormal images that contain signs of COVID-19 or not. The accuracy of this decision tree is 95%.
M. Turkoglu proposed the COVIDetectioNet [1] framework, which consists of three steps. First, the pre-trained AlexNet architecture [25] is used with transfer learning. In second step, the trained Alexnet is used to extract deep features from all layers. These features are concatenated to produce the combined features. In the final step, the Relief algorithm [26] is used to select the most relevant features from the combined features, then they are fed to a Support Victor Machine (SVM) classifier [27]. His approach showed a promising result in the used database, which consists of three classes: COVID-19, Pneumonia, and Normal. In [13], I.D. Apostolopoulos et al. tested five CNN architectures, VGG-19 [15], MobileNet-v2 [21], Inception [17], Xception [20], and Inception-ResNet-v2 [19], on two databases which were collected from different public resources. From their obtained results, the VGG-19 and MobileNet architectures achieved the best performance compared with the other used CNN architectures. In [28], A. T. Sahlol proposed using deep features that were extracted from the Inception architecture and a swarm-based feature selection algorithm to recognize COVID-19 infection from the X-ray scans. Their approach achieved considerable improvement compared with the set of feature selection algorithms and CNNs architectures.
Table 1 summarises the mentioned state-of-the-art works, the used databases, and the obtained results. From this table, we can notice that the used databases are different from one work to another with a small number of X-ray scans, specially for the COVID-19 class. Moreover, each work defines different classes and evaluation protocols. This motivated us to collect the available COVID-19 X-ray scans, provide our own COVID-19 X-ray scans, and define the evaluation protocol and scenarios.
3. Methodology
In this section, we will discuss the proposed evaluation scenarios and databases. In addition, we will describe the used CNN architectures, loss functions, and evaluation metrics.
3.1. Evaluation Scenarios
Most of the literature studies have dealt with the recognition of two or three classes of COVID-19-related diseases using initially small databases [1,9,13,14,22]. In our work, two scenarios are investigated to distinguish COVID-19 infection from other Lung diseases. In the first scenario, we defined three classes, which are:
- Healthy.
- COVID-19.
- Other pneumonia diseases.
To train our models, we collected 504 X-ray scans for each class. In this scenario, we evaluated the performance of three most popular CNN architectures (Densnet-151, Inception-v3, and ResneXt-50) and our proposed Ensemble-CNNs approach. In the training phase, we divided the 504 X-ray scans of each class into training–validation splits (80%–20%). To train the deep learning models, we used data-augmentation techniques for the training split to gain 6048 augmented X-ray scans for each class. In the testing phase, we used 207 X-ray scans for each class, where the X-ray scans of COVID-19 were obtained from the Hospital of Tolga, Algeria. For the other image classes, we emphasized collecting them from new sources that were not used in the creation of the training and validation splits. Here, we aim to study the performance of the methods in different conditions, which can include variation in the illumination, contrast, and recording device used.
In the second scenario, we identified four classes of Lung Diseases and Normal. The classes of the second scenario are:
- Normal.
- COVID-19.
- Viral Pneumonia.
- Bacterial Pneumonia.
- Lung Opacity No Pneumonia.
Similar to the first scenario, we used 504 X-ray scans as training–validation splits (80%–20%), then the same data augmentation techniques were used for the training split. In the testing phase, we used 207 X-ray scans for each class, where the X-ray scans of COVID-19 were obtained from the Hospitals of Tolga, Algeria. Similar to the three-class database, we emphasized collecting the non-COVID-19 images from new sources that were not used for creating the training and validation splits. The goal is to study the performance of the methods in different conditions that can include variation in the illumination, contrast, and recording device used.
3.2. Databases
Most of the state-of-the-art databases for recognizing COVID-19 infection from X-ray scans consider just two or three classes. The two classes are COVID-19 and Healthy, which were used in [14]. Meanwhile, the three classes are COVID-19, Healthy, and Pneumonia, which were used in [1,9,22]. In our work, we investigated two scenarios.
In the first scenario, we considered three classes, which are COVID-19, Pneumonia, and Normal (or Healthy). Meanwhile, in the second scenario we considered five classes, where the Pneumonia can be classified into Bacterial Pneumonia and Viral Pneumonia. As a fifth class, we considered Lung Opacity Not Pneumonia disease, including all lung diseases that are not Pneumonia. To the best of our knowledge, this is the first time that five lung diseases including COVID-19 have been studied. We used the following resources to create our databases:
- 1.
- Ieee8023 COVID-19 Chest X-Ray database [29] is the main database used in most the state-of-the-art papers, from which we took 504 COVID-19 X-ray images. In this database, there are others classes but with few images. License: Apache 2.0, CC BY-NC-SA 4.0, CC BY 4.0
- 2.
- Chest X-Ray Images (Pneumonia) [30] from Kaggle that contains a lot of images for the classes Pneumonia and Normal. For Pneumonia images, there are two classes, which are Bacterial and Viral. License: CC BY 4.0
- 3.
- RSNA Pneumonia Detection Challenge [31] from Kaggle. From this source, we took only Normal and Pneumonia images. In the Pneumonia class there is no distinction between types. License: Open Source
- 4.
- CheXpert [32] is a large chest X-ray database from which we took Normal images, and it is the only database that includes Lung Opacity images. License: Public database
- 5.
- China CXR set and Montgomery set [33] are two public databases that contain both Normal as well as tuberculosis X-rays. We used tuberculosis images for the Bacterial Pneumonia class. License: Public database
In addition to the use of above open source databases, we collected 207 unpublished X-ray samples for the COVID-19 class from the Hospital of Tolga, Algeria. These COVID-19 scans were used as testing data. In addition, we selected 207 images as testing data for the other classes. Most of the testing data classes were taken from new sources that were not used to create the training data for both the three- and five-class scenarios.
3.2.1. Three-Class COVID-19 Database
We created the three-class database using all the available COVID-19 scans. In order to create a balanced database, we selected 504 images for each class since there are just 504 COVID-19 samples that are publicly available. For training and validating our models, we randomly split the three-class database into training and validation splits (80%–20%).
Since Deep Learning methods require huge amounts of labeled data for training, which is actually not available for the COVID-19 class, we used data augmentation techniques to cope with this issue. By applying the following data augmentation techniques for the training split, we obtained 12 augmented images for each image:
- Color jitter with brightness = 0.2, contrast = 0.2.
- Padding of 10 applied on each border.
- Random Horizontal flip.
- Random Perspective with distortion scale = 0.5.
- Random Rotation from -30 to 30 degree.
- Random Crop making sure that the smaller size remains at least 224px.
Each of the first five data augmentation techniques has an application probability equal to 50%.
3.2.2. Five-Class Covid-19 Database
In order to distinguish between COVID-19 and the other lung diseases and healthy cases, we created a five-class COVID-19 database. In fact, COVID-19 is a viral pneumonia, so we aim to distinguish between Bacterial, Viral Pneumonia, COVID-19, and Healthy cases. In addition, we considered Lung Opacity Not Pneumonia diseases as the fifth class. Similar to the three-class COVID-19 database, we used data augmentation techniques to obtain augmented data to train our models. The same data augmentation techniques were applied for the training split to obtain 12 augmented images for each image. Table 3 summarizes the five-class COVID-19 database number of images by split and their resources. Figure 2 shows an X-ray example for each class of the five-class COVID-19 database.
3.3. CNN Architectures
In our experiments, we used three of the most powerful pre-trained CNN models, which are: ResNeXt-50 [34], Inception-v3 [17], and DenseNet-161 [16].
3.3.1. ResNeXt-50
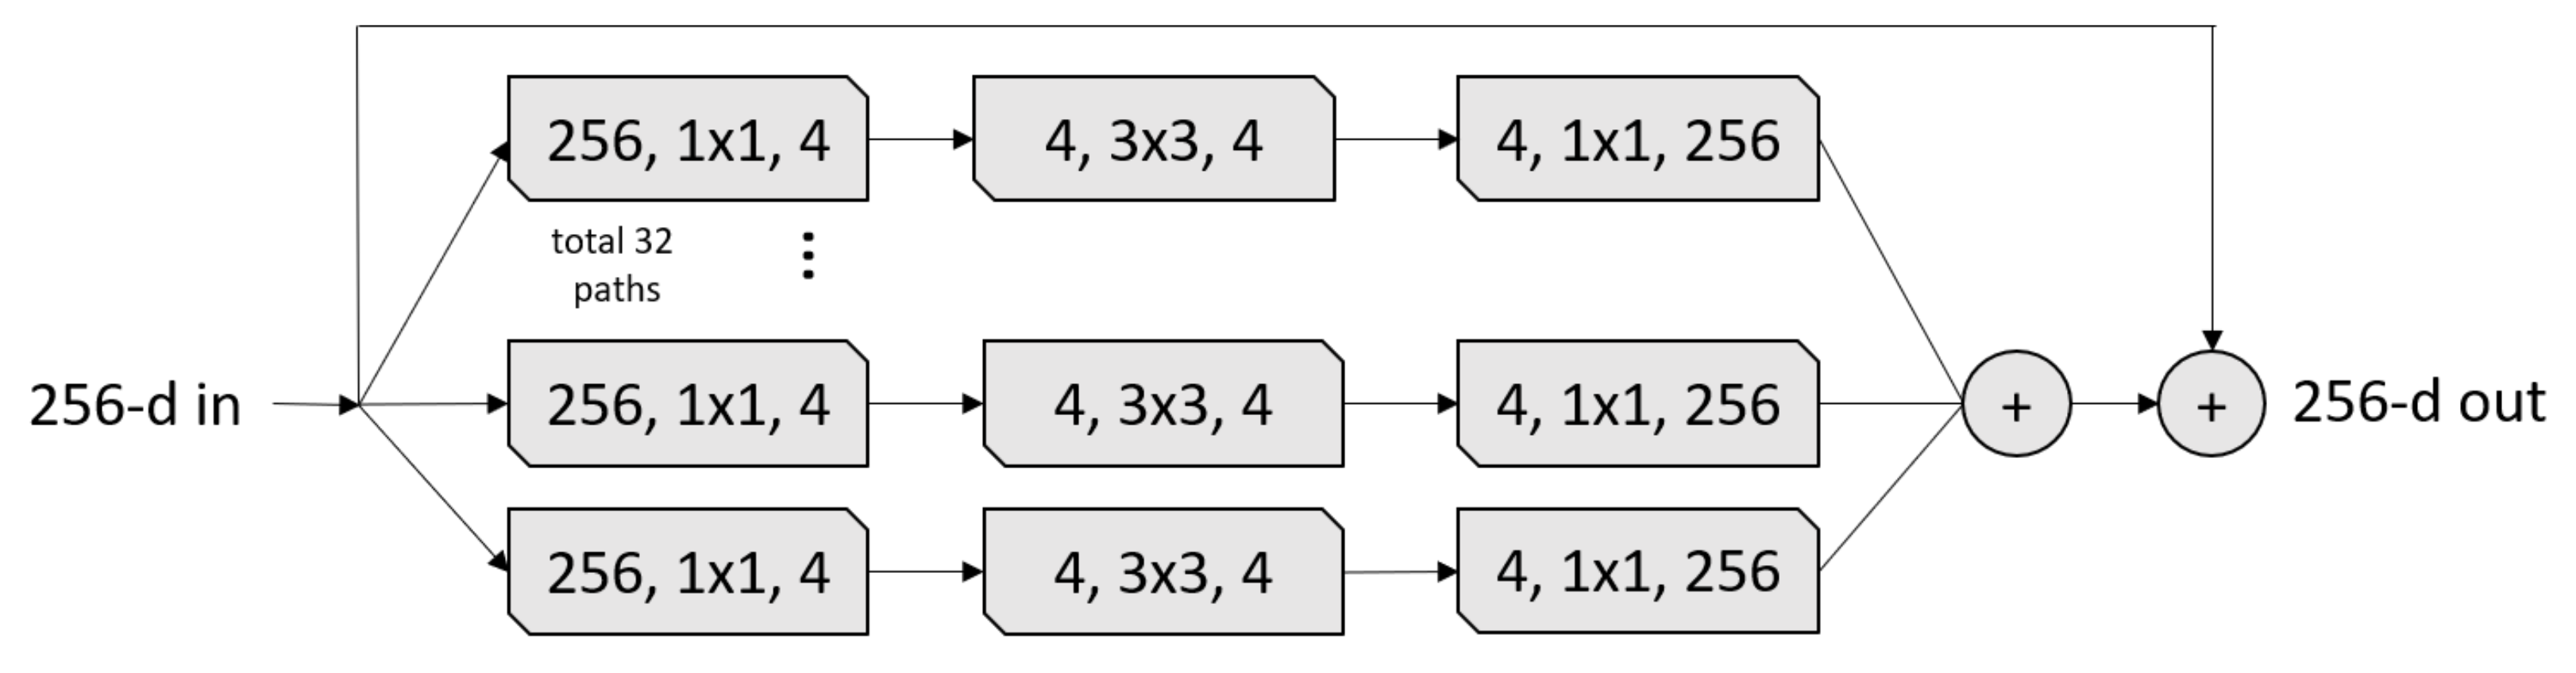
The ResNeXt [34] architecture inherited its structure from three CNN architectures: VGG, ResNet, and Inception. From the VGG architecture, ResNext leveraged repeating layers to build a deep architecture model. ResNeXt uses the idea of shortcut from the previous layer to the next layer from the ResNet architecture. Similar to the Inception block, the ResNeXt block adopts a split-transform-merge strategy (branched paths within a single module), as shown in Figure 3. In the ResNeXt block shown in Figure 3, the input is split into a few lower-dimensional embeddings (by 1 × 1 convolutions) with 32 paths each for four channels, then all paths are transformed by the same topology filters of size . Finally, the paths are merged by summation. In our experiments, we used the ResneXt-50 pre-trained model, which was trained on ImageNet challenge database [25]. The ResNeXt-50 construction is summarized in Table 4.
3.3.2. Inception-v3
Inception-v3 [17] is the third version of the Google Inception architecture family [35]. Since choosing the right kernel size is challenging for CNN architectures, Inception networks use filters with multiple sizes that operate on the same level, which makes the networks wider instead of deeper. In summary, Inception-v3 has several improvements over the previous versions, including:
- 1.
- Factorized convolutions;
- 2.
- Smaller convolutions;
- 3.
- Asymmetric convolutions;
- 4.
- Auxiliary classifier;
- 5.
- Grid size reduction.
3.3.3. DenseNet-161
Densnet networks [16] seek to solve the problem of CNNs when going deeper. This is because the path for information from the input layer until the output layer (and for the gradient in the opposite direction) becomes so big that they can be lost before reaching the other side. G. Huang et al. [16] proposed to connect each layer to every other layers in a feed-forward fashion (as shown in Figure 7) to ensure maximum information flow between layers in the network. In our experiments, we used the DenseNet-161 pre-trained model, which was trained on the ImageNet challenge database [25]. The DenseNet-161 architecture is summarized in Table 6.
3.4. Loss Function
In our experiments, we used the Focal loss function [36], which was used for one-stage object detectors. Focal loss function has proven its efficiency in many classification tasks [37,38]. The multi-classes focal loss is formulated in the following equation:
where C denotes the number of categories, denotes a real probability distribution, denotes the probability distribution of the prediction, and is the focusing parameter which is used to control the rate at which easy examples are down-weighted.
In more detail, the Focal loss function applies a modulating term to the cross-entropy loss in order to focus learning on hard negative examples. It is a dynamically scaled cross entropy loss where the scaling factor decays to zero as confidence in the correct class increases. Intuitively, this scaling factor can automatically down-weight the contribution of easy examples during training and rapidly focus the model on hard examples.
3.5. Evaluation Metrics
To evaluate the performance of our models, we used six metrics: Accuracy, Precision, Sensitivity, specificity, F1-score, and Area Under the ROC Curve (AUC). The Accuracy calculates the exact percentage of the correct predicted images with respect to the total images that were used. The formula for accuracy is as following:
The formulae of Precision, Sensitivity, specificity, and F1-score are defined by:
The last evaluation metric is Area Under the ROC Curve (AUC), which is calculated by adding successive trapezoid areas below the Receiver Operating Characteristic (ROC) curve. The ROC curve is created by plotting the true positive rate (TPR) against the false positive rate (FPR) at various threshold values. TPR and FPR are called also sensitivity/recall and 100 specificity, respectively.
4. Proposed Approach
For the three-class and five-class scenarios, we proposed an Ensemble-CNNs, which is based on the trained models, ResNeXt-50, Inception-v3, and DenseNet-161. Figure 8 illustrates our proposed approach. In our Ensemble-CNNs approach, the predicted class of each image is assigned using the average of the prediction probabilities of the three trained models. In more detail, the probabilities of the three models corresponding to all classes give the mean probability for all classes, then the argmax of the mean probabilities will assign the Ensemble-CNNs predicted class.
5. Experiments and Results
For three-class and five-class scenarios, we conducted the experiments using three powerful CNN architectures (ResNeXt-50, Inception-v3, and DenseNet-161) and our proposed Ensemble-CNNs approach. To evaluate the performance of these methods, we used the validation and testing splits. The main difference between both splits is that the validation split was created using the same sources as the training data, while the testing data were created from different sources. In this section, we will describe our experimental setup then the experiments of the three-class and five-class scenarios.
5.1. Experimental Setup
All the experiments were carried out on Pytorch [39] with a NVIDIA Device Geforce TITAN RTX 24 GB. All the networks were trained for 30 epochs with the Adam optimizer [40], the focal loss function with [36] , and batch size of 64. The initial learning rate was 1e-6 for 20 epochs, then leaning rate decreased to 1e-7 for the next 10 epochs. Active data augmentation was performed by normalizing, resizing, and cropping the input images in order to achieve the correct input size for each network; the input image size of the network was pixels, meanwhile the DenseNet-161 and ReNeXt-50 input sizes were pixels. For the normalization, the following values of mean and standard deviation were used for each channel of the image:
- mean: [0.485, 0.456, 0.406],
- std: [0.229, 0.224, 0.225].
Moreover, we added a dropout layer for both DenseNet-161 and ResNeXt-50 after the fully connected layer with a probability of 30%. Meanwhile, Inception-v3 already had a default dropout layer with a probability of 50%.
5.2. Three-Class Scenario Experiments
Table 7 and Table 8 summarise the results of the three-class scenario on the validation and testing data, respectively. From the results of the validation data, the best method is our proposed Ensemble-CNNs approach for all of the used evaluation metrics (Accuracy, Precision, Sensitivity, specificity, F1-score, and AUC). From Table 8, which contains the results of the testing data, ResneXt-50 achieved the best performance for the Accuracy, Precision, Sensitivity, specificity, and F1-score evaluation metrics, where it is slightly better than our proposed Ensemble-CNNs approach. Meanwhile, for the AUC evaluation metric DenseNet-161 achieved the best performance, and again DenseNet-161 was slightly better than our proposed Ensemble-CNNs approach. From these results, we notice that our proposed Ensemble-CNNs approach does not achieve the best result for all the evaluation metrics but still gives a better trade-off between different evaluation metrics’ results. In addition, we notice that the performance of the testing data is not good as that of the validation data. This is because the testing data sources are different from the training and validation ones, as shown in Table 2.
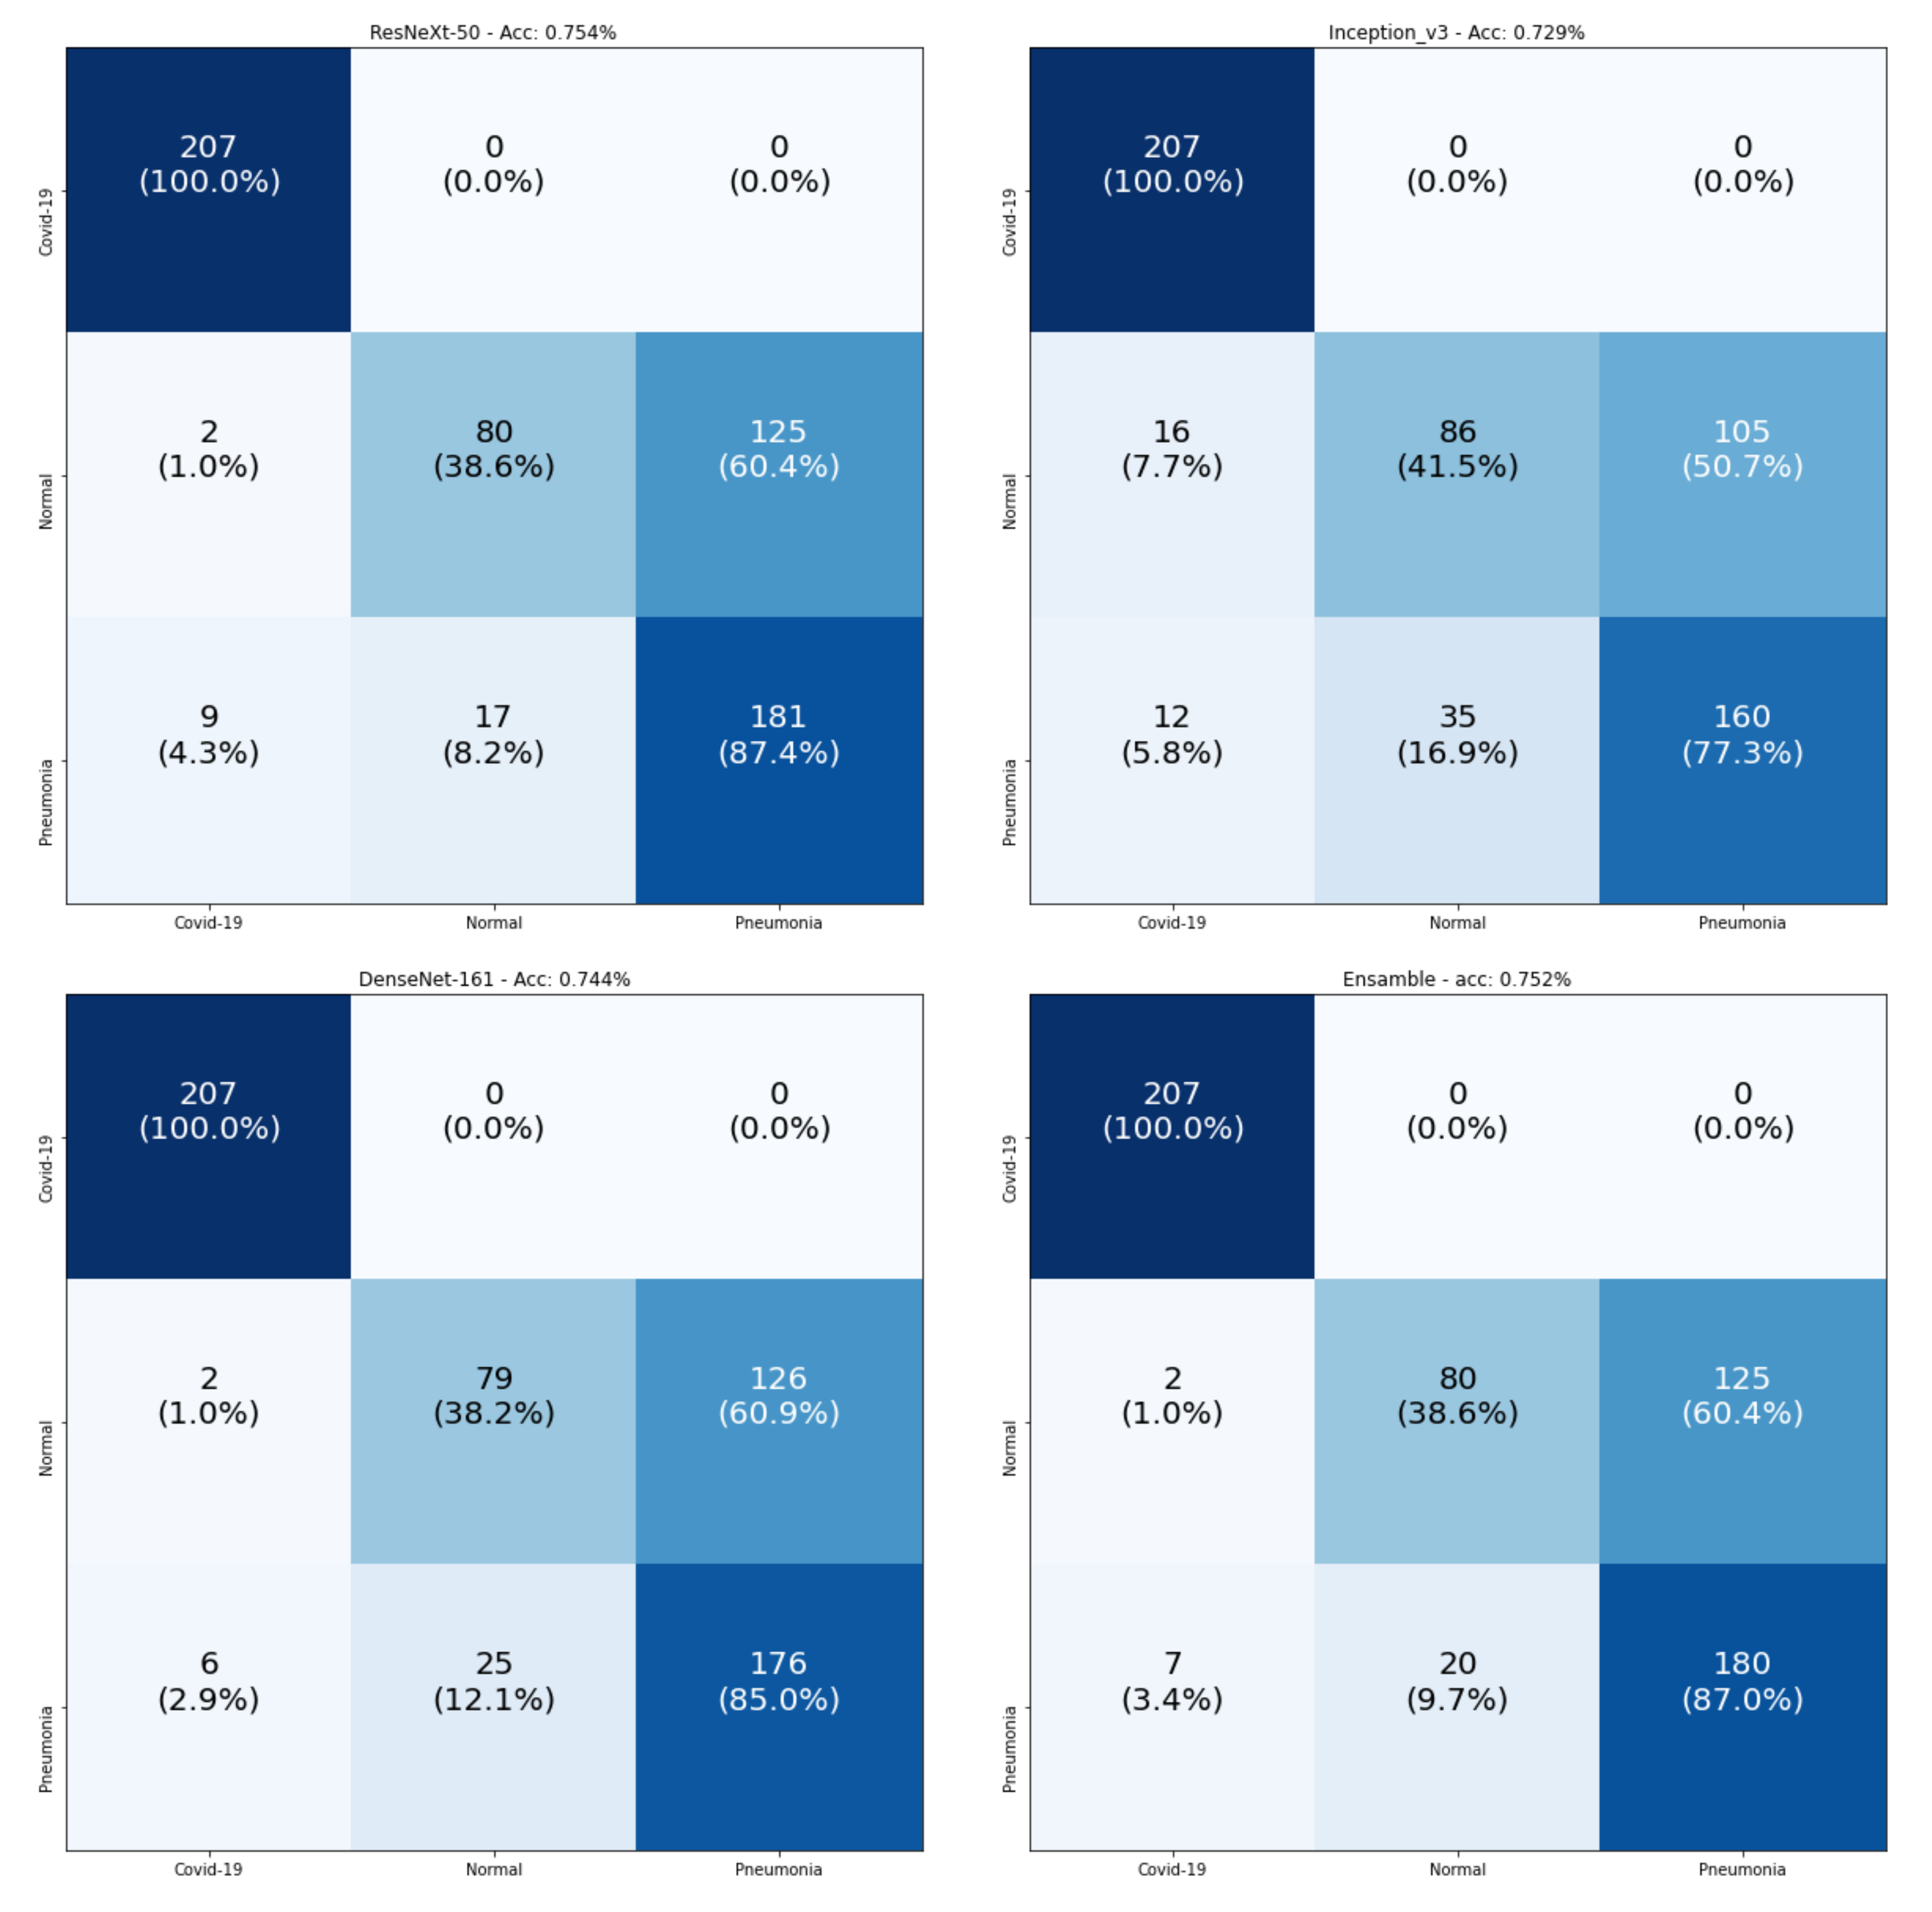
Figure 9 consists of the confusion matrices of the testing data. The main observation is that all models achieved 100% for the classification of COVID-19 samples. The real confusion for all models was in distinguishing between the Normal and Pneumonia classes. Since all models achieved 100% in the recognition of COVID-19 samples, we checked the number of samples that were wrongly classified as COVID-19 for the testing split, as shown in Table 9. From this table, we observe that the best model was DenseNet-161, which had the smallest number of false positives, and our proposed Ensemble-CNNs approach was the second best one. From the above results, we conclude that our proposed approach is more stable in the classification of the three classes and the recognition of COVID-19.
5.3. Five-Class Scenario Experiments
Table 10 and Table 11 summarise the results of the five-class scenario with the validation and testing data, respectively. From these results, we notice that our proposed Ensemble-CNNs approach outperforms all of the three tested CNN architectures (ResNeXt-50, Inception-v3, and DenseNet-161) in both the validation and testing splits for all of the used evaluation metrics (Accuracy, Precision, Sensitivity, specificity, F1-score, and AUC). This proves the benefit of using the ensemble approach. As we noticed in three-class, the performance of the testing data was lower than that of the validation data. This is because the training and validation data were from the same sources for all classes. Meanwhile, most of the five-class testing data classes were from different sources, as shown in Table 3.
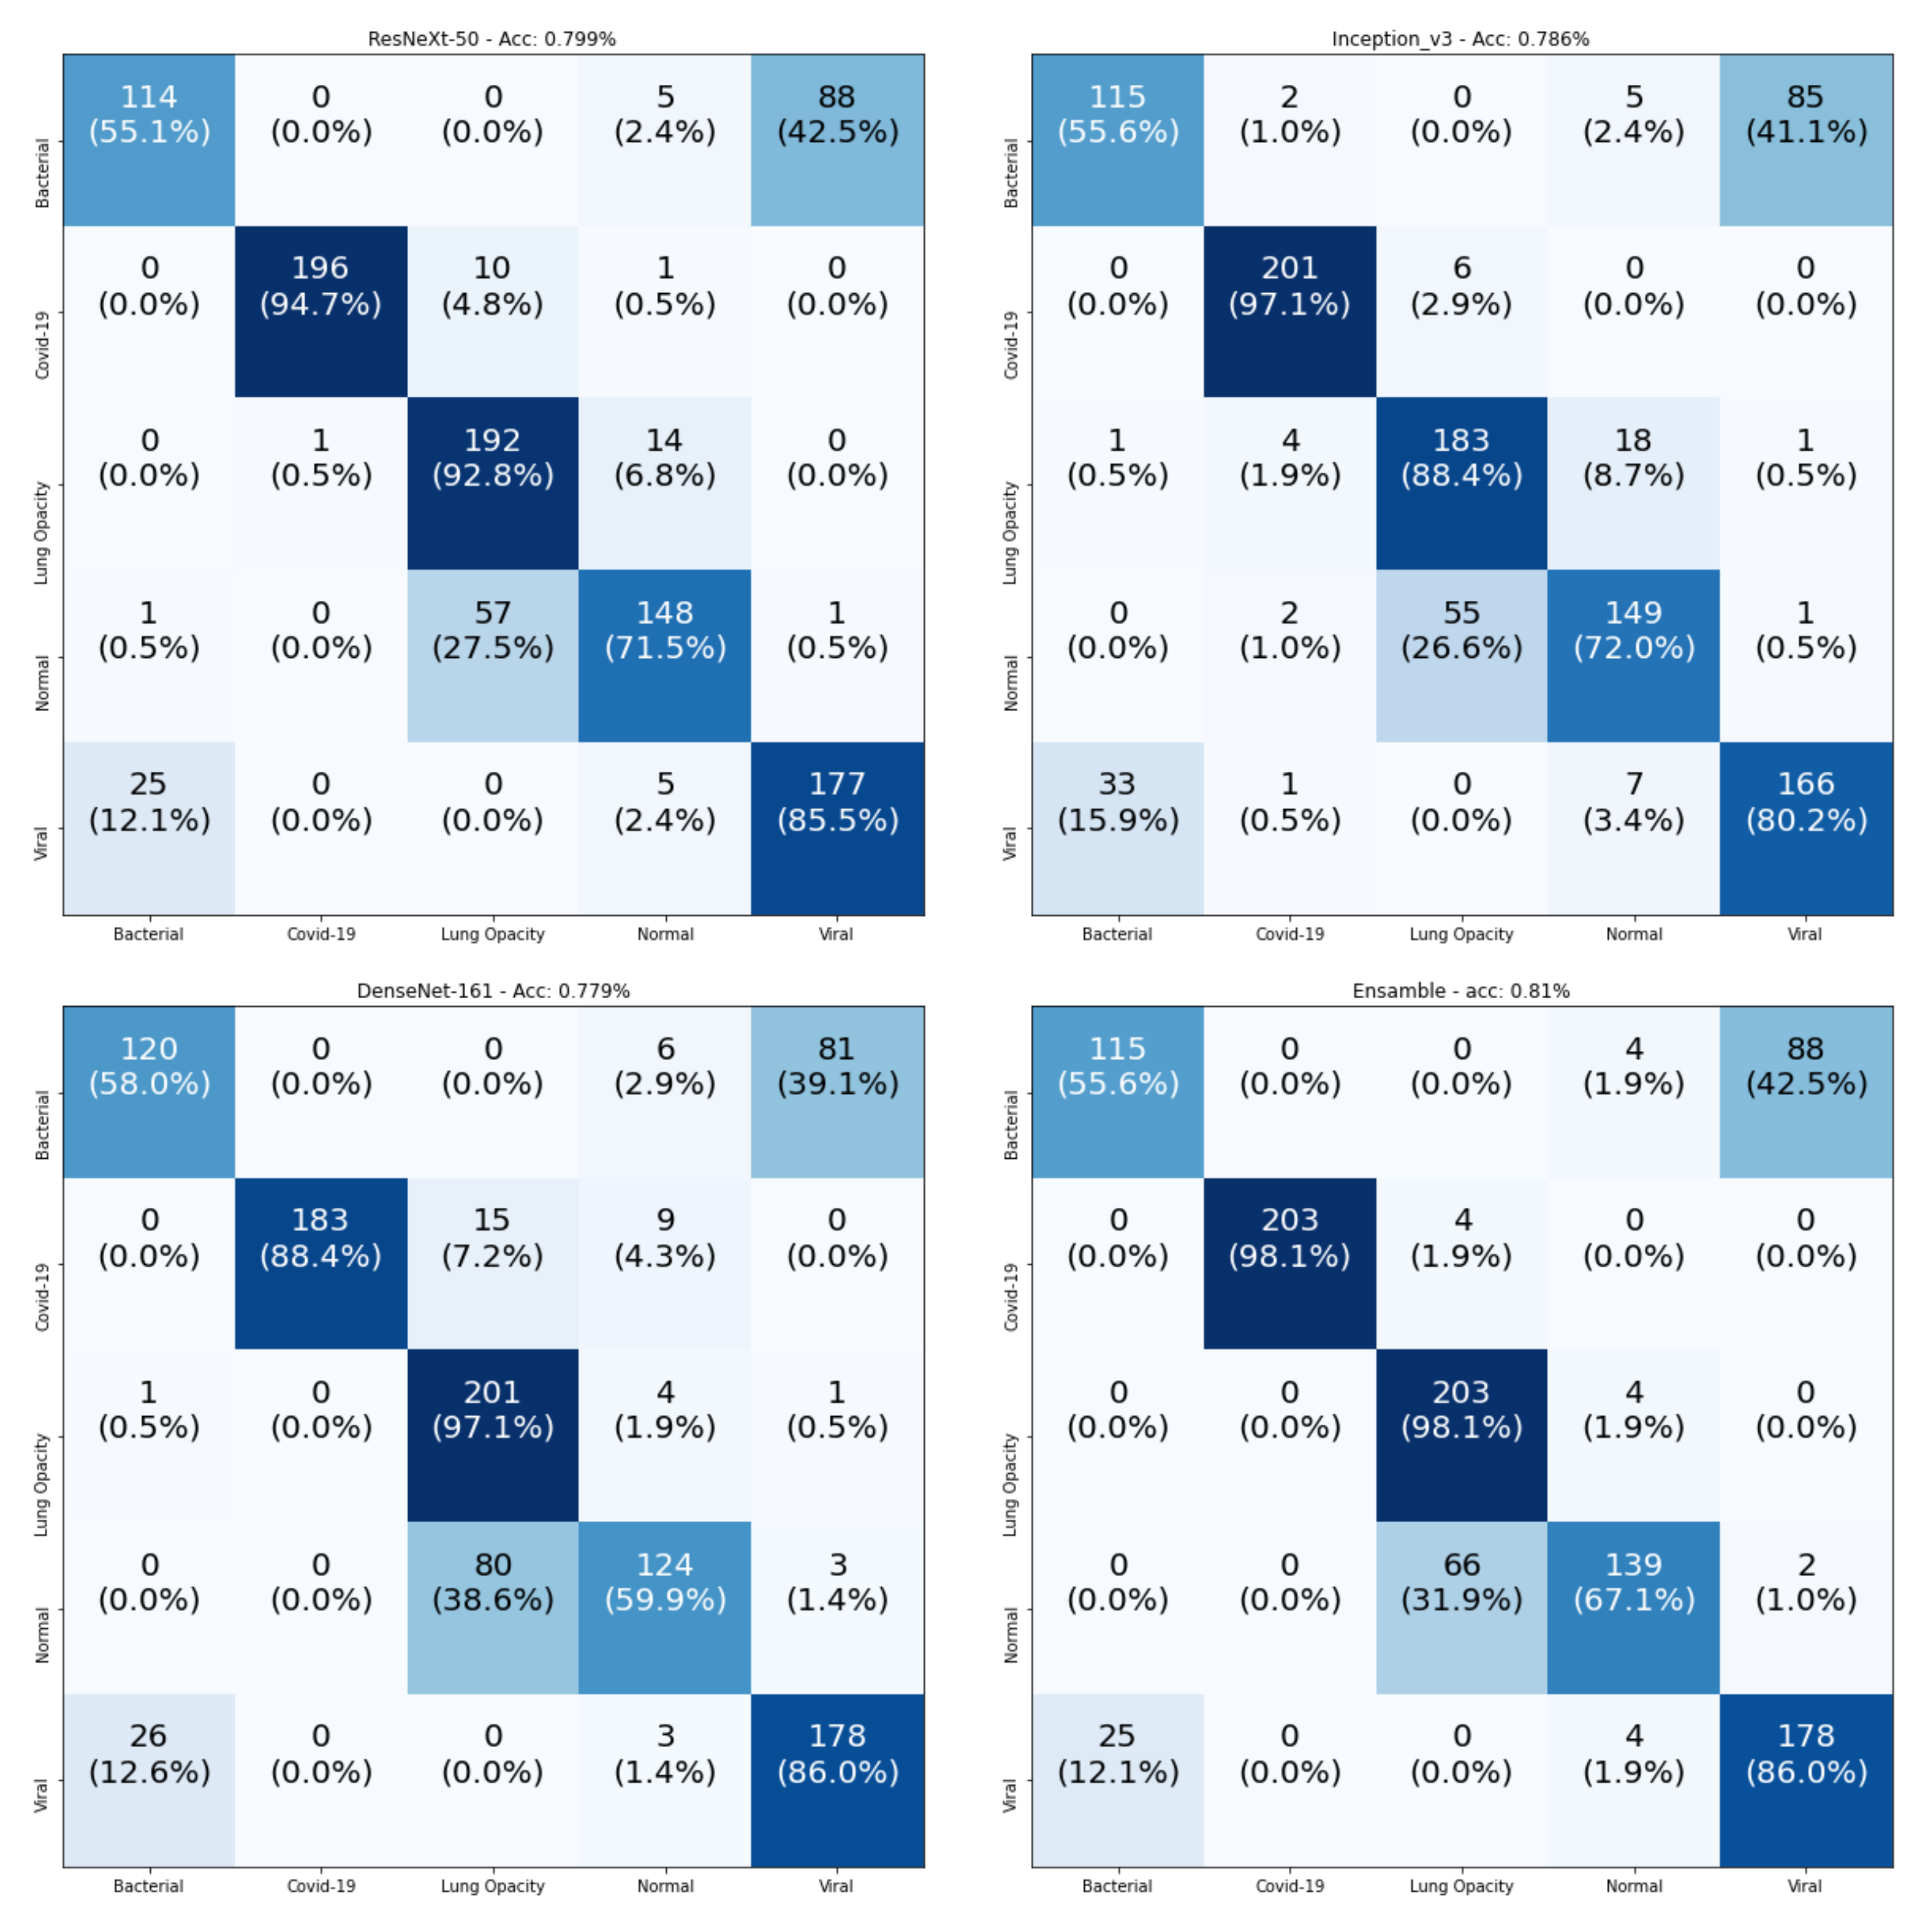
To gain a better explanation for the recognition of the individual classes, Figure 10 contains the confusion matrices of the testing data. From these confusion matrices, we notice that the Ensemble-CNNs approach achieves the best performance in the recognition of COVID-19 samples (98.1%). In addition, the Lung Opacity No Pneumonia samples are well recognized by all models (the best one is Ensemble-CNNs, at 98.1%). This happened because all the samples for Lung Opacity No Pneumonia class were from a single source (we found only one source for this class). Table 12 shows a comparison between all four tested models in the recognition of the individual classes. From this table, we observe that our proposed approach is the best in the recognition of three classes out of five. This confirms the superiority of our approach compared with the other used CNN architectures.
5.4. Heatmap Representation
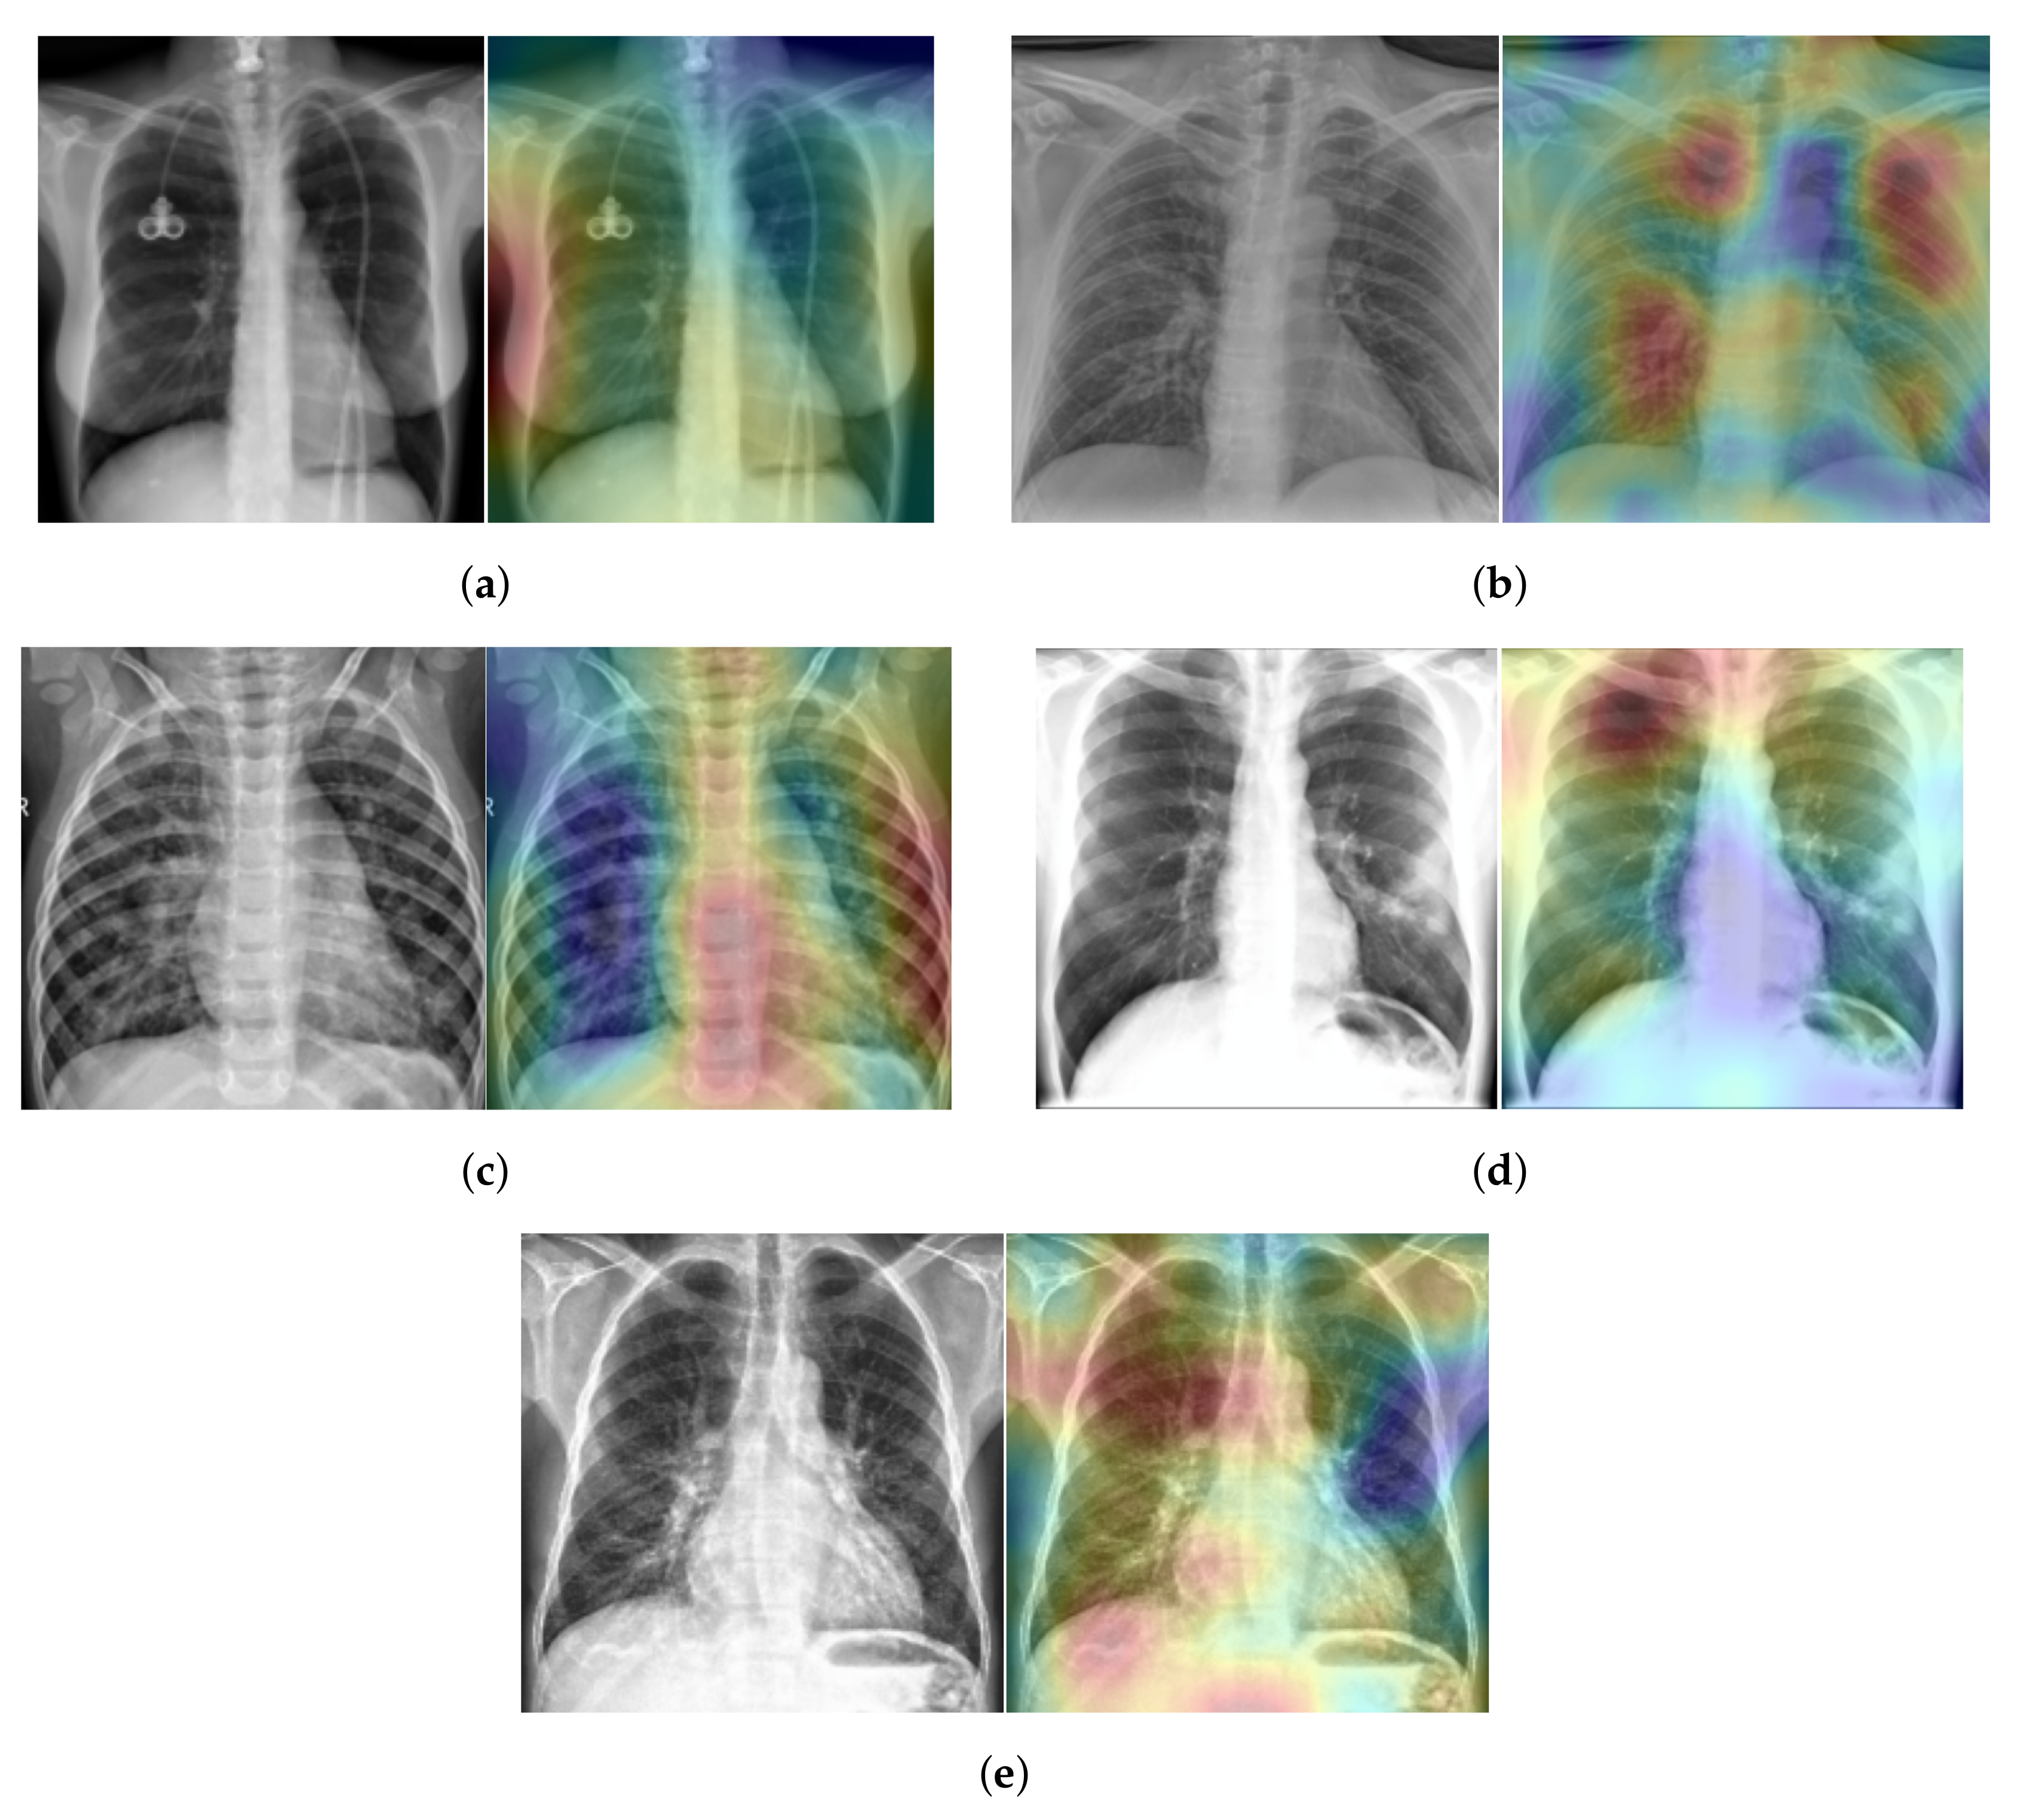
To explain our approach’s classification decision of different lung diseases from the X-ray scans, we used the Randomized Input Sampling for Explanations (RISE) approach [41]. Figure 11 shows the heatmap of five X-ray scans, where each scan has a different class. These X-ray scans were taken from the testing split of our five-class COVID-19 database. In Figure 11, the red color indicates the greater importance of the corresponding region to our model and the blue color indicates a lower importance. For the Healthy case (Figure 11a), most of the X-ray scan regions have a blue color, which indicates that all regions have the same importance as our approach, since there is no infection. Meanwhile, for the COVID-19, Viral Pneumonia, Bacterial Pneumonia, and Lung Opacity cases (Figure 11b–e), our approach gave more attention to the lung regions (red color), which correspond to the real regions where the infection occurs.
6. Discussion
Since the state-of-the-art works have no unified data, classes, or evaluation protocols, it is hard to compare different methods. In Table 13, we tried to compare the recognition of COVID-19 in our approach and that of some state-of-the-art methods. From this table, we notice that our approach has achieved a high performance in the recognition of COVID-19 in both scenarios (three and five classes), despite the fact that we used a new source of scans for the testing: Algeria. From other hand, the distinguishing between other lung diseases and normal cases is still challenging and need more improvement. It should be mentioned that the number of X-ray scans used for the training CNN architecture is very limited (404 X-ray scans for each class). One possible solution to improve the performance is to use more X-ray scans for each class.
Since we evaluated three CNN architectures and our proposed Ensemble-CNNs approach on our proposed new databases and scenarios, it is unfair to compare the complexity of our approach with the state-of-the-art methods. Table 14 contains the required time to test a single X-ray scan for the evaluated three CNN architectures and our approach for the three-class and five-class scenarios. From Table 14, we notice that the required time is very trivial for all the evaluated methods. This proves the efficiency of using X-ray scans for the recognition of COVID-19 infection compared with currently used tests, such as RT-PCR.
7. Conclusions
In this paper, we created two databases to distinguish between COVID-19 infection and other lung diseases from X-ray scans. In the first database, we considered three classes, which are Healthy, COVID-19, and Pneumonia. In the second database, we considered five classes, which are Healthy, COVID-19, Viral Pneumonia, Bacterial Pneumonia, and Lung Opacity No Pneumonia. In both databases, we collected public databases and used them as training and validation splits. However, we used new COVID-19 scans as testing images. Moreover, the testing splits of the other classes were collected from different sources.
To distinguish between different lung diseases in both scenarios, we evaluated three CNN architectures (ResNeXt-50, Inception-v3, and DenseNet-161) and proposed an Ensemble-CNNs approach. Since the CNN architectures require huge amounts of labelled data for training, we used data augmentation to cope with this limitation. The obtained results showed that our approach outperformed the CNN architectures. Our proposed Ensemble-CNNs achieved a high performance in the recognition of COVID-19 infection, resulting in accuracies of 100% and 98.1% in three-class and five-class scenarios, respectively. In addition, our approach achieved promising results in the overall recognition accuracy—75.23% and 81.0% for the three-class and five-class scenarios, respectively.
As future work, we are working on collecting more COVID-19 X-ray scans from hospitals. Moreover, we are planning to define more lung disease classes depending on the available X-ray scans. On the other hand, we are planing to use more powerful CNN architectures in our Ensemble approach. In addition, combining deep features of different architectures is an interesting approach that can improve the performance.
Author Contributions
E.V.: Data curation, Formal analysis, Investigation, Resources, Software, Validation, Visualization Writing—original draft, review and editing. E.P.: Data curation, Formal analysis, Investigation, Resources, Software, Validation, Visualization Writing—original draft, review and editing. F.B.: Data curation, Formal analysis, Investigation, Methodology, Resources, Software, Supervision, Validation, Visualization, Writing—original draft, review and editing. C.D.: Data curation, Formal analysis, funding acquisition, Investigation, Methodology, Project administration, Resources, Supervision, Writing—original draft, review and editing. A.H.: Formal analysis, Investigation, Methodology, Resources, Supervision, Writing—original draft, review and editing. A.T.-A.: Data curation, Formal analysis, funding acquisition, Investigation, Methodology, Project administration, Resources, Supervision, Writing—original draft, review and editing. All authors have read and agreed to the published version of the manuscript.
Funding
This research was funded in part by ERASMUS+ Programme, Key Action 1—Student Mobility for Traineeship, 2019/2020.
Institutional Review Board Statement
The study was conducted according to the guidelines of the Declaration of Helsinki, and approved by the Institutional Review Board (or Ethics Committee) of Hospital Zioachi of Tolga, Algeria July 2020.
Informed Consent Statement
Informed consent was obtained from all subjects involved in the study.
Data Availability Statement
The used datasets were obtained from publically open source datastes from: 1 ieee8023/covid-chestxray-dataset https://github.com/ieee8023/covid-chestxray-dataset (accessed on 2 March 2021); 2 Chest X-Ray Images (Pneumonia) from Kaggle https://www.kaggle.com/paultimothymooney/chest-xray-pneumonia (accessed on 2 March 2021); 3 RSNA Pneumonia Detection Challenge from Kaggle https://www.kaggle.com/c/rsna-pneumonia-detection-challenge (accessed on 2 March 2021); 4 A Large Chest X-Ray Dataset - CheXpert https://stanfordmlgroup.github.io/competitions/chexpert/ (accessed on 2 March 2021); 5 NLM-MontgomerySet https://lhncbc.nlm.nih.gov/LHC-publications/pubs/TuberculosisChestXrayImageDataSets.html (accessed on 2 March 2021); 6 NLM-ChinaCXRSet https://lhncbc.nlm.nih.gov/LHC-publications/pubs/TuberculosisChestXrayImageDataSets.html (accessed on 2 March 2021); 7 Algeria Hospital of Tolga https://github.com/Edo2610/Covid-19_X-ray_Two-proposed-Databases/tree/main/Datasets/5-classes/Test/Covid-19 (accessed on 2 March 2021).
Acknowledgments
The Authors would like to thanks Arturo Argentieri from CNR-ISASI Italy for his support on the multi-GPU computing facilities.
Conflicts of Interest
The authors declare no conflict of interest.
Abbreviations
The following abbreviations are used in this manuscript:
| CNN | Convolutional Neural Network |
| RT-PCR | Reverse Transcription Polymerase Chain Reaction |
| SVM | Support Vector Machine |
| TP | True Positive |
| FP | False Positive |
| FN | False Negative |
| AUC | Area Under the ROC Curve |
| ROC | Receiver Operating Characteristic |
References
- Turkoglu, M. COVIDetectioNet: COVID-19 diagnosis system based on X-ray images using features selected from pre-learned deep features ensemble. Appl. Intell. 2020, 51, 1213–1226. [Google Scholar] [CrossRef]
- Kucirka, L.M.; Lauer, S.A.; Laeyendecker, O.; Boon, D.; Lessler, J. Variation in False-Negative Rate of Reverse Transcriptase Polymerase Chain Reaction—Based SARS-CoV-2 Tests by Time Since Exposure. Ann. Intern. Med. 2020, 173, 262–267. [Google Scholar] [CrossRef]
- Kanne, J.P.; Little, B.P.; Chung, J.H.; Elicker, B.M.; Ketai, L.H. Essentials for Radiologists on COVID-19: An Update—Radiology Scientific Expert Panel. Radiology 2020, 296, E113–E114. [Google Scholar] [CrossRef] [Green Version]
- Yoo, S.H.; Geng, H.; Chiu, T.L.; Yu, S.K.; Cho, D.C.; Heo, J.; Choi, M.S.; Choi, I.H.; Cung Van, C.; Nhung, N.V. Deep learning-based decision-tree classifier for COVID-19 diagnosis from chest X-ray imaging. Front. Med. 2020, 7, 427. [Google Scholar] [CrossRef] [PubMed]
- Wang, L.; Lin, Z.Q.; Wong, A. Covid-net: A tailored deep convolutional neural network design for detection of covid-19 cases from chest X-ray images. Sci. Rep. 2020, 10, 1–12. [Google Scholar] [CrossRef] [PubMed]
- Rahman, T.; Chowdhury, M.E.H.; Khandakar, A.; Islam, K.R.; Islam, K.F.; Mahbub, Z.B.; Kadir, M.A.; Kashem, S. Transfer Learning with Deep Convolutional Neural Network (CNN) for Pneumonia Detection Using Chest X-ray. Appl. Sci. 2020, 10, 3233. [Google Scholar] [CrossRef]
- Ouahabi, A.; Taleb-Ahmed, A. Deep learning for real-time semantic segmentation: Application in ultrasound imaging. Pattern Recognit. Lett. 2021, 144, 27–34. [Google Scholar] [CrossRef]
- Sharma, A.; Rani, S.; Gupta, D. Artificial intelligence-based classification of chest X-ray images into COVID-19 and other infectious diseases. Int. J. Biomed. Imaging 2020, 2020, 8889023. [Google Scholar] [CrossRef]
- Karim, M.; Döhmen, T.; Rebholz-Schuhmann, D.; Decker, S.; Cochez, M.; Beyan, O. Deepcovidexplainer: Explainable covid-19 predictions based on chest X-ray images. arXiv 2020, arXiv:2004.04582. [Google Scholar]
- Hammoudi, K.; Benhabiles, H.; Melkemi, M.; Dornaika, F.; Arganda-Carreras, I.; Collard, D.; Scherpereel, A. Deep Learning on Chest X-ray Images to Detect and Evaluate Pneumonia Cases at the Era of COVID-19. arXiv 2020, arXiv:2004.03399. [Google Scholar]
- Bougourzi, F.; Dornaika, F.; Mokrani, K.; Taleb-Ahmed, A.; Ruichek, Y. Fusion Transformed Deep and Shallow features (FTDS) for Image-Based Facial Expression Recognition. Expert Syst. Appl. 2020, 156, 113459. [Google Scholar] [CrossRef]
- Bougourzi, F.; Mokrani, K.; Ruichek, Y.; Dornaika, F.; Ouafi, A.; Taleb-Ahmed, A. Fusion of transformed shallow features for facial expression recognition. IET Image Process. 2019, 13, 1479–1489. [Google Scholar] [CrossRef]
- Apostolopoulos, I.D.; Mpesiana, T.A. Covid-19: Automatic detection from X-ray images utilizing transfer learning with convolutional neural networks. Phys. Eng. Sci. Med. 2020, 43, 635–640. [Google Scholar] [CrossRef] [Green Version]
- Hemdan, E.E.D.; Shouman, M.A.; Karar, M.E. Covidx-net: A framework of deep learning classifiers to diagnose covid-19 in X-ray images. arXiv 2020, arXiv:2003.11055. [Google Scholar]
- Simonyan, K.; Zisserman, A. Very deep convolutional networks for large-scale image recognition. arXiv 2014, arXiv:1409.1556. [Google Scholar]
- Huang, G.; Liu, Z.; Van Der Maaten, L.; Weinberger, K.Q. Densely connected convolutional networks. In Proceedings of the IEEE Conference on Computer Vision and Pattern Recognition, Honolulu, HI, USA, 21–26 July 2017; pp. 4700–4708. [Google Scholar]
- Szegedy, C.; Vanhoucke, V.; Ioffe, S.; Shlens, J.; Wojna, Z. Rethinking the inception architecture for computer vision. In Proceedings of the IEEE Conference on Computer Vision and Pattern Recognition, Las Vegas, NV, USA, 27–30 June 2016; pp. 2818–2826. [Google Scholar]
- He, K.; Zhang, X.; Ren, S.; Sun, J. Deep residual learning for image recognition. In Proceedings of the IEEE Conference on Computer Vision and Pattern Recognition, Las Vegas, NV, USA, 27–30 June 2016; pp. 770–778. [Google Scholar]
- Szegedy, C.; Ioffe, S.; Vanhoucke, V.; Alemi, A. Inception-v4, inception-resnet and the impact of residual connections on learning. In Proceedings of the AAAI Conference on Artificial Intelligence, San Francisco, CA, USA, 4–9 February 2017; Volume 31. Issue 1. [Google Scholar]
- Chollet, F. Xception: Deep learning with depthwise separable convolutions. In Proceedings of the IEEE Conference on Computer Vision and Pattern Recognition, Honolulu, HI, USA, 21–26 July 2017; pp. 1251–1258. [Google Scholar]
- Sandler, M.; Howard, A.; Zhu, M.; Zhmoginov, A.; Chen, L.C. Mobilenetv2: Inverted residuals and linear bottlenecks. In Proceedings of the IEEE Conference on Computer Vision and Pattern Recognition, Salt Lake City, UT, USA, 18–23 June 2018; pp. 4510–4520. [Google Scholar]
- Mangal, A.; Kalia, S.; Rajgopal, H.; Rangarajan, K.; Namboodiri, V.; Banerjee, S.; Arora, C. CovidAID: COVID-19 Detection Using Chest X-ray. arXiv 2020, arXiv:2004.09803. [Google Scholar]
- Rajpurkar, P.; Irvin, J.; Zhu, K.; Yang, B.; Mehta, H.; Duan, T.; Ding, D.; Bagul, A.; Langlotz, C.; Shpanskaya, K. Chexnet: Radiologist-level pneumonia detection on chest X-rays with deep learning. arXiv 2017, arXiv:1711.05225. [Google Scholar]
- Wang, X.; Peng, Y.; Lu, L.; Lu, Z.; Bagheri, M.; Summers, R.M. Chestx-ray8: Hospital-scale chest X-ray database and benchmarks on weakly-supervised classification and localization of common thorax diseases. In Proceedings of the IEEE Conference on Computer Vision and Pattern Recognition, Honolulu, HI, USA, 21–26 July 2017; pp. 2097–2106. [Google Scholar]
- Krizhevsky, A.; Sutskever, I.; Hinton, G.E. Imagenet classification with deep convolutional neural networks. Commun. ACM 2017, 60, 84–90. [Google Scholar] [CrossRef]
- Kira, K.; Rendell, L.A. A practical approach to feature selection. In Machine Learning Proceedings 1992; Elsevier: Amsterdam, The Netherlands, 1992; pp. 249–256. [Google Scholar]
- Cortes, C.; Vapnik, V. Support-vector networks. Mach. Learn. 1995, 20, 273–297. [Google Scholar] [CrossRef]
- Sahlol, A.T.; Yousri, D.; Ewees, A.A.; Al-qaness, M.A.A.; Damasevicius, R.; Elaziz, M.A. COVID-19 image classification using deep features and fractional-order marine predators algorithm. Sci. Rep. 2020, 10, 15364. [Google Scholar] [CrossRef] [PubMed]
- Cohen, J.P.; Morrison, P.; Dao, L.; Roth, K.; Duong, T.Q.; Ghassemi, M. Covid-19 image data collection: Prospective predictions are the future. arXiv 2020, arXiv:2006.11988. [Google Scholar]
- Kermany, D.S.; Goldbaum, M.; Cai, W.; Valentim, C.C.; Liang, H.; Baxter, S.L.; McKeown, A.; Yang, G.; Wu, X.; Yan, F. Identifying medical diagnoses and treatable diseases by image-based deep learning. Cell 2018, 172, 1122–1131. [Google Scholar] [CrossRef] [PubMed]
- Shih, G.; Wu, C.C.; Halabi, S.S.; Kohli, M.D.; Prevedello, L.M.; Cook, T.S.; Sharma, A.; Amorosa, J.K.; Arteaga, V.; Galperin-Aizenberg, M. Augmenting the National Institutes of Health chest radiograph dataset with expert annotations of possible pneumonia. Radiol. Artif. Intell. 2019, 1, e180041. [Google Scholar] [CrossRef]
- Irvin, J.; Rajpurkar, P.; Ko, M.; Yu, Y.; Ciurea-Ilcus, S.; Chute, C.; Marklund, H.; Haghgoo, B.; Ball, R.; Shpanskaya, K. Chexpert: A large chest radiograph dataset with uncertainty labels and expert comparison. In Proceedings of the AAAI Conference on Artificial Intelligence, Honolulu, HI, USA, 27 January–1 February 2019; Volume 33, pp. 590–597. [Google Scholar]
- Jaeger, S.; Candemir, S.; Antani, S.; Wáng, Y.X.J.; Lu, P.X.; Thoma, G. Two public chest X-ray datasets for computer-aided screening of pulmonary diseases. Quant. Imaging Med. Surg. 2014, 4, 475. [Google Scholar] [PubMed]
- Xie, S.; Girshick, R.; Dollár, P.; Tu, Z.; He, K. Aggregated residual transformations for deep neural networks. In Proceedings of the IEEE Conference on Computer Vision and Pattern Recognition, Honolulu, HI, USA, 21–26 July 2017; pp. 1492–1500. [Google Scholar]
- Szegedy, C.; Liu, W.; Jia, Y.; Sermanet, P.; Reed, S.; Anguelov, D.; Erhan, D.; Vanhoucke, V.; Rabinovich, A. Going deeper with convolutions. In Proceedings of the IEEE Conference on Computer Vision and Pattern Recognition, Boston, MA, USA, 7–12 June 2015; pp. 1–9. [Google Scholar]
- Lin, T.Y.; Goyal, P.; Girshick, R.; He, K.; Dollár, P. Focal loss for dense object detection. In Proceedings of the IEEE International Conference on Computer Vision, Honolulu, HI, USA, 21–26 July 2017; pp. 2980–2988. [Google Scholar]
- Liu, W.; Chen, L.; Chen, Y. Age Classification Using Convolutional Neural Networks with the Multi-class Focal Loss. IOP Conf. Ser. Mater. Sci. Eng. 2018, 428, 012043. [Google Scholar] [CrossRef]
- Bendjoudi, I.; Vanderhaegen, F.; Hamad, D.; Dornaika, F. Multi-label, multi-task CNN approach for context-based emotion recognition. Inf. Fusion 2020. [Google Scholar] [CrossRef]
- Paszke, A.; Gross, S.; Massa, F.; Lerer, A.; Bradbury, J.; Chanan, G.; Killeen, T.; Lin, Z.; Gimelshein, N.; Antiga, L. Pytorch: An imperative style, high-performance deep learning library. In Proceedings of the Advances in Neural Information Processing Systems, Vancouver, BC, Canada, 8–14 December 2019; pp. 8026–8037. [Google Scholar]
- Kingma, D.P.; Ba, J. Adam: A method for stochastic optimization. arXiv 2014, arXiv:1412.6980. [Google Scholar]
- Petsiuk, V.; Das, A.; Saenko, K. RISE: Randomized Input Sampling for Explanation of Black-box Models. arXiv 2018, arXiv:1806.07421. [Google Scholar]
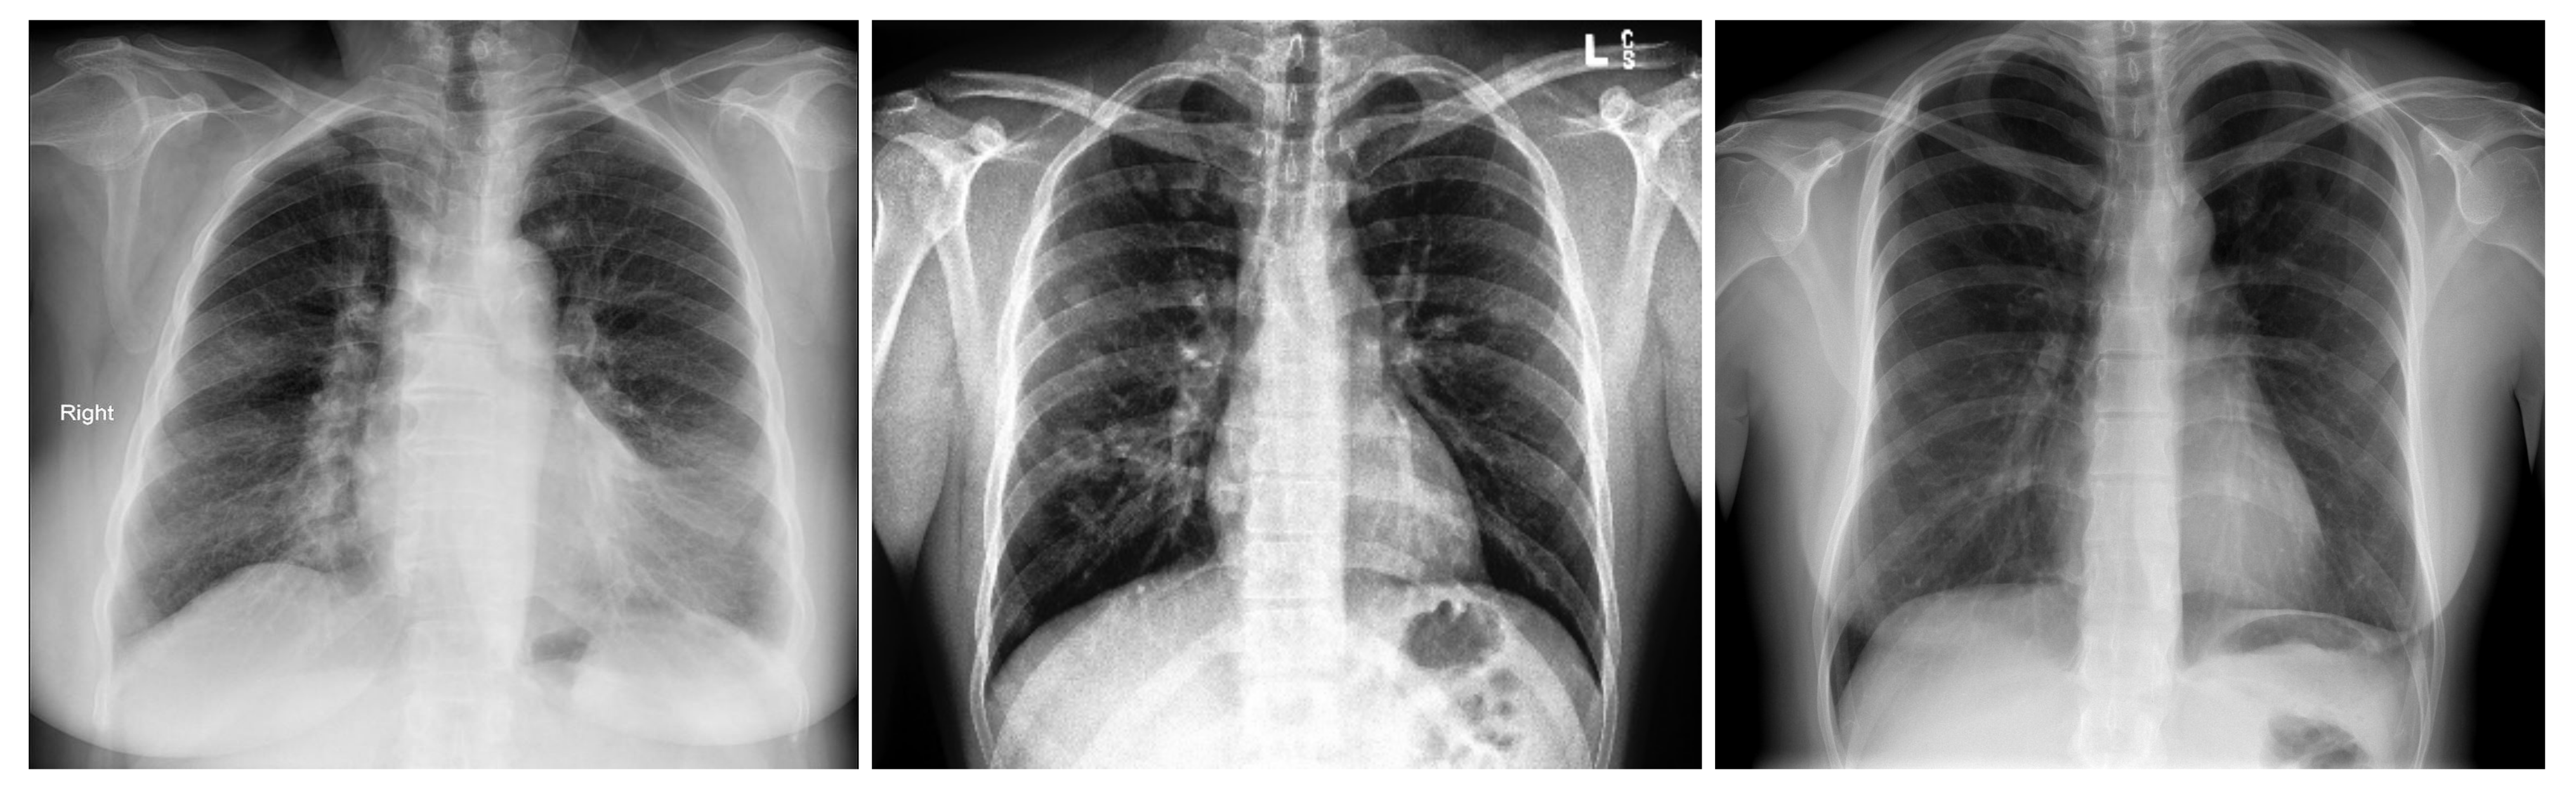
Figure 1.
Samples from the three-class Covid-19 database: Covid-19 (left), Pneumonia (center), and Normal (right).
Figure 1.
Samples from the three-class Covid-19 database: Covid-19 (left), Pneumonia (center), and Normal (right).

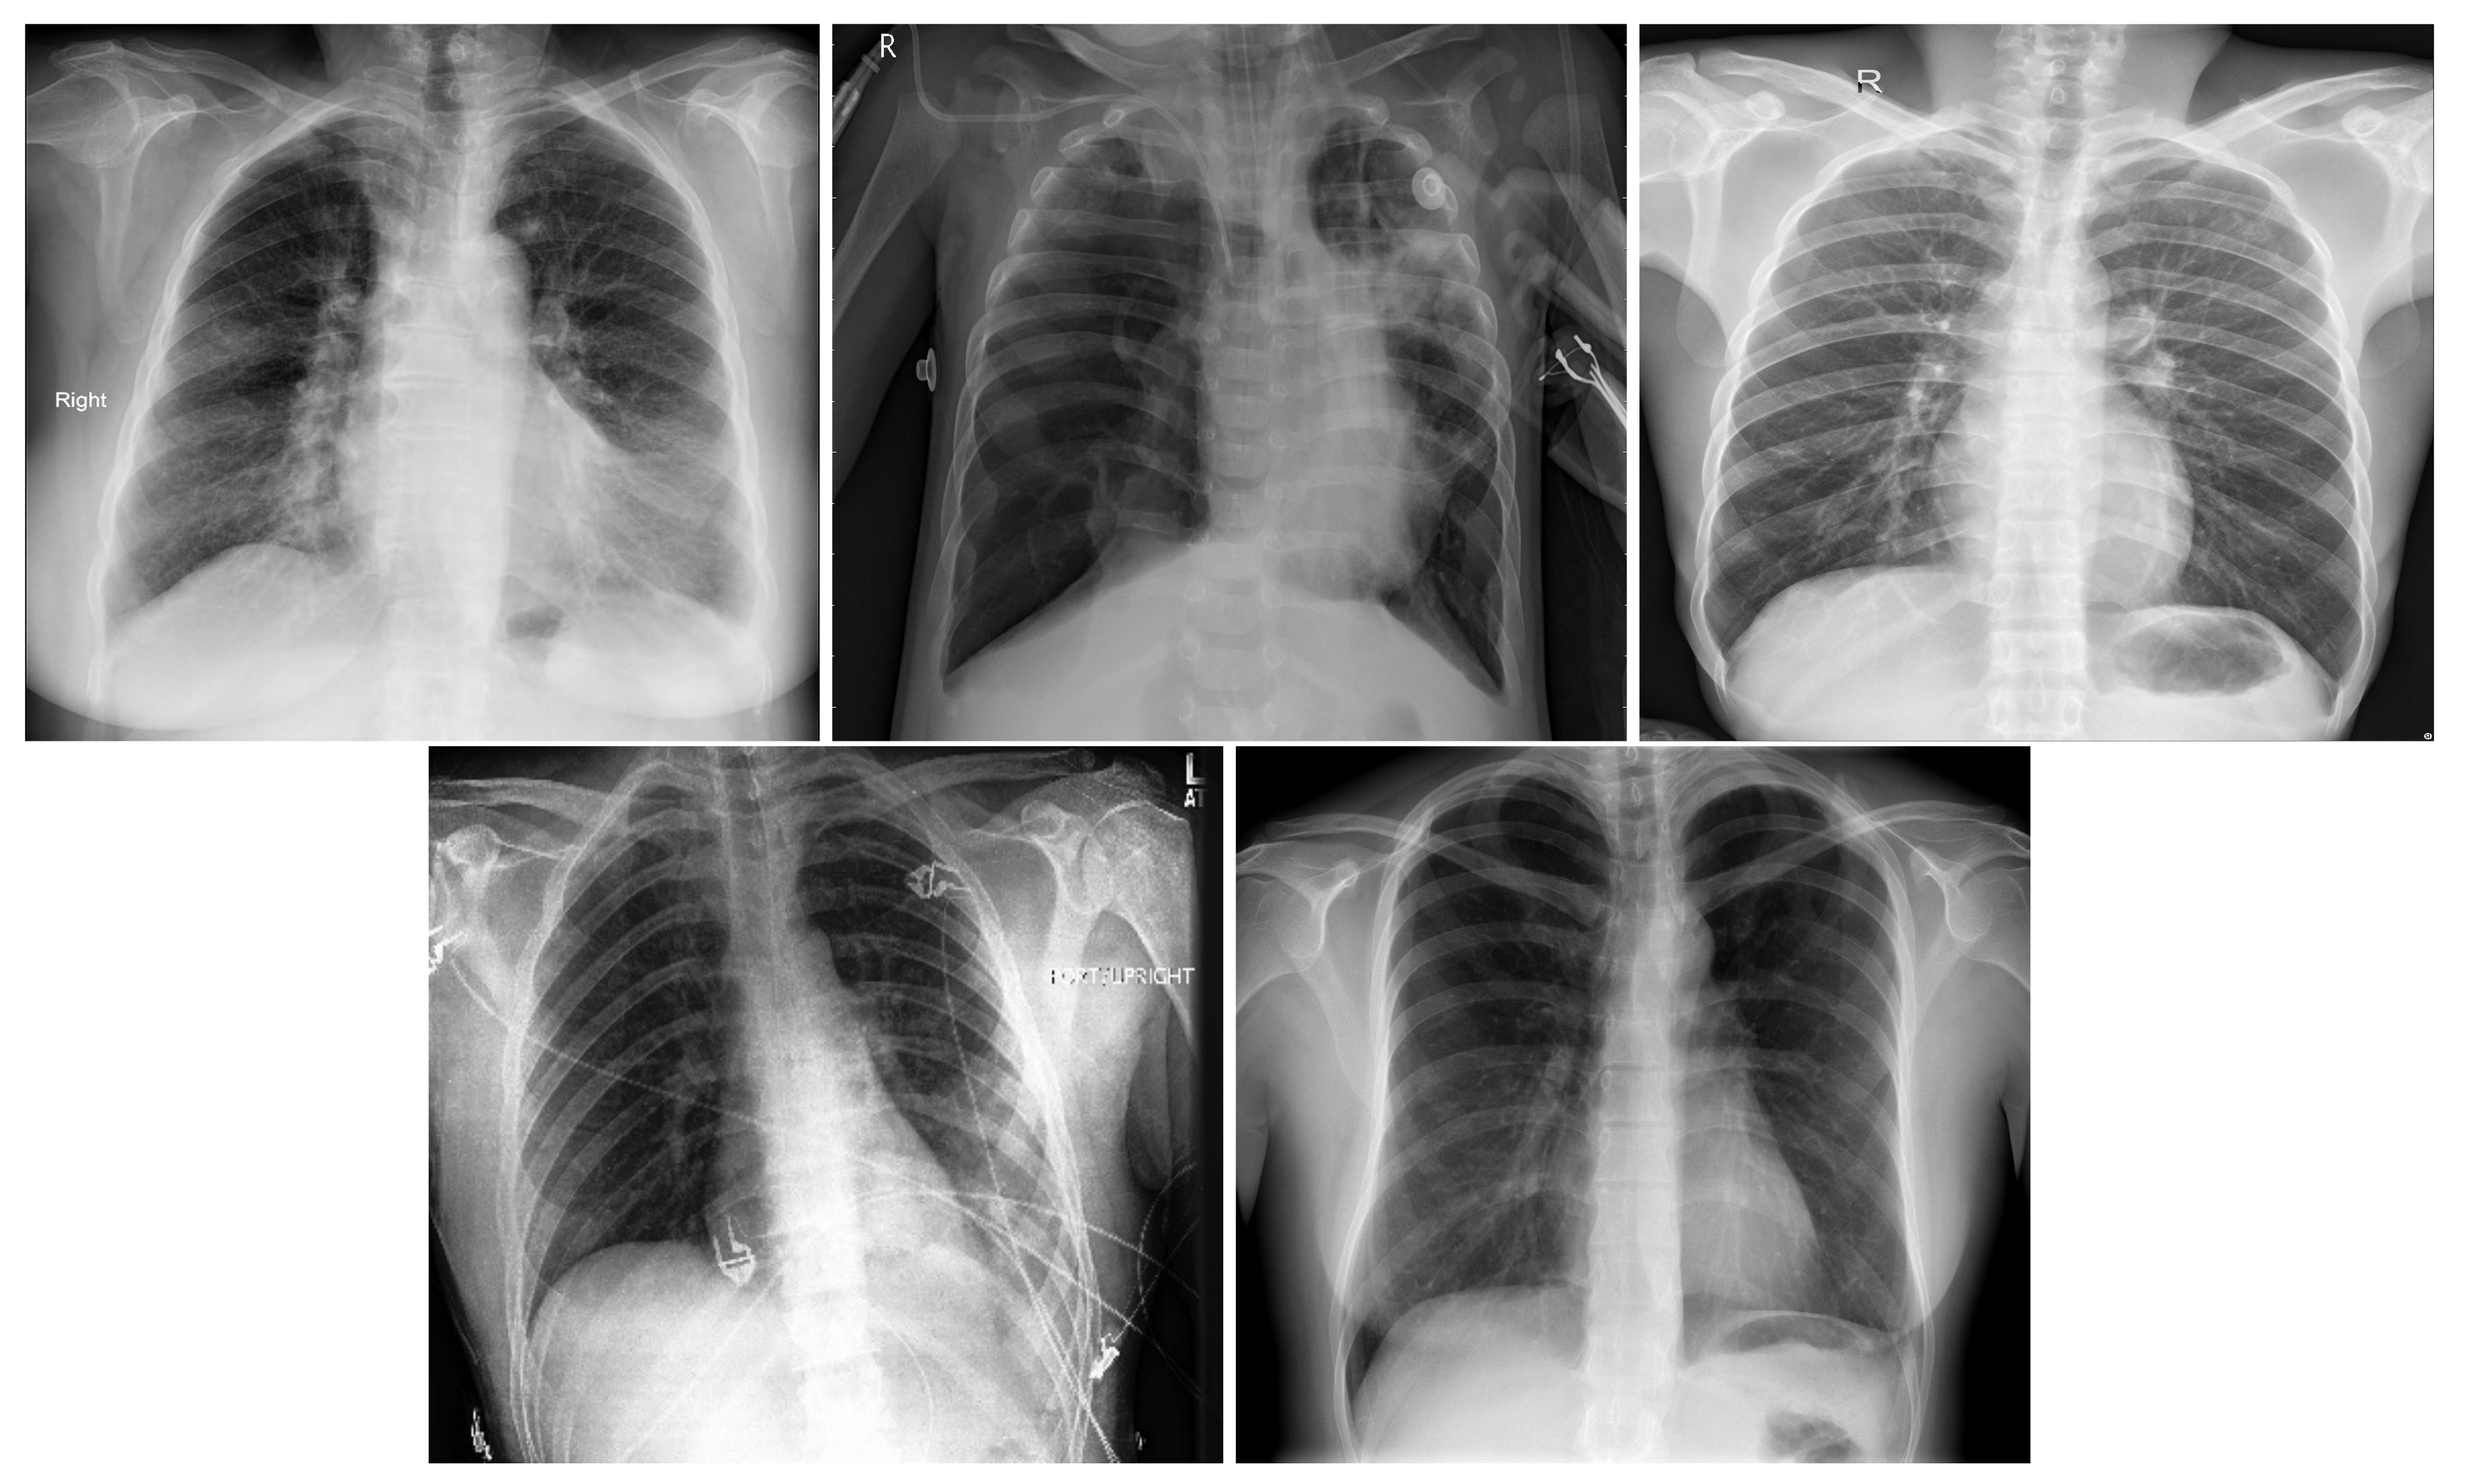
Figure 2.
In order: COVID-19, Viral Pneumonia, Bacterial Pneumonia, Lung Opacity, Normal.

Figure 3.
A ResneXt Module with cardinality = 32, with roughly the same complexity. A layer is shown as (# in channels, filter size, # out channels) [34].
Figure 3.
A ResneXt Module with cardinality = 32, with roughly the same complexity. A layer is shown as (# in channels, filter size, # out channels) [34].

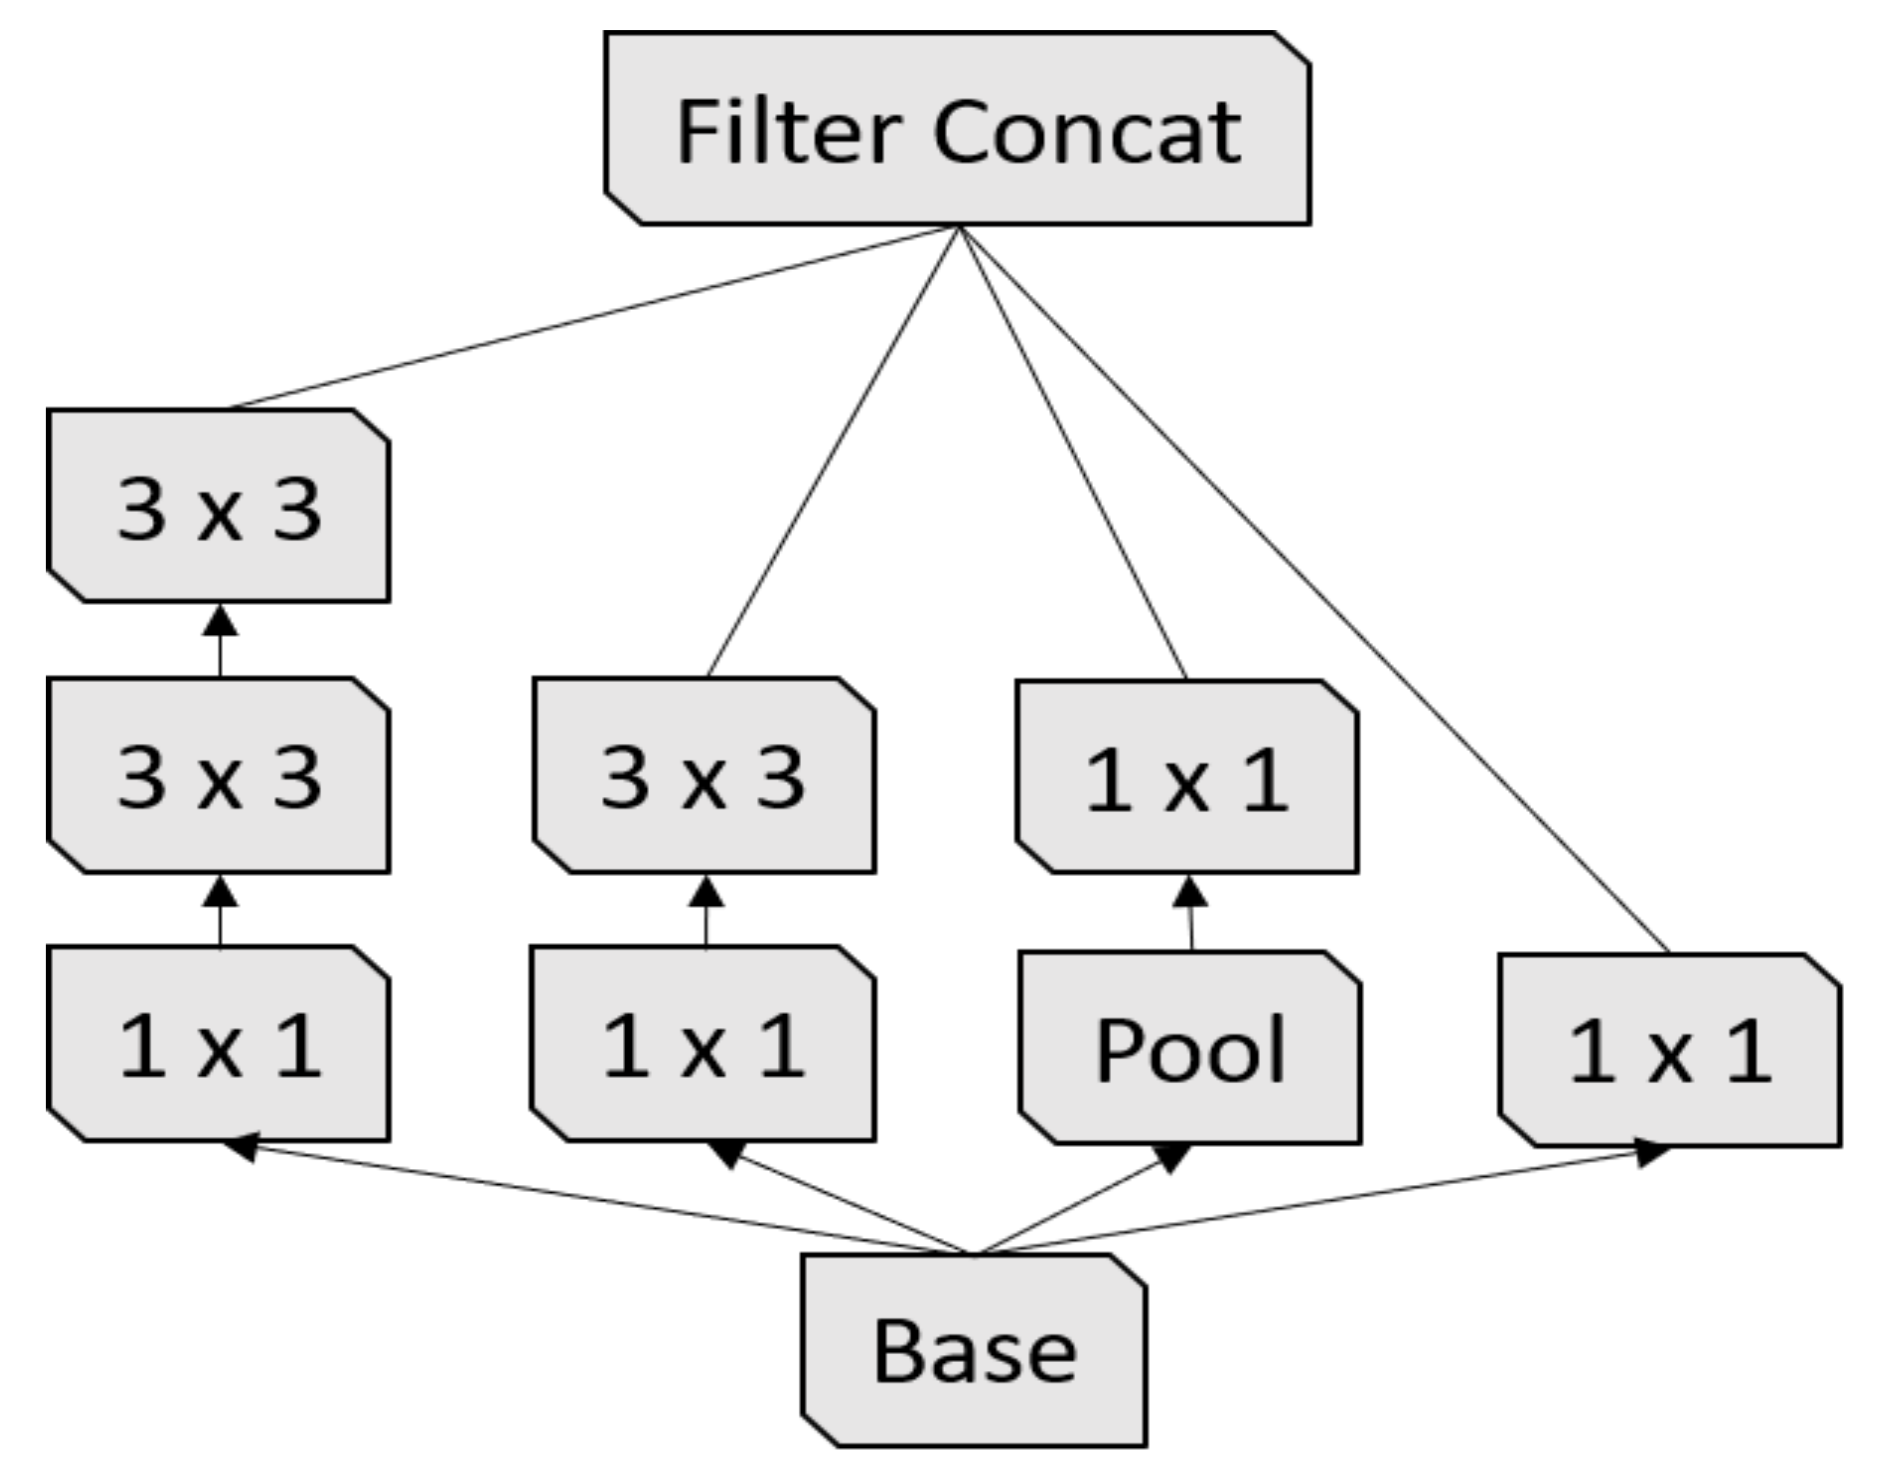
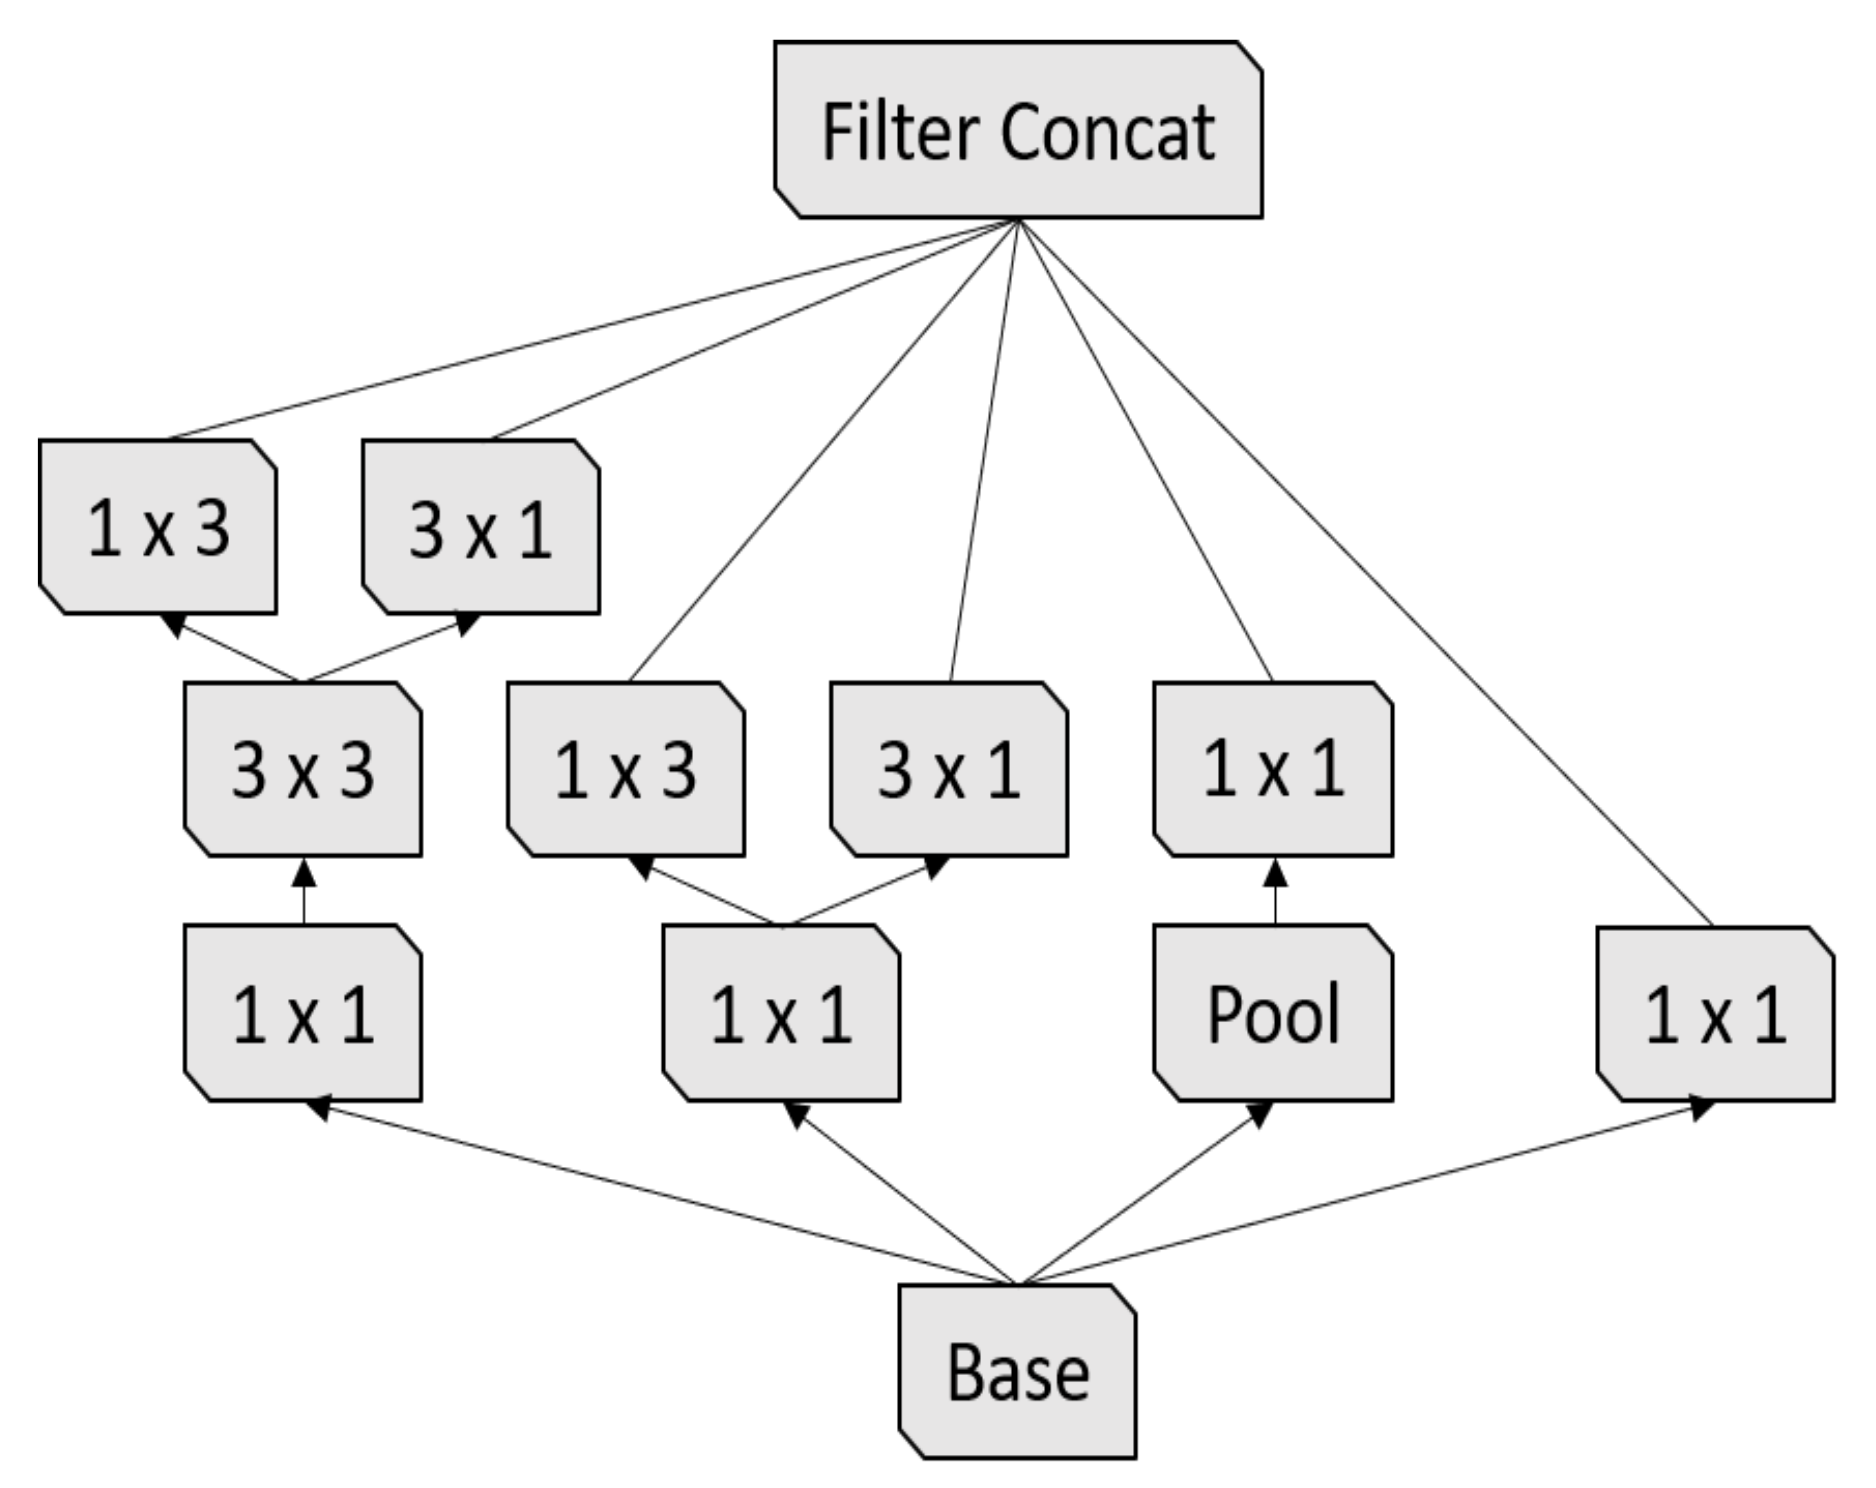
Figure 4.
First Inception module [17].
Figure 4.
First Inception module [17].

Figure 5.
Second Inception module [17].
Figure 5.
Second Inception module [17].

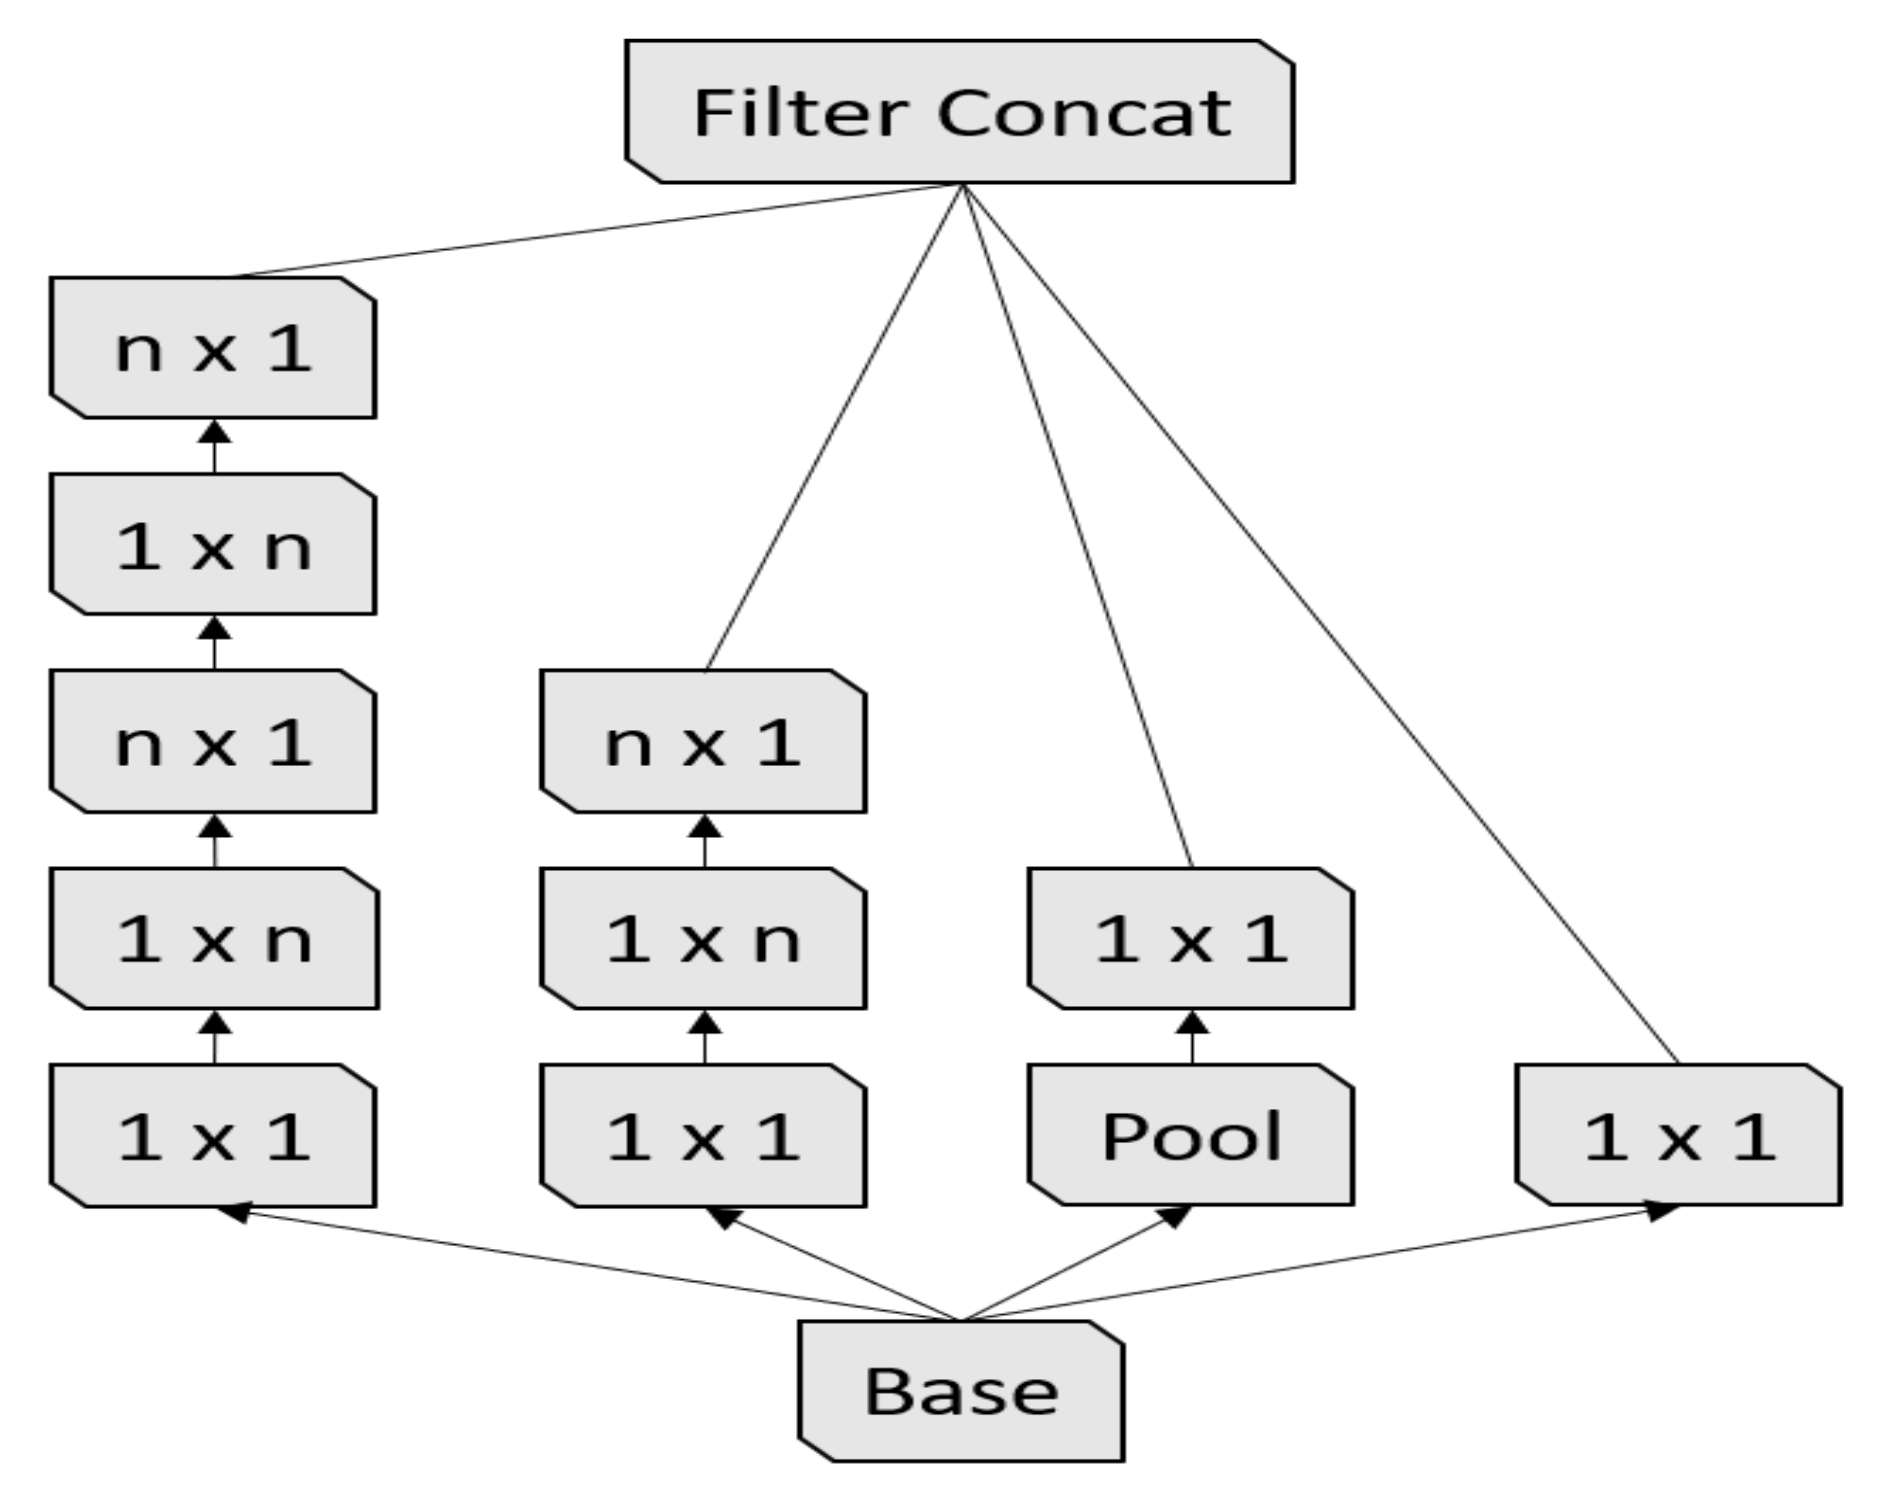
Figure 6.
Third Inception module [17].
Figure 6.
Third Inception module [17].

Figure 7.
A 5-layer dense block with a growth rate of k = 4. Each layer takes all the preceding feature-maps as an input [16].
Figure 7.
A 5-layer dense block with a growth rate of k = 4. Each layer takes all the preceding feature-maps as an input [16].

Figure 8.
The architecture of our proposed Ensemble-CNNs approach.

Figure 9.
Confusion matrices of the three-class COVID-19 testing data using ResneXt-50, Inception-v3, DenseNet-161, and Ensemble-CNNs, respectively. The vertical axis is for the true classes and the horizontal axis is for the predicted classes.
Figure 9.
Confusion matrices of the three-class COVID-19 testing data using ResneXt-50, Inception-v3, DenseNet-161, and Ensemble-CNNs, respectively. The vertical axis is for the true classes and the horizontal axis is for the predicted classes.

Figure 10.
Confusion matrices of the five-class COVID-19 testing data using ResneXt-50, Inception-v3, DenseNet-161, and Ensemble-CNNs, respectively. The vertical axis is for the true classes and the horizontal axis is for the predicted classes.
Figure 10.
Confusion matrices of the five-class COVID-19 testing data using ResneXt-50, Inception-v3, DenseNet-161, and Ensemble-CNNs, respectively. The vertical axis is for the true classes and the horizontal axis is for the predicted classes.

Figure 11.
(a) Normal case, (b) COVID-19 case, (c) Viral Pneumonia case, (d) Bacterial Pneumonia case, (e) Lung Opacity case.
Figure 11.
(a) Normal case, (b) COVID-19 case, (c) Viral Pneumonia case, (d) Bacterial Pneumonia case, (e) Lung Opacity case.


Table 1.
State-of-the-art works summary.
| Reference | Database | Splitting | Model | F1-Score |
|---|---|---|---|---|
| Hemdan et al. [14], 2020 | - 25 Covid-19 - 25 Normal | - 40% Train - 40% Val - 20% Test | VGG-19 ResNet-v2 DenseNet-201 | 90 67 90 |
| Apostolopoulos et al. [13], 2020 | - 224 Covid-19 - 714 Pneumonia (400 bacterial + 314 viral) - 504 Normal | 10-folds cross-validation | VGG-19 MobileNet-v2 Inception Xception Inception-ResNet v2 | 93.48 92.85 92.85 92.85 92.85 |
| Karim et al. [9], 2020 | - 259 Covid-19 - 8614 Pneumonia - 8066 Normal | 5-folds cross-validation | VGG-16 VGG-19 ResNet-18 ResNet-34 DenseNet-161 DenseNet-201 | 76.1 92.5 92.1 86.1 94.5 90.5 |
| Mangal et al. [22], 2020 | - 155 Covid-19 - 4273 Pneumonia - 1583 Normal | - 88.5% Train - 0.6% Val - 10.9% test | CovidAID | 92.3 |
| Yoo et al. [28], 2020 | - 585 Normal - 442 Abnormal - 492 TB - 492 Non TB - 120 Covid-19 | - 83.3% Train - 16.7% Test | AXIR 1 AXIR 2 AXIR 3 AXIR 4 | 98 80 100 89 |
| Turkoglu [1], 2020 | - 219 Covid-19 - 4290 Pneumonia - 1583 Normal | 10-folds cross-validation | COVIDetectioNet | 99.18 |
| A. T. Sahlol et al. [28], 2020 | - 200 Covid-19 - 1675 Non-Covid | Unknown | FO-MPA | 99.6 |
| A. T. Sahlol et al. [28], 2020 | - 219 Covid-19 - 1341 Non-Covid | Unknown | FO-MPA | 99 |
Table 2.
Three-class COVID-19 database sources and statistics.
| Class | Train Set Original + Augmented | Validation Set | Test Set |
|---|---|---|---|
| Covid-19 | 404 [29] + 4848 | 100 [29] | 207 [Our] |
| Pneumonia | 404 [30] + 4848 | 100 [30] | 207 [32] |
| Normal | 404 [30,31] + 4848 | 100 [30,31] | 207 [32] |
| Total | 1212 + 14,544 | 300 | 621 |
Table 3.
Five-Class COVID-19 database sources and statistics.
| Class | Train Set Original + Augmented | Validation Set | Test Set |
|---|---|---|---|
| Covid-19 | 404 [29] + 4848 | 100 [29] | 207 [Our] |
| Bacterial Pneumonia | 404 [30,33] + 4848 | 100 [30,33] | 207 [29] |
| Viral Pneumonia | 404 [29,30] + 4848 | 100 [29,30] | 207 [30] |
| Lung Opacity not Pneumonia | 404 [32] + 4848 | 100 [32] | 207 [32] |
| Normal | 404 [30,31,32] + 4848 | 100 [30,31,32] | 207 [33] |
| Total | 2020 + 24,240 | 500 | 1035 |
Table 4.
ResneXt-50 with a 32 × 4d template. Inside the brackets is the shape of a residual block, and outside the brackets is the number of stacked blocks on a stage. (C = 32) suggests grouped convolutions with 32 groups [34].
Table 4.
ResneXt-50 with a 32 × 4d template. Inside the brackets is the shape of a residual block, and outside the brackets is the number of stacked blocks on a stage. (C = 32) suggests grouped convolutions with 32 groups [34].
| Stage | Output | ResneXt-50 () |
|---|---|---|
| conv1 | , 64, stride 2 | |
| conv2 | max pool, stride 2 | |
| × 3 | ||
| conv3 | × 4 | |
| conv4 | × 6 | |
| conv5 | × 3 | |
| global average pool 1000-d fc, softmax |
Table 5.
Inception-v3 architecture [17].
Table 5.
Inception-v3 architecture [17].
| Type | Parch Size/Stride or Remark | Input Size |
|---|---|---|
| conv | ||
| conv | ||
| conv padded | ||
| pool | ||
| conv | ||
| conv | ||
| conv | ||
| Inception M1 | As in Figure 4 | |
| Inception M2 | As in Figure 5 | |
| Inception M3 | As in Figure 6 | |
| pool | ||
| linear | logits | |
| softmax | classifier |
Table 6.
DenseNet-161 architecture, the growth rate is . Note that each “conv” layer shown in the table corresponds with the sequence BN-ReLU-Conv [16].
Table 6.
DenseNet-161 architecture, the growth rate is . Note that each “conv” layer shown in the table corresponds with the sequence BN-ReLU-Conv [16].
| Layers | Outsize | DenseNet-161 () |
|---|---|---|
| Convolution | conv, stride 2 | |
| Polling | max pool, stride 2 | |
| Dense Block 1 | × 6 | |
| Transition | conv | |
| Layer 1 | average pool, stride 2 | |
| Dense Block 2 | × 12 | |
| Transition | conv | |
| Layer 2 | average pool, stride 2 | |
| Dense Block 3 | × 36 | |
| Transition | conv | |
| Layer 1 | average pool, stride 2 | |
| Dense Block 4 | × 24 | |
| Classification | global average pool | |
| Layer | 1000D fully connected, softmax |
Table 7.
The experimental results for the validation data of our proposed three-class COVID-19 database.
Table 7.
The experimental results for the validation data of our proposed three-class COVID-19 database.
| Model | Accuracy (%) | Precision (%) | Sensitivity (%) | Specificity (%) | F1-Score (%) | AUC |
|---|---|---|---|---|---|---|
| ResNeXt-50 | 95.67 ± 2.30 | 95.05 | 94.99 | 97.50 | 95.00 | 0.9625 |
| Inception-v3 | 92.67 ± 2.95 | 93.38 | 93.38 | 93.00 | 93.01 | 0.9475 |
| DenseNet-161 | 95.00 ± 2.47 | 95.33 | 95.33 | 94.99 | 94.99 | 0.9625 |
| Ensemble-CNNs | 96.67 ± 2.03 | 96.77 | 96.67 | 98.33 | 96.66 | 0.9750 |
Table 8.
The experimental results for the testing data of our proposed three-class COVID-19 database.
Table 8.
The experimental results for the testing data of our proposed three-class COVID-19 database.
| Model | Accuracy (%) | Precision (%) | Sensitivity (%) | Specificity (%) | F1-Score (%) | AUC |
|---|---|---|---|---|---|---|
| ResNeXt-50 | 75.42 ± 3.39 | 78.85 | 75.36 | 87.68 | 73.53 | 0.8080 |
| Inception-v3 | 72.92 ± 3.50 | 73.18 | 72.95 | 71.30 | 72.92 | 0.7971 |
| DenseNet-161 | 74.44 ± 3.43 | 76.84 | 74.40 | 87.20 | 72.69 | 0.8152 |
| Ensemble-CNNs | 75.23 ± 3.40 | 78.28 | 75.20 | 87.60 | 73.43 | 0.8140 |
Table 9.
False positive of the testing three-class split for the COVID-19 class.
| Model | False Positive | Total | |
|---|---|---|---|
| Normal | Pneumonia | ||
| ResNeXt-50 | 2 | 9 | 11 |
| Inception_v3 | 16 | 12 | 28 |
| DenseNet-161 | 2 | 6 | 8 |
| Ensemble-CNNs | 2 | 7 | 9 |
Table 10.
The experimental results of the validation data of our proposed five-class COVID-19 database.
Table 10.
The experimental results of the validation data of our proposed five-class COVID-19 database.
| Model | Accuracy (%) | Precision (%) | Sensitivity (%) | Specificity (%) | F1-Score (%) | AUC |
|---|---|---|---|---|---|---|
| ResNeXt-50 | 81.24 ± 3.42 | 83.96 | 83.60 | 86.40 | 83.63 | 0.8870 |
| Inception-v3 | 80.55 ± 3.47 | 82.57 | 83.20 | 85.80 | 83.07 | 0.8950 |
| DenseNet-161 | 82.20 ± 3.35 | 84.50 | 84.40 | 89.85 | 84.40 | 0.8963 |
| Ensemble-CNNs | 93.2 ± 2.21 | 93.93 | 93.20 | 98.30 | 93.25 | 0.9575 |
Table 11.
The experimental results of the testing data of our proposed five-class COVID-19 database.
Table 11.
The experimental results of the testing data of our proposed five-class COVID-19 database.
| Model | Accuracy (%) | Precision (%) | Sensitivity (%) | Specificity (%) | F1-Score (%) | AUC |
|---|---|---|---|---|---|---|
| ResNeXt-50 | 79.94 ± 2.44 | 81.42 | 79.90 | 84.79 | 79.57 | 0.8617 |
| Inception-v3 | 78.62 ± 2.50 | 79.35 | 78.65 | 84.66 | 78.31 | 0.8665 |
| DenseNet-161 | 77.93 ± 2.53 | 80.43 | 77.51 | 84.47 | 77.93 | 0.8744 |
| Ensemble-CNNs | 81.00 ± 2.39 | 82.99 | 82.96 | 85.24 | 81.49 | 0.8810 |
Table 12.
The best classification method for each class of the testing split of the five-class scenario.
Table 12.
The best classification method for each class of the testing split of the five-class scenario.
| Class | Model | Best Accuracy (%) |
|---|---|---|
| Bacterial Pneumonia | DenseNet-161 | 58.0 |
| COVID-19 | Ensemble-CNNs | 98.1 |
| Lung Opacity Not Penumonia | Ensemble-CNNs | 98.1 |
| Normal | Inception-v3 | 72.0 |
| Viral Pneumonia | DenseNet-161 & Ensemble-CNNs | 86.0 |
Table 13.
Comparison between our results and the state-of-the-art results for the recognition of COVID-19 infection.
Table 13.
Comparison between our results and the state-of-the-art results for the recognition of COVID-19 infection.
| Reference | Classes | Total COVID-19 Samples | Test COVID-19 Samples | COVID-19 Accuracy |
|---|---|---|---|---|
| Hemdan et al. [14] | 2 | 25 | 5 | 100% |
| Apostolopoulos et al. [13] | 3 | 224 | 24 | 98.66% |
| Karim et al. [9] | 3 | 259 | 137 | 90.5% |
| Mangal et al. [22] | 3 | 155 | 30 | 100% |
| Yoo et al. [4] | 4 | 120 | 42 | 95% |
| Turkoglu et al. [1] | 3 | 219 | 20 | 100% |
| Ensemble-CNNs (our) | 3 | 711 | 207 | 100% |
| Ensemble-CNNs (our) | 5 | 711 | 207 | 98.1% |
Table 14.
Testing time for the evaluated CNN architecture and our proposed Ensemble-CNNs approach for three-class and five-class scenarios.
Table 14.
Testing time for the evaluated CNN architecture and our proposed Ensemble-CNNs approach for three-class and five-class scenarios.
| Model | Scenario | |
|---|---|---|
| Three-Class Scenario (s) | Five-Class Scenario (s) | |
| ResNeXt-50 | 0.024985 | 0.029988 |
| Inception-v3 | 0.014991 | 0.065963 |
| DenseNet-161 | 0.037979 | 0.038977 |
| Ensemble-CNNs | 0.077955 | 0.134928 |
Publisher’s Note: MDPI stays neutral with regard to jurisdictional claims in published maps and institutional affiliations. |
© 2021 by the authors. Licensee MDPI, Basel, Switzerland. This article is an open access article distributed under the terms and conditions of the Creative Commons Attribution (CC BY) license (http://creativecommons.org/licenses/by/4.0/).
Share and Cite
MDPI and ACS Style
Vantaggiato, E.; Paladini, E.; Bougourzi, F.; Distante, C.; Hadid, A.; Taleb-Ahmed, A. COVID-19 Recognition Using Ensemble-CNNs in Two New Chest X-ray Databases. Sensors 2021, 21, 1742. https://doi.org/10.3390/s21051742
AMA Style
Vantaggiato E, Paladini E, Bougourzi F, Distante C, Hadid A, Taleb-Ahmed A. COVID-19 Recognition Using Ensemble-CNNs in Two New Chest X-ray Databases. Sensors. 2021; 21(5):1742. https://doi.org/10.3390/s21051742
Chicago/Turabian StyleVantaggiato, Edoardo, Emanuela Paladini, Fares Bougourzi, Cosimo Distante, Abdenour Hadid, and Abdelmalik Taleb-Ahmed. 2021. "COVID-19 Recognition Using Ensemble-CNNs in Two New Chest X-ray Databases" Sensors 21, no. 5: 1742. https://doi.org/10.3390/s21051742
Note that from the first issue of 2016, this journal uses article numbers instead of page numbers. See further details here.