Facilitating Mathematical Competencies Development for Undergraduate Students During the Pandemic Through ad-hoc Technological Learning Environments
 Sergio Ruiz Loza1*†
  Linda Margarita Medina Herrera1†
  José Martín Molina Espinosa2
  Gilberto Huesca Juárez1
- 1Computer Science Department, Tecnologico de Monterrey, Mexico City, Mexico
- 2Institute for the Future of Education, Tecnologico de Monterrey, Mexico City, Mexico
In this article we show how to facilitate the development of mathematical skills using 3D surface visualization tools and virtual environments in an online, project-based learning context. The “Lumen” software is presented, which is an ad-hoc solution, designed and developed to visualize and combine mathematical surfaces in 3D, based on their associated equations. Several activities were designed with the use of Lumen, to measure the learning gain and problem-solving skills of the students, obtaining that a mean learning gain of 43% was observed on 242 students on the analysis of the pre- and post-tests for the first monitored activity, while a mean learning gain of 30% was observed on 210 students on the analysis of the second monitored activity. Based on these analyses, we make the point that although remote learning in the context of the COVID-19 pandemic poses difficult challenges for learners and professors, the use of ad-hoc technological applications is an important resource that supports the reinterpretation of the learning process, as it shifts the focus to the development of skills through active learning.
Introduction
Mathematical skills are important for different areas in life, so there has been an important need to develop them in students, as they are part of the foundations needed to develop other elements. One example of these competences is spatial visualization skills that are needed in different knowledge areas like design (Suh and Cho, 2020), arts (Pérez-Fabello et al., 2018), and engineering (Buentello-Montoya et al., 2021). Research has been done like in LeBow et al. (2018), Medina Herrera et al. (2019), Casey and Ganley (2021), and Johnson et al. (2022) exploring different topics like gender characteristics, school level, subject applied to or educational technology. On the other hand, research shows the constant search for tools and methodologies that can motivate and engage students in the study of mathematics to create a meaningful teaching-learning process (Xiao et al., 2018; Trujillo-Torres et al., 2020; Hagen et al., 2022). Gamification and edutainment systems have drawn attention to electronic devices and game-like environments. The use of virtual environments allows to increase motivation and can be used also to develop important skills such as mathematical visualization, problem solving and logical thinking. Additionally, this type of environment would be a useful tool, for teachers and students, in distance learning-based courses like those that had to be implemented in the recent pandemic. In this work, we present an implementation of a virtual learning environment designed to help active learning courses to develop visualization skills and mathematical competencies in undergraduate students. Also, we present the corresponding for a pre-test and post-test process.
This document is organized as follows:
• Introduction. This section.
• Section “Mathematical Competencies and Meaningful Learning” describes the characteristics of a mathematical learning environment and the need of meaning while learning.
• Section “Technological Learning Environments and the Development of Mathematical Competencies” introduces the use of technological elements to support learning and presents de Lumen software.
• Section “Implementation Methodology” describes the study in this work and its results.
• Section “Discussion” presents the discussion and conclusion of this work.
Mathematical Competencies and Meaningful Learning
In recent decades, universities have carried out educational innovation with the purpose of enhancing students’ motivation and achievement (Denham et al., 2021; Mainali, 2021). Reaching a deep understanding of complex ideas, meaningful learning implies that knowledge can be manipulated and applied to a variety of situations and contexts. Whereas traditional mathematics teaching focused on the transmission of mathematical knowledge and concepts through repetition and memorization, for the last half century, instructional models that emphasize approaches based on meaning, processes, and problems have increased attractiveness (Algani, 2019). Meaningful learning is associated with active, constructive, intentional, and authentic learning (Koskinen and Pitkäniemi, 2022). The process of meaningful learning occurs when students build knowledge and cognitive processes which are required to prefer a problem-solving task. Another important characteristic of meaningful learning is one that can be context-bound and transferable to real-life professional settings and practices. Fink (2013) presents a taxonomy that identifies the different ways in which learning can be meaningful that includes six kinds of significant learning: (1) Foundational Knowledge, responsible for providing the basic understanding that is necessary for other kinds of learning. (2) Application allows other kinds of learning to become useful. (3) Integration, when students can see and understand the connections between different things. (4) Human Dimension, when students learn something important about their own self and/or about others, it enables them to interact more effectively with themselves or with others. (5) Caring, when students care about something, they then have the energy they need for learning more about it and making it a part of their lives. (6) Learning How to Learn, this occurs when students learn something about the process of learning itself.
Meaningful learning in mathematics is closely linked to the development of eight important competencies which can be classified into two groups: The first group of competencies are to do with the ability to ask and answer questions in and with mathematics: thinking mathematically, posing, and solving mathematical problems, modeling mathematically, and reasoning mathematically. The other group of competencies are to do with the ability to deal with and manage mathematical language and tools: representing mathematical entities, handling mathematical symbols and formalisms, communicating in, with, and about mathematics and making use of aids and tools. Competence-based learning emphasizes the process, rather than obtaining results (Niss et al., 2016; Niss and Højgaard, 2019; Dunagan and Larson, 2021). Figure 1 shows the relationship between meaningful learning and the development of mathematical skills.
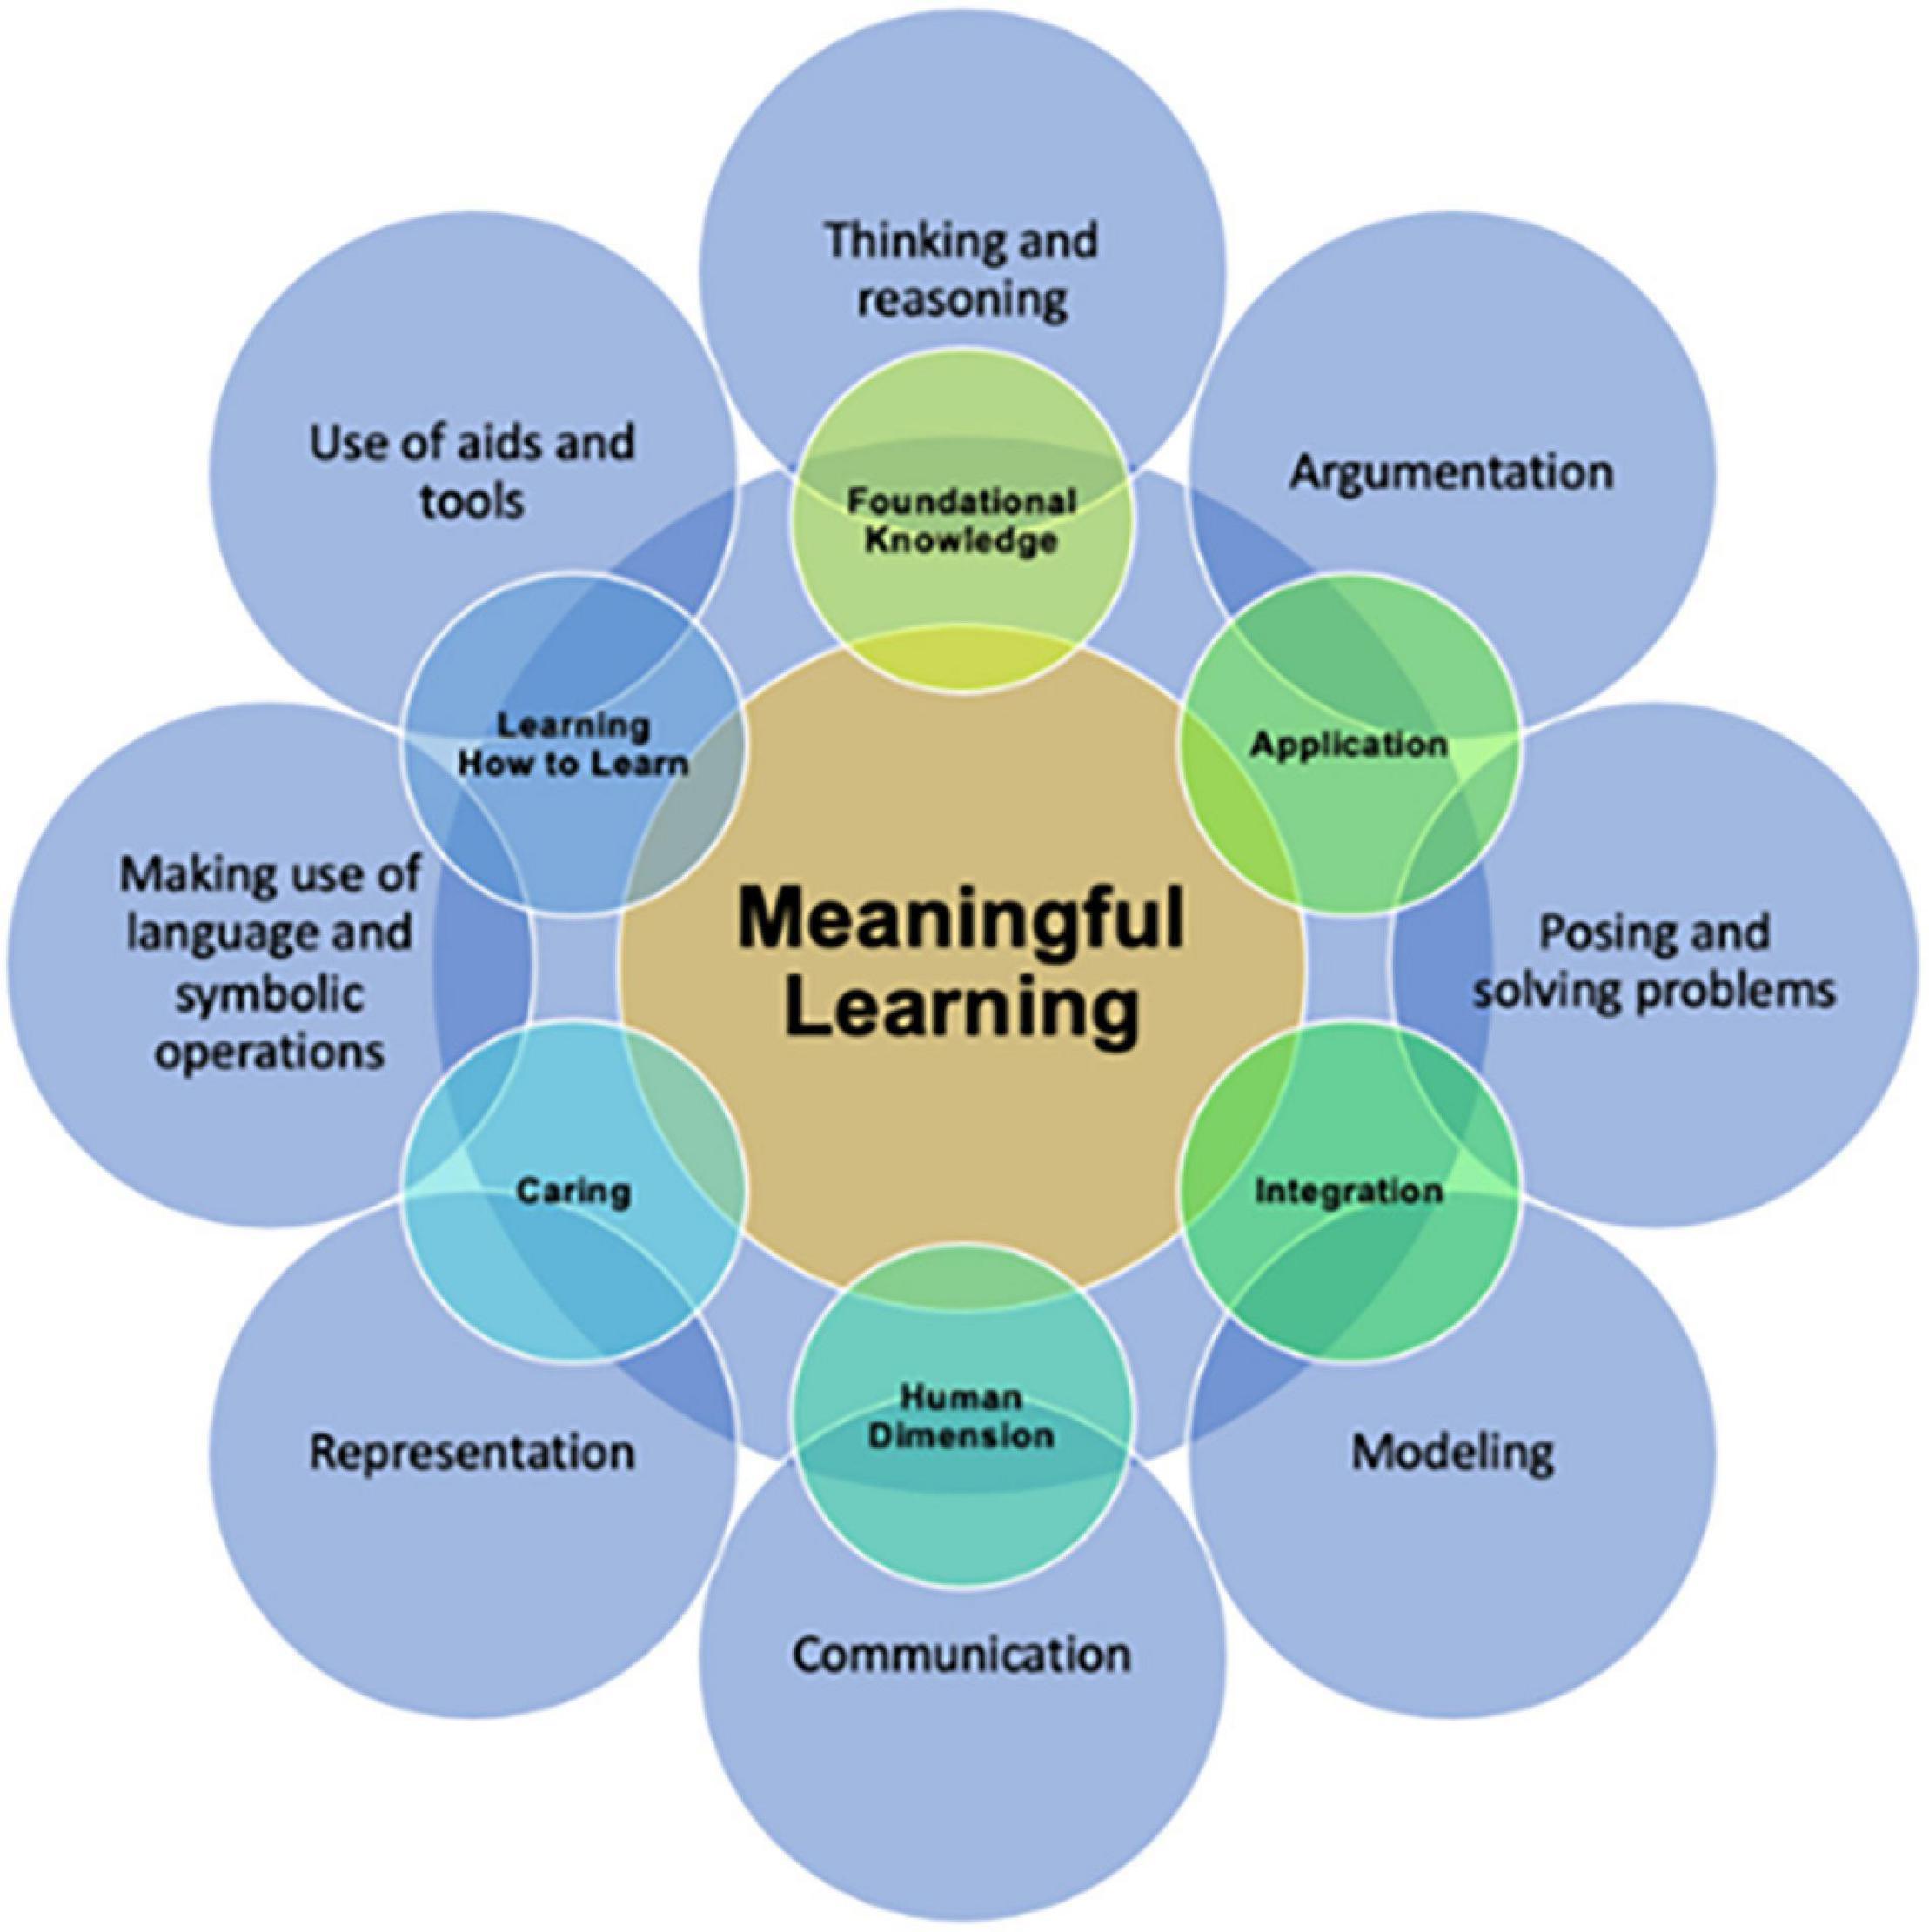
Figure 1. Mathematical competencies and meaningful learning.
The competencies approach seeks to change the role of the student in the learning process by promoting the exchange of ideas and experiences with their peers, which allow them to build knowledge to transfer it to everyday contexts and situations.
Technological Learning Environments and the Development of Mathematical Competencies
Technological Learning Environments have proven to be ideal places for the development of mathematical skills. Medina Herrera et al. (2019) show that using augmented reality, virtual reality, and 3D printing, students can develop spatial visualization and problem-solving skills. These environments are also ideal for the use of important methodologies such as problem-based learning, projects and gamification, whose achievements in the development of mathematical competencies are well known (Huesca Juárez and Medina Herrera, 2019; Medina Herrera, 2020; Medina Herrera et al., 2020).
Pedagogical activities with the use of virtual environments, grants students to develop spatial orientation and visualization skills by allowing them to observe and manipulate surfaces in space and solve problems related to these figures. The individual and team work to which the students were exposed, which we will describe later, requires that the students think and reason, make models and argue each of the steps they take in search of the solution to the problem. As part of the process, communication with team members and with the teacher and the use of symbolic language are present.
Learning in Unified Mathematics Environments: Lumen Software
The Lumen (Learning in Unified Mathematics Environments) software is a mathematical tool whose purpose is to visualize the relation of geometric shapes in 3D with their quadratic equation representation, showing, in real-time, that the changes in parameters for these equations produce changes in the geometry and topology of their three-dimensional representation. Originally, Lumen was designed as a Technological Learning Environment, assembled with software components to provide functionalities for: multi-user remote and local execution, VR, AR, and 3D printing in the PC, iOS, and Android platforms. The authors’ aim is to develop an integrated tool that provides these functionalities during the same experience, since there are different options that provide these functionalities, but in separate programs that are not meant to share the formats for the mathematical shapes. The authors believe that this kind of unified tool will be able to provide a richer learning experience.
Developed from scratch by the authors as part of a Novus project, using the Unity video game engine platform, the original functionality of the Lumen application included multiuser execution via a cloud-enabled runtime for the modalities: desktop, cellphone (iOS and Android), tablet (iOS and Android), VR (Oculus Go), AR (iOS and Android), and 3D printing. Since the development of Lumen spanned from 2018 to 2020, the scope of its functionality had to be adapted to the development restrictions imposed by the pandemic. The final functionality for testing with the mathematical activities described in Section “Mathematical Activities Using Lumen” was set to:
• Multiuser execution via a cloud-enabled runtime.
• Desktop.
• Cellphone and Tablet (Android).
To help describe the general architecture of the Lumen software, Figure 2 shows the main software components that provide the functionality described next.
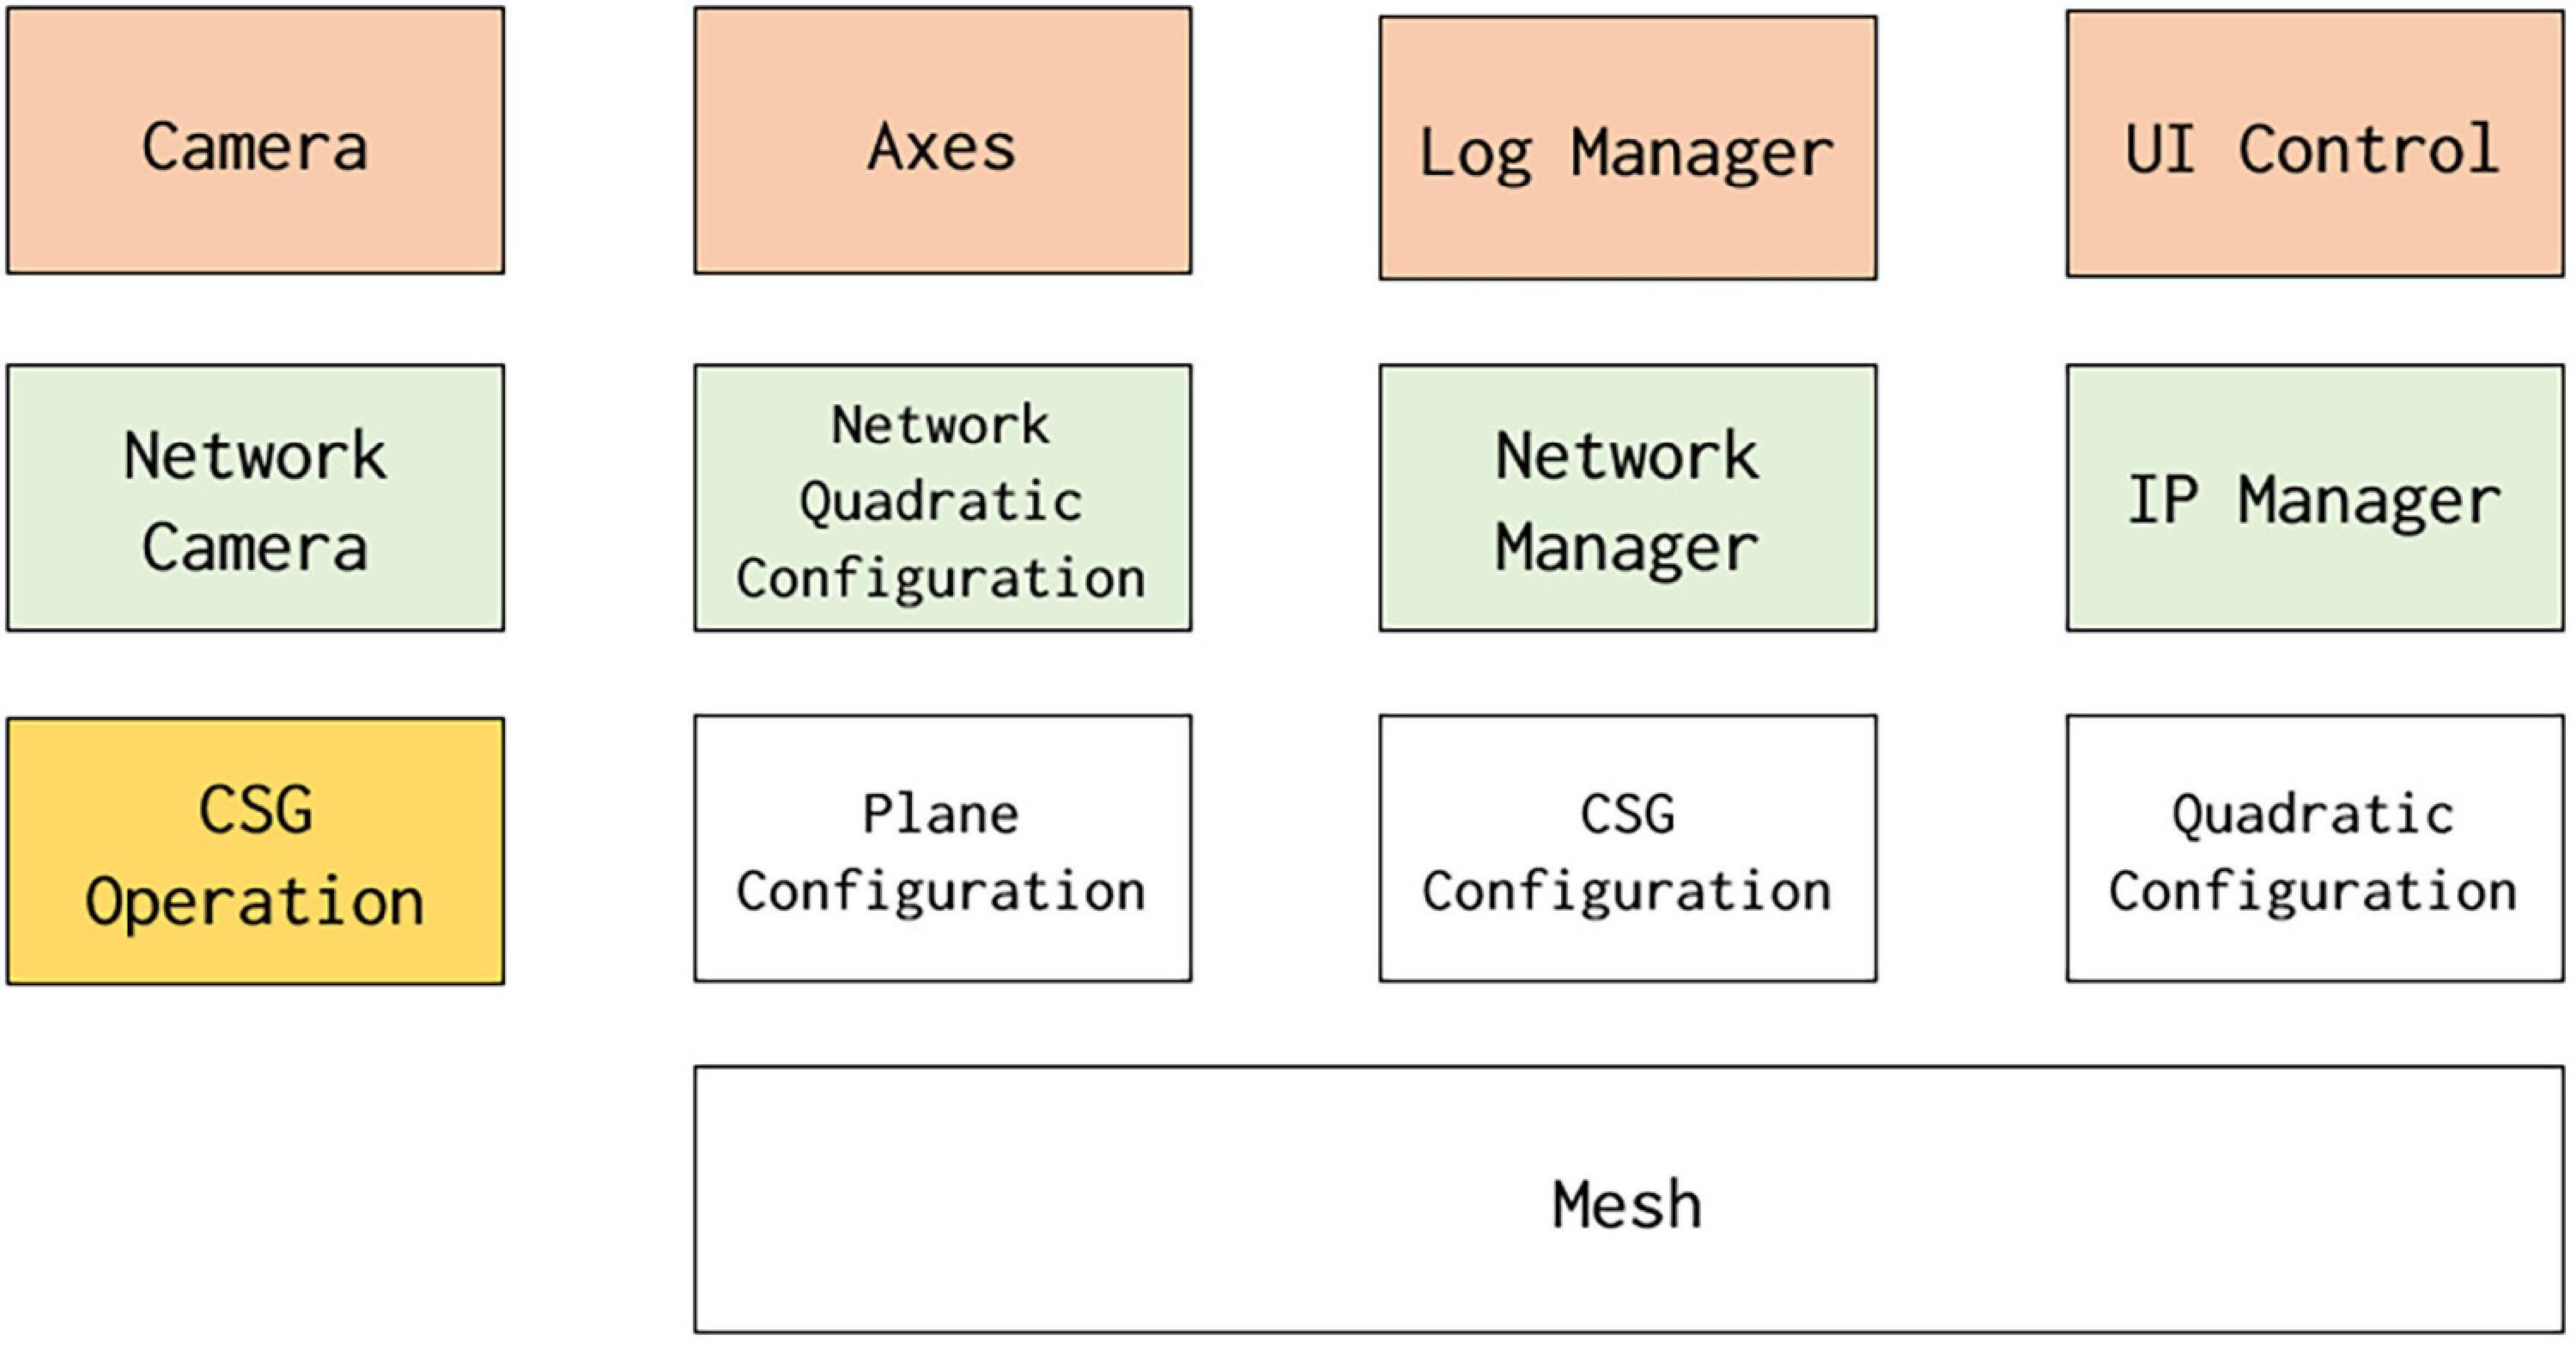
Figure 2. Main components of the Lumen software.
User Interface Components
The Camera, Axes, Log Manager, and UI Control are code objects designed to manage and display the user interface objects that are present during the program execution: the user’s point of view, orientation and zoom level, the 3D axes and scale reference, the event log, the 3D scene, and menus to interact (Figure 3).
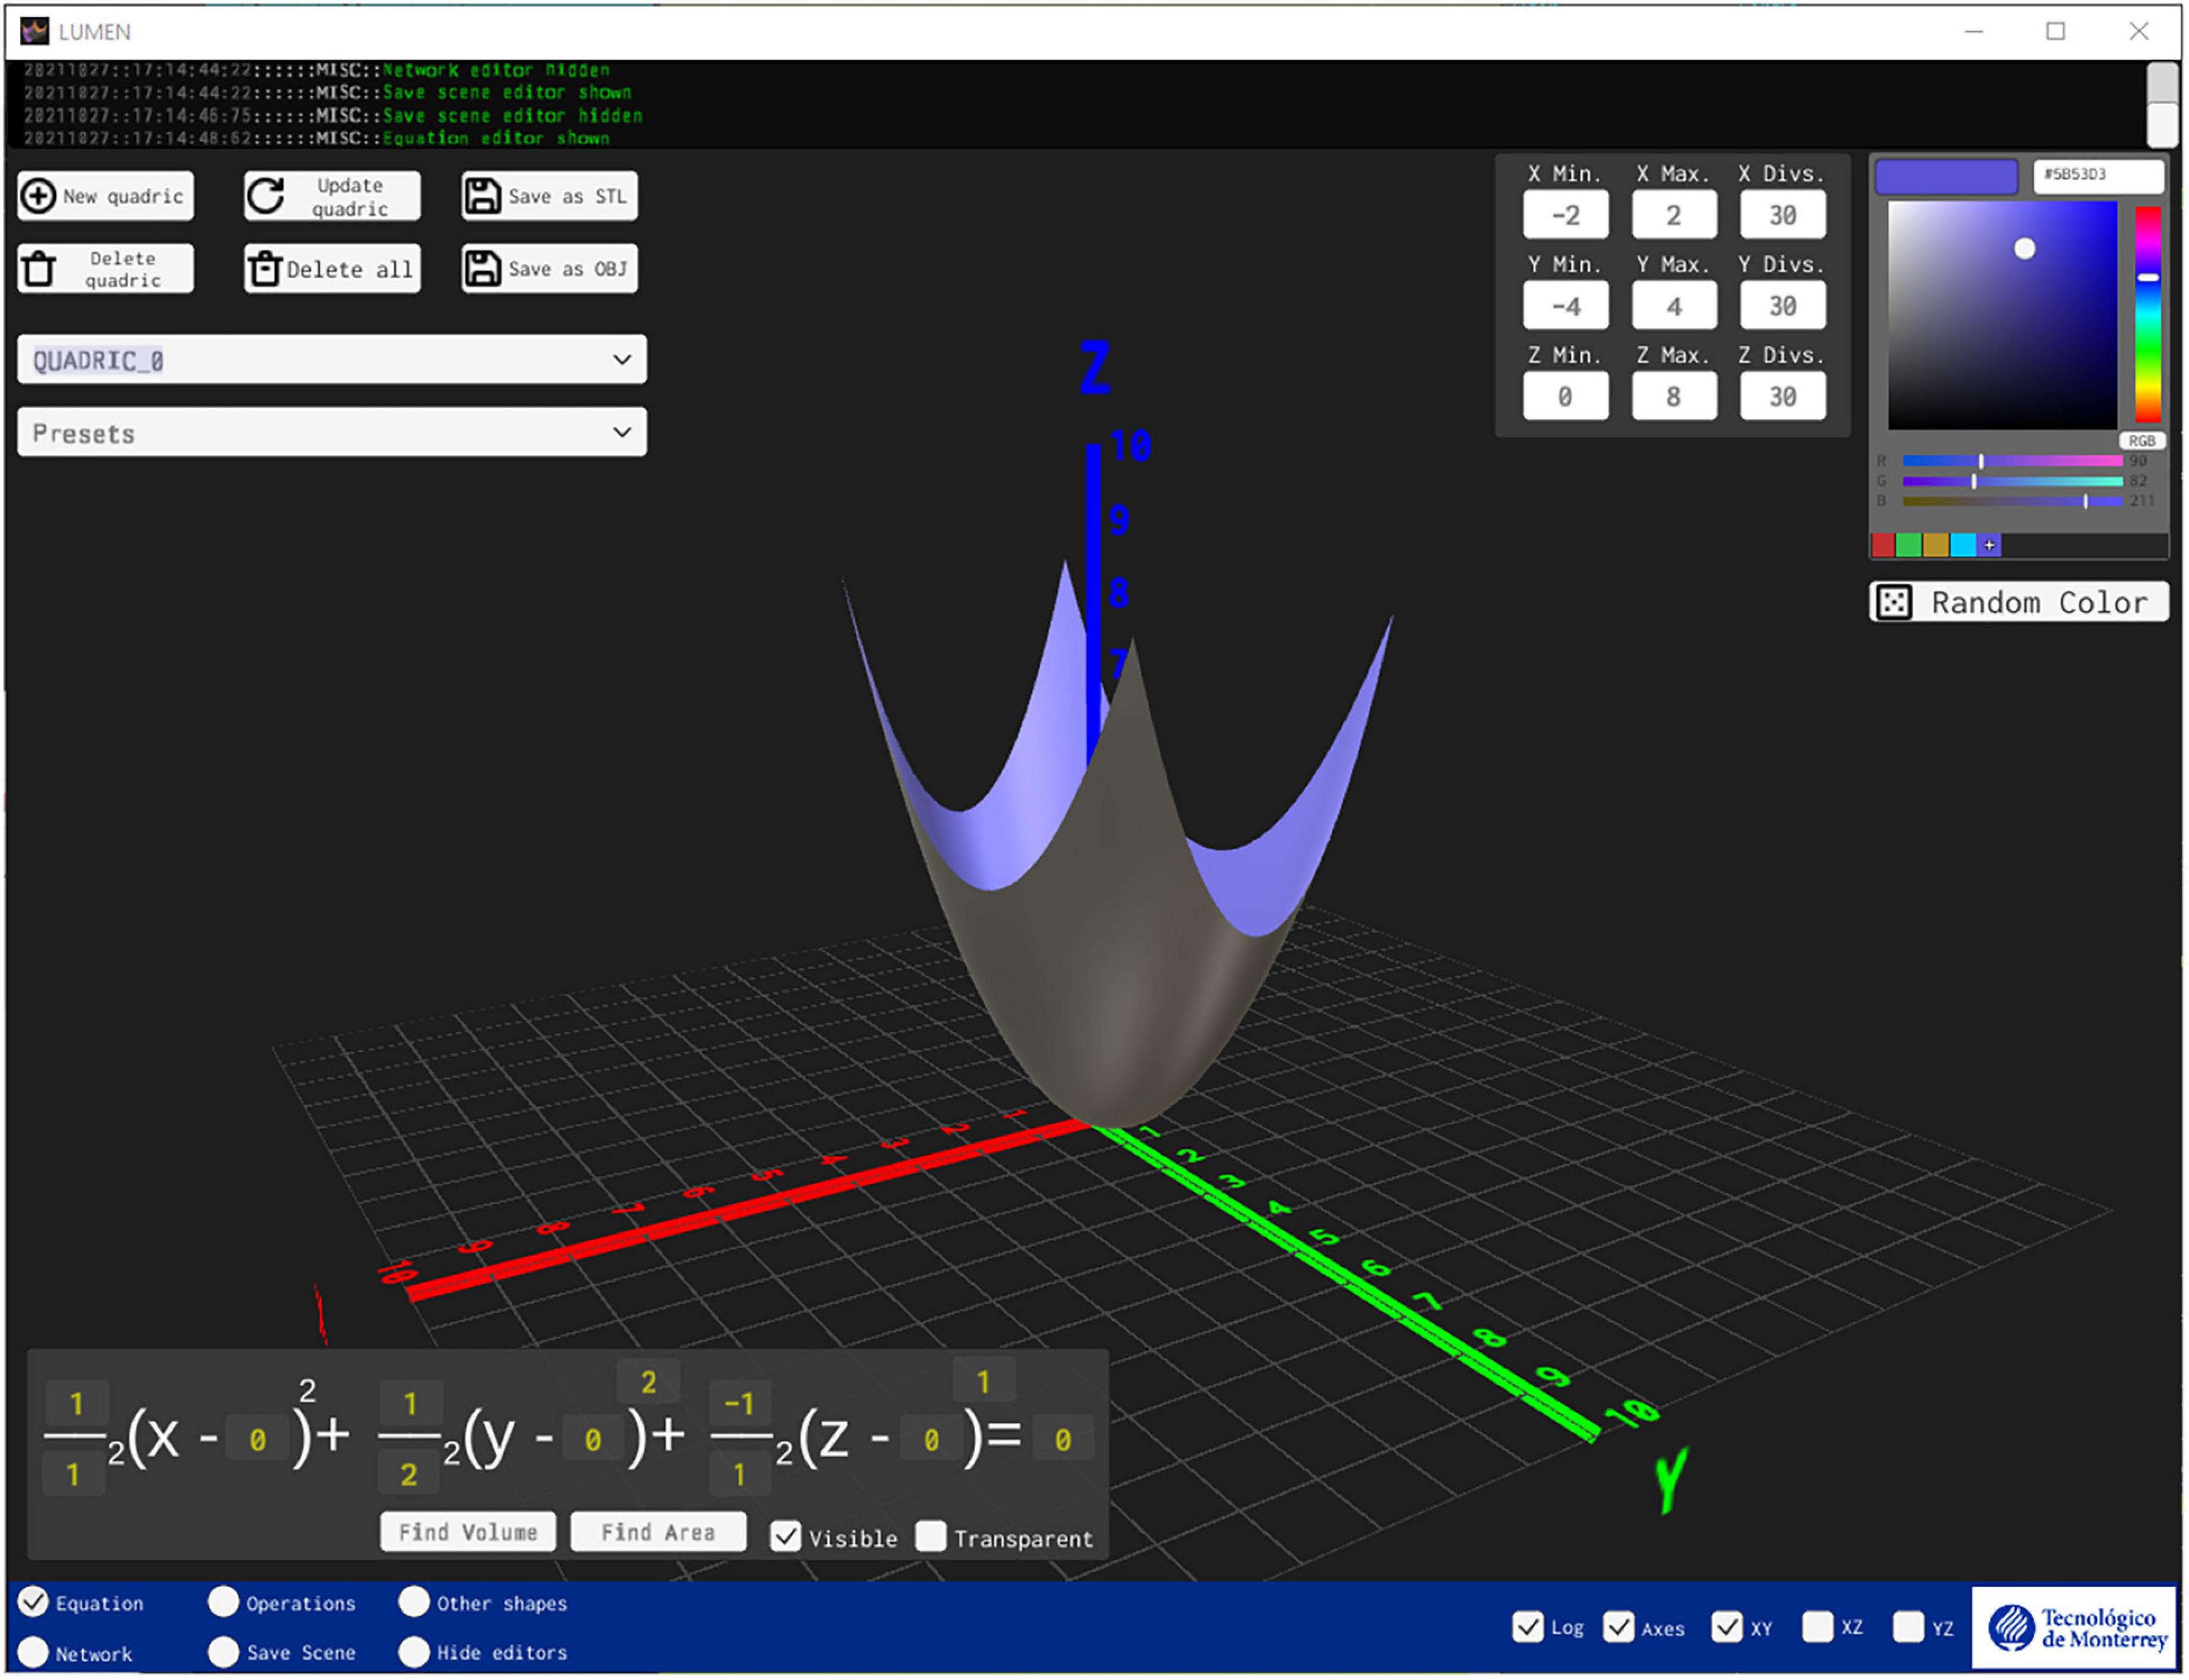
Figure 3. User interface and menus for the Lumen application.
Equation Menu
Presents interaction elements that allow the user to:
• Define a quadratic equation, either by setting each parameter manually or by choosing one of 17 presets and visualize its graphical representation.
• Control the camera point of view through rotations and zoom gestures.
• Visualize changes in geometry by modifying the equation parameters.
• Hide or show visual aids such as the event log, the axes, and the axes grids.
• Find the volume (when the equation represents a closed shape) and area of the displayed shape.
• Add, delete, or update one or all the displayed shapes. Lumen supports up to 10 simultaneous shapes.
• Export the selected shape to a file. Lumen supports exporting to the OBJ and STL file formats, suitable for 3D digital design and 3D printing, respectively.
Operations Menu
Presents interaction elements that allow the user to perform Constructive Solid Geometry (CSG) operations (Section “Constructive Solid Geometry Operation Component”).
Other Shapes Menu
Presents interaction elements that allow the user to define and visualize a plane, by establishing its normal vector, its center point, width, and depth.
Network Menu
Presents interaction elements that allow the user to join or create an on-line session (Section “Network Components”).
Network Components
The Network Camera, Network Manager, IP Manager, and Network Quadratic Configuration components are code objects designed to support local or cloud-based networking functionality.
• Local networking functionality. Hosted by the local network infrastructure.
• Cloud-based networking functionality. Hosted by Unity’s cloud-enabled runtime.
Whether it is local or cloud-based, the network functionality works under the lobby-room analogy, in which a lobby is a virtual waiting-room to assign participants into a virtual interaction room, where all participants share real-time updates that are triggered from the application’s functionality. Participant devices in the network session may be any of the ones defined in Section “Learning in Unified Mathematics Environments: Lumen Software.”
For Lumen, during a network session the instructor has the previously described menus and functionality unlocked to guide students, who may only see the interaction until the instructor decides to unlock it. This element was designed to favor the learning process by first allowing the instructor to remark important theoretical elements, before allowing the students to confirm them while exploring the experience of using the application.
Constructive Solid Geometry Operation Component
Once at least two closed shapes have been defined using the Equation menu, the coded CSG operation component provides algorithms that allow the user to perform union, intersection, and difference operations between them.
Configuration Components
Configuration components are coded objects that store information and actions that may be performed with the three kinds of mathematical elements supported by Lumen: quadratic shapes, CSG shapes, and planes.
Mesh Component
In Computer Graphics, as well as in Lumen, a mesh is a collection of connected triangles that form a surface. Whether the configuration comes from a quadratic shape, a CSG shape, or a plane, this information will be processed by the Mesh component algorithms to produce a triangular mesh that can be displayed in Lumen. The Mesh component code also stores the routines that compute the volume (when the mesh belongs to a closed shape) and area of the mesh. Finally, the Mesh component stores the routines required to export the triangular collection into a supported file format.
Mathematical Activities Using Lumen
In this section we will present the activities that have been used to measure the development of mathematical competencies using Lumen. The mathematical concepts have been worked on with the teacher in previous sessions. The activity has three moments, in the first, the students solve a pre-test without support of technological tools. The students work on an activity intended to help the development of the eight mathematical competences, the students are asked to use the software, which allows them to carry out the tests and modifications that lead to the solution of the problems and questions posed. Before the end of the class, the students individually solve the post-test.
Two activities were specially designed for this purpose. The first is in a context of surfaces in three-dimensional space, this activity works on rotations, translations, operations with surfaces, and problem solving. Teamwork is important, as it helps ideas to move from the mind to natural language and from natural language to mathematical language. The computational tool allows three-dimensional visualization, operations between surfaces and calculation of volume and areas. The software allows students to observe the relationship between the coefficients of the variables of a quadratic equation and the graphs. The questions they must solve require reasoning and mathematical thinking and the answer must be argued. Teamwork promotes the development of communication.
Figure 4 shows an example of a simple question, the answer to which requires reasoning, logical thinking, and problem solving.
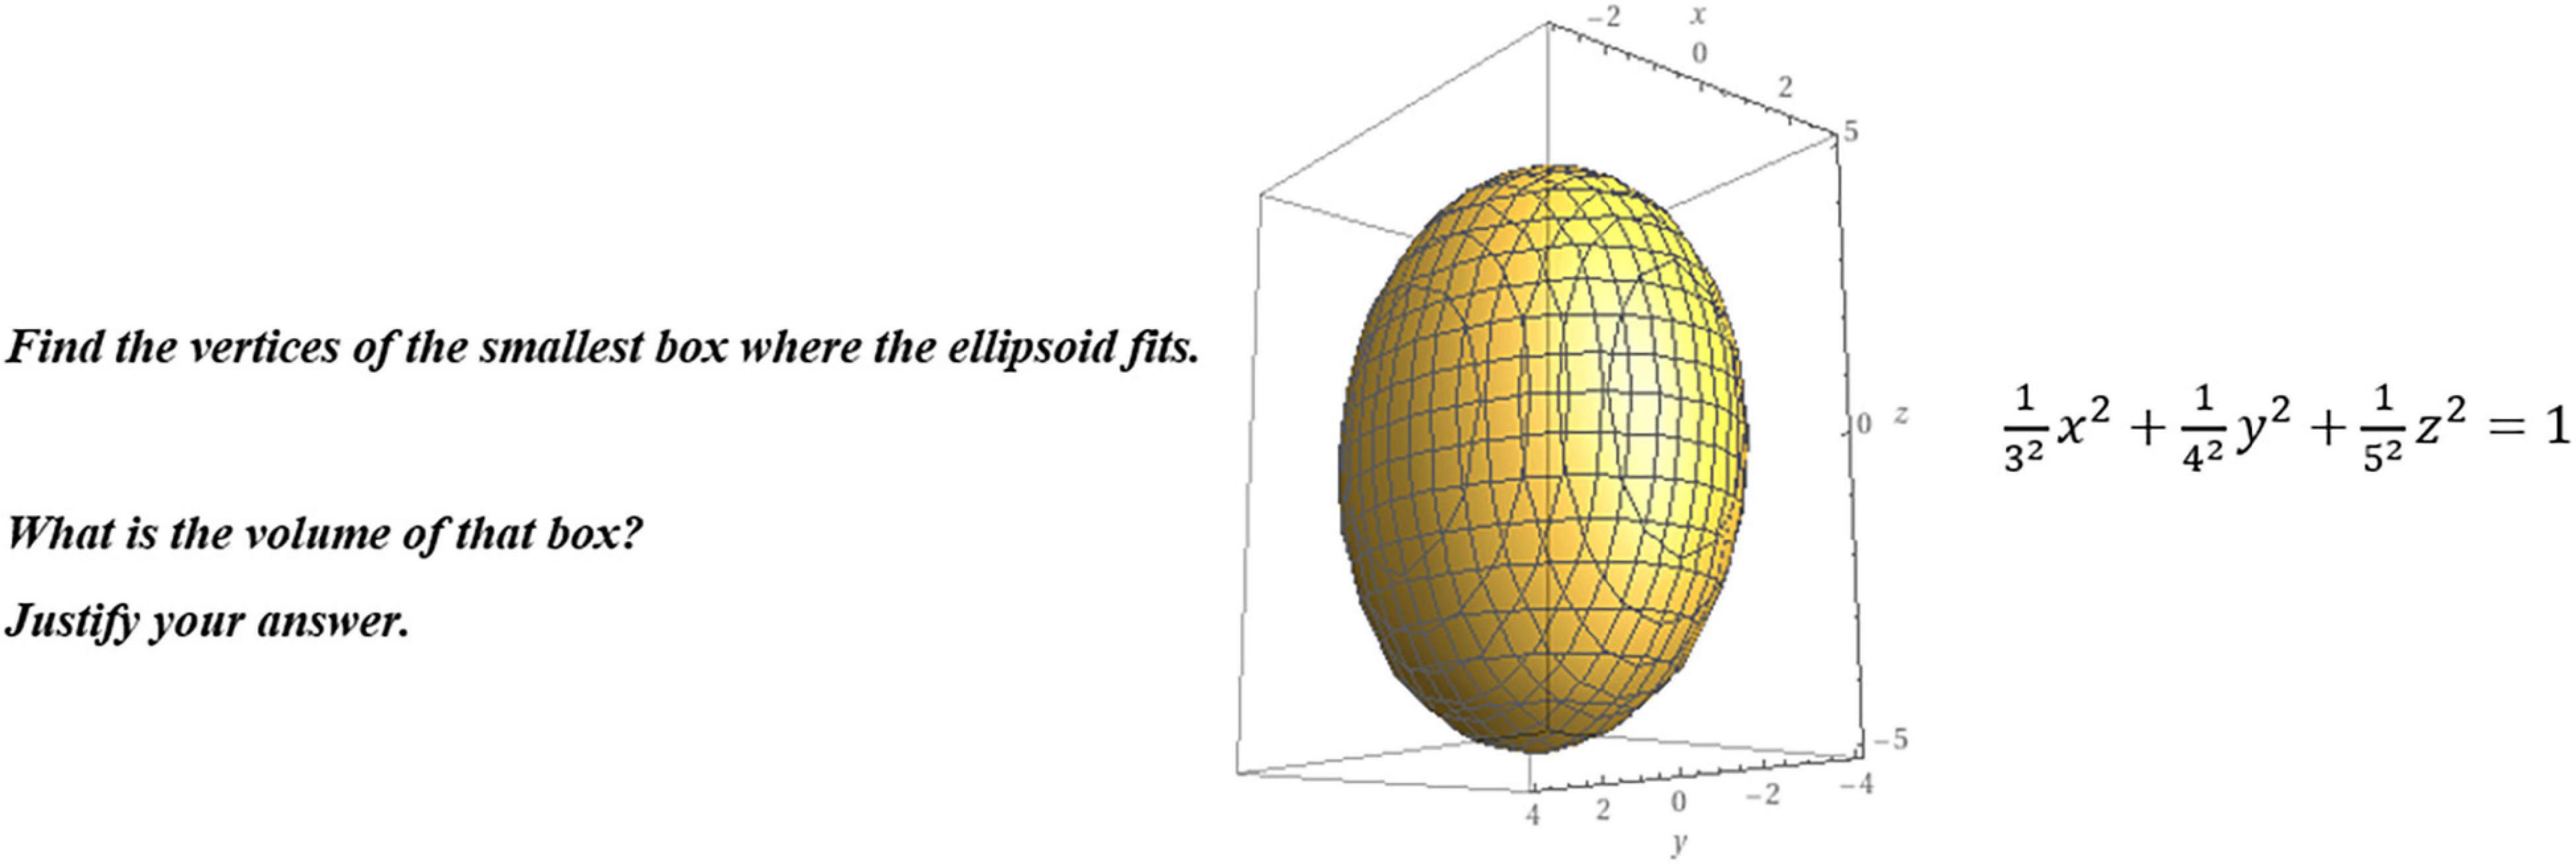
Figure 4. A question that implies reasoning, logical thinking, and problem-solving skills to be answered.
The second activity is in the framework of double and triple integrals to find the volume of pieces formed with various surfaces. In this activity, the use of mathematical competencies for its resolution is also evident. Students continue to work hard with argumentation and using language and symbolic operations. Using technological tools, students observe and perform Boolean operations between surfaces and perform area and volume calculations. Students work with simple mathematical models to find intersections, maximum and minimum curves, and solve optimization problems related to volume, area, and manufacturing costs.
Figure 5 shows an example of a question that allows the use of argumentation for its solution. Several figures are presented with the same base, it is requested to order them from smallest to largest volume, justifying the reason. Volume calculation is not required. Please note that the figures may not be on the same scale.
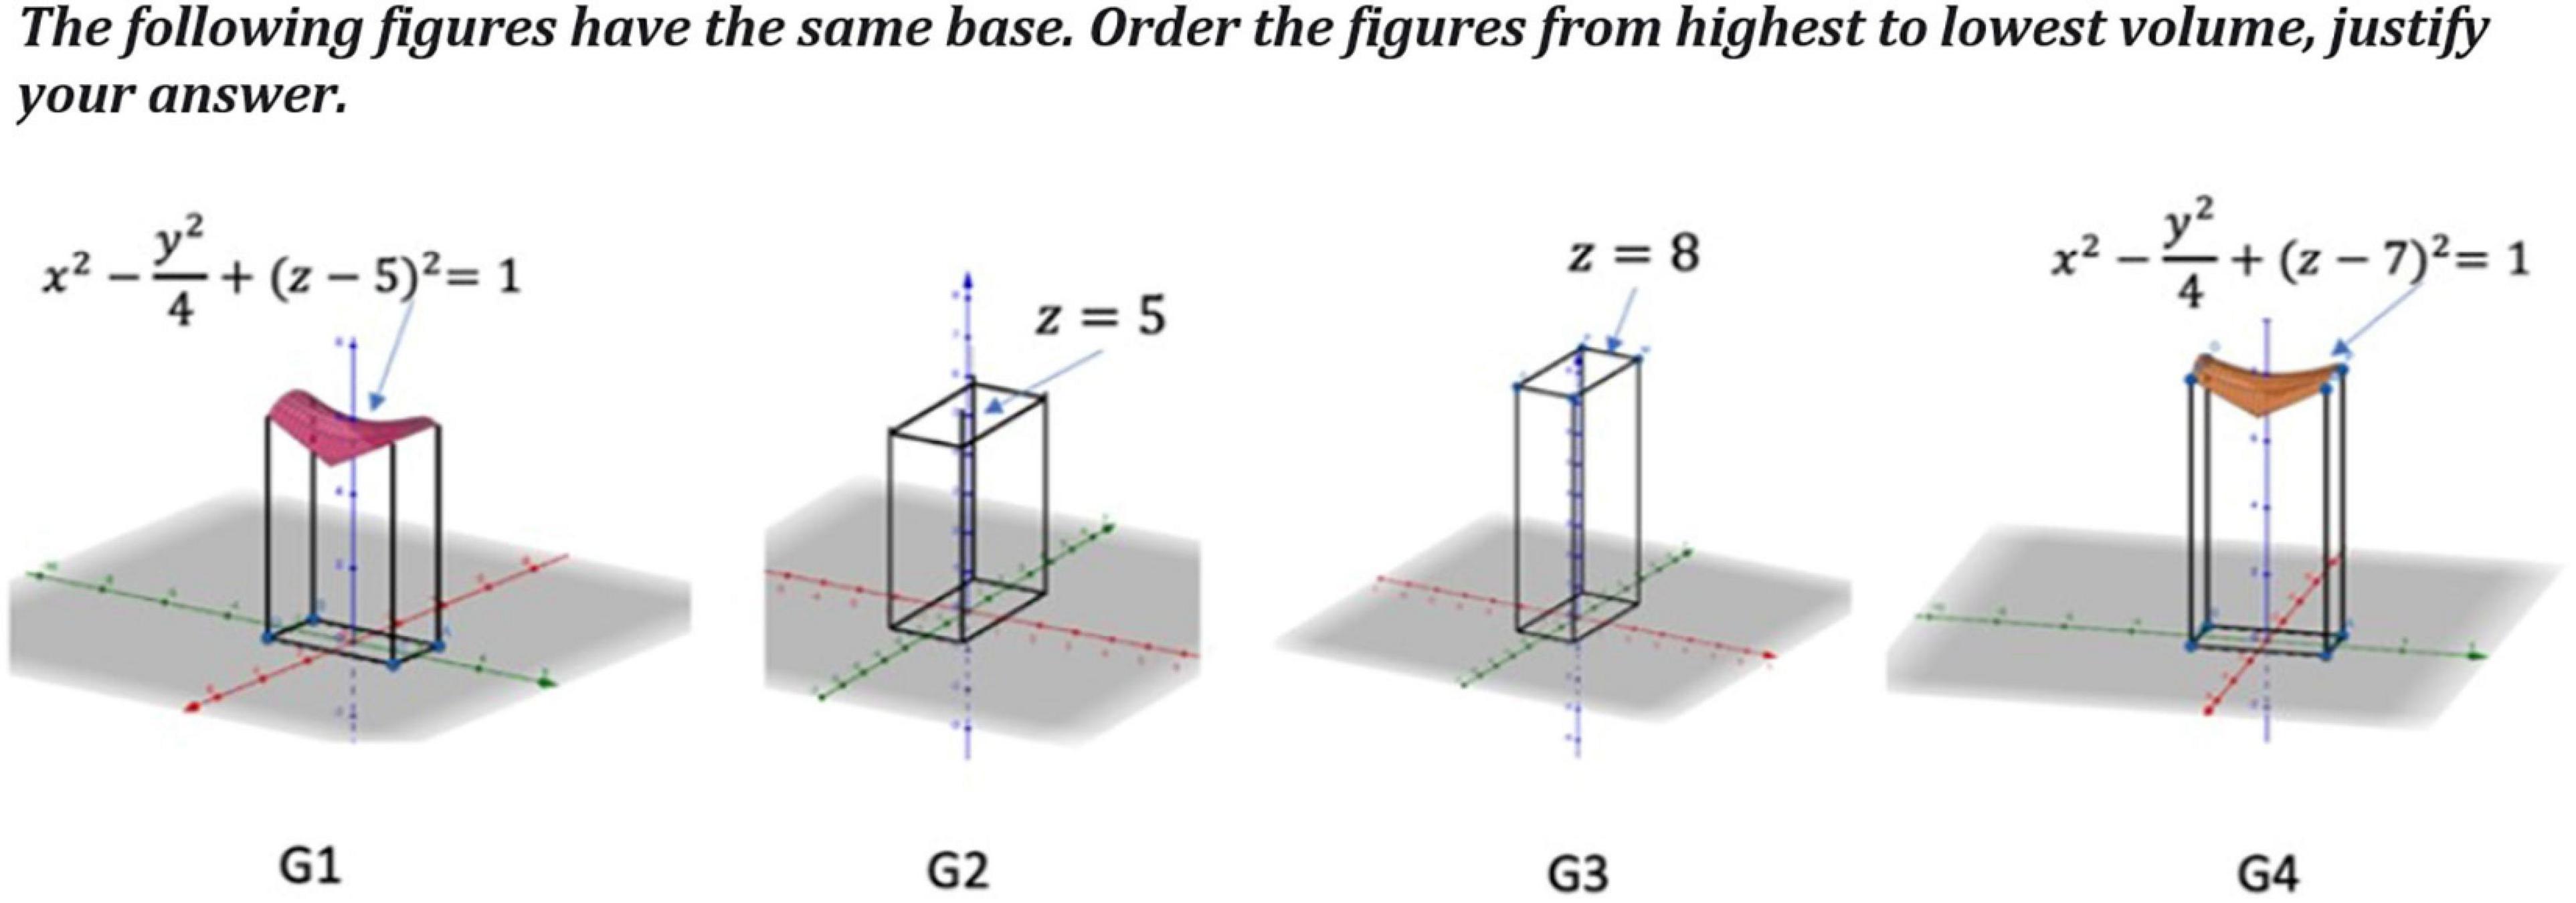
Figure 5. Example of an argumentative question: Order the figures from largest to smallest according to volume. Justify your answer.
Throughout the course, a virtual environment was used to explain calculation concepts in three-dimensional space. Computational tools are especially useful to help describe regions in space, first using natural language, which is then translated into descriptions with the use of inequalities and other types of symbolic language. Lumen is used by the teacher to work on concepts such as volume and area of surfaces, as well as to solve problems related to unions, intersections, and other Boolean operations. Throughout the course students are constantly exposed to the practice and development of spatial skills.
Implementation Methodology
Student Learning Gain
The study was conducted between February and May 2021. Due to pandemic conditions, the course was conducted entirely online. 226 students participated in 9 groups of 4 teachers. The students in the sample are enrolled in a multivariate calculus course in the second semester of engineering. They have taken subjects from the common core: mathematics, physics, chemistry, and computing.
This section presents the variables that will be used to measure and compare the pre-test and post-test results of each of the activities. The first activity that was measured was applied in the first third of the course and the second in the second third.
The pre-test and post-test were graded using a well-defined rubric for questions on a 0–100 scale, and students were given approximately 15 min to answer each test in the classroom. The post-test was applied after using technological tools and teamwork for 40 min. in the classroom, without the teacher’s intervention. The two activities were carried out as a team, but the tests were individual.
To proceed with the data analysis, we used the following variables (see Hake, 1998).
Average pre-test grade:
where (Prei) is the pre-test grade of the student i; and the average post-test grade:
where (Posti) is the post-test grade of the student i.
Student learning gain:
Group learning gain:
Student relative learning gain:
The relative learning gain for a given student is a measure of the actual gain that the students achieved Posti−Prei with respect to the maximum gain that they could have obtained 100−Prei. The group relative learning gain has a similar meaning but refers to the whole group:
In the next section, we present an analysis of the different gains of the students and group.
Results
Learning Gain
The results of the first activity show that there is a group relative learning gain (total sample) of 50%. Hake (1998) defined the following ranges: low normalized learning gain for courses with a value below 0.3; medium normalized learning gain for courses with a value between 0.3 and 0.7; and high normalized learning gain for courses with a value above 0.7.
Also Coletta et al. (2007) say that interactive engagement courses (that use methods for hands-on activities with immediate feedback) have a normalized learning gain in the range of 0.3 and 0.6. Table 1 shows the results of the 4 different teachers, all of them show positive group relative learning gain: 55, 65, 53, and 27%. Only 11% of the students did not obtain an increase in learning gain, most of them are concentrated in the group that had the lowest average gain.
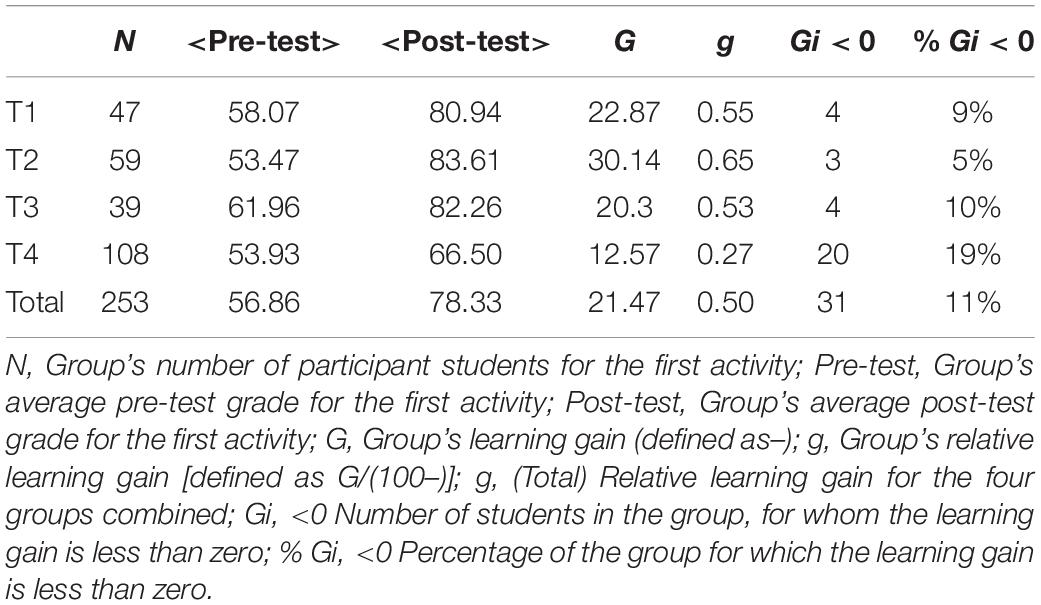
Table 1. Learning gain in the first activity.
The pre-test mean grade is 56.8 and the post-test is 77.6, an average increase of almost 20 points (19.77). With a significance level of 95%, a mean difference t test shows that the post-test grade is significantly higher than the pre-test. Table 2 shows the results of the paired samples for the t-test.
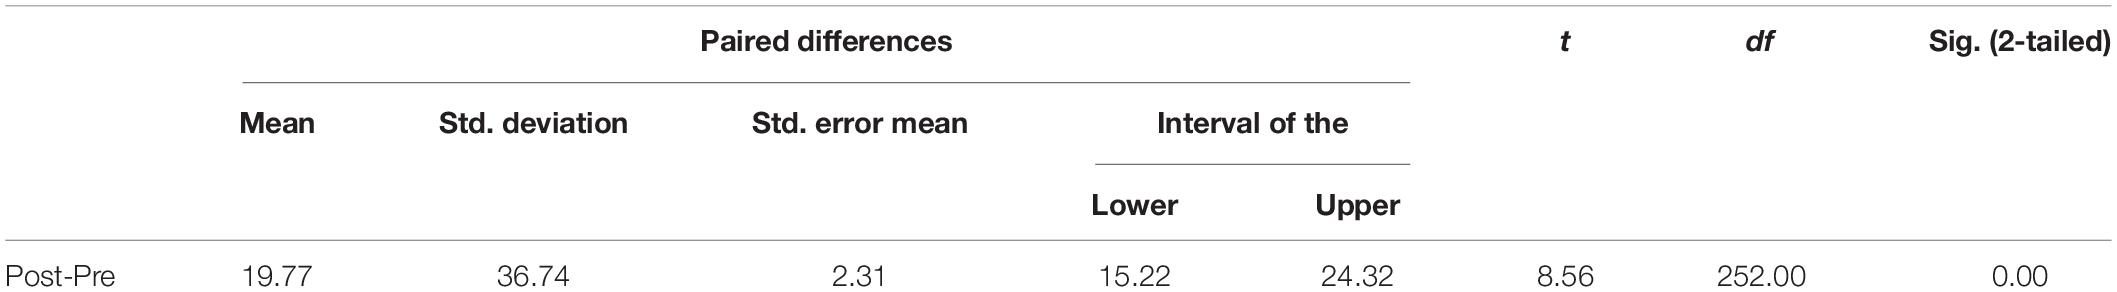
Table 2. Paired mean differences sample test between pre- and post-tests in the first activity.
Figure 6, on the left, shows the confidence intervals of the mean grade for the pre-test and post-test. The intervals do not overlap, showing a significant difference of the means, at 95% confidence. On the right, the confidence intervals of the mean grade of pre- and post-tests per teacher are shown. There is no significant difference in the pre-test mean grade of the different groups. In all cases, the post-test mean grade is higher than the pre-test, the difference being statistically significant in 3 of the 4 teachers, with 95% confidence. In the case of the teacher, where the difference was not significant (T4), a greater dispersion of the pre-test results is observed than in the other groups.
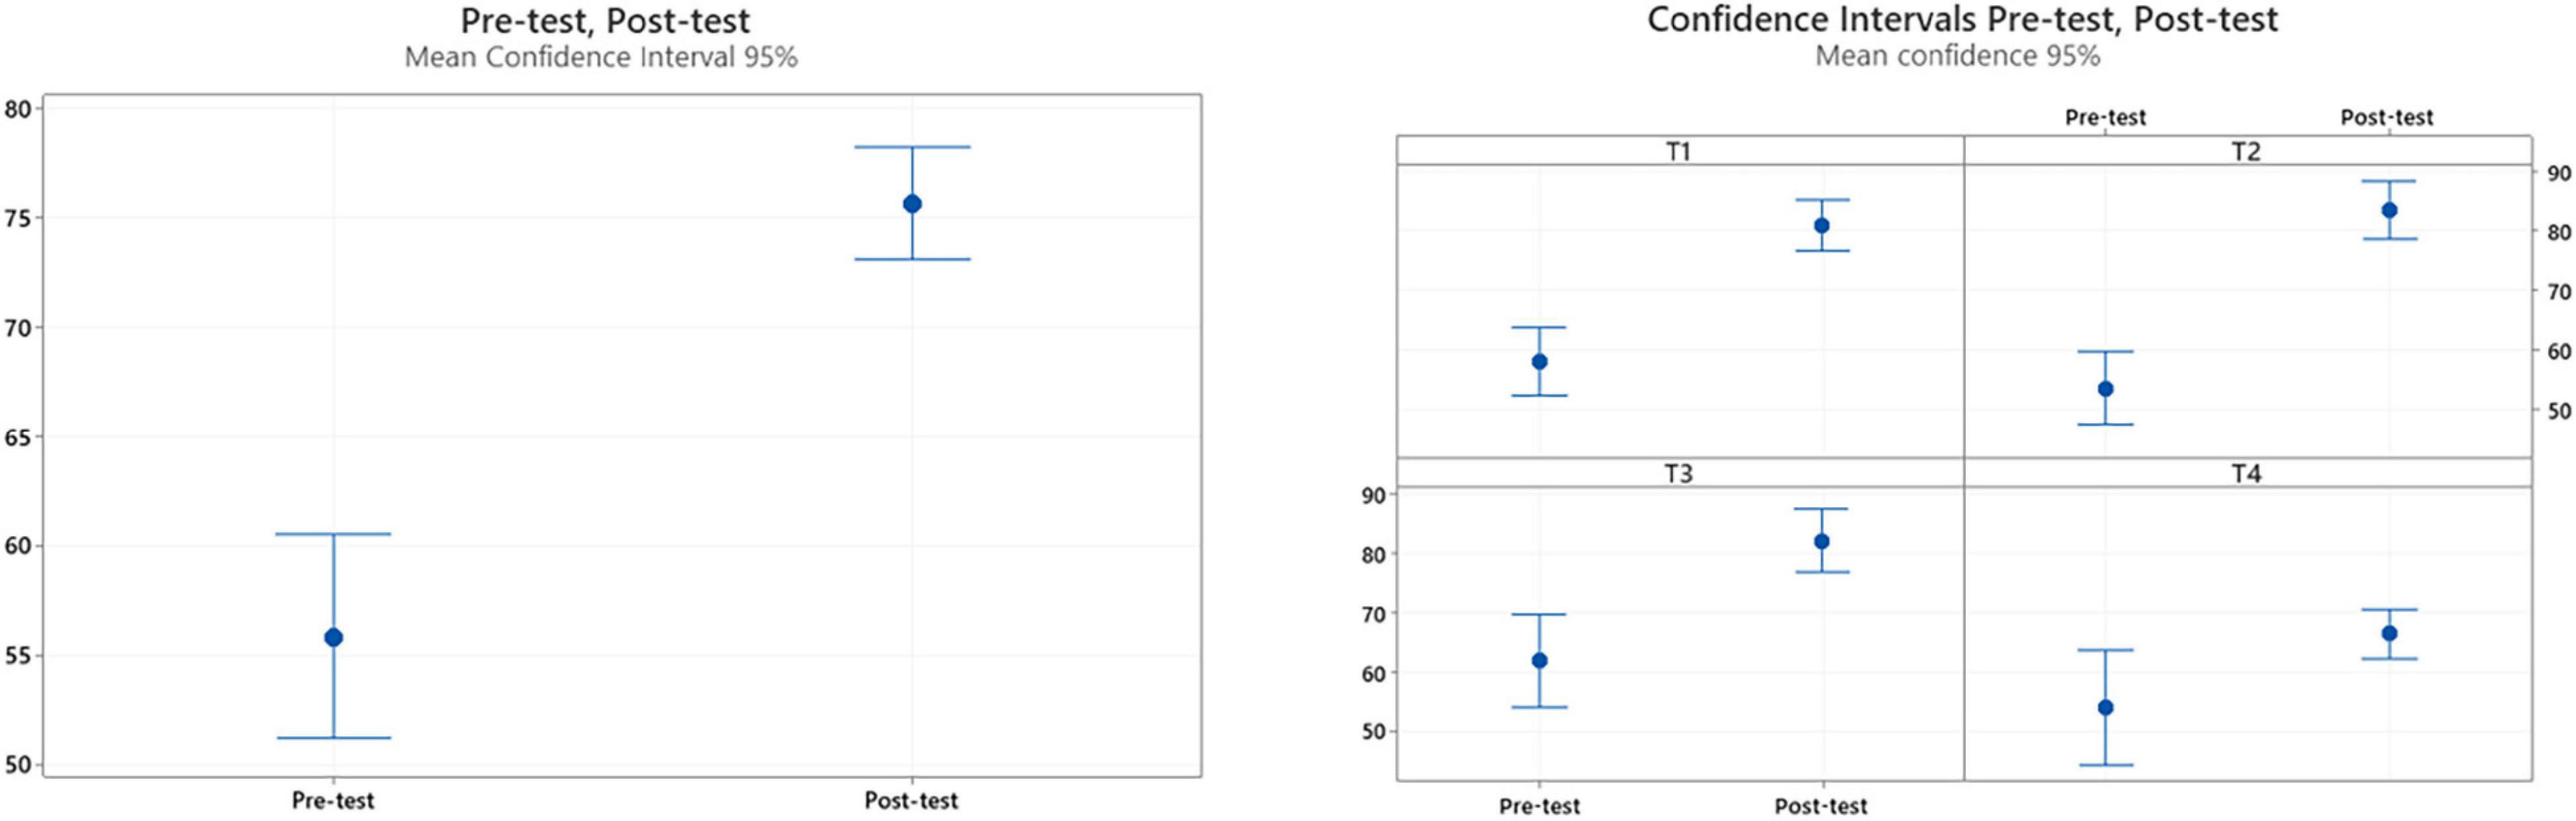
Figure 6. Mean confidence intervals for the pre- and post-test. The entire sample and per teacher for the first activity.
Student relative learning gain (gi) statistics are shown in Table 3. This variable is calculated for the 242 students who had a pre-test different from 100. On average the students had a relative learning gain of 45.5%.
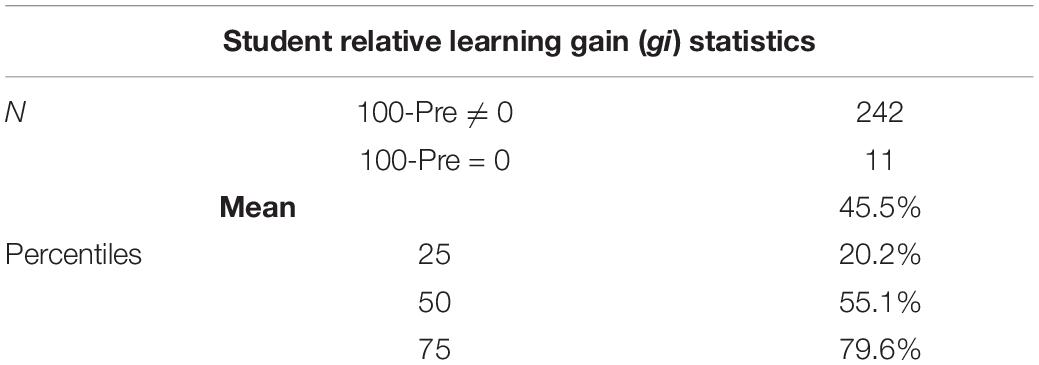
Table 3. Students relative learning gain (gi) statistics for the first activity.
In total, 50% of the students had a relative learning gain greater than 55%, 25% of the students had a relative learning gain greater than 79.6 and 25% of the students had a relative learning gain less than 20%.
An analysis of variance for relative learning gain (gi) shows that there is no significant difference between the means between teachers, with 95% confidence, using the De Wilks and Lawley-Hotelling criteria. An analysis by pairs shows that the students of teacher T4 (gi = 0.31) obtained a significantly lower relative learning gain than T2 (gi = 0.67) and T3 (gi = 0.58). Figure 7 shows 95% confidence intervals for relative learning gain of the different groups.
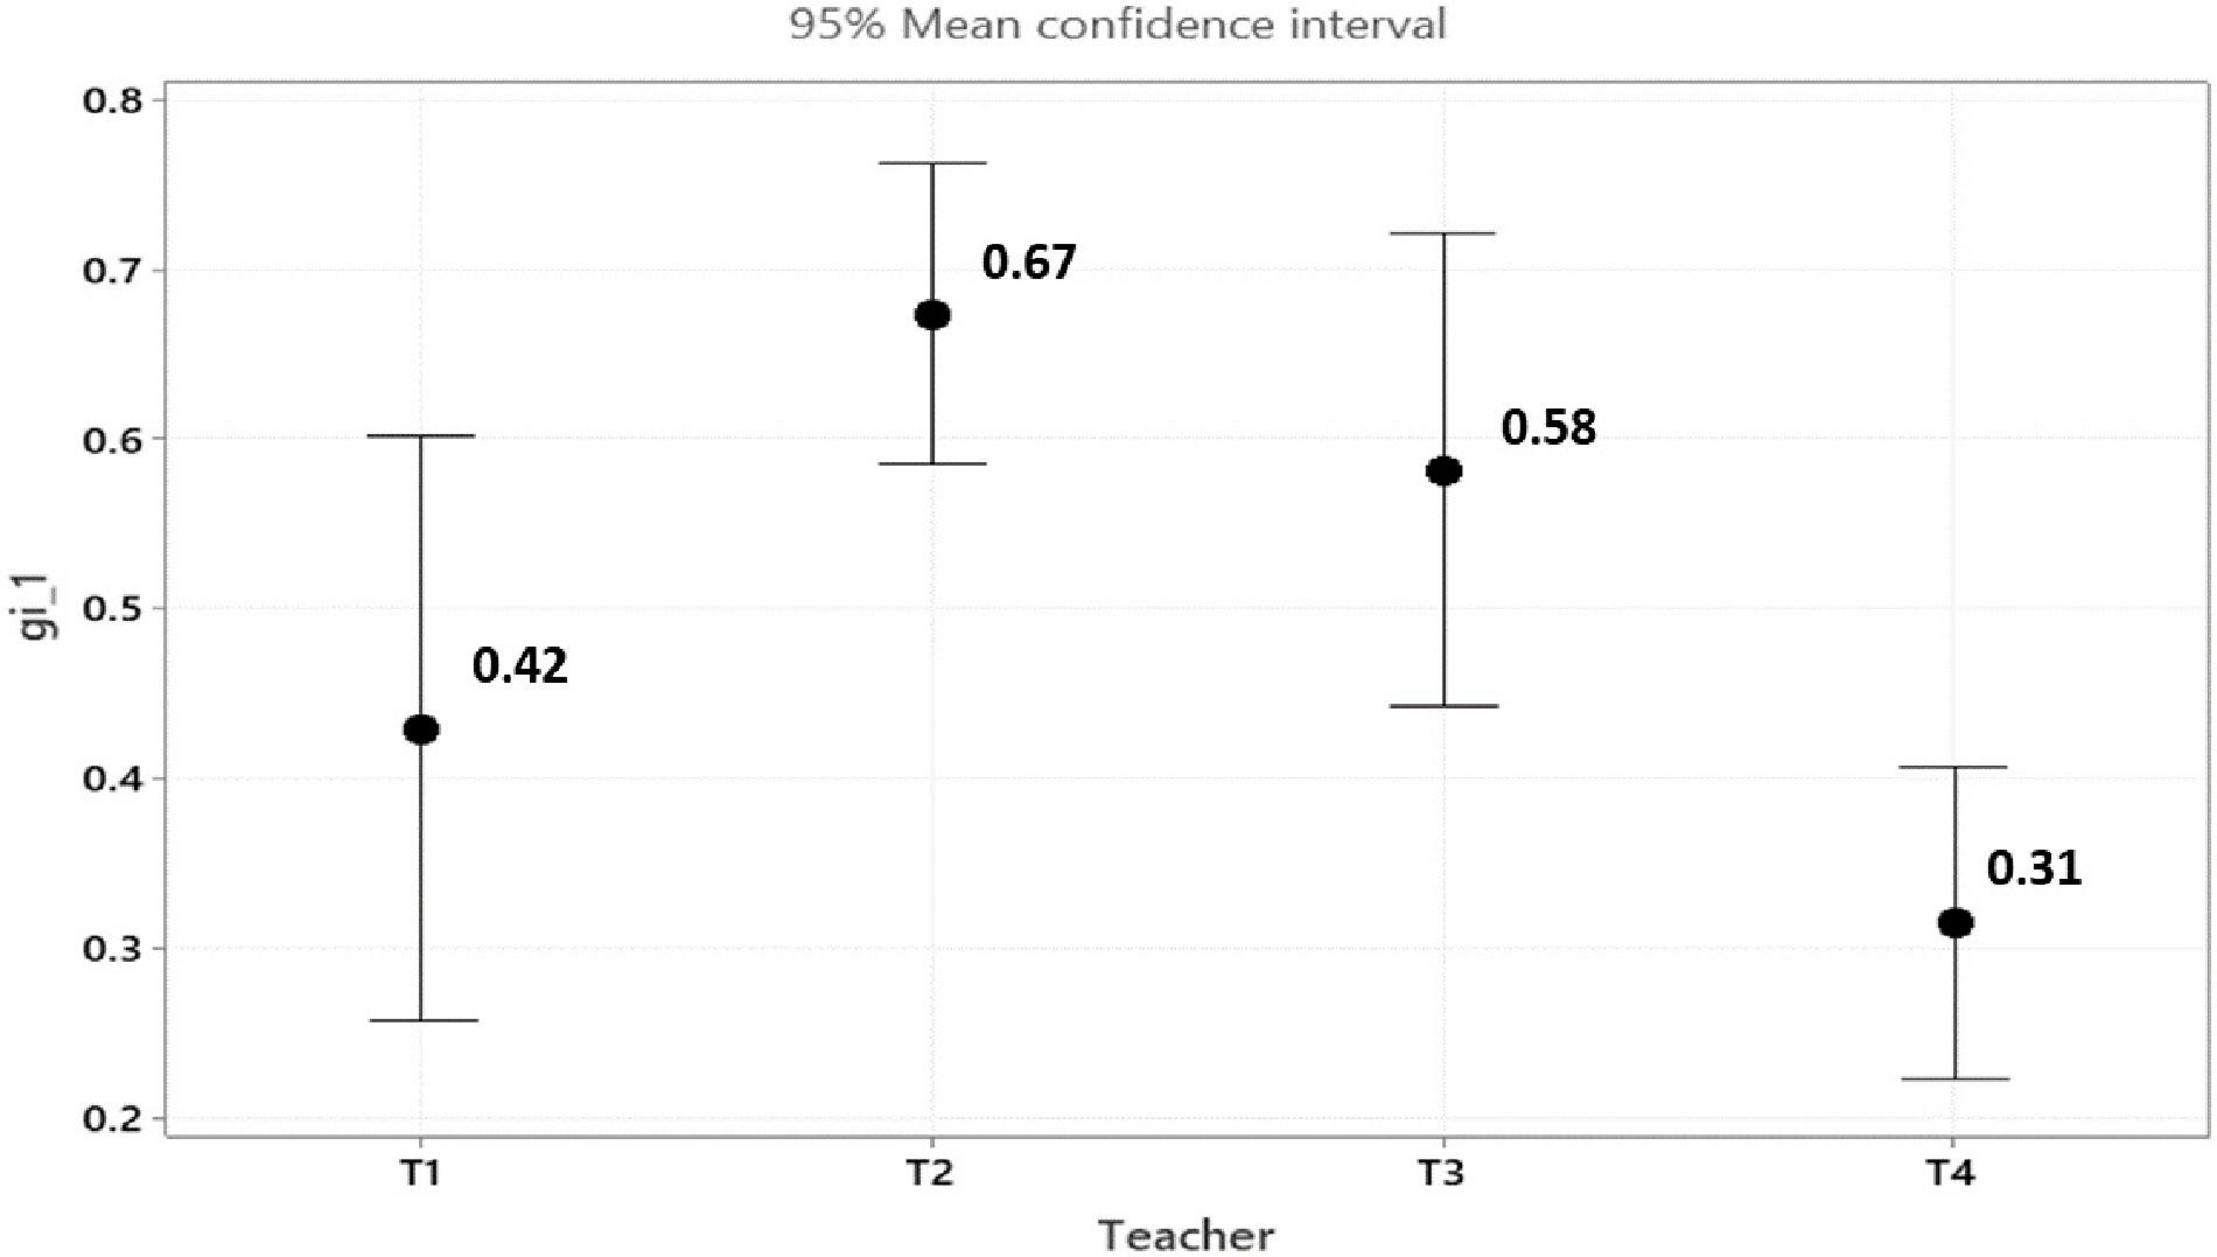
Figure 7. 95% Mean confidence intervals for students relative learning gain (gi) first activity.
The differences between the teachers could be explained by their skills in the use of technology and group management. The 4 teachers have similar years of teaching experience, they are of the same gender and have approximate ages. They also have similar studies. Teachers T1 and T2 have a high domain of technology, the domain of T3 is regular and T4 low. Teacher T2, on average, obtains the best student evaluations (95/100) (institutional survey applied to students) followed by T1 (92/100) and T3 (90/100). Professor T4 has the lowest evaluations (80/100).
The second activity was applied by teachers T1, T2, and T4 to N = 210 students. The results of the second activity show that there is a group relative learning gain (all the sample) of 46%. Table 4 shows the results of the 3 different teachers, all of them show positive group relative learning gain: 82, 32, and 25%. 17% of the students did not obtain an increase in learning gain.
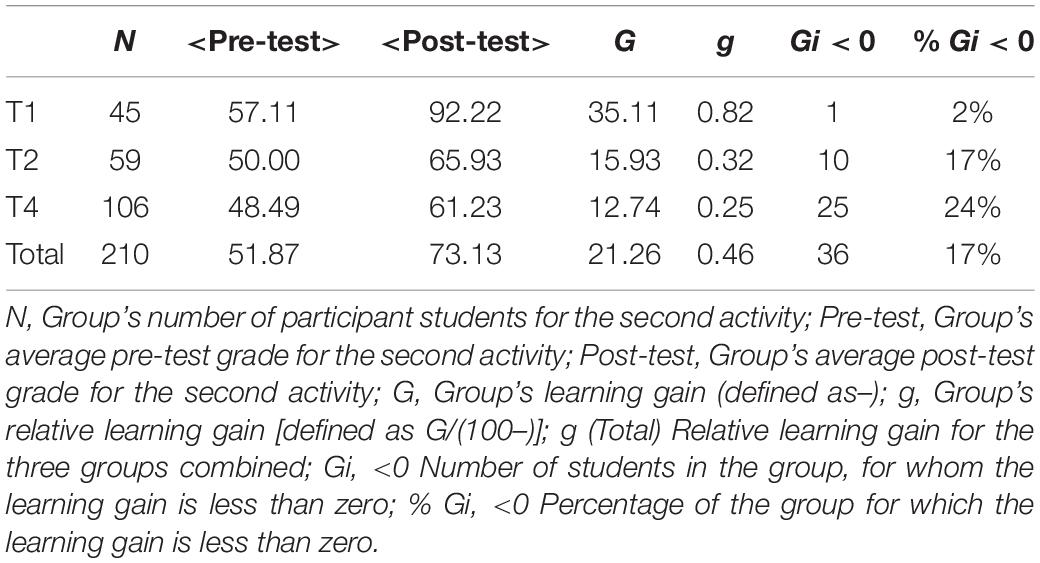
Table 4. Learning gain in the second activity.
The pre-test mean is 50.76 and the post-test mean is 69.16, an average increase of 18.42 points. With a significance level of 95%, a mean difference paired sample t test shows that the post-test is significantly higher than the pre-test. Table 5 shows the results of the t-test.
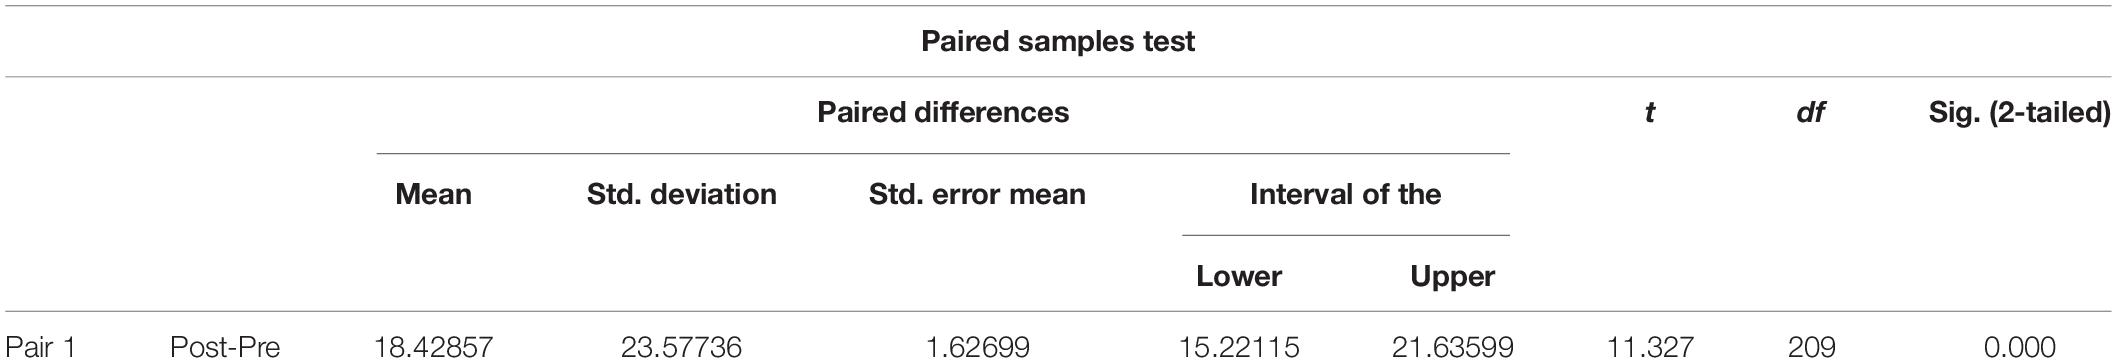
Table 5. Paired mean differences sample test between pre and post-tests in the second activity.
Figure 8, on the left, shows the confidence intervals of the mean for the pre-test and post-test grade to the second activity. The intervals do not overlap, showing a significant difference of the means, at 95% confidence. On the right, the confidence intervals of the mean pre- and post-tests grades per teacher are shown. There is no significant difference in the pre-test mean grade of the different groups. In all cases, the post-test mean grade is higher than in the pre-test, with 95% confidence. T1 post-test mean grade is significantly higher than T2 and T4.
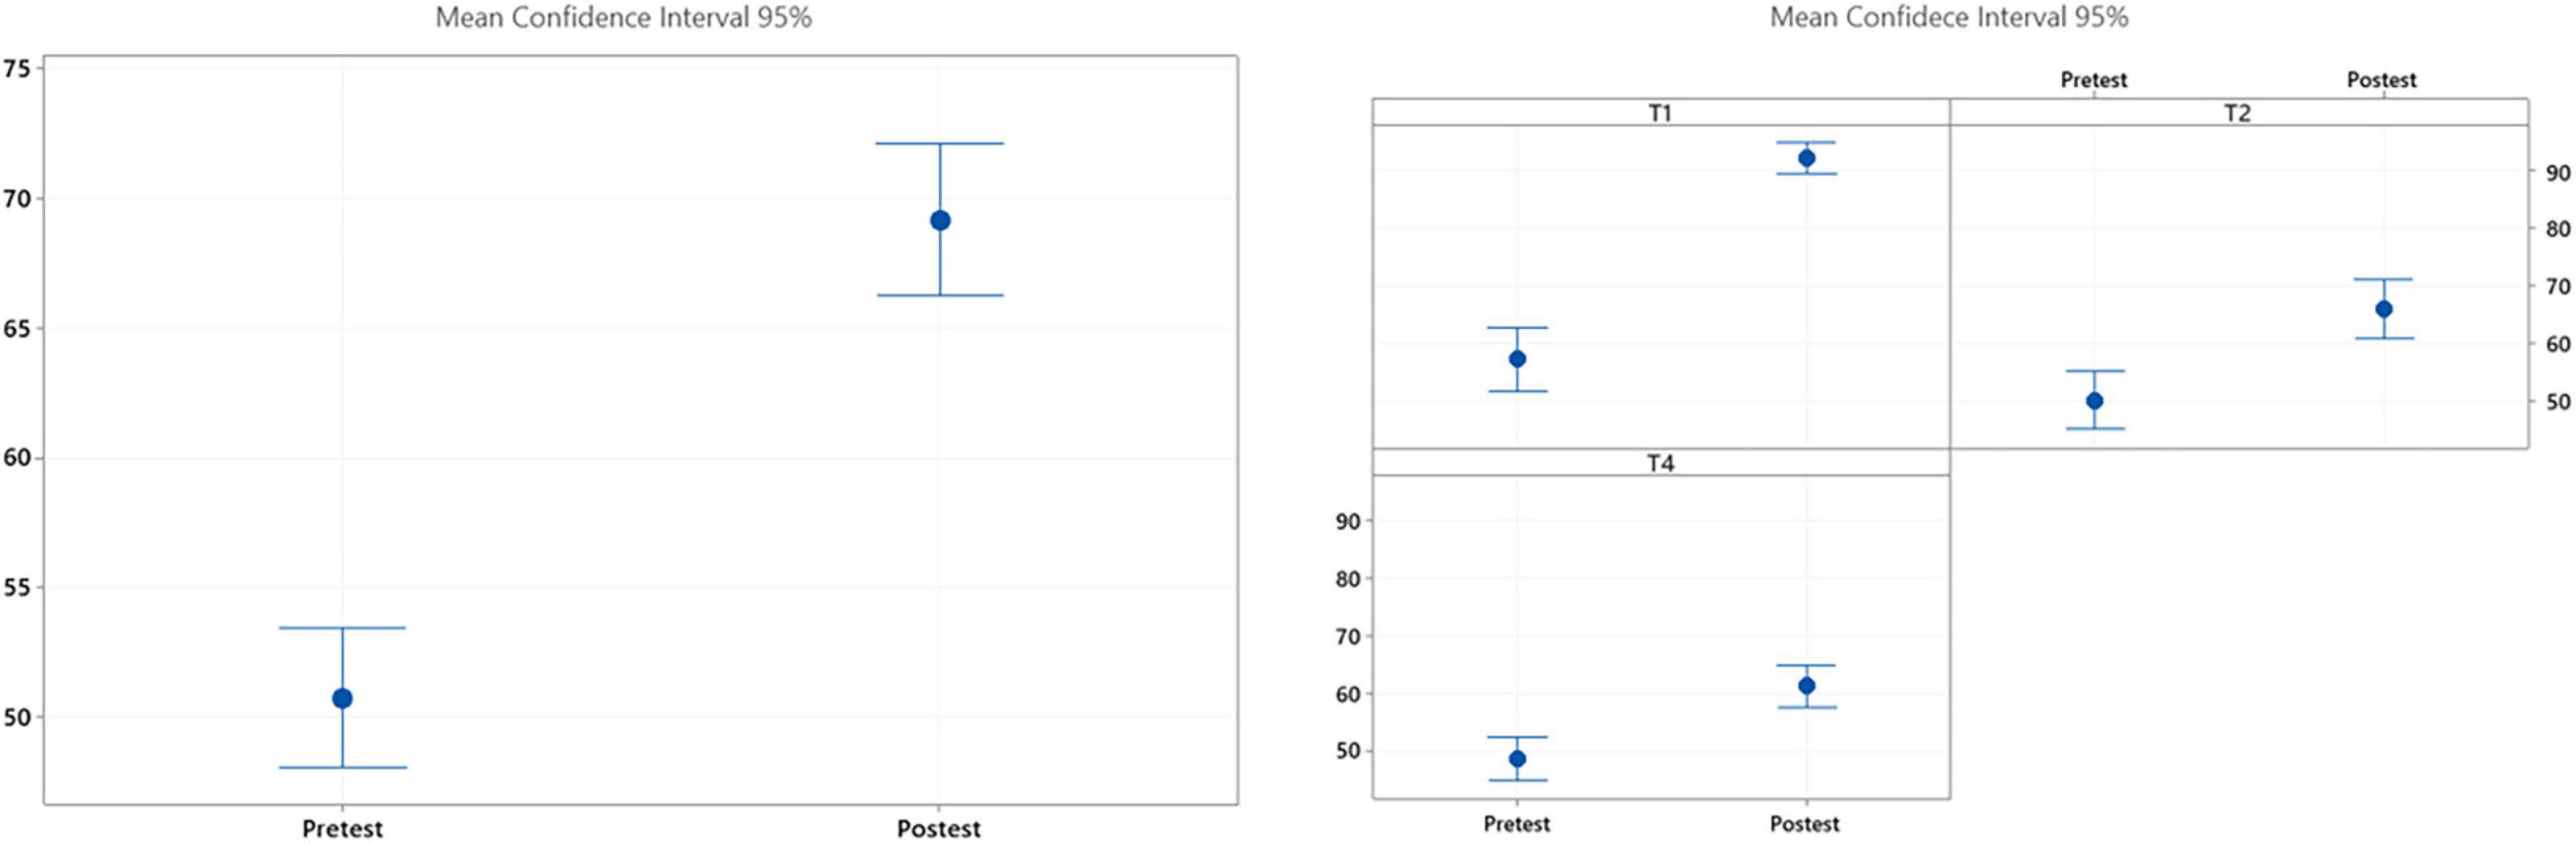
Figure 8. Mean confidence intervals for the pre- and post-tests. The entire sample and per teacher for the second activity.
Student relative learning gain (gi) statistics are shown in Table 6. This variable is calculated for the 208 students who had a pre-test different from 100. On average the students had a relative learning gain of 32%.
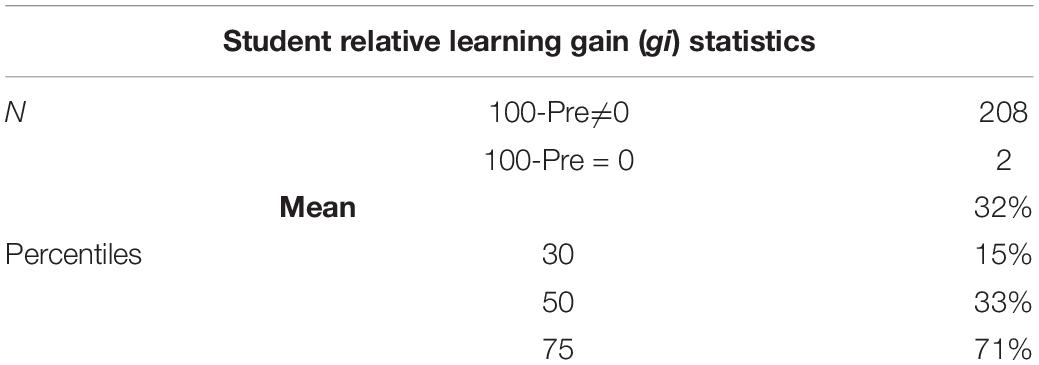
Table 6. Students relative learning gain (gi) statistics for the second activity.
In total, 50% of the students had a relative learning gain greater than 33%, 25% of the students had a relative learning gain greater than 71 and 30% of the students had a relative learning gain less than 15%.
An analysis of variance for relative learning gain (gi) shows that there is no significant difference between the means between teacher groups, with 95% confidence, using the De Wilks and Lawley-Hotelling criteria. An analysis by pairs shows that the students of teacher T1 (gi = 0.75) obtained a significantly lower relative learning gain than T2 (gi = 0.25) and T4 (gi = 0.16). Figure 9 shows 95% confidence intervals for relative learning gain of the different groups.
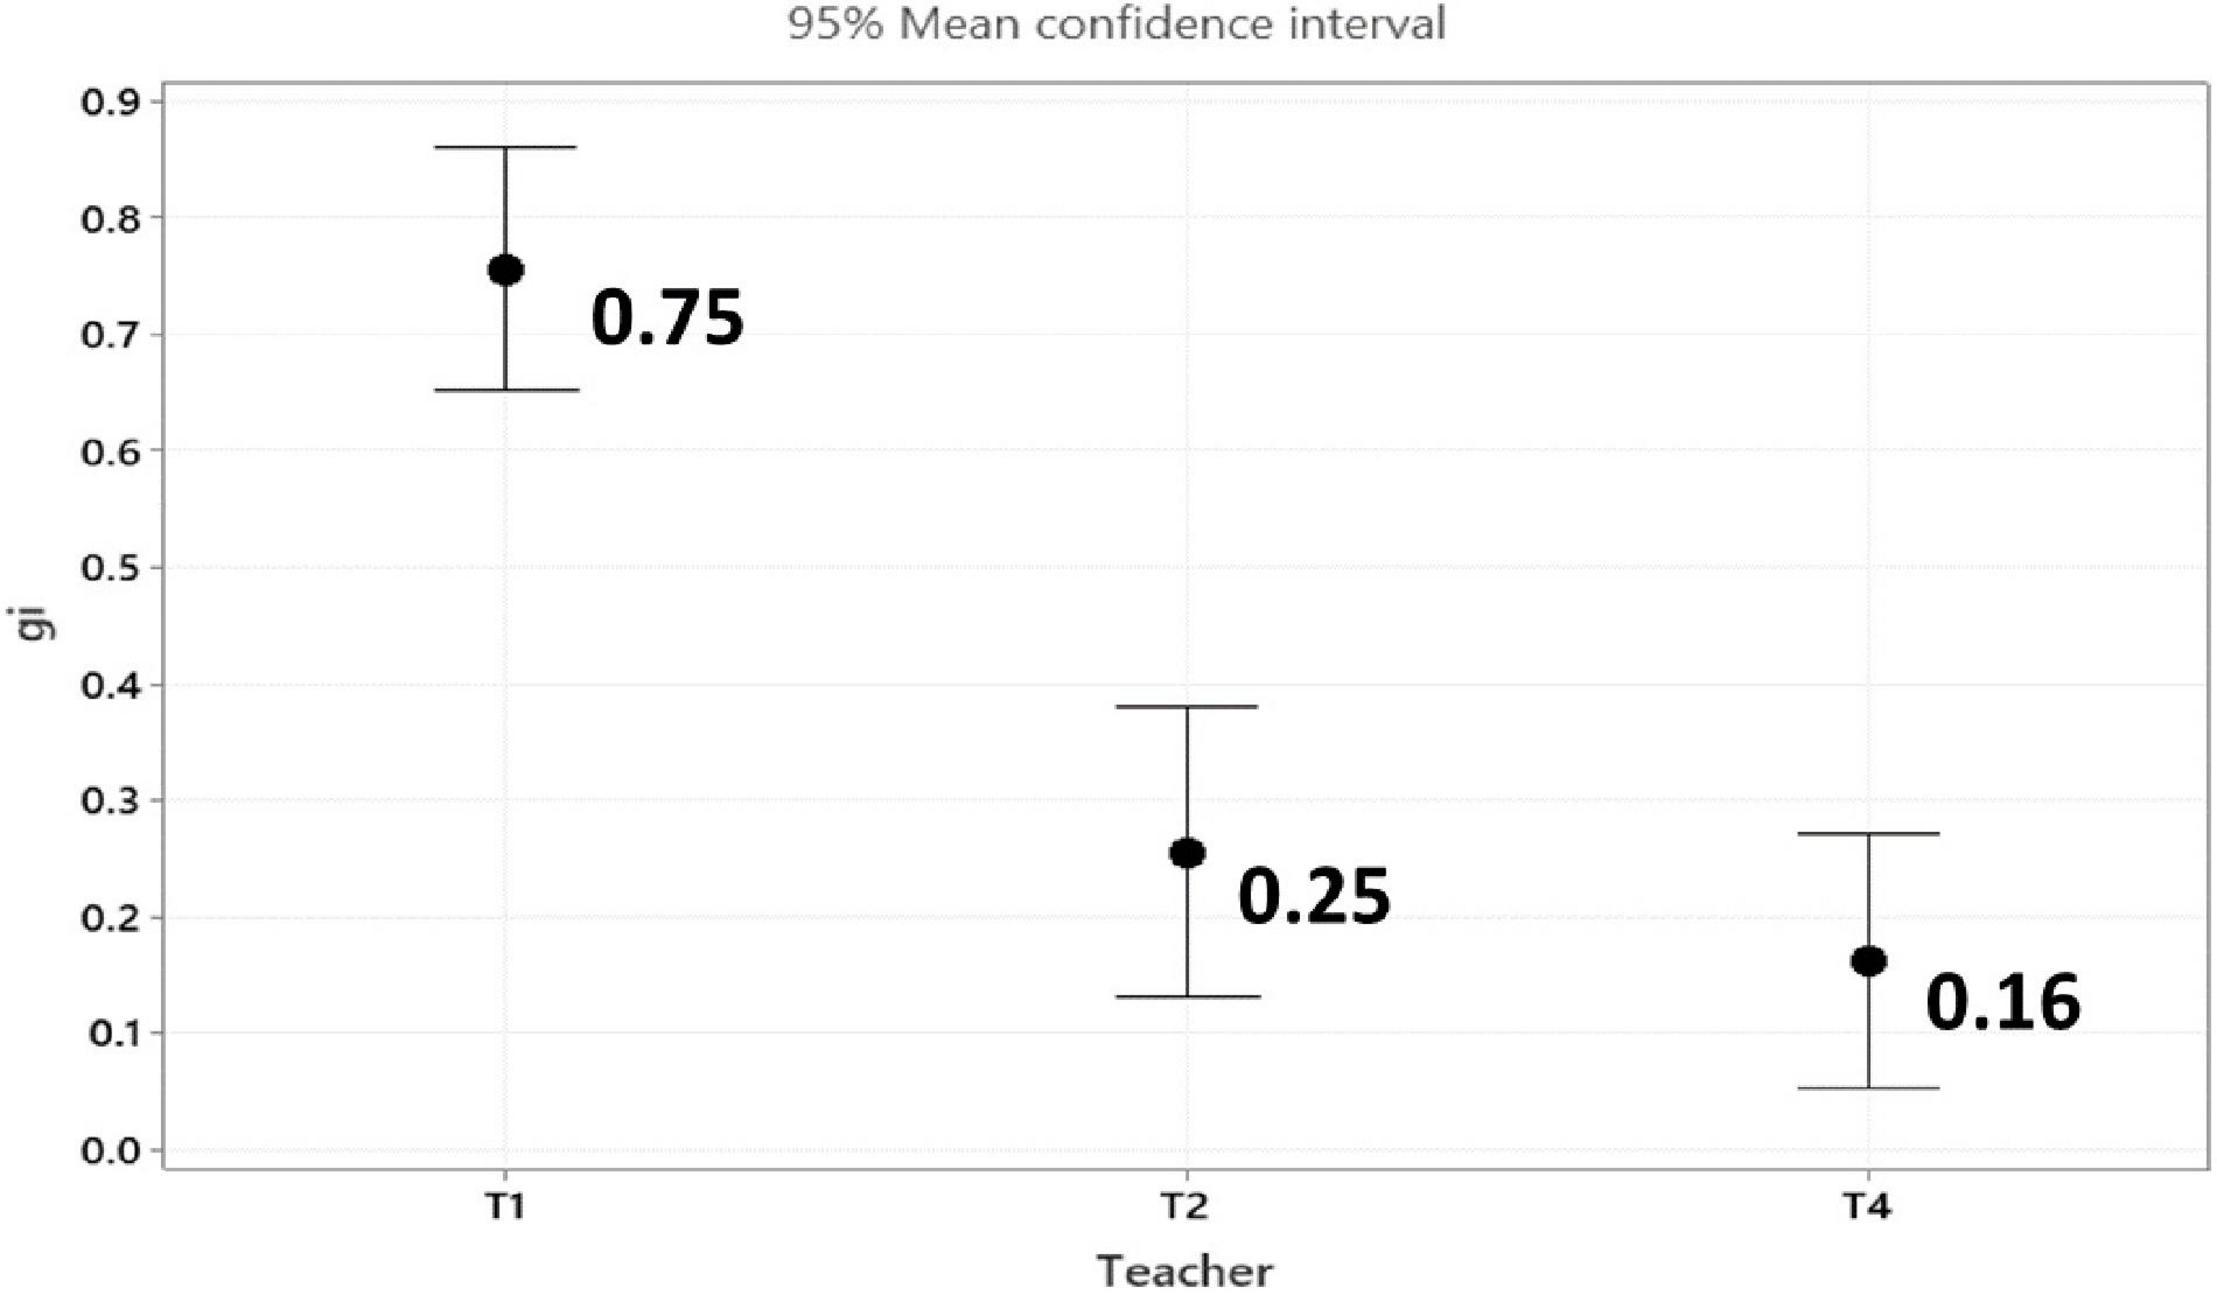
Figure 9. 95% Mean confidence intervals for students relative learning gain (gi) second activity.
Figure 10 shows a graphical summary of the results in both experiences.
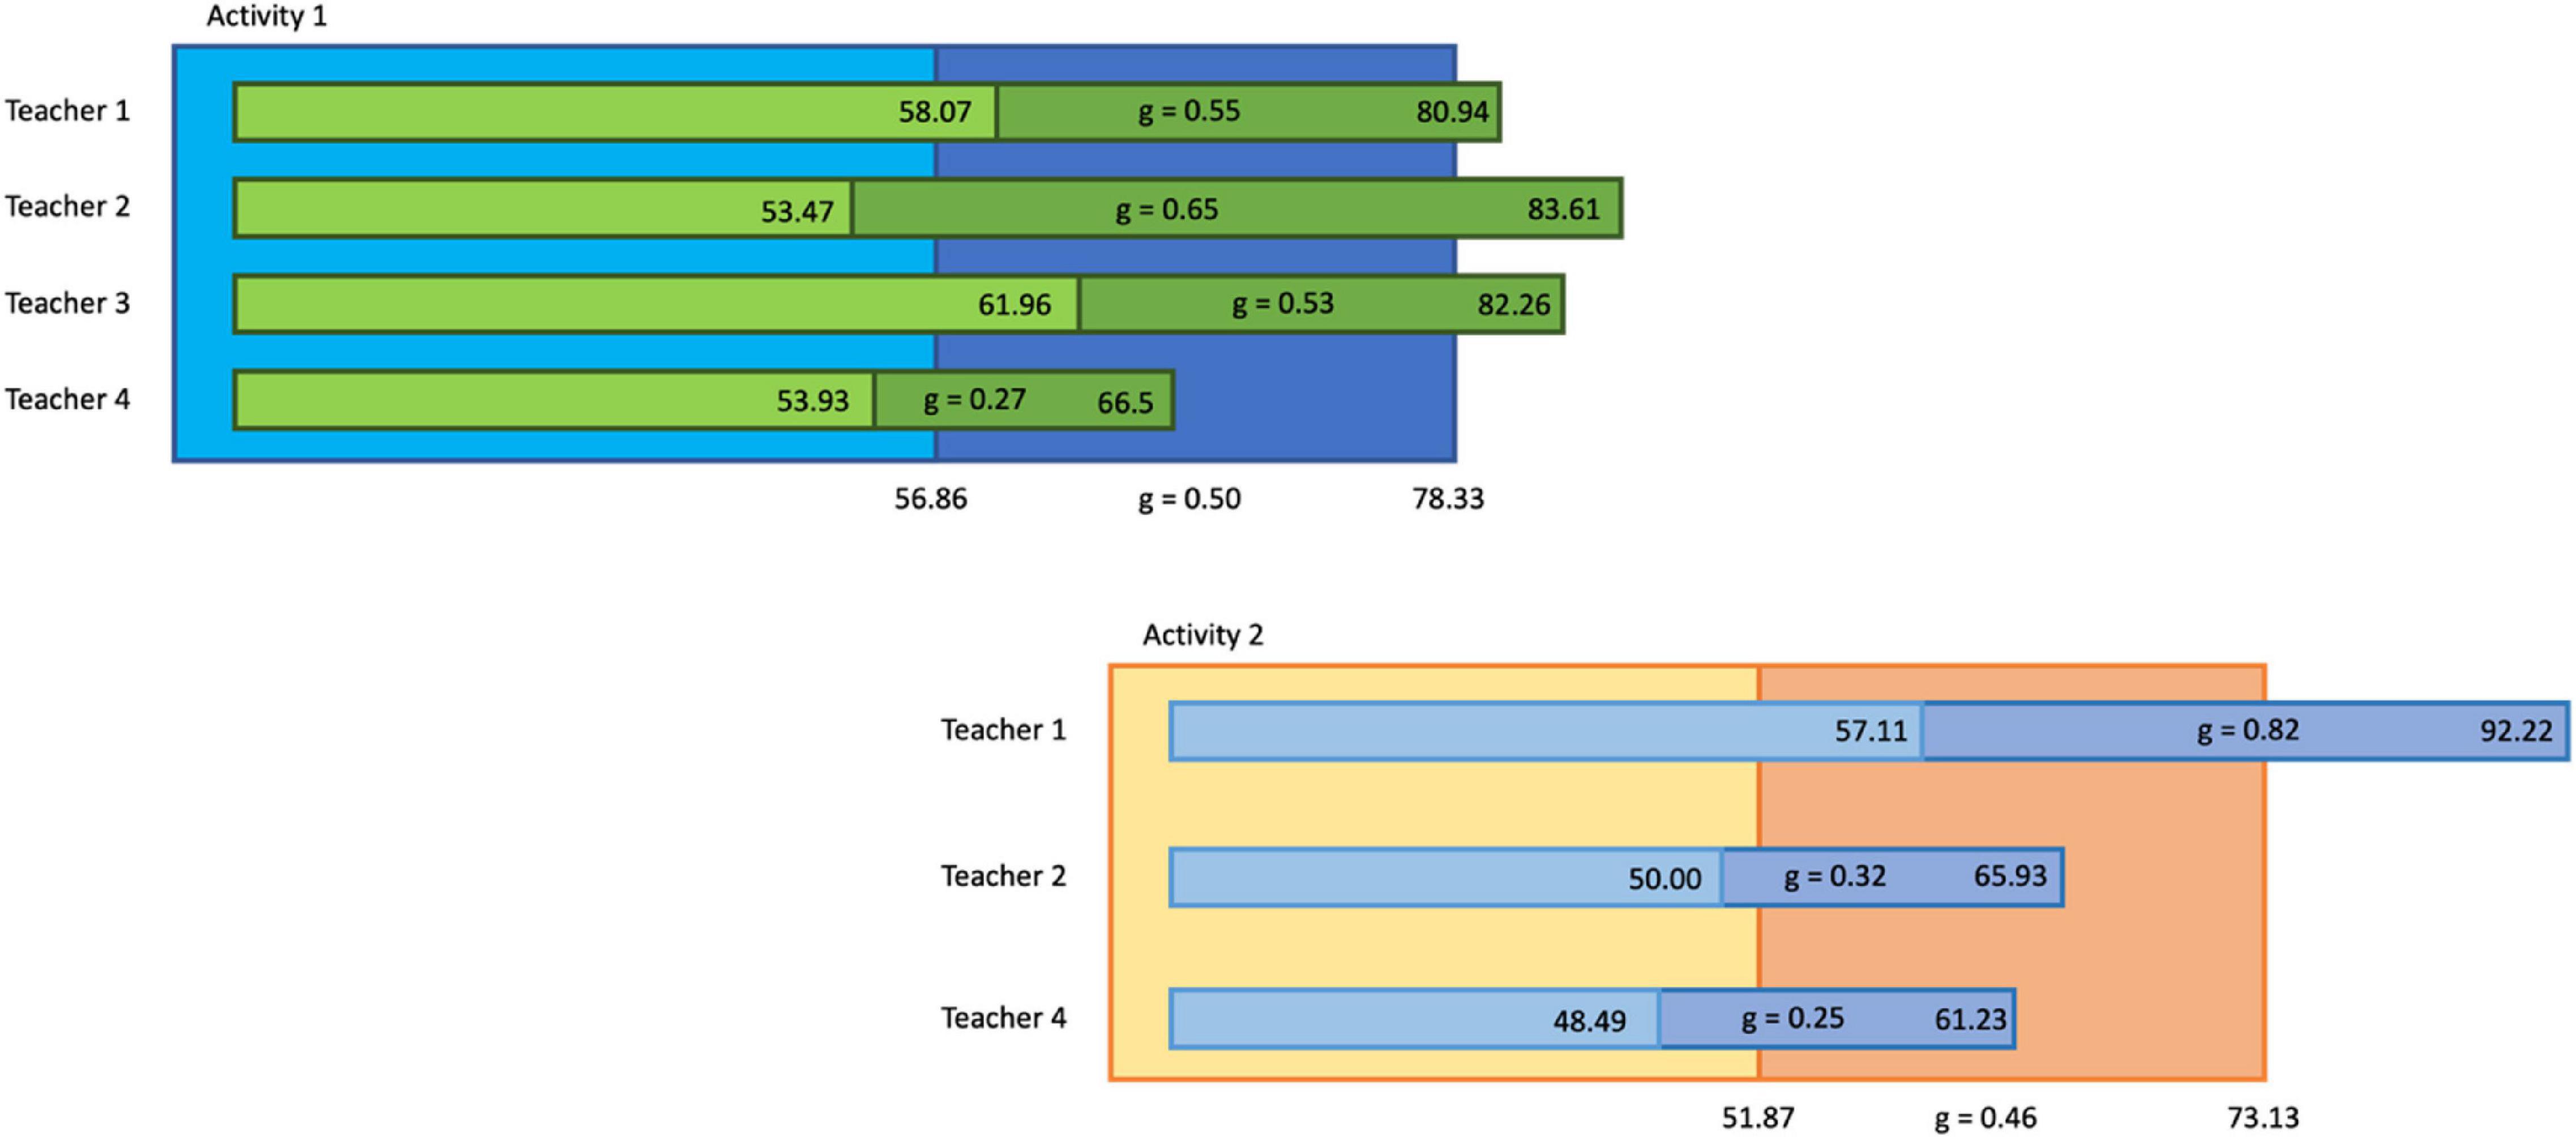
Figure 10. Summary of results showing pre-test, post-test, and normalized learning gains (g) values for each group/teacher and in average, by activity.
Perception Questionnaire
Students were asked to answer a perception survey about the software Lumen. Only 35 responses were obtained, but we believe the results are valuable. We believe that the low participation of students in this survey was due to the fact that it was applied in an exam week and did not give extra points, contrary to activities 1 and 2, which did have value in the final grade.
In total, 74% of students would recommend Lumen. The most frequent words they used to describe it are: Useful, didactic, and fun. Some of them found it complicated. See Figure 11.
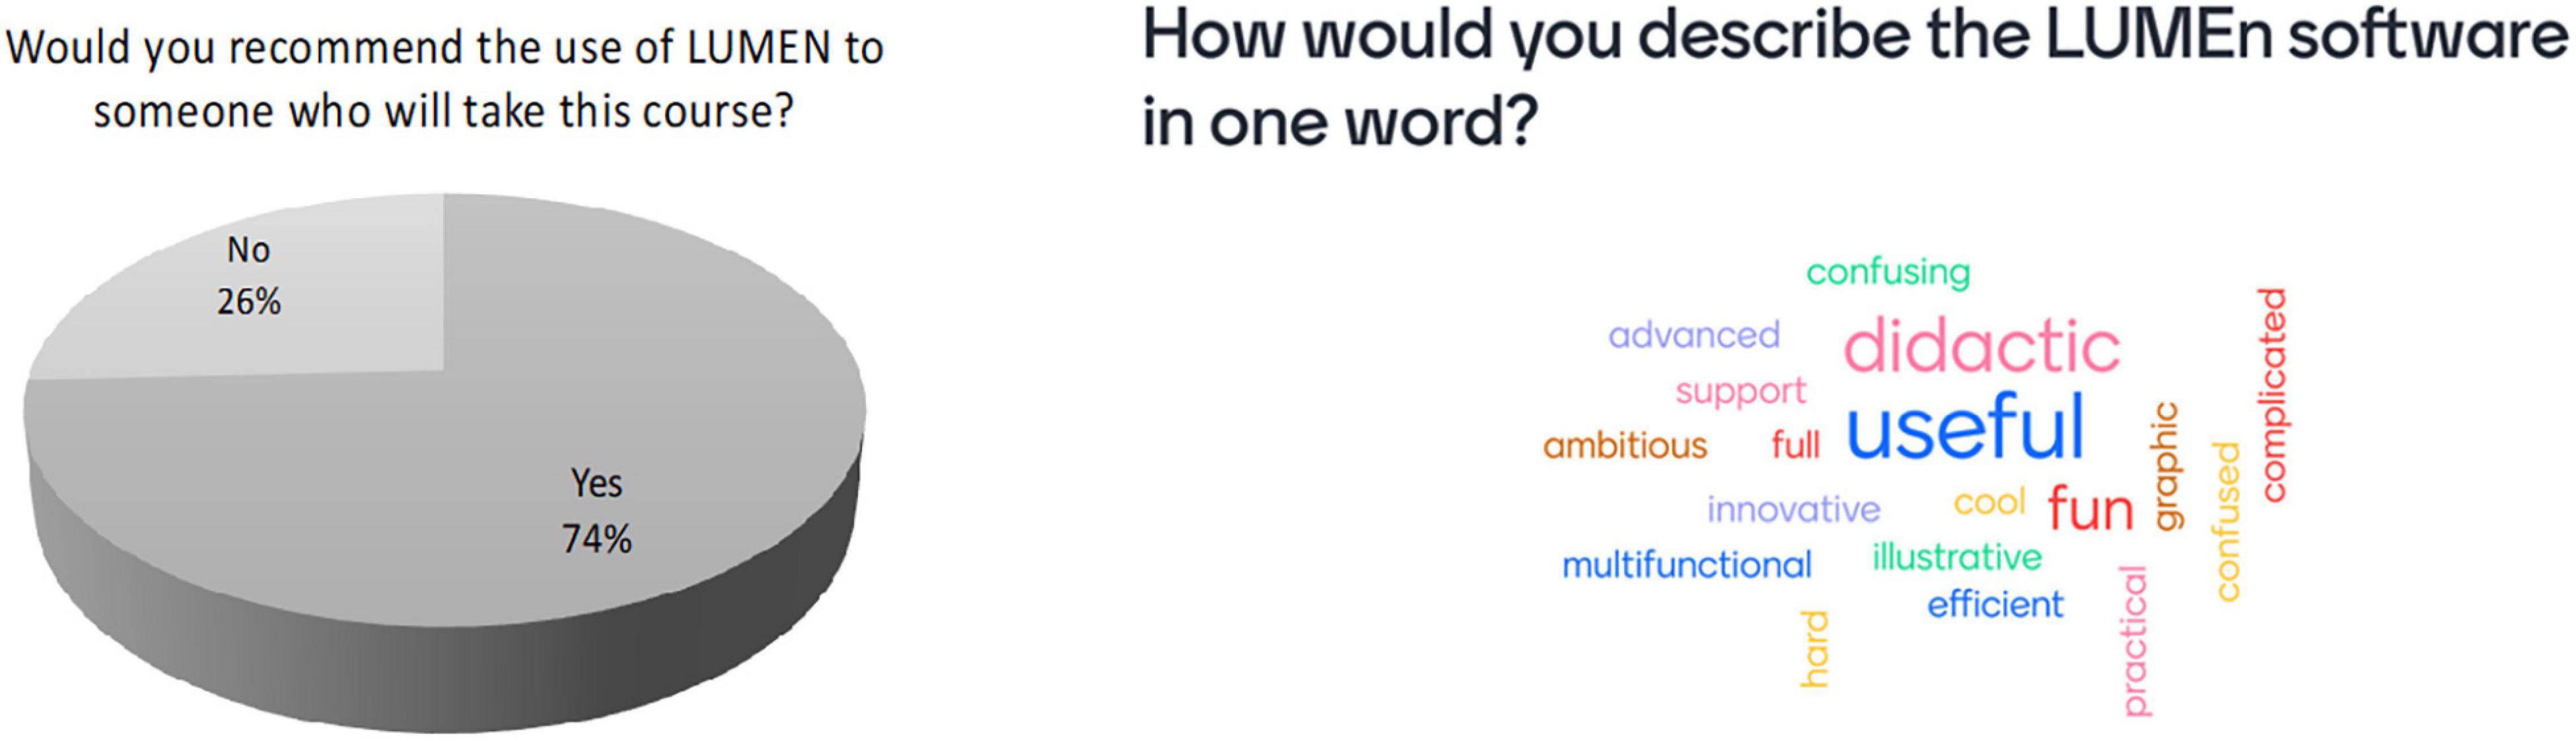
Figure 11. Student opinion on Lumen.
In summary, the reasons why students would recommend Lumen are: good methods of graphing and projection. It helps to understand the concepts. It has many functions that facilitate the learning and visualization of the figures. It is complete in terms of functions; it gives you the volume of a figure and it is intuitive. It is a practical way to recognize the equations of the formed surfaces since you must write it in its most basic form. It is also a good, easy-to-use visualization resource.
The reasons they wouldn’t recommend it are: Perhaps due to its complexity, it is a software that requires a lot of attention to see every part of it and use its potential. It is not easy to use and everything that can be done with the application is not adequately explained. Correct malfunctions. Installation is not easy. The user manual needs to be improved.
Teachers find Lumen well suited to perform spatial visualization and math skills development activities in a three-dimensional context.
Discussion
The use of computational tools such as Lumen has been found to help develop spatial visualization skills, improve understanding of mathematical concepts, and develop mathematical skills among them, problem solving. Medina Herrera et al. (2019) presented two software, one for augmented reality and the other for virtual reality, and showed that it helped them increase spatial visualization skills in students. Lumen contains the functionalities of the aforementioned software plus the adjustments suggested by students and teachers. Buentello-Montoya et al. (2021) presents a comprehensive review of works using Virtual Reality and/or Augmented Reality for teaching mathematics of the last 5 years, they claim that these technologies have an impact on education, by facilitating the teaching of subjects such as mathematics. Lumen computational tools have a greater impact in class if they are used as part of a pedagogical design of activities.
The students involved in the study obtained an average learning gain of 48%. The tests that were used to measure learning gain were designed to measure visualization and mathematical competencies, so the learning gain refers precisely to the development of visualization skills and mathematical competencies. The results of the pre- and post-tests, in effect, show a gain in visualization. The grades correspond to how well the students were able to rotate, project, perform Boolean operations between surfaces, use mathematical language, discuss, argue, and solve a problem, the last four are important characteristics of meaningful learning (Fink, 2013).
The study shows empirical evidence of the development of visualization skills through the use of this 3D multi-tool, but it also seems to be evidence of the relationship between spatial skills and problem solving, a relationship that some authors have proclaimed (Duffy et al., 2018; Muñoz-Rubke et al., 2021). Although no test was designed to investigate this last hypothesis, the four teachers involved have a strong impression that it is. It will have to be proven.
The results of this research suggest that the use of software and activities specially designed to develop mathematical skills helped students to:
• Design objects that model reality. As part of Activity 1, using Lumen, students designed a cookie jar, made up of quadratic surfaces.
• Acquire Foundational Knowledge and put it into practice. Lumen helps teachers explain calculus concepts in 3D space and students internalize them by applying them to problem solving.
• Develop communication skills by working as a team. These communication skills include moving from the natural language with which they describe the designed objects, to the mathematical language to be able to describe them accurately. After an individual design of the cookie jar, students were asked to select one per team and work on the box that contains it.
• The flexibility of Lumen and the design of the activities allowed that the answers were not unique, which promoted discussion and argumentation.
Each question and problem in Activities 1 and 2 was designed to relate to one or two mathematical competencies. This is in accordance with the mathematical competencies presented in Niss et al. (2016). The reported learning gain shows that the students developed competencies (mathematical and spatial) and learned concepts in a context. At first Lumen seems to be just a tool, used to solve activities and teach concepts. But with continued use, the same students find it useful to learn and have fun. Students have found uses for Lumen that were not in the minds of teachers. The students showed engagement with each of the activities. The activities and the use of Lumen used in this investigation have all the ingredients that (Koskinen and Pitkäniemi, 2022) mentions: active, constructive, intentional, and authentic learning. These pedagogical activities were designed to reinforce the understanding of the concepts and put them into practice, while mathematical skills went hand in hand with the process.
Buentello-Montoya et al. (2021) comment on the need for math teachers to have skills in the use of technology.
Although the students of the 4 teachers obtained learning gain. It could be that the skills in the use of technology and the general performance of the teacher have some influence, these two variables seem to represent the main differences between the 4 teachers in the study (as described in Section “Learning Gain”).
Lumen is a software with great potential, new functionalities have been proposed by teachers and students that can be developed in the next stage. The calculation of the volume of surfaces obtained from Boolean operations is one of the successes of Lumen, which cannot be found in the most used graphing software tools. Also, for the next stage of Lumen, the user manual will be improved, operation corrections will be made, and it can also be made available and tested for the iOS platform (as described in Section “Learning in Unified Mathematics Environments: Lumen Software”).
Due to the pandemic and the absence of presence in the classes, the augmented reality part of Lumen could not be used in class. Future studies intend to separate each of the mathematical competencies and measure the individual impact of the Lumen software on them.
We believe that the use of these types of tools in class improves students’ attention, retention, and engagement. Proof of this is required.
Data Availability Statement
The data that supports the results of this work is available from the corresponding author, SR (sergio.ruiz.loza@tec.mx), upon reasonable request.
Author Contributions
SR: conceptualization, data curation, funding acquisition, project administration, supervision, and writing—original draft preparation. SR and LM: figures and tables preparation and visualization. LM: formal analysis, investigation, and validation. LM and GH: methodology. GH: resources. SR and JM: software. SR, LM, GH, and JM: writing—review and editing. All authors have read and agreed to the published version of the manuscript. Please turn to the CRediT taxonomy for the term explanation.
Funding
This manuscript is a product of the project “LUMEn: Learning in Unified Mathematics Environments,” with funding from the NOVUS 2019 Fund, Grant with PEP nos. PHHT032-19ZZ00012-04-001 and PHHT032-19ZZ00012-05-001.
Conflict of Interest
The authors declare that the research was conducted in the absence of any commercial or financial relationships that could be construed as a potential conflict of interest.
Publisher’s Note
All claims expressed in this article are solely those of the authors and do not necessarily represent those of their affiliated organizations, or those of the publisher, the editors and the reviewers. Any product that may be evaluated in this article, or claim that may be made by its manufacturer, is not guaranteed or endorsed by the publisher.
Acknowledgments
We would like to acknowledge the technical support of Tecnologico de Monterrey, Mexico in the production of this work. Our appreciation to the members of the project “LUMEn: Learning in Unified Mathematics Environments.” We would also like to acknowledge the financial support of the Writing Lab, Institute for the Future of Education, Tecnologico de Monterrey, Mexico, in the production of this work.
References
Algani, Y. M. A. (2019). Innovative ways to teach mathematics: are they employed in schools? J. Comput. Educ. Res. 7, 496–514. doi: 10.18009/jcer.612199
Buentello-Montoya, D. A., Lomelí-Plascencia, M. G., and Medina-Herrera, L. M. (2021). The role of reality enhancing technologies in teaching and learning of mathematics. Comput. Electr. Eng. 94:107287. doi: 10.1016/j.compeleceng.2021.107287
Casey, B. M., and Ganley, C. M. (2021). An examination of gender differences in spatial skills and math attitudes in relation to mathematics success: a bio-psycho-social model. Dev. Rev. 60, ISSN0273–2297. doi: 10.1016/j.dr.2021.100963
Coletta, V. P., Phillips, J. A., and Steinert, J. J. (2007). Interpreting force concept inventory scores: Normalized gain and SAT scores. Physical Rev. special topics-physics Educ. Res. 3:010106.
Denham, A. R., Harbour, K. E., and Wind, S. A. (2021). Digital games and the teaching and learning of mathematics: a survey study. Inv. Math. Learn. 14, 1–14. doi: 10.1080/19477503.2021.2001292
Duffy, G., Sorby, S., Reves, P. R., Delahunty, T., Perez, L., and Ravishankar, J. (2018). “The link between spatial skills and engineering problem-solving,” in 2018 IEEE International Conference on Teaching, Assessment, and Learning for Engineering (TALE), (Piscataway: IEEE), 272–278.
Dunagan, L., and Larson, D. A. (2021). “Alignment of competency-based learning and assessment to adaptive instructional systems,” in International Conference on Human-Computer Interaction, (Berlin: Springer), 537–549. doi: 10.1007/978-3-030-77857-6_38
Fink, L. D. (2013). Creating Significant Learning Experiences: An Integrated Approach To Designing College Courses. San Francisco: An integrated approach to designing college courses.
Hagen, I., Lauermann, F., Wigfield, A., and Eccles, J. (2022). Can I teach this student? a multilevel analysis of the links between teachers’ perceived effectiveness, interest-supportive teaching, and student interest in math and reading, contemporary. Educ. Psychol. 69, 0361X–476X.
Hake, R. R. (1998). Interactive-engagement versus traditional methods: a six-thousand-student survey of mechanics test data for introductory physics courses. Am. J. Physics 66, 64–74. doi: 10.1119/1.18809
Huesca Juárez, G., and Medina Herrera, L. M. (2019). Learning gain study in a strategy of flipped learning in the undergraduate level. Int. J. Int. Des. Manufact. (IJIDeM) 13, 1245–1258. doi: 10.1007/s12008-019-00594-3
Johnson, T., Burgoyne, A. P., Mix, K. S., Young, C. J., and Levine, S. C. (2022). Spatial and mathematics skills: similarities and differences related to age, SES, and gender. Cognition 218:104918. doi: 10.1016/j.cognition.2021.104918
Koskinen, R., and Pitkäniemi, H. (2022). Meaningful learning in mathematics: a research synthesis of teaching approaches. Int. Electro. J. Math. Educ. 17:em0679. doi: 10.1187/cbe.10-03-0019
LeBow, V., Bernhardt-Barry, M., and Datta, J. (2018). Improving spatial visualization abilities using 3D printed blocks.UG. Theses. London: Civil Engineering Undergraduate Honors.
Mainali, B. (2021). Representation in teaching and learning mathematics. Int. J. Educ. Math. Sci. Technol. 9, 1–21. doi: 10.46328/ijemst.1111
Medina Herrera, L. (2020). “The use of videos to develop and evaluate mathematical skills,” in Proceedings of the 2020 International Conference on Education Development and Studies, (USA : University of Hawaii at Hilo), 10–13.
Medina Herrera, L., Castro Pérez, J., and Juárez Ordóñez, S. (2019). Developing spatial mathematical skills through 3D tools: augmented reality, virtual environments and 3D printing. Int. J. Int. Des. Manufact. (IJIDeM) 13, 1385–1399. doi: 10.1007/s12008-019-00595-2
Medina Herrera, L., Glaros, D., and Aguilar, M. (2020). ). MATHPOL: Development of Mathematical Competencies in Engineering Students using Project-Oriented Learning. In 2020 V International Conference on Information Technologies in Engineering Education (Inforino). Piscataway: IEEE, 1–5.
Muñoz-Rubke, F., Will, R., Hawes, Z., and James, K. H. (2021). Enhancing spatial skills through mechanical problem solving. Learn. Instr. 75:101496. doi: 10.1016/j.learninstruc.2021.101496
Niss, M., and Højgaard, T. (2019). Mathematical competencies revisited. Educ. Stud. Math. 102, 9–28. doi: 10.1007/s10649-019-09903-9
Niss, M., Bruder, R., Planas, N., Turner, R., and Villa-Ochoa, J. A. (2016). Survey team on: conceptualization of the role of competencies, knowing and knowledge in mathematics education research. ZDM 48, 611–632. doi: 10.1007/s11858-016-0799-3
Pérez-Fabello, M. J., Campos, A., and Felisberti, F. M. (2018). Object-spatial imagery in fine arts, psychology, and engineering. Think. Skills Creat. 27, 131–138. doi: 10.1016/j.tsc.2017.12.005
Suh, J., and Cho, J. Y. (2020). Linking spatial ability, spatial strategies, and spatial creativity: a step to clarify the fuzzy relationship between spatial ability and creativity. Think. Skills Creat. 35:100628. doi: 10.1016/j.tsc.2020.100628
Trujillo-Torres, J. M., Hossein-Mohand, H., Gómez-García, M., Hossein-Mohand, H., and Cáceres-Reche, M. P. (2020). Mathematics teachers’ perceptions of the introduction of ICT: The relationship between motivation and use in the teaching function. Mathematics 8:2158.
Keywords: virtual environments, educational innovation, spatial visualization, mathematics teaching, competencies development, complex thinking, higher education
Citation: Ruiz Loza S, Medina Herrera LM, Molina Espinosa JM and Huesca Juárez G (2022) Facilitating Mathematical Competencies Development for Undergraduate Students During the Pandemic Through ad-hoc Technological Learning Environments. Front. Educ. 7:830167. doi: 10.3389/feduc.2022.830167
Received: 06 December 2021; Accepted: 06 May 2022;
Published: 02 June 2022.
Edited by:
Diana Hernández Montoya, Universidad Estatal a Distancia, Costa RicaReviewed by:
Ana María Sandoval Poveda, Universidad Estatal a Distancia, Costa RicaRandall Blanco, Instituto Tecnológico de Costa Rica (ITCR), Costa Rica
Copyright © 2022 Ruiz Loza, Medina Herrera, Molina Espinosa and Huesca Juárez. This is an open-access article distributed under the terms of the Creative Commons Attribution License (CC BY). The use, distribution or reproduction in other forums is permitted, provided the original author(s) and the copyright owner(s) are credited and that the original publication in this journal is cited, in accordance with accepted academic practice. No use, distribution or reproduction is permitted which does not comply with these terms.
*Correspondence: Sergio Ruiz Loza, sergio.ruiz.loza@tec.mx
†These authors have contributed equally to this work and share first authorship