
The Impact on Urban Air Quality of the COVID-19 Lockdown Periods in 2020: The Case of Nicosia, Cyprus


Laboratory-Isle of Excellence of Environmental Fluid Mechanics, Department of Civil and Environmental Engineering, School of Engineering, University of Cyprus, Nicosia 2109, Cyprus
*
Author to whom correspondence should be addressed.
Atmosphere 2021, 12(10), 1310; https://doi.org/10.3390/atmos12101310
Submission received: 7 September 2021
/
Revised: 28 September 2021
/
Accepted: 4 October 2021
/
Published: 7 October 2021
(This article belongs to the Special Issue Trends in Global and Regional Urban Air Quality: Influenced by COVID-19 Pandemic)
Abstract
:The purpose of this study is to assess the impact of the lockdown measures in 2020 on the urban air quality in Nicosia capital city, in Cyprus—an island-country in the East Mediterranean—which is often affected by transboundary dust pollution. The study focuses on three criteria pollutants, nitrogen dioxide (NO2), carbon monoxide (CO) and Particulate Matter (PM10), taken from three Air Quality Monitoring Stations; two urban stations and one reference-background. The results of this study show that the decrease in traffic, which is the main source of high concentrations of pollutants in the urban area, reached up to 66.5% during the lockdown. At the beginning of the lockdown period, it exhibited a downward trend of 29% for CO concentration, and downward trend 43% for NO2 and PM10 concentrations. The NO2 concentration exhibited an upward trend towards the end of the lockdown; with the indication that this was due to meteorological conditions relevant to the monitoring stations and the transport of NO2 concentrations from sources that cannot be tracked. PM10 concentrations exhibited a varying behaviour as observed in the trends, where the decreasing trend was followed by an increasing trend due to transboundary air pollution episodes occurring in the same period.
1. Introduction
In December 2019, a new type of coronavirus COVID-19 was identified for the first time in Wuhan, China. In a short time, the Coronavirus disease was spread to other countries and on 11 March 2020, the World Health Organization issued its first Disease Outbreak News report for public health [1,2]. By December 2020, more than 71 million confirmed cases and 1.5 million deaths were recorded worldwide due to the COVID-19 pandemic [3].
As a measure to prevent the wide spread of the pandemic, governments in most countries had set movement restrictions for long time periods known as “lockdowns” [4]. The first case of the new virus in Cyprus, according to the decrees of the Ministry of Health, was detected on 9 March 2020, putting the public services on alert to impose immediate restrictive measures [5]. At the beginning of this unprecedented situation, the most important measure was the partial restriction on unnecessary movement of citizens. With the further spread of the virus, the measures took a stricter character by restricting the mobility to only important cases [6], reducing thus the traffic activity on the roads.
Besides the obvious effects on the public health and economy caused by the pandemic [7], the reduced traffic volumes had a chain effect in other sectors, e.g., the environment. Consequently, reduced anthropogenic activity during COVID-19 is expected to play a key role in air quality [8,9,10,11,12,13] due to its strong links with the road traffic and industrial activities.
The purpose of this study is to assess the impact of the lockdown measures on the urban air quality in Nicosia, capital city of Cyprus—an island-country in the South-Eastern Mediterranean; the region is far from continental industrial cities that highly influence the NO2 and CO concentrations but vulnerable to transboundary pollution of PM10 at the same time. This assessment will be conducted through the investigation of three criteria pollutants, nitrogen dioxide (NO2), carbon monoxide (CO) and particulate matter with an aerodynamic diameter of less than 10 μm (PM10), for which data are available for all three stations. This work makes a thorough comparison of these criteria pollutant concentrations during the lockdown period with (i) the concentrations from the pre- and post- lockdown period, as well as (ii) the concentrations in the corresponding periods of the two immediately previous years where no lockdown periods were in place. For a more comprehensive assessment approach, data from three different Air Quality Monitoring Stations (AQMSs) were used as well as some regional computational dust model data. Specifically, the three stations were the urban Nicosia Traffic Station (NicTr), the suburban AURA station and the rural-background Station (AGM), while the modelled data were obtained from the regional scale dust model BSC-DREAM8b. At the same time, traffic volume data, measured in proximity to the NicTr station, as well as relevant meteorological measurements were also used. Therefore, a multiscale and multivariate approach is entailed in this study making it unique for the region of the South-Eastern Mediterranean and possibly in other regions worldwide with the same characteristics. However, it has to be noted that it was a challenge to analyse variables which are measured from different sites with different recording resolution. Some limitations were also encountered due to the lack of data for significant pollutants, e.g., O3 and PM2.5 concentrations, as well as meteorological data from more AQMS, while the unidentified source of pollution coming for the northeast region of the studied area is something to also be noted.
The results of this study could be added to several similar results in other parts of the world and refer to other research on the effects of COVID-19 on air pollution [14,15,16,17,18,19]. A recent paper from Fu F. et al. [19] found that in most of the 20 megacities there was a significant decrease of NO2, and CO concentrations exhibited due to the reduction of emissions caused by lockdown. Sokhi et al. [20] studied the air quality of 63 cities in 25 countries and concluded a decrease of up to about 70% in NO2, while the CO concentrations exhibited an increase even during lockdown periods. Kumari and Toshniwal [21] also studied the effect of the lockdown in 12 major cities and found that PM10 and NO2 were reduced between 24 and 47% for PM10 and between 32 and 64% for NO2, due to restriction on anthropogenic emission during lockdown
This paper is organized in five sections as follows: Section 2 provides a brief description of the study area as well as the pollutants studied in this work. Section 3 presents the methodology, and the data analysis while Section 4 presents and discusses the results of the comparative analysis of the corresponding pollutant concentrations across the different periods at the three different stations accounting also for the impact of the meteorology and the transboundary dust pollution during the study period. Finally, Section 5 concludes the main findings of this research study.
2. Status of the Study
2.1. Site Description
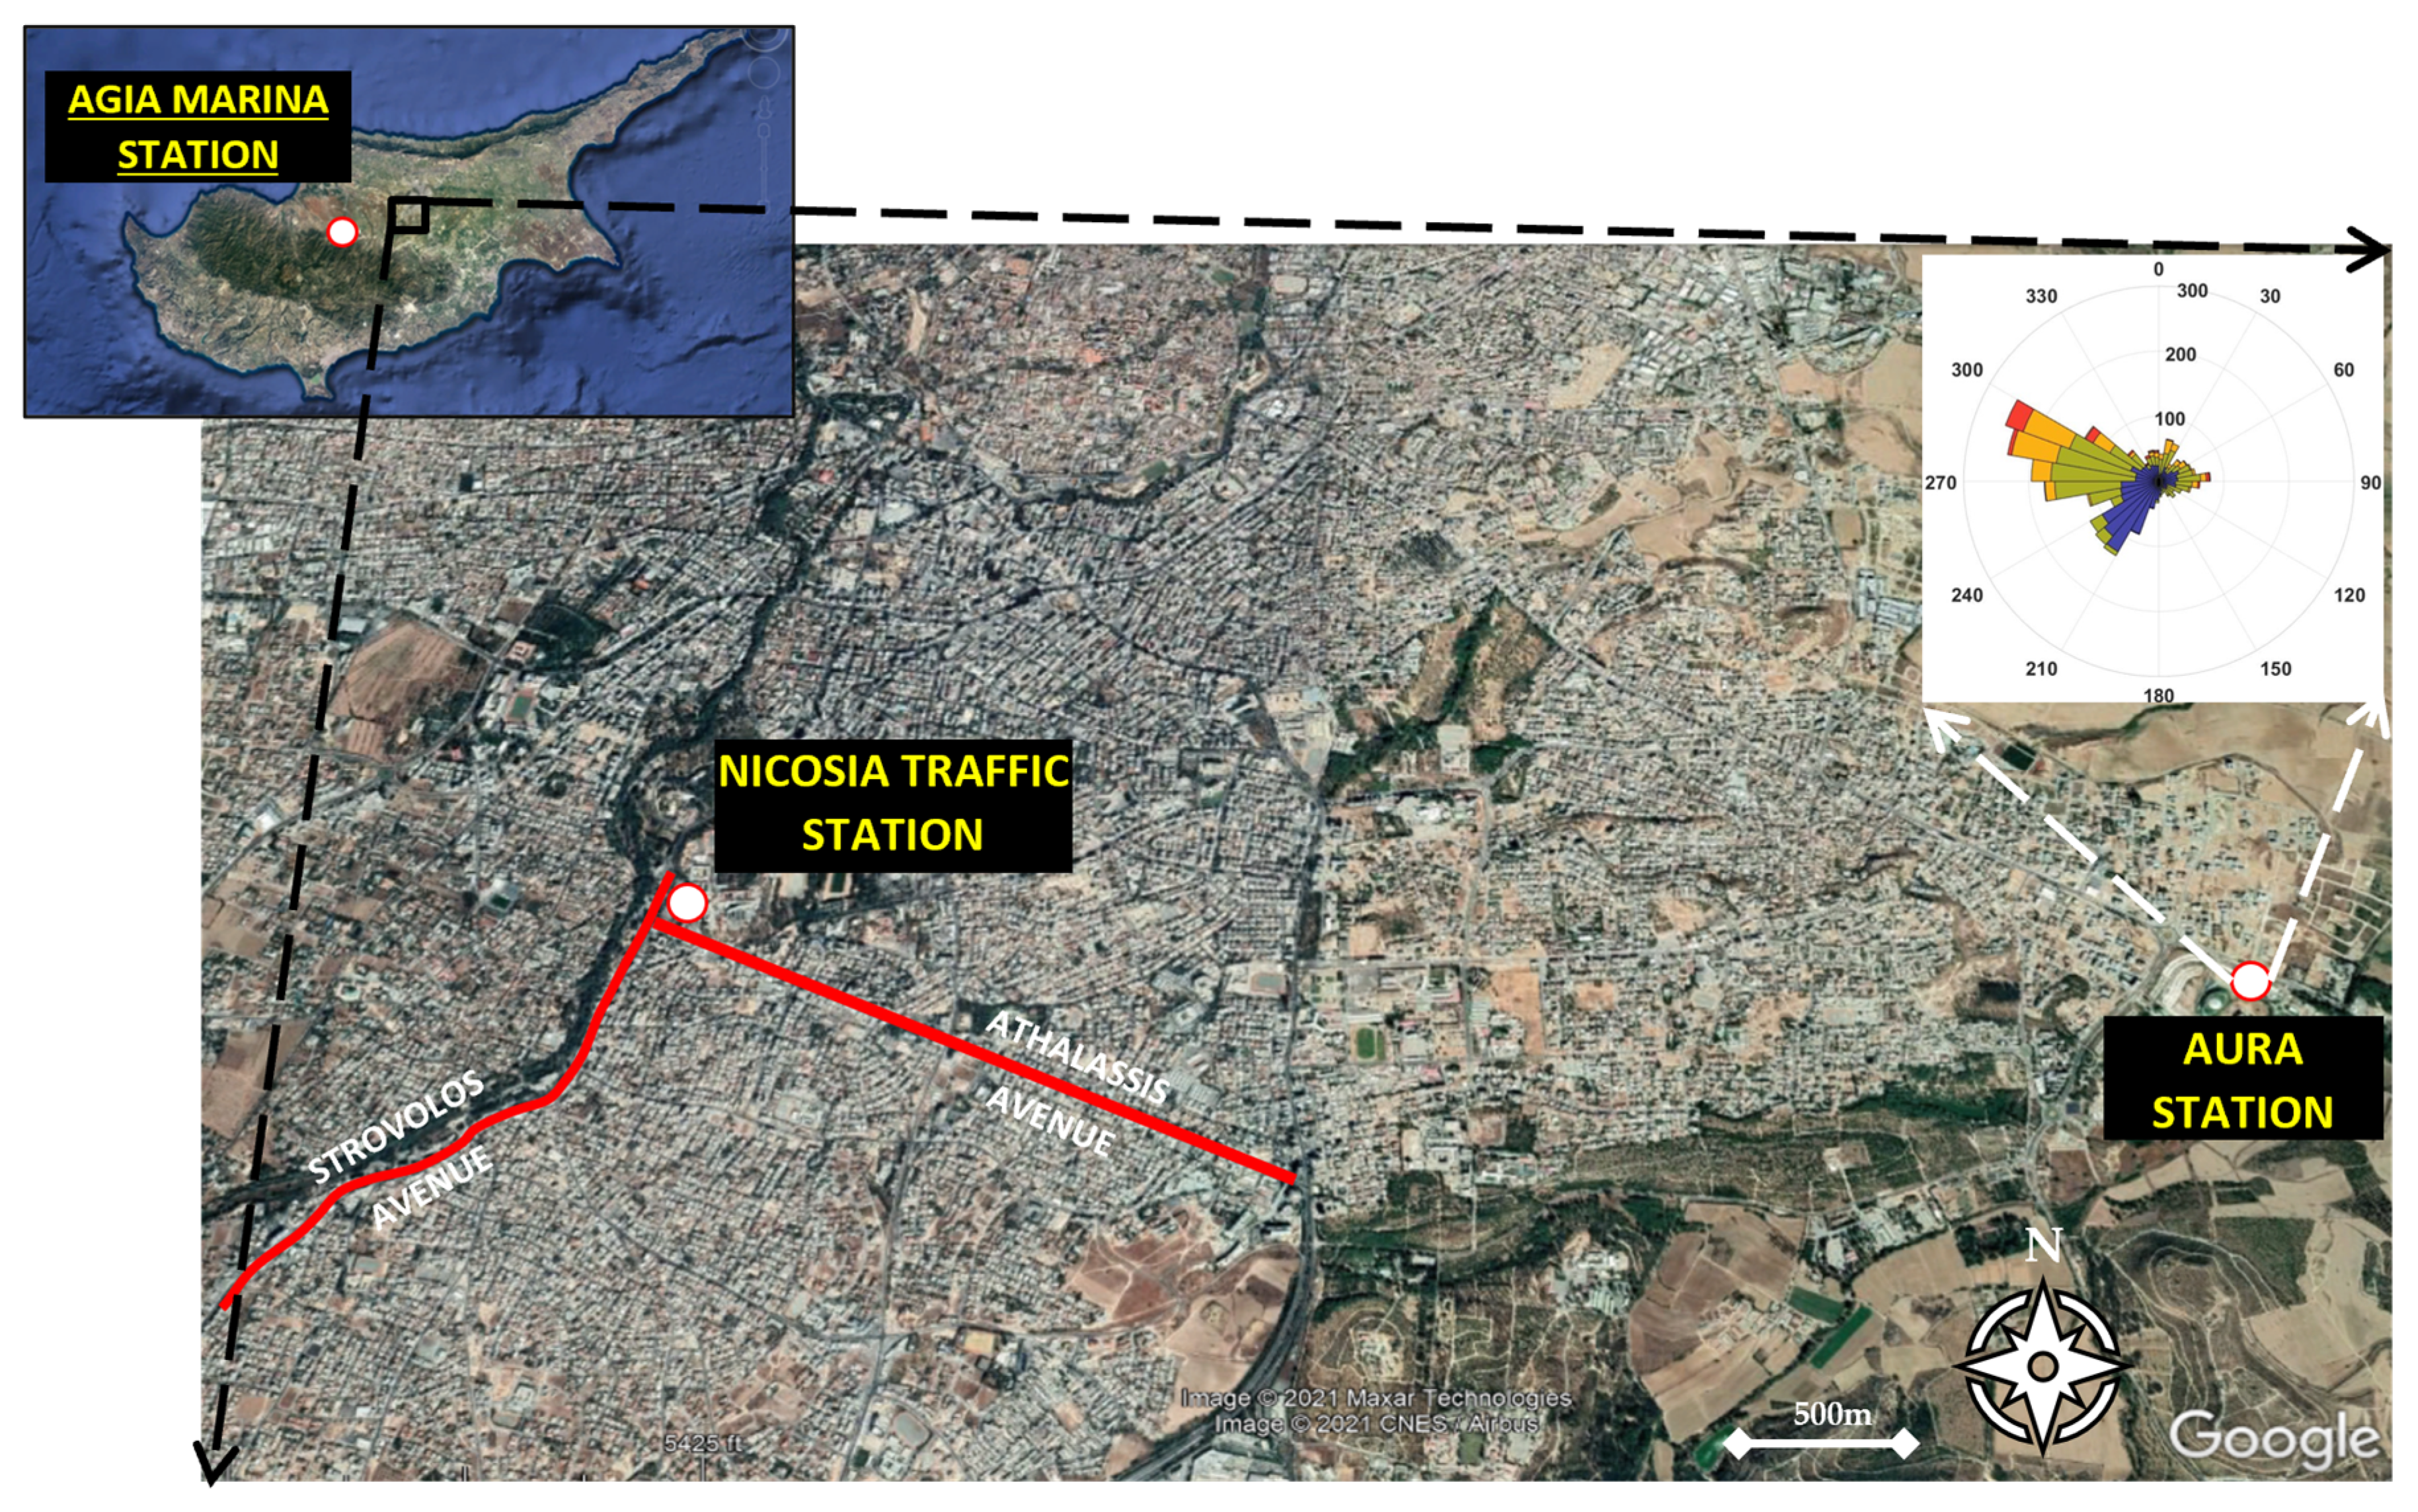
Cyprus is an island-country in the Eastern Mediterranean Sea that is characterized as a sensitive region with multidimensional influences from natural phenomena (e.g., dust episodes, suspended sea-salt particulates from sea-droplet evaporation) which have a significant impact on the air quality of the island [22]. It has a typical Mediterranean climate, with a hot and dry Summer and wet Winter, separated by short Autumn and Spring. In the context of this study, data were collected from three (3) AQMSs. The Atmospheric Dynamics and Air Quality Monitoring Station—AURA Station, is operated and maintained by the Laboratory-Isle of Excellence of Environmental Fluid Mechanics of the Engineering School of the University of Cyprus. The station is located on the Campus of the University of Cyprus in the Municipality of Aglantzia (Figure 1). More specifically, it is located on the south-eastern side of Nicosia at the northern entrance of the University of Cyprus Campus. It is considered a suburban station as it is located near a road with sparse traffic and agricultural land [22].
Data from the AQMSs network of the Department of Labour Inspection, Air Quality, and Strategic Planning, Republic of Cyprus, were also used. Specifically, measurements were used from the background station of Agia Marina Xyliatou—AGM Station—which is far from anthropogenic activities (rural background station), as well as from the Nicosia traffic station—NicTr Station—which is close to busy traffic arteries (urban traffic station) (Figure 1).
2.2. Data Sources
This study focuses on the concentrations of three criteria pollutants, CO, NO2, and PM10, that pose an acknowledged risk to public health [23]. AURA, AGM and NicTr stations contain automatic instruments (i.e., analysers) with high-resolution sampling up to 1 min, operating based on the nondispersive infrared spectroscopy, chemiluminescence and Tappered Element Oscillating Microbalancing (TEOM) measuring principles, for the 3 pollutants, respectively. In addition, meteorological data, such as ambient temperature (AT), relative humidity (RH), barometric pressure (BP), solar radiation (SR), rainfall (RF), wind speed (WS), wind direction (WD), and the hourly standard deviation of horizontal wind direction (SIGMTHETA) are also being recorded. The anemometer is mounted at the height of 10 m from the ground. Traffic load data were provided by the Department of Public Works of the Ministry of Communications and Works of the Republic of Cyprus for the Avenues of Strovolos and Athalassis.
2.3. Study Periods
The overall study period was divided into three subperiods based on the intensity of the lockdown measures, which also includes dates before and after the lockdown as shown in Table 1. The first subperiod, P1, is the period before the outbreak of the pandemic in Cyprus where there were no lockdown measures. The second subperiod, P2, was triggered at a moment where the first case of the disease was identified, and various degrees of measures were taken. The initial period of “loose”, restrictive mobility measures is designated as P2a, while with the spread of the pandemic, a new period of measures, P2b followed, where stricter lockdown measures were implemented. This P2b period was characterized by a single allowance for outdoor mobility per person daily. The P2b period was followed by a different period of measures, P2c when the pandemic was restricted, and the measures had “loosen up” again. Finally, after the end of this P2c period, the measures ceased to apply, and a new period, P3, of no measures, “back-to-usual” phase was re-established.
3. Data Processing and Methodology Approach
The analysis was conducted based on the use of the average hourly values of the stations. MATLAB® (R2020a) and RStudio (v.1.31073) software (and its “openair” software package [24]) were used for the data analysis. In addition, the BSC-DREAM8b model, which predicts the atmospheric life cycle of dust, was utilized to identify desert dust storms (DDS). The BSC-DREAM8b model was chosen among fifteen (15) online available regional dust models, due to its reliability for the study area [22]. Furthermore, in order to identify the regional scale air masses origin, the Hybrid Single-Particle Lagrangian Integrated Trajectory model HYSPLIT developed by the Air Resources Laboratory (ARL) of the National Oceanic and Atmospheric Administration (NOAA), was used. HYSPLIT was run to calculate the 72-h backward trajectories with height at 700 m, 1500 m, 2500 m and 4000 m above ground level [25].
Wind rose plots are used to succinctly present the wind data, whilst the use of box plots provides descriptive statistics in a condensed way, such as the median, 25%, and 75% percentiles as well as the extreme values. Pollution rose diagrams, which also were plotted, are a variant of the rose diagrams where the measurements of the pollutant concentrations are combined with the corresponding measurements of the wind speed and direction. Pollution rose diagrams can be used to show the wind directions that dominate the total concentrations. In bivariable polar plots, the concentration varies depending on the speed and direction of the wind.
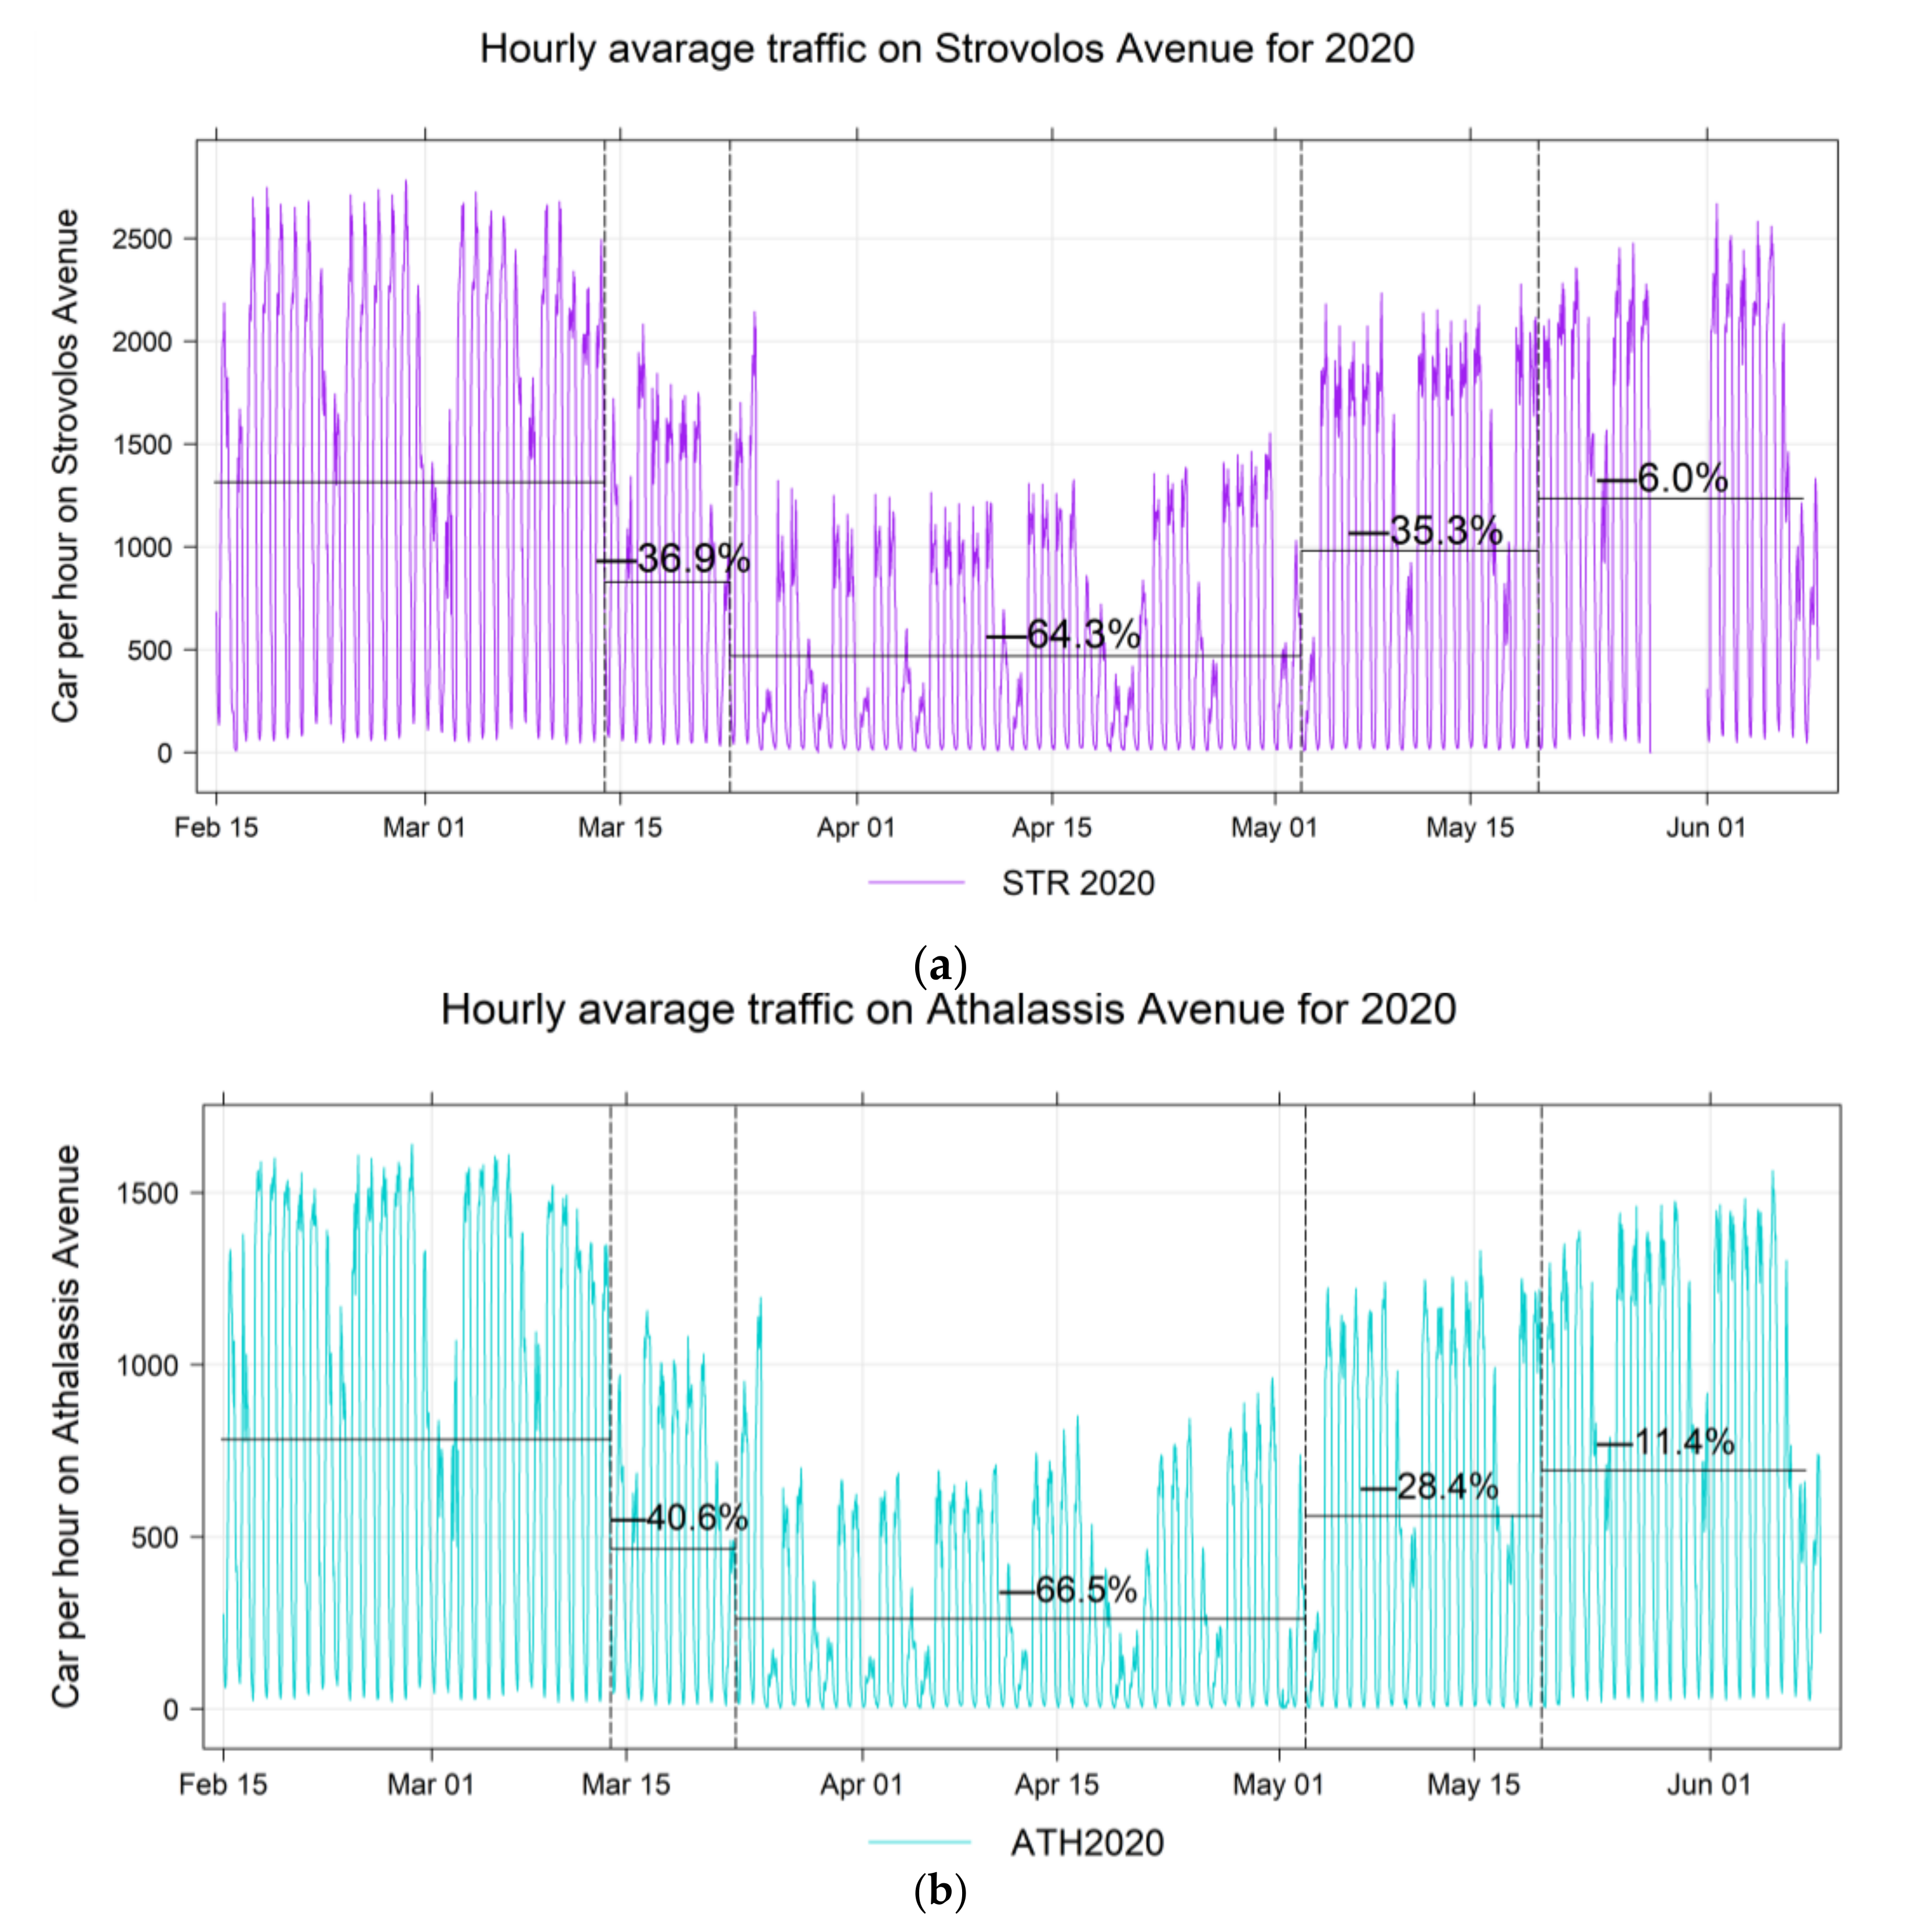
Figure 2 shows the traffic load time series of the two main surrounding roads of the NicTr station. During P2a/2020, there is a decrease of vehicles by 36.9% in Strovolos Avenue and 40.6% in Athalassis Avenue compared to P1/2020. During P2b/2020 where stricter lockdown measures were in place, the reduction in vehicles reaches 64.3% for Strovolos Avenue while for Athalassis Avenue, it is 66.5% compared to P1 period. In P2c/2020 period, the percentage decrease reduces back to 35.3% and 28.4% for the two Avenues, respectively, while in P3/2020 (without lockdown measures in place), the reduction compared to the P1/2020 period is only 6% and 11.4%.
Table 2 summarizes the average number of traffic load per road per hour, for three consecutive years, i.e., 2018, 2019, and 2020. For 2018 and 2019, no significant change in the number of vehicles between periods can be identified. In addition, Table 2 shows the reduction of vehicles for 2020 during the lockdown periods. These traffic load data will be useful and be associated with pollutants during the study period.
Table 3 presents the mean values of the concentrations measured at the AURA station during each subperiod over the entire study period as indicated in Table 1. The concentration mean value of each period is compared with the reference period P1 of each year. In addition, the mean values recorded for 2020 are compared with the corresponding periods of 2018 and 2019.
The CO concentrations of the 2020 lockdown period show a monotonically decreasing trend between the subperiods with an overall decrease of 23–29% of the concentration every year. Here, we do not present values for CO concentrations for 2018, due to the lack of measurements of CO concentrations for the periods P1, P2a, and P2b.
As for the NO2 concentrations, a significant variation is observed. There is a steep decrease of concentrations (43%) between P1/2020 and P2a/2020 which is almost twice the difference/decrease between the corresponding periods in the previous year, i.e., between P1/2019 and P2a/2019 (23%) and almost five times of the corresponding decrease between P1/2018 and P2a/2018 (9%). Nevertheless, there is a significant increase of NO2 concentrations at P2b/2020, P2c/2020, P3/2020 compared to the reference period but also in comparison with the corresponding periods of previous years.
The PM10 concentrations of 2020 gradually decrease over the study period compared to P1/2020 except in the subperiod P2c/2020 which exhibits an increase compared to the corresponding subperiod of the previous year, P2c/2019 by 60%. This increase is attributed to the Saharan Desert Dust Storms (DDS) observed from the recorded measurements at stations as we will investigate in Section 4.5. The PM10 concentrations in 2020 were reduced compared to those in 2018, ranging between 19% and 64% reductions; this was because 2018 was a year with strong DDSs observed resulting into quite high PM10 concentrations [26]. For the study period in 2019, a gradual increase of the PM10 concentrations between subperiods was observed with the ending subperiod P3/2019 to show an increase of 164% compared to the initial subperiod P1/2019 due to the DDS from which the area is affected.
4. Results and Discussion
Our findings present evidence that the measured air pollution has been positively affected by the lockdown measures across the island as investigated through the monitoring measurements in the capital city of Nicosia. This section discusses the observed concentration variations of the three criteria pollutants and the traffic data as well as the trends of daily average values are presented and discussed. In order to study the influence of the local meteorology on the pollutants concentrations variations, the variation of the most important meteorological parameters will be analysed, and, in addition, the respective pollutants variations at the AGM and NicTr stations will be discussed in relation to the anthropogenic activity. Finally, the origin of the high/peak concentrations is further investigated using back trajectory data, pollution rose diagrams and bivariable polar plots.
4.1. Temporal Trends of Pollutant Concentrations
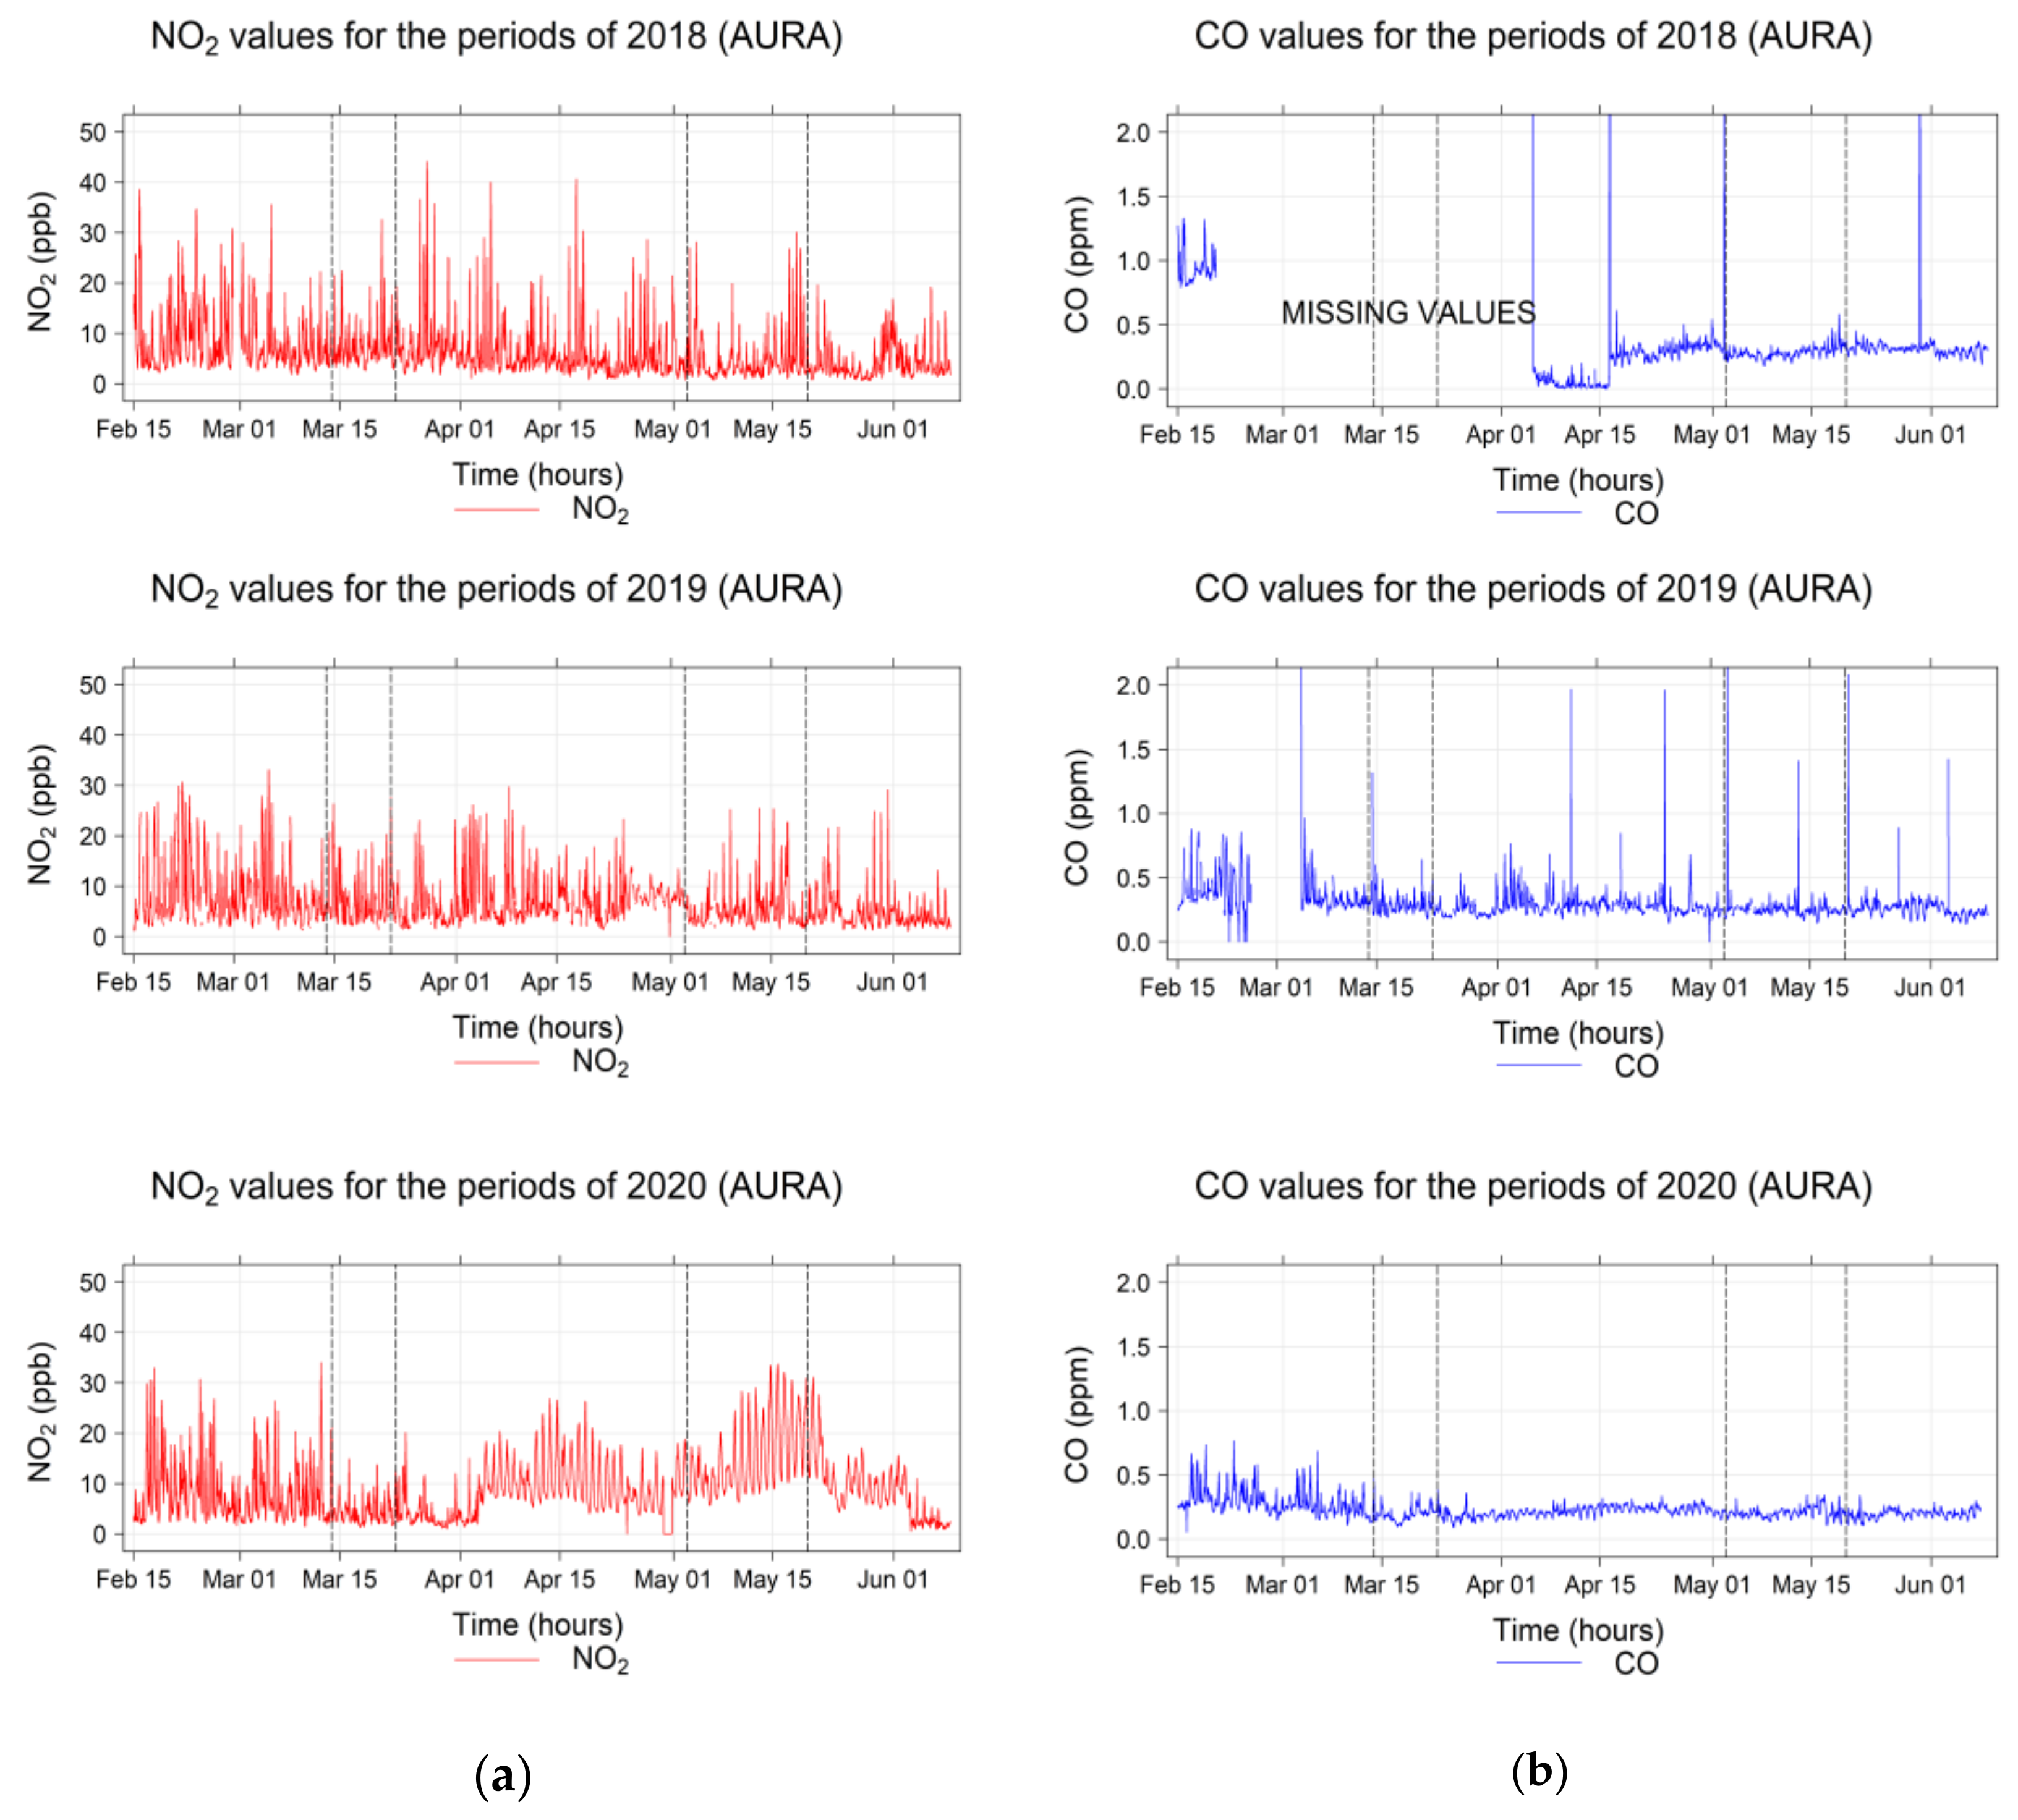
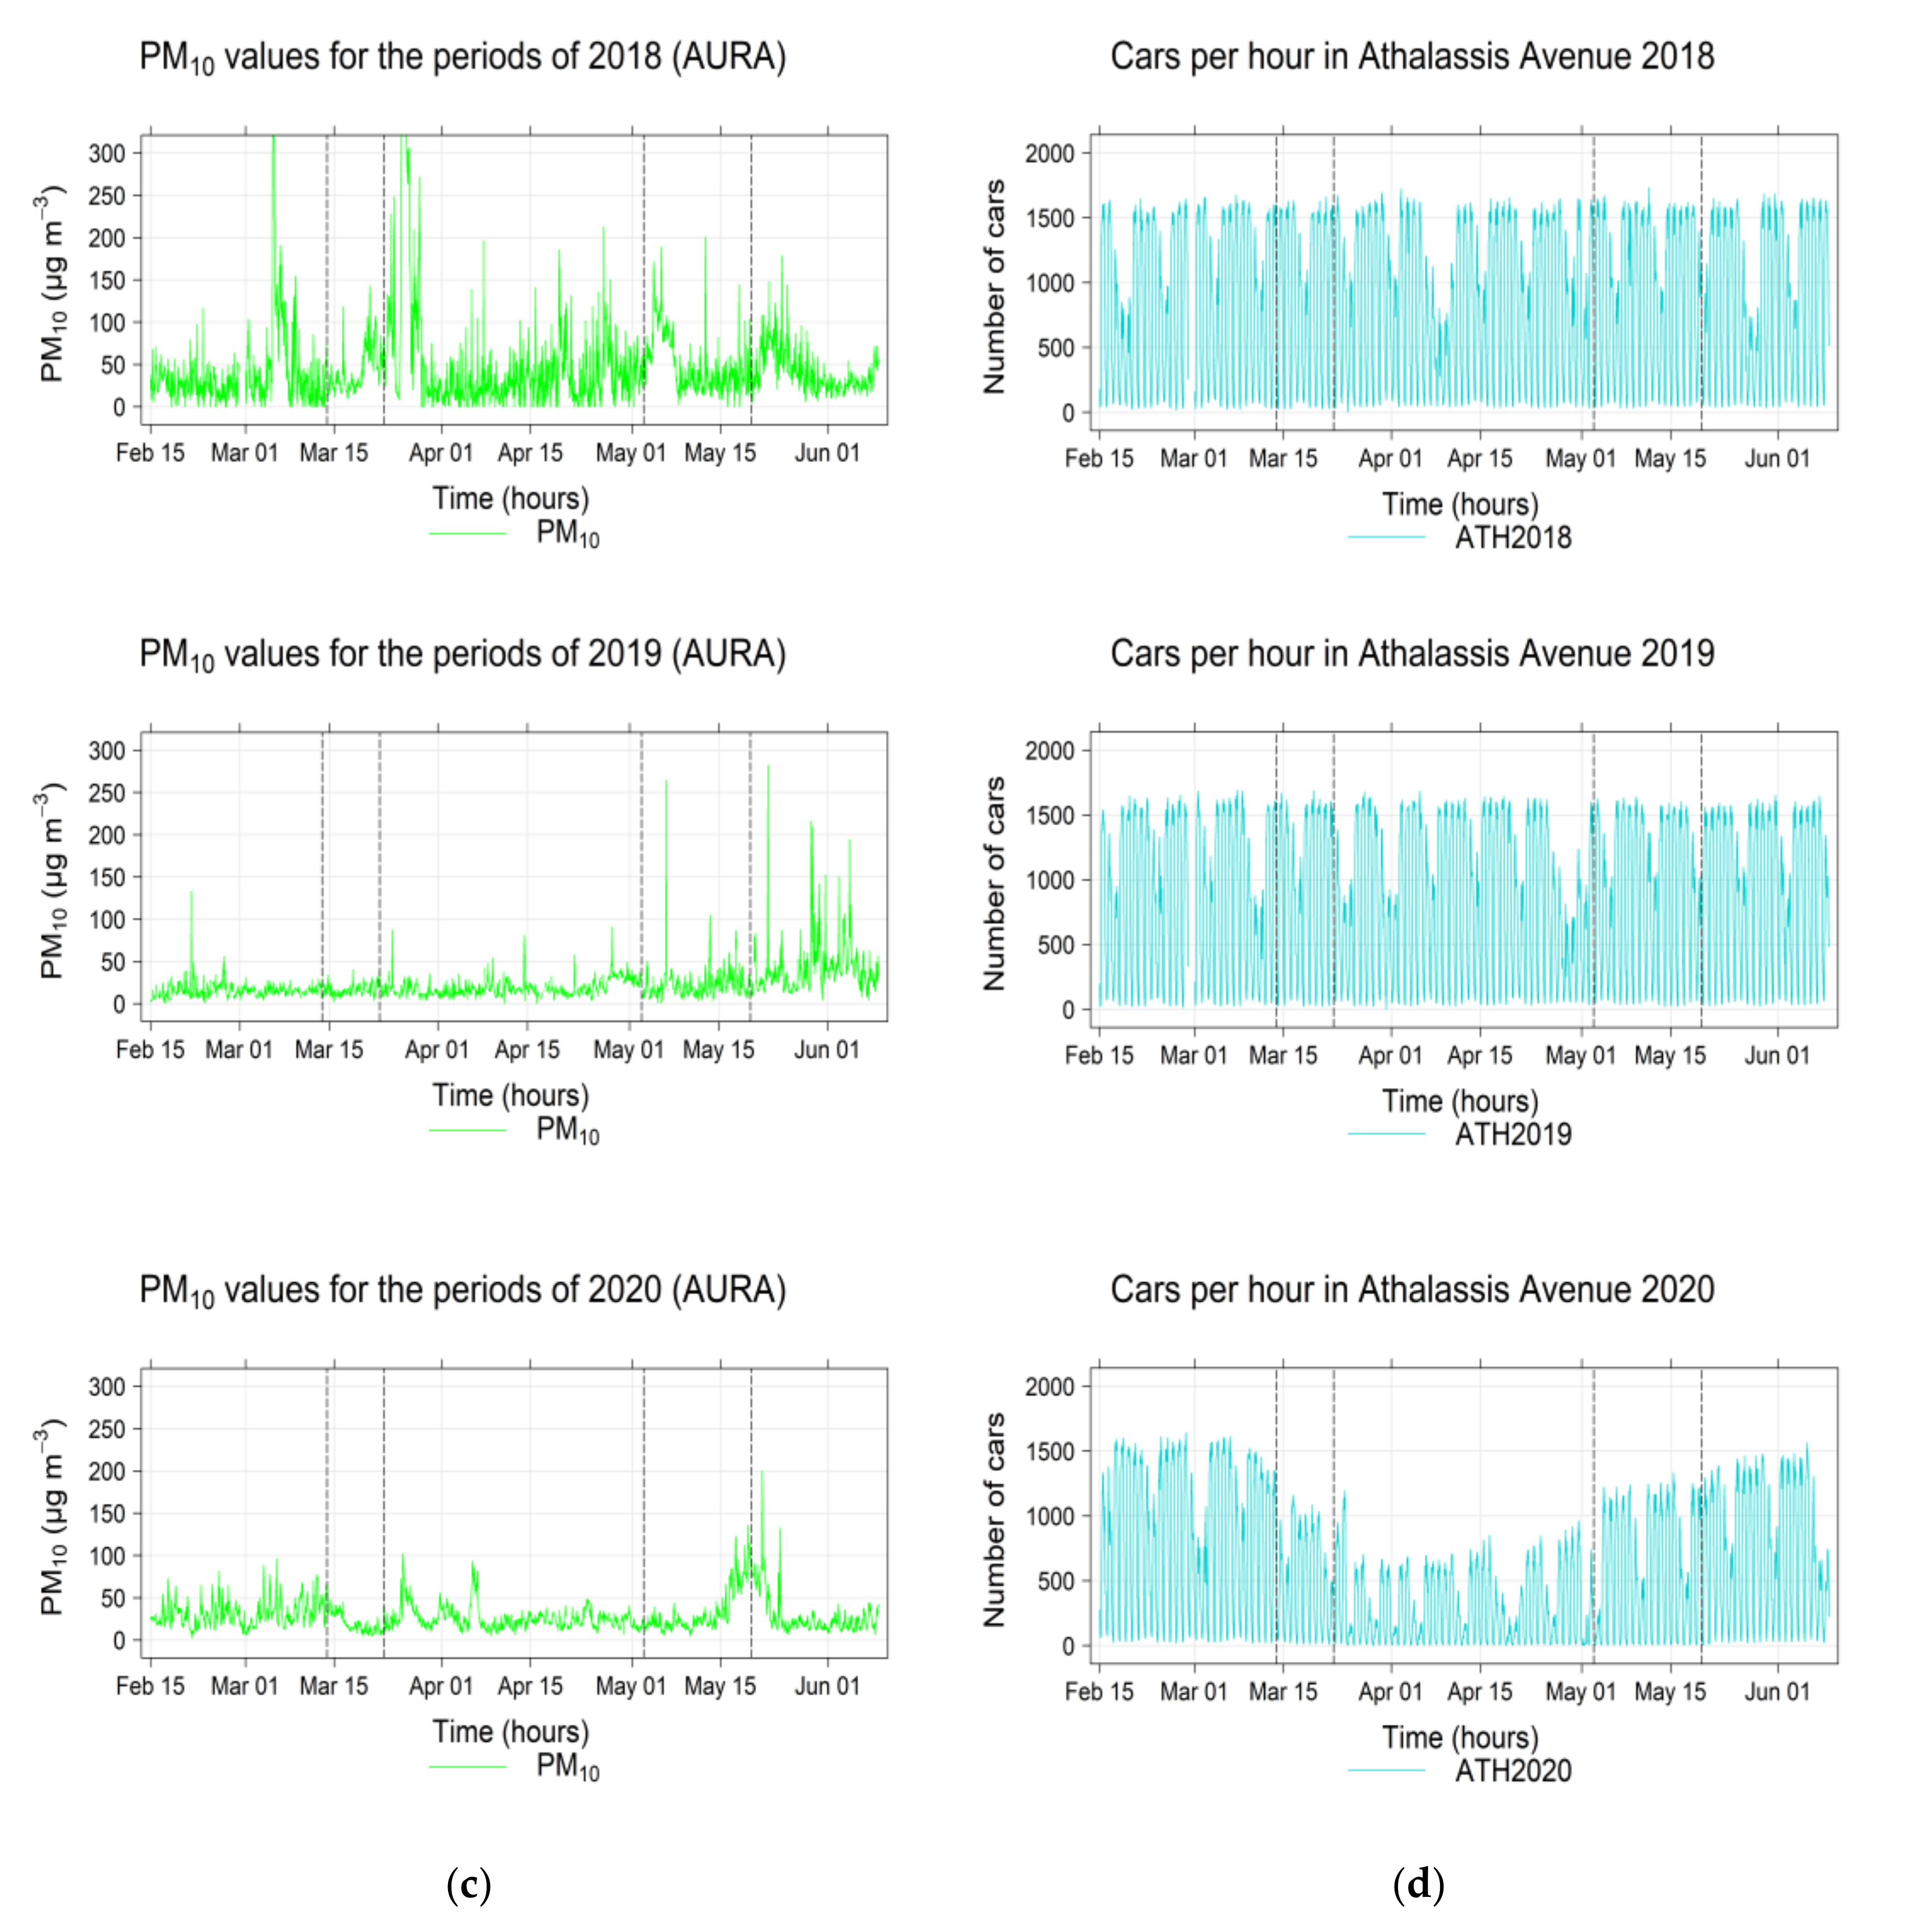
Figure 3 shows the time series plots of pollutants concentrations for the study period of 2018, 2019 and 2020. As the summer season is approaching, the photochemistry becomes more active [27,28,29,30], a decrease step of CO and NO2 concentrations is observed in Figure 3a,b. The pollutants concentrations of 2020 (Figure 3c) show a different behaviour compared to those of 2018 and 2019. The NO2 concentrations initially exhibit a decreasing trend at the biggening of P2, while two large peaks in the P2b/2020 and P2c/2020 subperiods are observed. Similarly, an initial reduction in CO concentrations is followed by a constant level, however, the CO concentrations overall remain at lower levels than those of 2018 and 2019. In contrast, PM10 concentrations of all years, show an increase with sporadic peak values during the study periods. These peaks, as well as the increasing trend of concentrations, are due to the desert dust storm (DDS) episodes, since spring is the period of their frequent occurrence in the SE Mediterranean [31,32]. Later, in Section 4.5, we provide evidence of the origin of these peaks.
The temporal trends of the concentrations during the study period can be illustrated more clearly by using daily average values and a corresponding trend analysis. The trend line was calculated by using the “LOESS” method (locally weighted smoothing), which provides a smooth curve in the time series analysis with the use of the adjacent values on the x-axis. Figure 4 shows the daily average values of each pollutant (indicated as a coloured continuous line), the corresponding trend of their values calculated with “LOESS” method (indicated as black continuous line), as well as their standard deviation (indicated as grey shaded area). Figure 4a,b shows the gradual decrease of NO2 and CO concentrations from the start until the end of study period while Figure 4c shows the gradual increase of PM10 following the season trends of pollutants in the area. The concentrations of NO2 initially show a decrease while then two large peaks appear for the dates from 5 to 20 April 2020 and from 10 to 20 May 2020. Furthermore, the CO concentrations initially reveal a decrease while later remain a steady trend with low values.
PM10 concentrations exhibit a gradual increase from the start until the end of the study period. This increase is attributed to the presence of dust transboundary pollution, which according to long-term measurements in the region, the SE Mediterranean region is highly affected by DDSs during the spring seasons [22,32]. Later, in Section 4.5, we provide evidence of the origin of these peaks.
Focusing on Figure 5, it is observed that NO2 concentrations show a significant decrease of 42.7% when the lockdown measures were first implemented (P2a/2020). The decrease of NO2 concentrations is evident in a short period of time because NO2 has a short lifespan and an immediate response to emission changes [33,34]. A similar result is observed in PM10 concentrations with the same percentage decrease of 42.7%. The CO concentrations show reduction like the other two pollutants, although the reduction was smaller, compared to the other two cases, at the level of 28.6%. This different behaviour can be explained based on the much longer lifespan that CO has, compared to the lifespan of the other two pollutants. Therefore, CO concentrations respond to their emissions at a much slower rate. The global average life expectancy of CO is estimated at 2 months and depends on the season and latitude [28,35,36]. However, it should be noted that the CO concentration is directly related to the reduced traffic load, since it is not affected by photochemistry as is the case of NO2 which is prone to the photochemistry.
According to the literature, most countries around the world showed corresponding reductions in concentrations in April 2020 due to the reduction of emissions from reduced use of means of transportation [11,19,20]. In similar studies conducted in Asia, it appears that the lockdown period caused a significant reduction of air pollution [37], and this was accompanied with an observed significant decrease in the number of polluted days due to high concentrations [38].
The hourly variation of a pollutant concentration in a day as well as the daily variation within a week can expose important information about the possible sources of origin of a pollutant. Figure 6 shows (a) the temporal trend of the normalized concentrations per day of the week and (b) the temporal trend of the normalized concentrations per hour during the day, for the three study pollutants and the traffic load in Athalassis Avenue for the P2/2019 and P2/2020. The actual values depicted in the graphs are normalized over the mean value to highlight the differences between the daily fluctuations. The values shown in the plots is the 95% confidence interval of the mean.
In Figure 6a, for P2/2019, NO2 concentrations (indicated with a red-coloured line) are characterized by 2 peaks during the entire extent of a working day—one peak is observed around 08:00 am and another peak at 07:00 pm; during the extent of the weekends, the morning peak is observed to be much weaker. Similar daily NO2 fluctuations are observed in other studies where they demonstrate the strong influence of road transport on NO2 concentrations during weekdays as well as what is also known as “The weekend effect” for weekends [39,40,41]. However, the corresponding observed daily variation of NO2 concentrations during the period P2/2020 in 2020 is completely different. Specifically, the concentrations of NO2 appears to still exhibit a double peak, one in the early morning and another in the afternoon. However, the intensity of the peaks is substantially variant, in some cases from day to day, e.g., on Wednesday to the point of one peak not being observable; in all cases it is observed that the afternoon peak is shifted earlier in the afternoon compared to previous years patterns, in the time span from 12:00 pm to 06:00 pm, most probably as a result of the application of restriction on the latest-possible time for mobility, that in some cases were at 09:00 pm. In the diagram of Athalassis Avenue (purple bar), the change in traffic between the years is observed. The two peaks that appear during the day for the P2/2019 period are transformed into one for 2020. The decrease in the number of cars throughout the day is evident for both avenues. This is probably because during the lockdown, most people now worked via tele-work, thus reducing traffic during the busy hours. During the lockdown, where mobility was limited to one movement per day, modified peak hours, which now appear to be the noon and afternoon where people commute mainly for basic shopping or exercise. Furthermore, in Figure 6, we observe that the CO (blue line) for 2019 has two peaks during the day except for Wednesday where it shows an additional peak at 02:00 pm. This is probably because many stores close on Wednesdays earlier. The PM10 (green line) follows a similar trend with CO, which also shows two peaks during the day with the second peak in 2020 being much weaker.
4.2. Air Quality Limit
The NO2 and CO concentrations measured at the AURA station during the study period for 2018, 2019 and 2020 are below the Air Quality Standards which are set by the European Union Directive on Air Quality 2008/50/EC, as 8.9 ppm for CO (eight-hour rolling average), and 105 ppb for NO2 (hourly value). Exceedances of the daily value of 50 μg/m3 for PM10 are quite common in the area due to the regular Desert Dust Storms and the resulting transboundary transport of suspended particulate matter. For the study period of 2018, there were 27 daily exceedances, for 2019, there were 4 daily exceedances while, in the corresponding period of 2020, they amounted 8 daily exceedances over a period of 115 days. Table 4 summarizes the numbers of daily exceedances for the three years per period.
4.3. The Pollutant Concentrations in Urban and Rural Background Areas
In this section, we investigate the behaviour of the pollutant concentration under different anthropogenic forcing activity.
The originality of this study is that it compares the data of three different kinds of stations (urban, suburban, and rural-background station) that is rarely found in studies which are analysing the effect of the lockdown. Figure 7 presents the daily average values of the three stations AURA (suburban), NicTr (urban traffic) and AGM (rural background) stations while Table 5 presents the average values of the 3 pollutants at each station per year. By using data from 3 different types of AQMSs, we can assess the scale of influence of the lockdown measures on the urban air quality. The concentrations of NO2 in 2018 and 2019 for the AGM station are lower compared to the AURA as expected due to the absence of anthropogenic activity, while those of NicTr station are higher as they have a direct influence from the traffic load of the city. In 2020, a different behaviour is observed in the NO2 concentrations. Initially the concentrations of the NicTr are higher in relation to the AURA station, while then the AURA and NicTr stations show two peaks. The corresponding peaks are not observed in AGM concentrations. Therefore, it is concluded that the increases in NO2 concentrations are attributed to urban-scale influences with the AURA and NicTr stations being more affected than that of the AGM station.
The CO concentrations for 2019 are at the same levels for the AURA and the NicTr stations, while for P2b/2020, there is an absence of the values of AGM station concentrations (due to technical malfunctioning) which, unfortunately, does not allow the corresponding comparison of values. Similar lack of measurements (due to technical issues) occurred for the AURA station in 2018, thus not allowing the corresponding comparison. For the PM10 in 2018, we observe that the corresponding peaks of the study periods at the urban stations appear also at the AGM station, which confirms that these are due to dust episodes from transboundary transport. The PM10 concentration levels in 2019 at the AURA station show that they are very close to those of AGM since, as a suburban station, it is not burdened to a large extent by the traffic load of the urban centre of the capital, while on the contrary, the NicTr station shows higher concentration values than those of the background. It is noteworthy that in 2020 the concentrations of PM10 at the NicTr station are quite close to the AURA and AGM concentration values, indicating that the absence of anthropogenic pollution originating from vehicles can improve the concentrations of PM10 by reducing them in urban areas to those observed at the background-rural station.
The boxplots presented in Figure 8 summarize the concentration measurements recorded at the 3 stations for 2018, 2019 and 2020 for each pollutant separately, for all study periods. The median value is represented by the line inside the rectangle, while the 25% and 75% percentiles are the upper and lower sides of the rectangle and represent the middle of the lower and upper half of the data, respectively; the extreme values are displayed with a grey cross.
A comparison between the suburban, AURA station, with the measurements from the other two stations (background and urban-traffic representative) shows that the values in 2020 are higher compared to those of 2018 and 2019 for NO2, while, for the PM10, they are higher compared to 2019 but lower compared to 2018; the latter is due to larger number of dust episodes in the year. On the contrary, at the NicTr station, where the influence from the roads is significantly greater in the recorded measurements, a decrease in the values of pollutants is observed in relation to those of 2018 and 2019 for all three pollutants.
For the sake of completeness, we also present the corresponding results of the available data of the PM2.5 concentrations at the three different stations for the 2020. Figure 9a presents the PM2.5 hourly concentrations at the 3 AQMS stations. What is observed is that the PM2.5 concentrations in urban areas coincide with the measurements of the background concentrations, which is expected due to the significant decrease of the anthropogenic activity during the lockdown period. In addition, Figure 9b PM2.5 illustrates a gradual decrease of the daily averaged values, while at the end of the study period, the corresponding peak of DDS pollution is observed. Figure 9a,b seems to follow the same trend with PM10 of 2020 (Figure 4c and Figure 7c). The hourly PM2.5 boxplots for the three stations confirm this concentration coincidence, with the mean concentration in Nicosia city to be equal to 10 μg/m3.
4.4. Meteorological Conditions
Meteorology plays an important role in the concentration and dispersion of air pollution. Some of the studies during lockdown periods include the parameter of meteorology in their results [13,14,16,18,19,37,38]. In this study, the analysis of meteorological data also plays an important part, as it combines it with pollutant concentrations data for the period before, during and after the lockdown, in order to extract results on the origins of high concentrations. Table 6 records the average values of the most important meteorological parameters as described in the earlier section for the study periods in 2018, 2019 and 2020 using only the available data of the suburban AURA station in Nicosia. Figure 10 shows the time variation of some of these meteorological parameters for the study periods in the years of 2018, 2019 and 2020. In Figure 10c, the temperature and solar radiation for 2020 increase gradually while the humidity decreases as the summer season approaches. At the end of the P2c/2020 and the beginning of the P3/2020, there is a period from 16 to 20 May 20 where high temperatures, solar radiation and low humidity coexist. As mentioned before, on the same dates, there is an increase in concentrations in the values of NO2 which is prone to photochemistry. Rainfall is minimal for the P1/2020, P2a/2020, P2b/2020 and zero for the other two. This result is consistent with the meteorological conditions prevailing in the area [22,30]. According to the results of Table 6, there is no significant difference in the dynamics of the atmosphere between the three years, thus recording similar meteorological conditions. It is important to note that the presence of high values of solar radiation plays an important role in photochemistry where NO2 is prone, while due to low rainfall values, the deposition of suspended particles from the rain is minimal, thus affecting PM10 concentrations. Additional information about the meteorological data for the study period of 2020 can be found in Appendix A.
In order to investigate the association of the resulting air pollution with the meteorological conditions, pollution roses were used, as this type of approach can be useful in extracting information about how wind directions may dominate the total concentrations, as demonstrated by R. Henry et al. [42]. The same technique was used in a similar study on the effect of the COVID-19 lockdown in Northern England, UK [13,22].
The high concentrations for CO and NO2 in the study periods of 2018 and 2019 are associated with Westerly (W) and North-Westerly (NW) winds, while the PM10 concentrations are associated mainly with North-Easterly (NE) winds (in 2019) and with all directions except South (S) and South-Easterly (SE) in 2018, according to Figure 11a,b. On the other hand, in 2020, during which the influence from the road traffic load is reduced due to mobility restrictions, the pollution roses of Figure 11c show a correlation of high concentrations with NE and W winds for NO2 and PM10, while the CO concentrations are associated with NE and SW winds. It is important to consider that near the AURA station area, the road network in the W and NW directions is being further developed while, in the NE direction, the area consists of rural areas, a buffer zone of no-mobility permit due to the current political situation on the island, while at a distance of 7 Km, the airport (Tymbos) of the illegally occupied area by the Turkish army in the north of the island is operating.
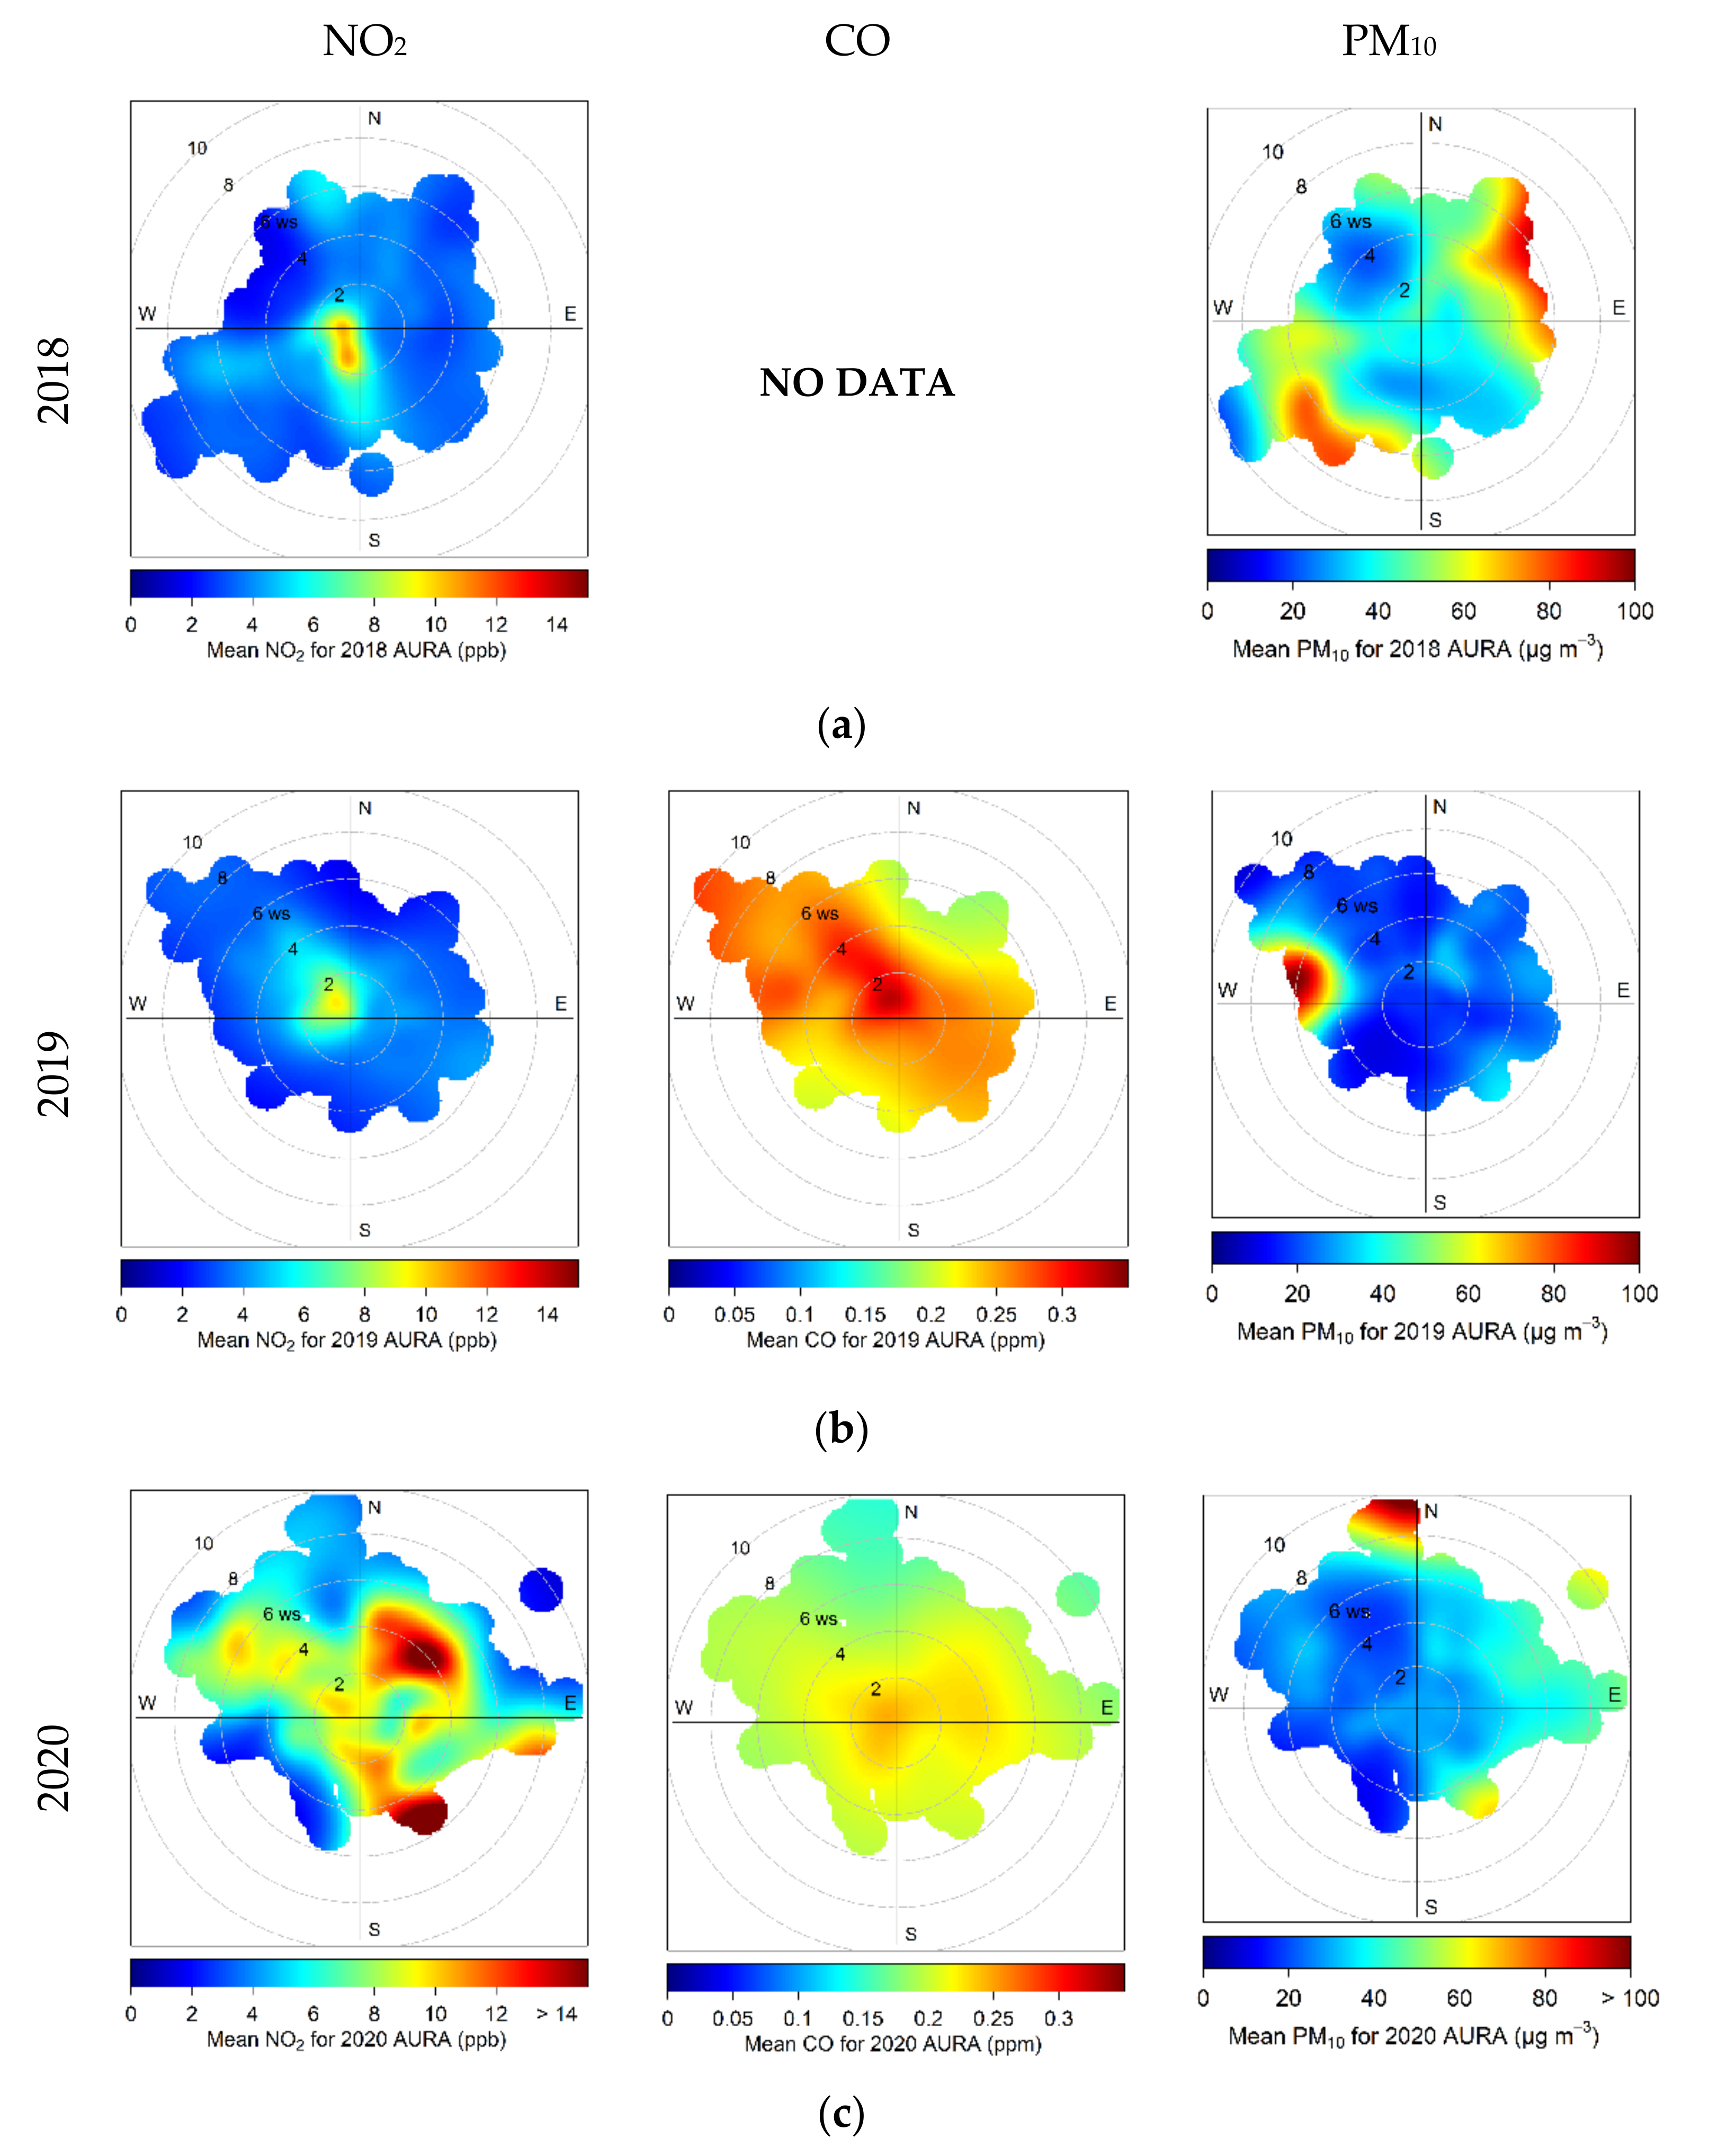
Figure 12 shows the bivariable polar plots of the pollutant concentrations at the AURA station during the lockdown periods for the years of (a) 2018, (b) 2019 and (c) 2020. As mentioned above, the lack of CO values in 2018 is significant, so the corresponding plots cannot be presented. In Figure 12, for NO2 in 2018 and 2019 and for CO in 2019, high concentrations are associated with W, NW, and SW winds of low intensity, of 0–2 m/s, as is the case of before lockdown subperiod. Bivariable polar plots for the subperiod before the lockdown as well as for the whole study periods are presented in Appendix A, for the sake of completeness. Remarkable are the results for 2020 during the lockdown period, in which the correlation of high concentrations with different directions and wind intensities is clearly shown. High NO2 concentrations appear mainly when prevailing winds are E and NE, of intensity greater than 2 m/s, while the concentrations from the NW, in the same direction as the main road network of Nicosia is located, are lower. High concentrations of CO appear to be associated with all directions of low and high winds. While PM10 concentrations in 2019 exhibited high values in the presence of strong W winds, in 2020 the high concentrations are associated with NE directions, with an intensity greater than 4 m/s.
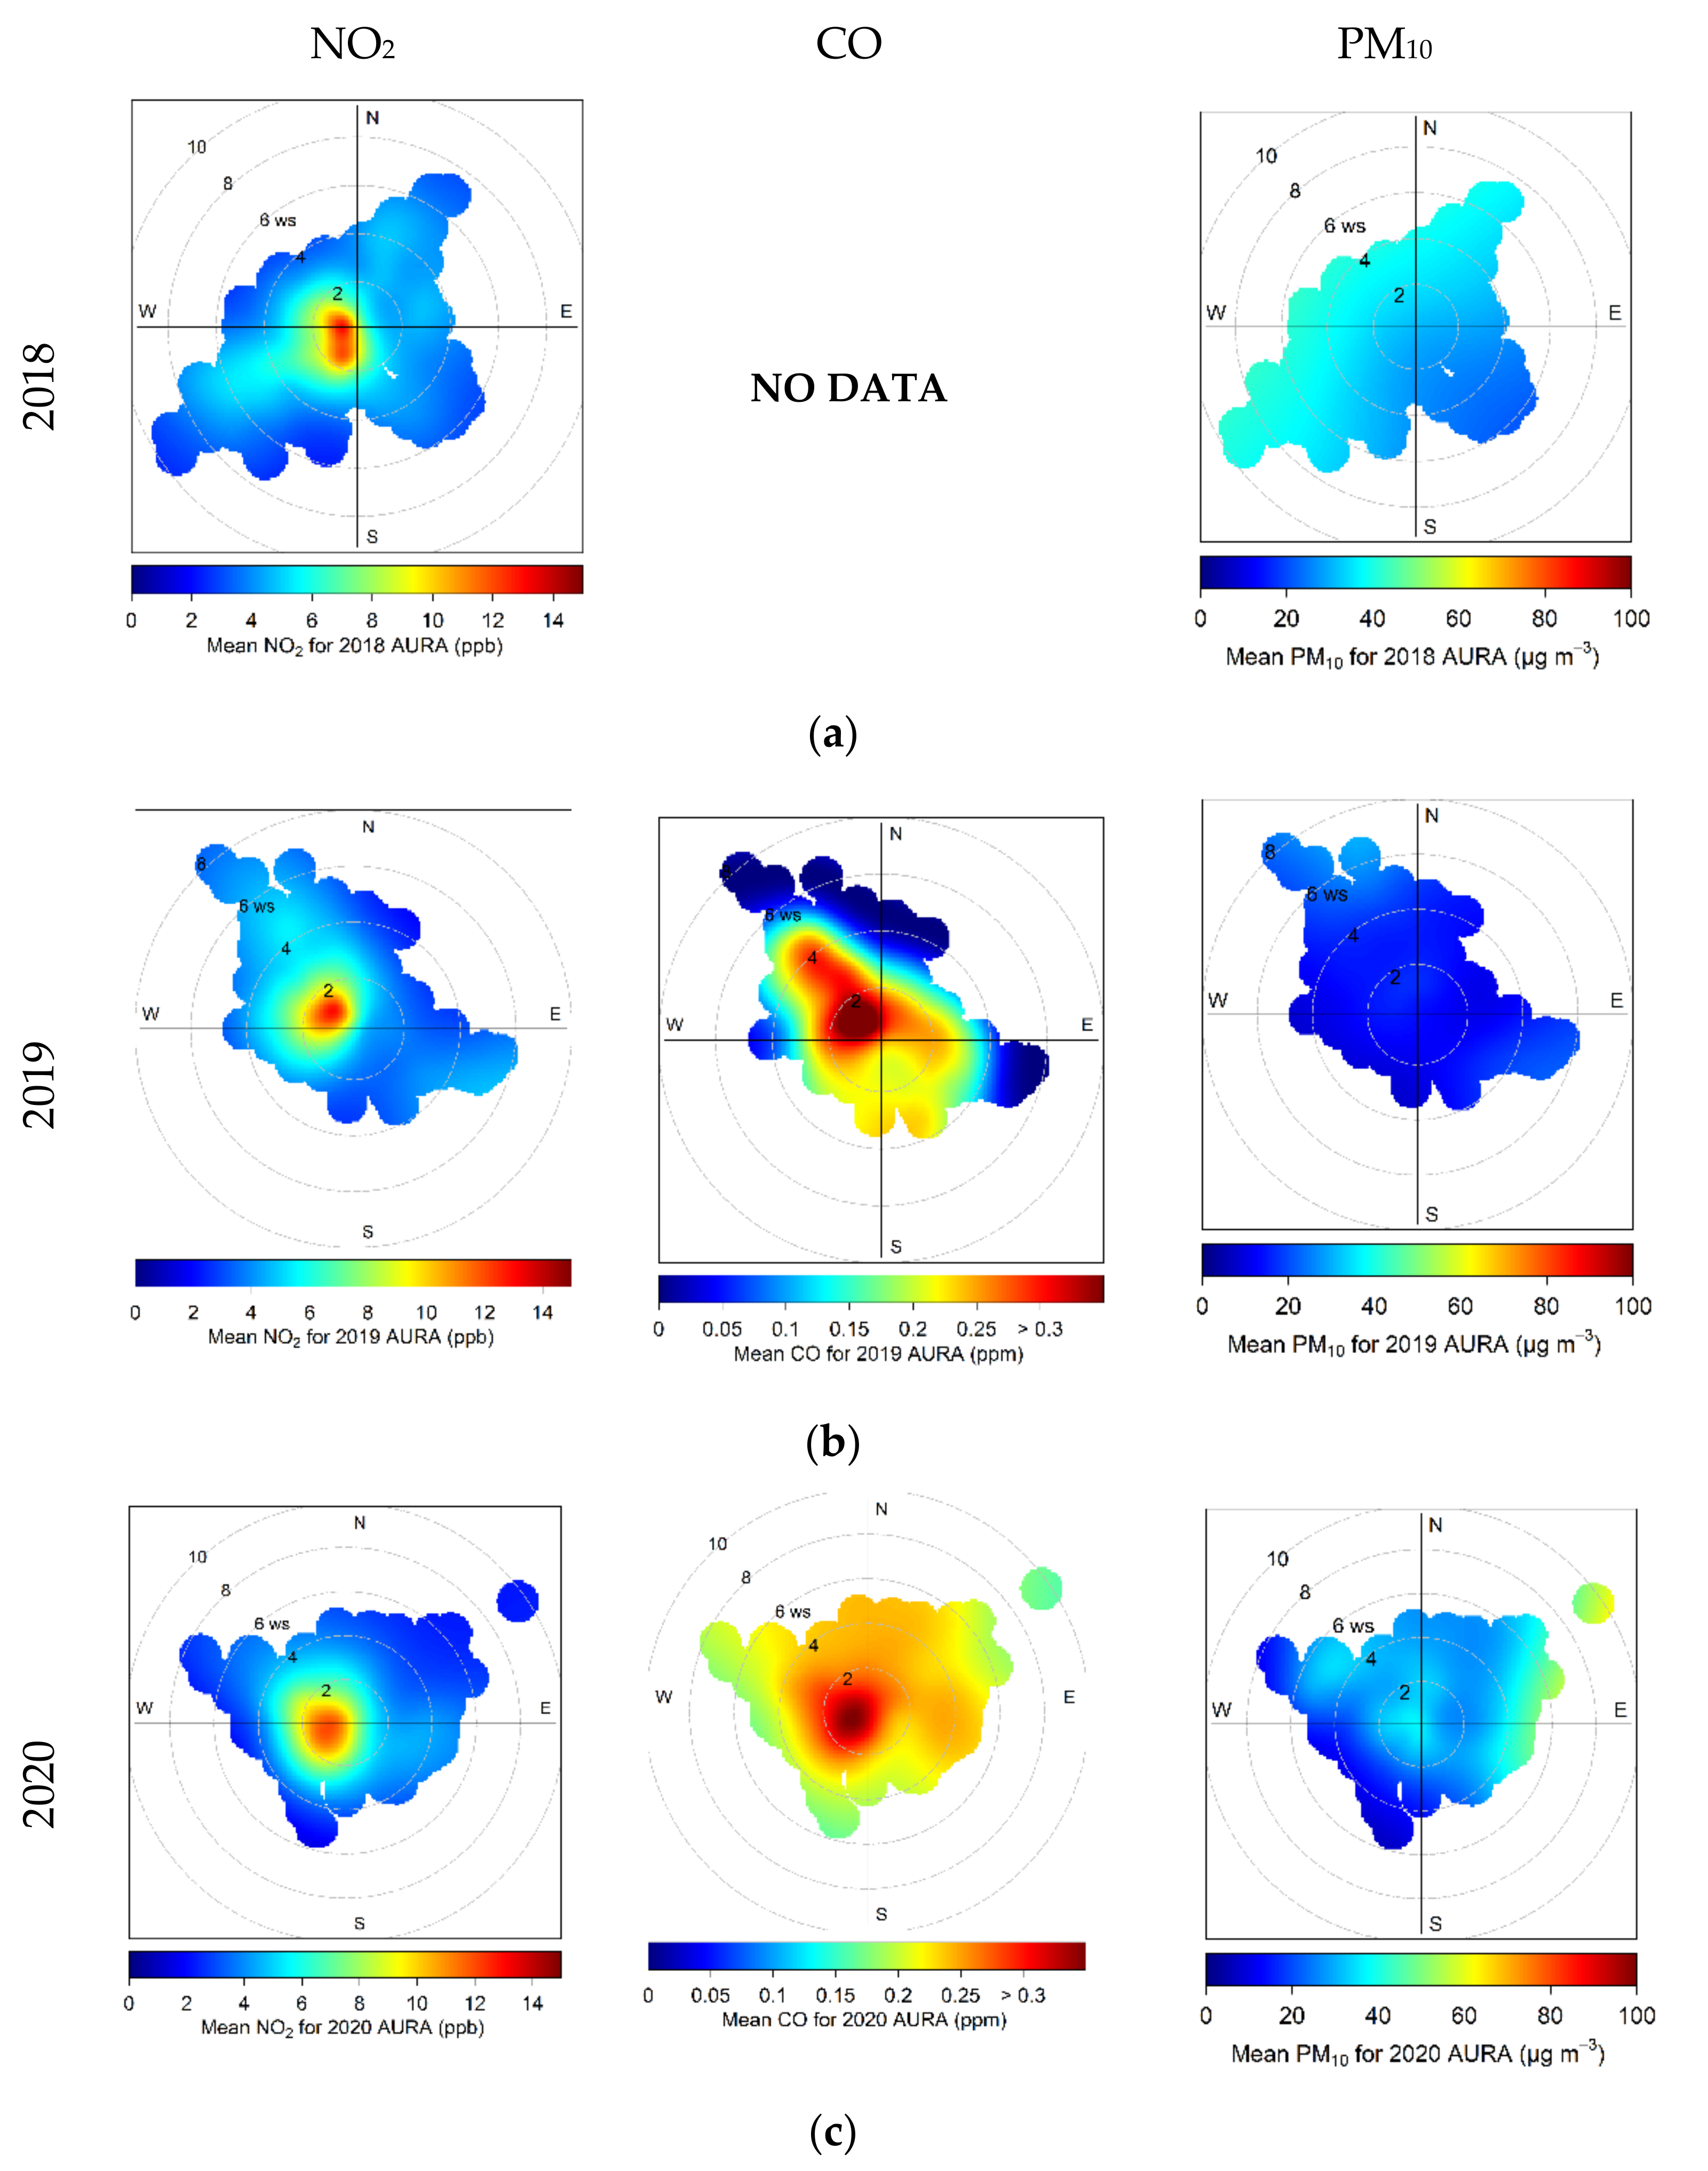
Figure 13 shows bivariate polar plots weighted by the mean value of the concentration. Specifically, in these plots, the average value is calculated and multiplied by the frequency and divided by the total frequency. Such plots can be useful to show the wind speed and direction conditions that dominate the overall average. The same technique was used in a recent study about COVID-19 by Cuiin S. et al., [43] in the case of Qingdao in North-Eastern China. The plots in Figure 13 confirm that the main source of pollutants in the area is from the W and NW where the road network of the area is developed. In addition, during the period of the traffic ban, high concentrations appear for all three pollutants when NE winds of 2–6 m/s prevail. Unfortunately, in the north and east directions of the AURA station, the area is not controlled by the Official Authorities of Cyprus Republic, and it is not possible to point out or distinguish possible emission sources coming from NE. According to D.C. Carslaw et al. [44], long-term average NO2 concentrations can be affected in areas close to an airport. It is of interest to check whether such observations may be shown to similarly hold for this area and its influences from activities in the NE area.
4.5. Investigation of Air Pollution Origin
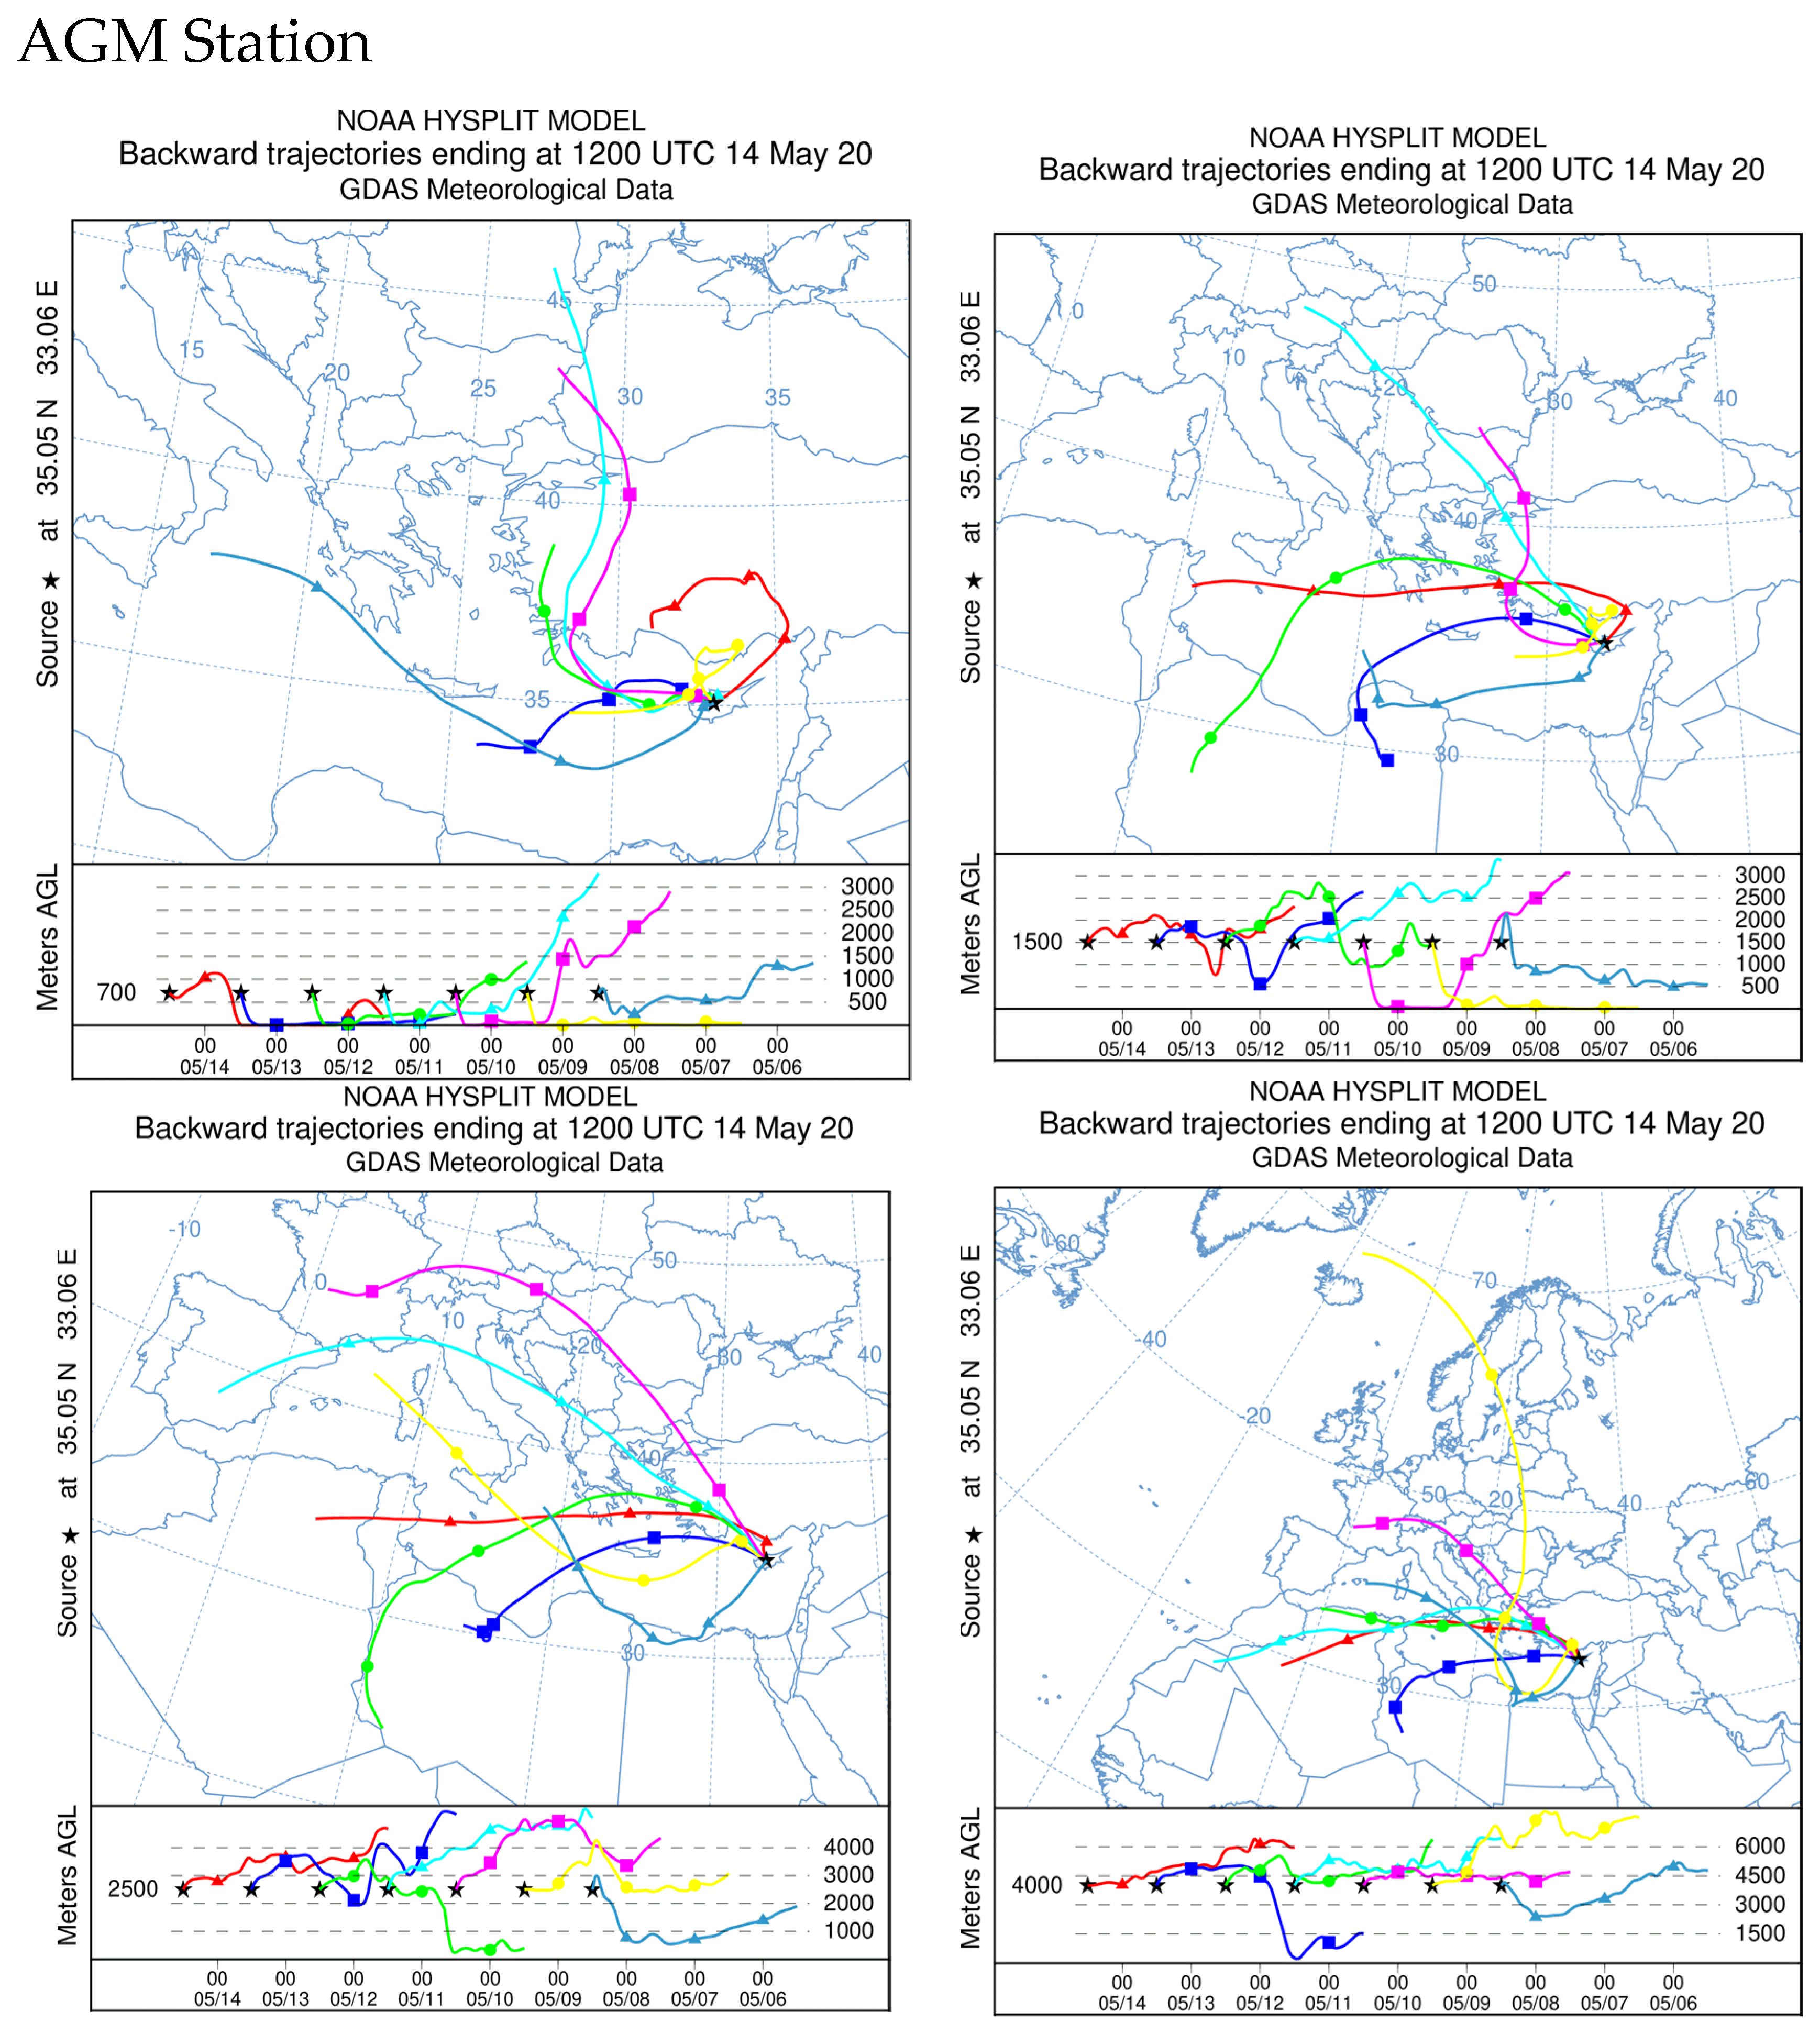
During the study period, some high concentration in NO2 and PM10 at the AURA station are observed. In this section, an attempt is made to identify the sources of high concentrations. CO concentrations are not present since no high concentrations were observed during the study period.
The HYSPLIT model was used to investigate the origin of pollutants concentrations. This model is frequently used—recently, it was used in the case study of Sale city in Morocco [9]. The model in our case was mainly used to investigate the periods of peak NO2 concentrations related to other regions. The model was used for the area of the AURA station and the background station AGM. The results for the week, where the first NO2 peak concentrations appeared from 06/05 to 14/05 of 2020, are presented in Figure 14. The back trajectories were calculated for 72 h before, at 12:00 (UTC) for the altitudes of 700, 1500, 2500 and 4000 m. Note that both stations, AURA and AGM, displayed the same back trajectory pattern which means that both stations are affected by the same air masses. The same holds true for the back trajectories of the next two weeks. Nevertheless, the station AURA shows unusually high concentrations while, on the contrary, the AGM station does not show the corresponding peaks. It is concluded that the high concentrations that occur around the AURA station are due to a local influence.
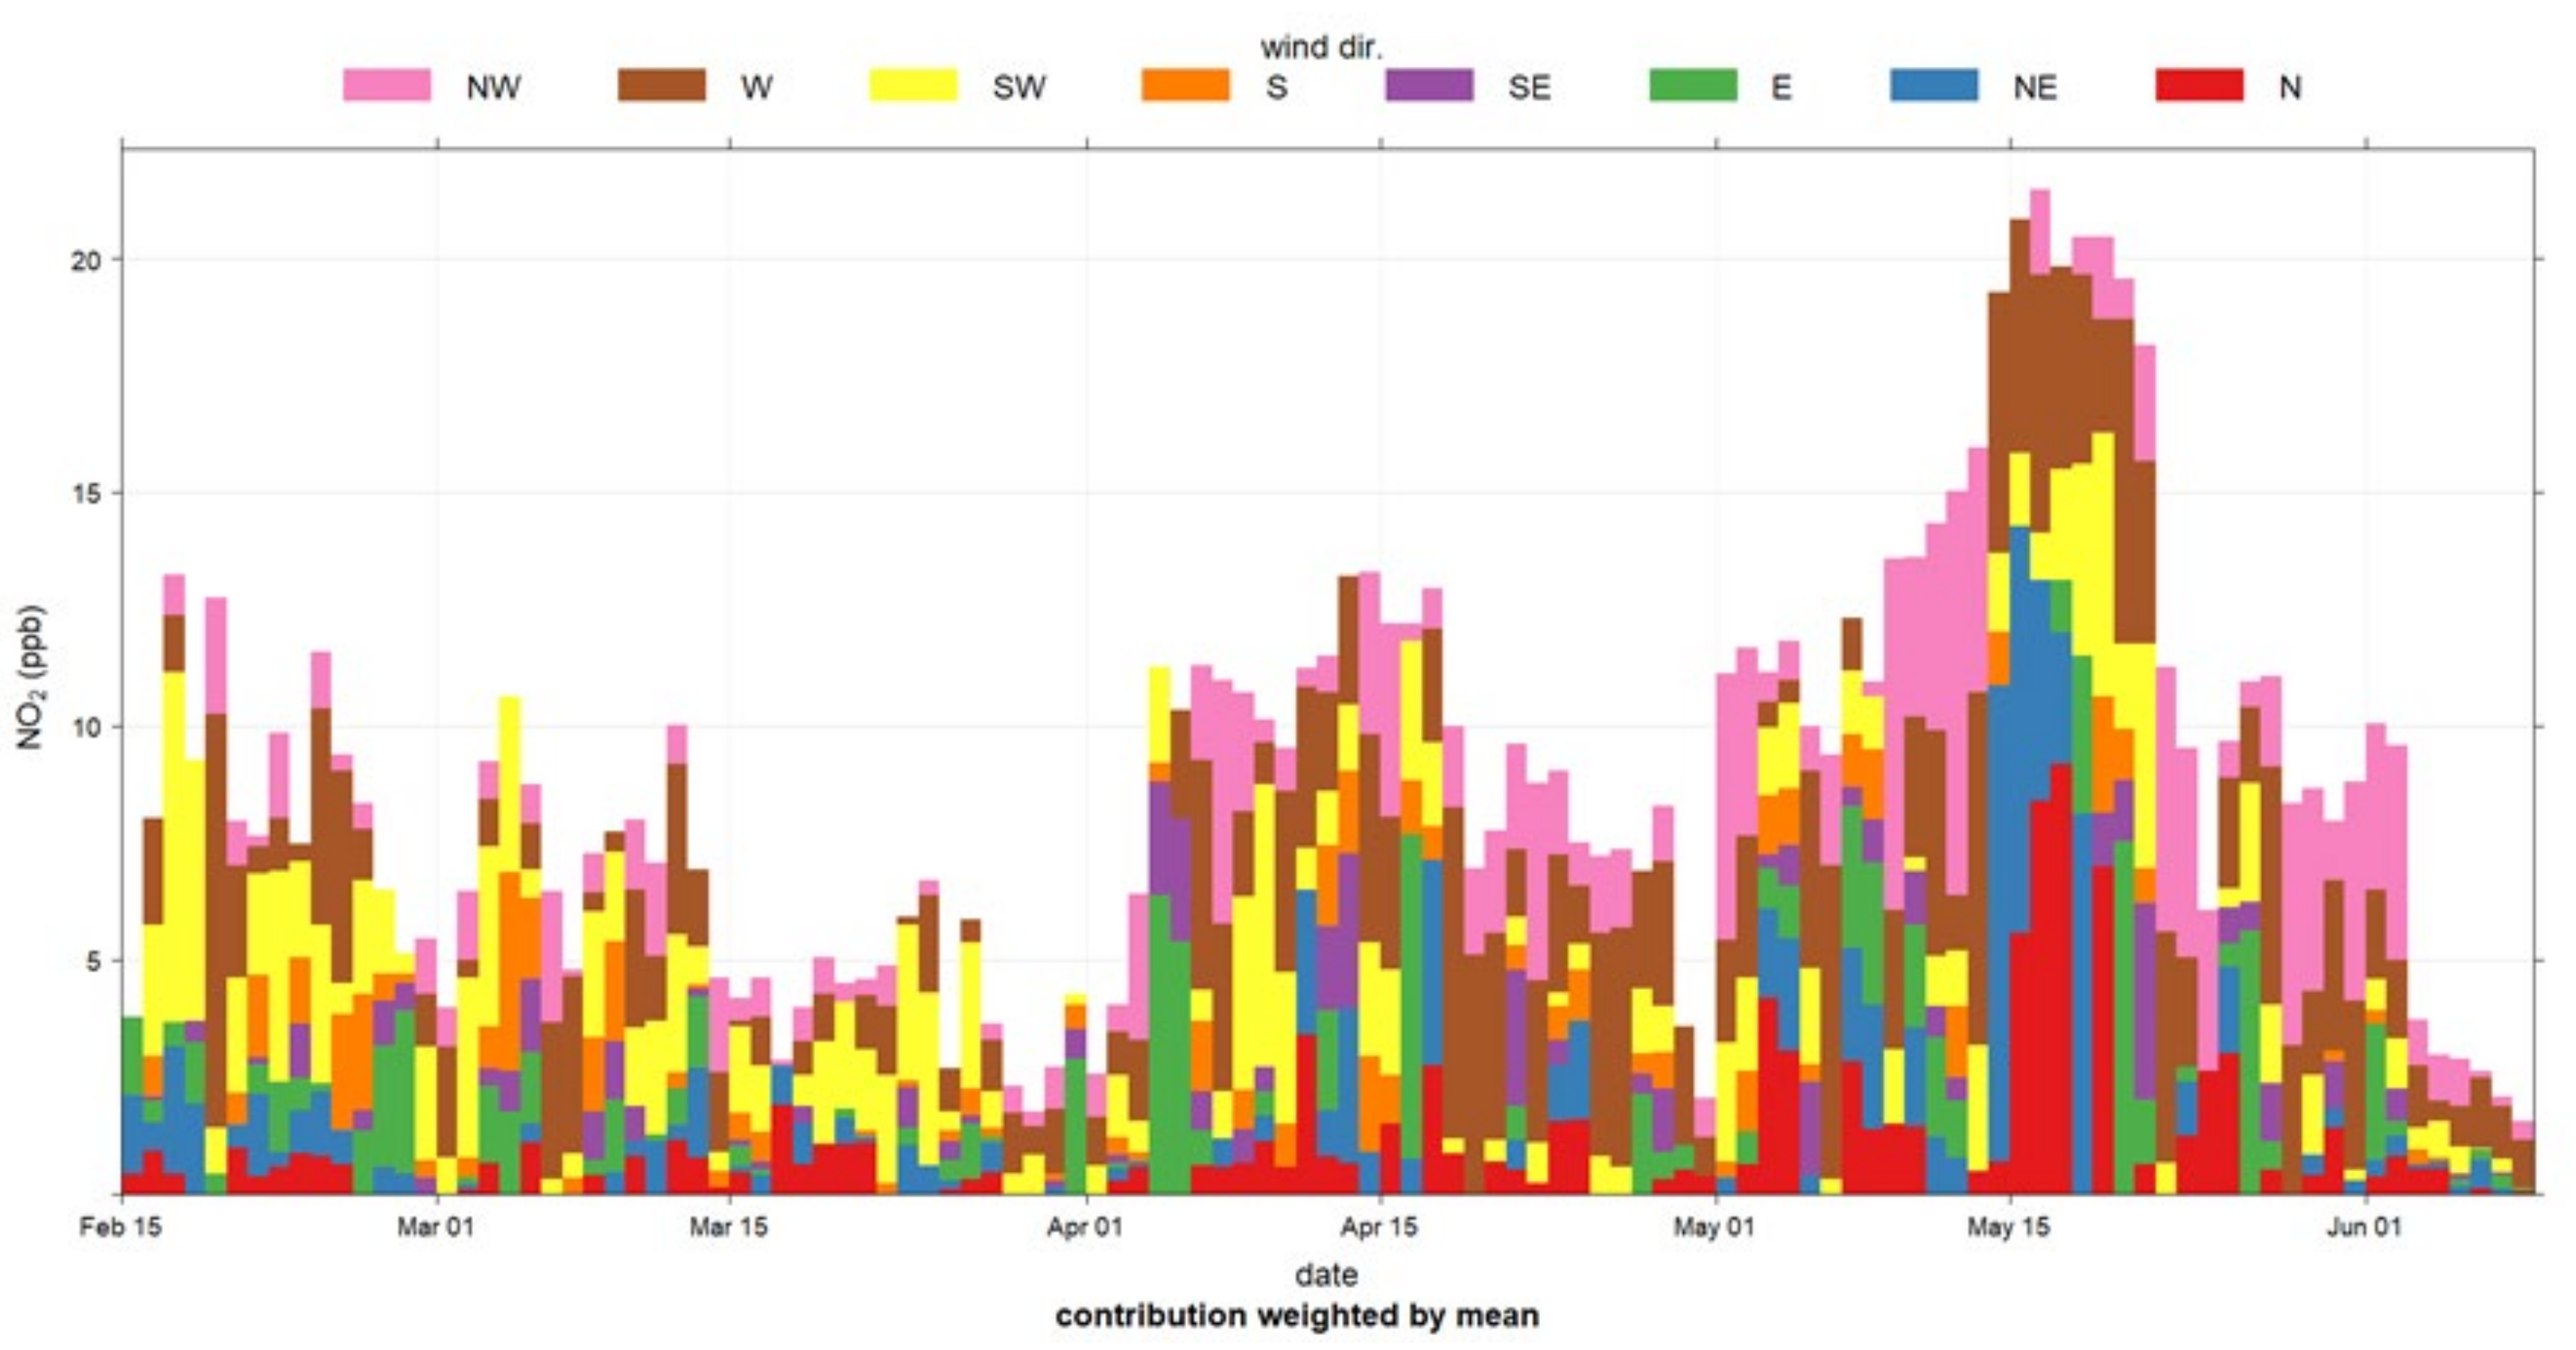
In addition, Figure 15 presents the NO2 concentrations time series as stacked bar charts providing some further insights into the time series data. For a certain period, NO2 concentrations are displayed as a stacked bar chart and the various categories in the bar chart consist of the wind direction. The average period was defined as 1 day, and therefore, the average concentration is plotted according to the ratio of the contribution from the wind. In the Figure 15, the highest concentrations of NO2 are dominated by NW winds where the road network is located, while during the second peak, the winds from the NW and NE have a significant contribution.
Further to the high concentrations associated with the near-by airport emissions (located at the NE of the AURA station), NO2 is also prone to photochemistry. Its importance in ozone photochemistry may also affect the concentrations of NO2. As seen in Section 4.4, the period where the high concentrations of NO2 occur, meteorological conditions are characterized by high temperatures and high solar radiation, and low humidity. These meteorological conditions affect the photochemical cycle of NO2 and the reaction with ozone and consequently their concentrations [45,46]. According to the annual technical report of 2018 [26], the Air Quality and Strategic Planning Section regulatory authority of air quality in Cyprus found that the oxidants levels in the suburban areas, such as the AURA station area, are often higher because oxidants are not directly emitted but take some time to form, so the precursors (e.g., NO, NO2, VOCs) have time to be transported through the prevailing winds. The absence of O3 data and information of pollution from the NE part of the area has not allowed for more conclusive findings. A more detailed study for the high concentrations of ozone is required, which are, nevertheless, not available at the AURA station.
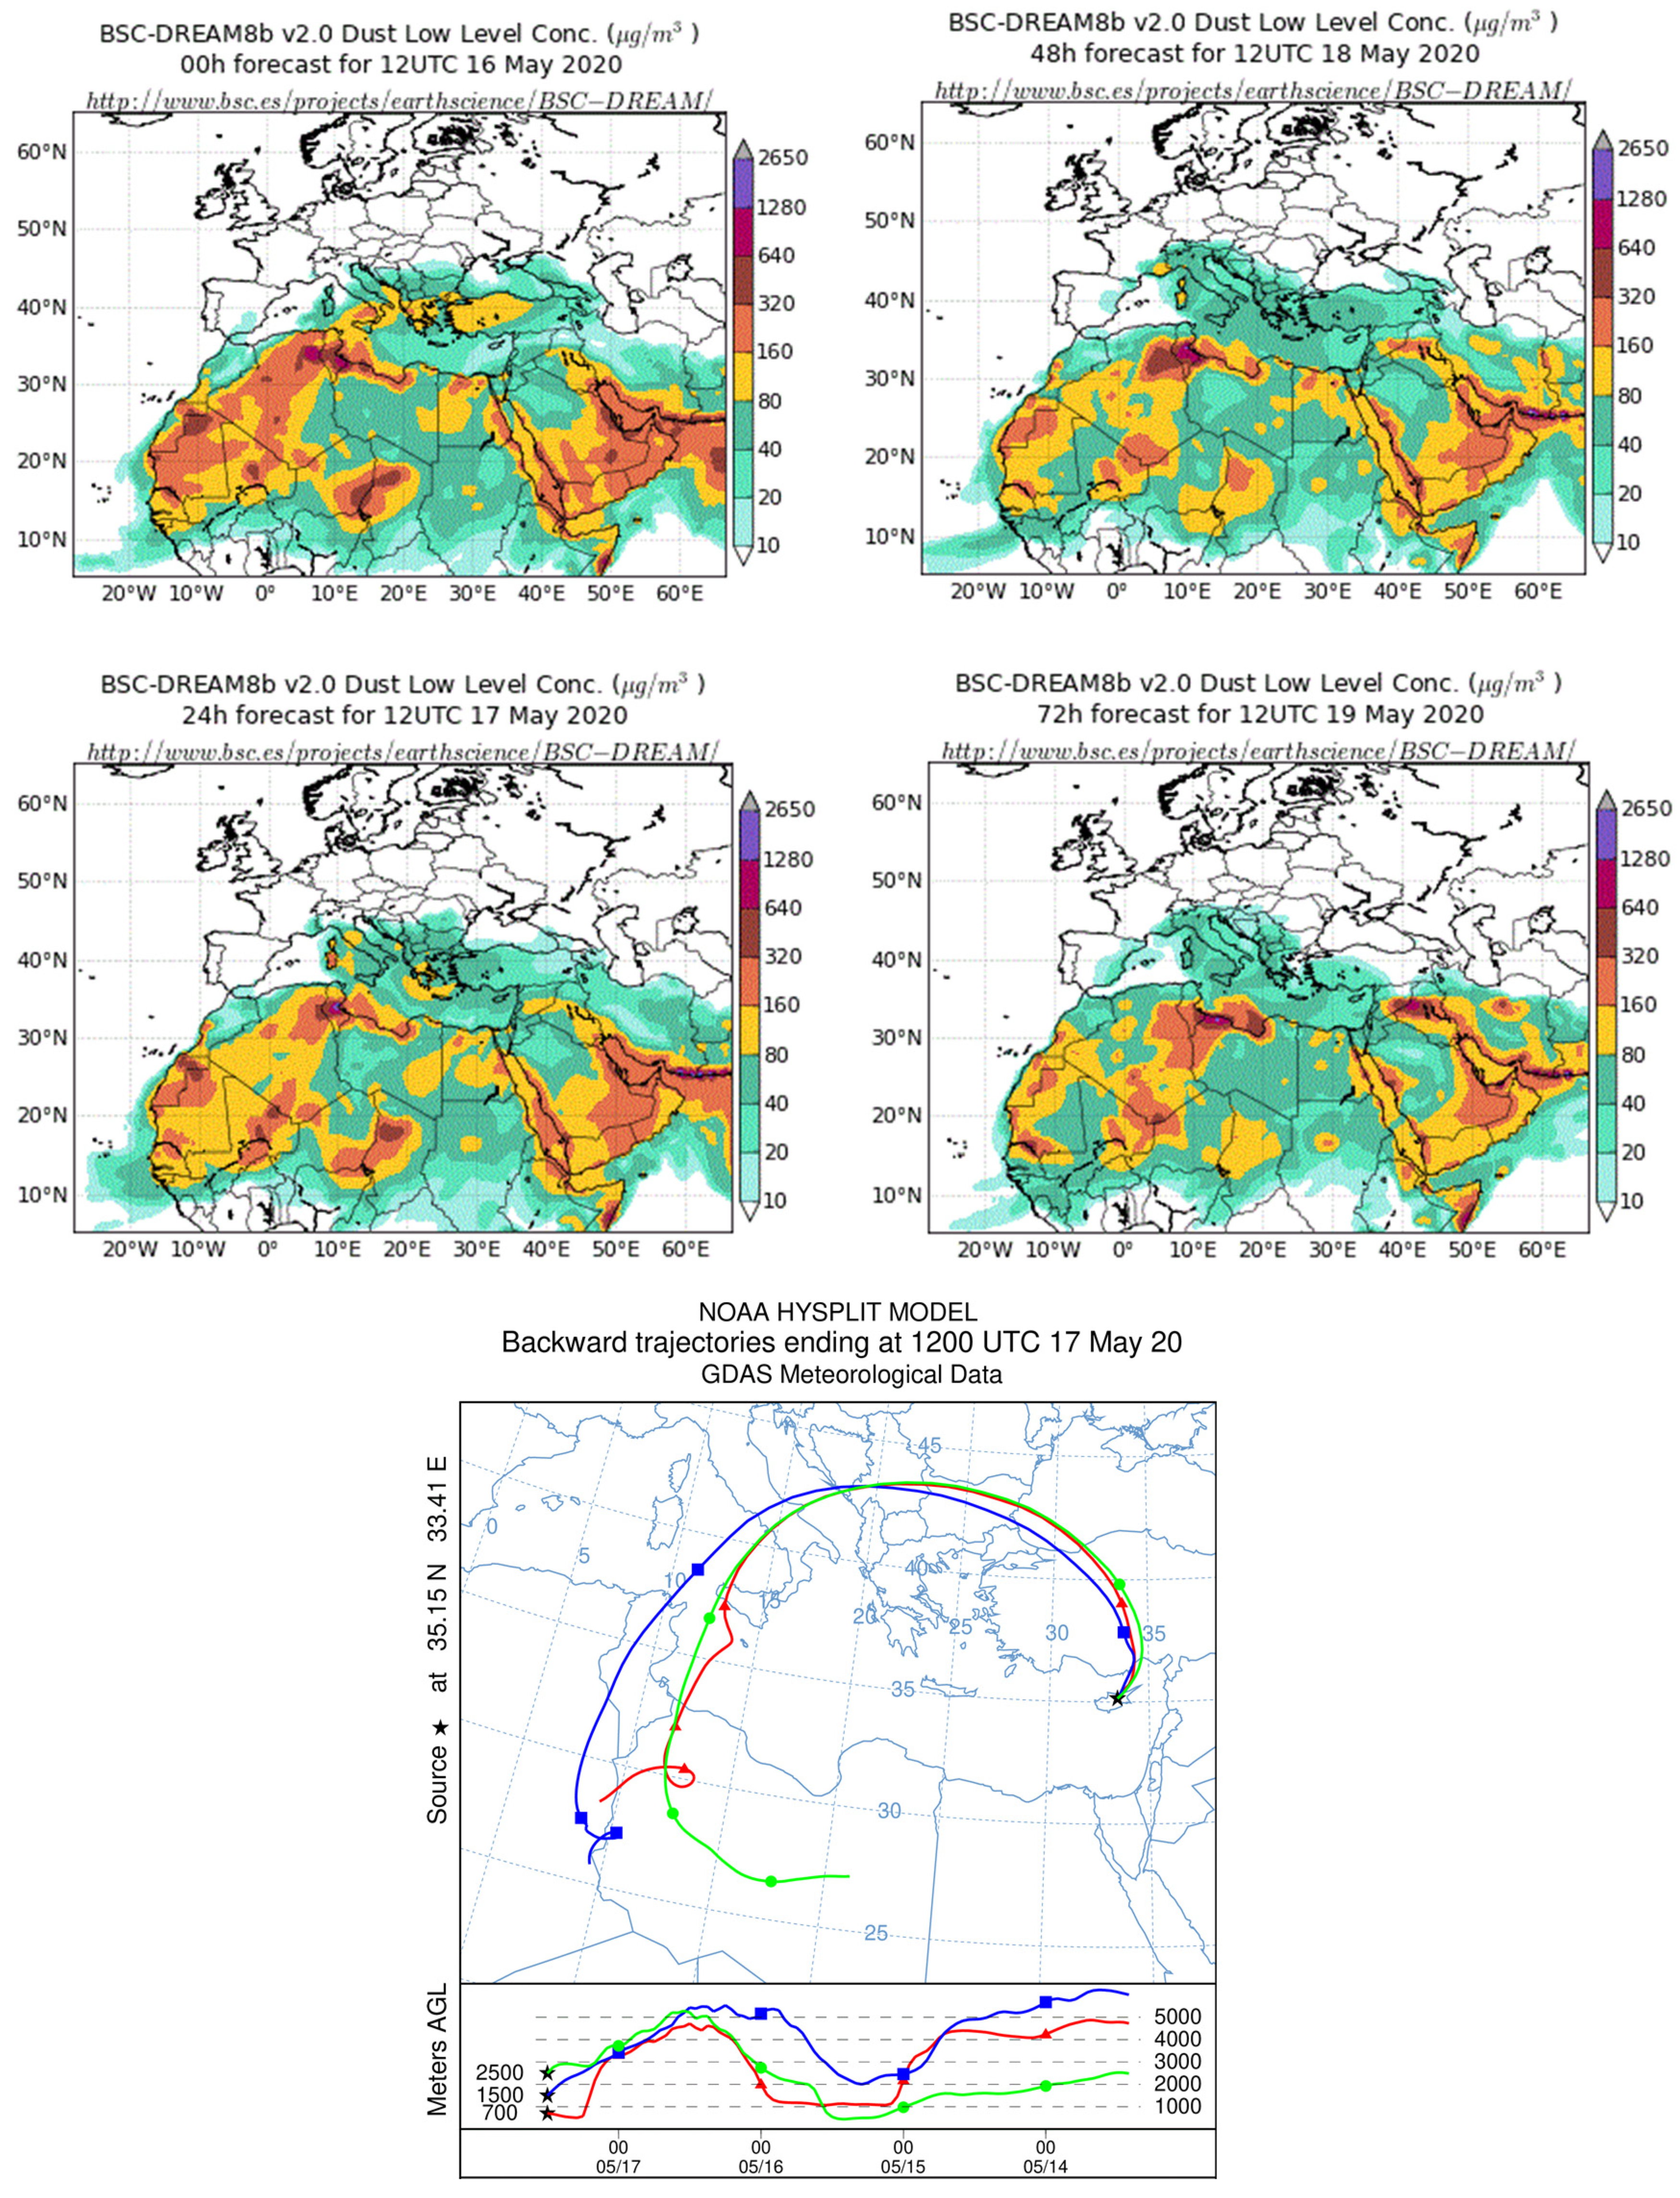
The BSC-DREAM8b model [47] was used to study the peaks of PM10. It offers archived daily data with a 10 × 10 km2 spatial resolution [48] and is online available. Data of this regional model are often used in studies in Northern Africa, Middle East, and Europe. The BSC-DREAM8b model forecasting for the dates showing high PM10 concentration values are shown in Figure 16. According to the forecast from 16 May to 21 May 2020 (end of P2c/2020), the high concentrations of PM10 are attributed due to a transboundary DDS from the Sahara Desert that affects the area. Respectively, the maximums of PM10 for the study period of 2018 and P3/2019 were studied where they showed that the cause of the high concentrations are the DDS which come either from the Sahara Desert or from the Arabian Peninsula.
5. Conclusions
The COVID-19 lockdown provided an opportunity to investigate the impact of reduced mobility on air quality in the city of Nicosia. The results showed that the reduction of traffic in two main busy streets in Nicosia during the COVID-19 pandemic lockdown reached up to 64.3% and 66.4%. By investigating three main pollutants, CO, NO2 and PM10 and their association with the road traffic and meteorological conditions, the results show that the traffic is influencing substantially the local pollution while transboundary dust influences areas within its pathways significantly as well.
The results from different Air Quality Monitoring Stations indicate that the decrease in traffic has a direct impact on the pollutants concentration by decreasing them, although for the AURA station (the urban representative), the NO2 concentration has exhibited some unexpected increase during the study period due to pollution arising from an unidentified source, mainly from the NE. A working hypothesis that can be made, concerns the operation of the airport (Tymbos) located in the illegally occupied area by the Turkish army at the north of the island, at a distance of 7 Km from the station. However, to investigate further this hypothesis, a future study is required due to the objective difficulties that currently exist.
Furthermore, transboundary pollution has influenced the area as shown from PM10 measurements, model data and back-trajectories indicating the vulnerability of areas in DDS pathways. Through the measurements and the results of the PM analysis, it is concluded that both urban and suburban as well as rural areas are greatly affected by the transboundary suspended particulate pollution, in contrast with CO and NO2 pollution which is mainly affected by local sources such as traffic.
Limitations due to the absence of parameters, such as O3, PM2.5 concentrations and meteorological parameters of other stations other than the AURA station, are important in finding more conclusive results and can be used in future studies under similar conditions.
In conclusion, even though the lockdown period is considered a short-term period with low impact on the global scale of influence, it is important to note that the reduction in anthropogenic activities has a significant effect in reducing the concentrations of pollutants at the urban scale. A corresponding policy to reduce anthropogenic pollution in the long run can have a global positive impact. The impact of emission reductions on pollutant concentrations could be exploited by the competent authorities when designing future strategic decisions to ensure air quality. The unique situation of lockdown can be addressed as a “living lab” to understand the effects of reducing pollution sources such as traffic on local air quality. Future strategies could achieve similar improvements but further studies of chemical pathways for secondary pollutants are required.
Author Contributions
P.M. and M.K.-A.N. conceptualized this study; G.A., P.M. and M.K.-A.N. developed the methodology; A.E. conducted and collected the data, G.A. conducted the data analysis supported by P.M.; G.A. wrote the original draft; M.K.-A.N. supervised the study. All authors have read and agreed to the published version of the manuscript.
Funding
This work was supported by the Research and Innovation Foundation (RIF) of Cyprus within the framework of the Isles of Excellence Program under the Grant Agreement No. EXCEL- LENCE/1216/0294.
Institutional Review Board Statement
Not applicable.
Informed Consent Statement
Not applicable.
Data Availability Statement
The data that support the findings of this study are available from the corresponding author upon reasonable request.
Acknowledgments
The authors wish to acknowledge the Department of Labour Inspection, Air Quality, and Strategic Planning and the Department of Public Works of the Ministry of Communications and Works of the Republic of Cyprus for providing access to Air Quality and Traffic Load datasets. This work was supported by the research grant on Isles of Excellence Grant Agreement No. EXCEL- LENCE/1216/0294.
Conflicts of Interest
The authors declare no conflict of interest.
Appendix A
As it is shown in Figure A1, the most frequently observed values of ambient temperature and relative humidity during the lockdown period are 15 °C and 80%, respectively. Accordingly, the frequently observed values of wind speeds are 1–1.5 m/s while the frequently observed wind direction is 280–300 degrees (NW-W).
Figure A1.
Charts with the frequency of values for the most important meteorological parameters of the city for the study period of 2020.
Figure A1.
Charts with the frequency of values for the most important meteorological parameters of the city for the study period of 2020.

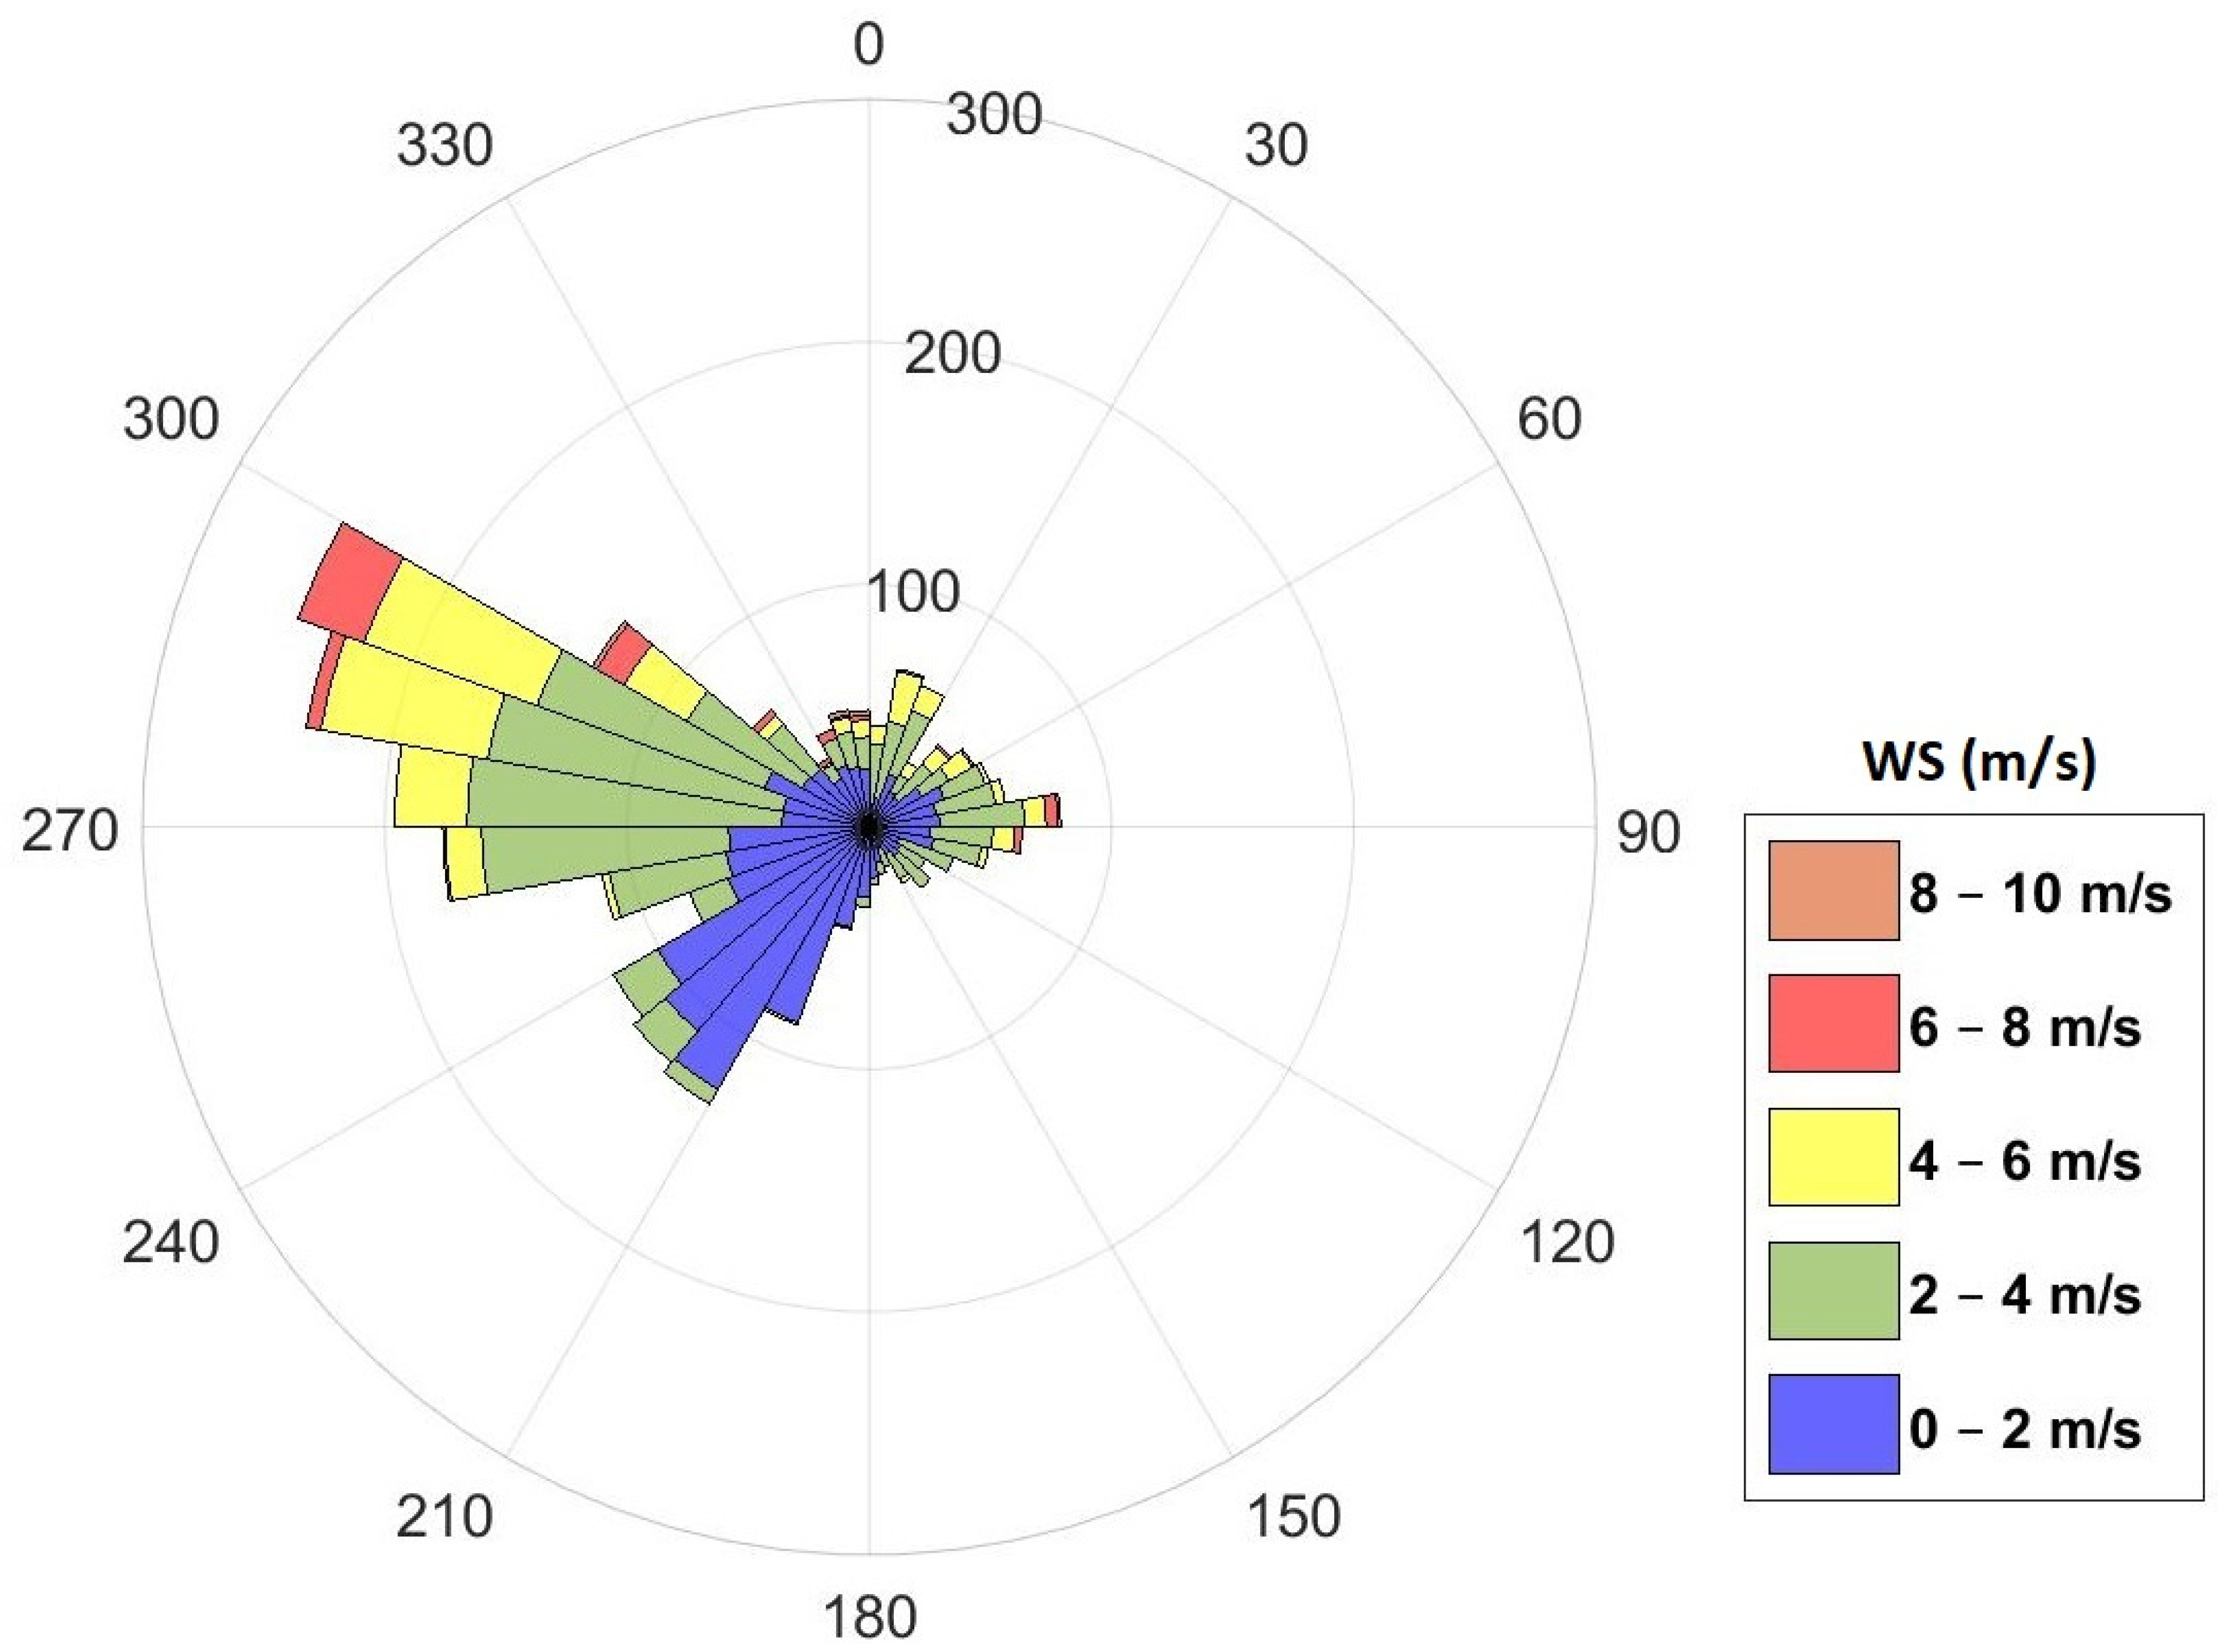
Figure A2 depicts the wind rose of the AURA station, a graphical representation of how wind speed and direction are distributed in the area, for the total measurements of the study periods of 2020. From the total values, it is noticed that the NW-W wind has a higher frequency, 813 values out of 2760, while the predominant wind speed for this direction is the 2–4 m/s. In addition, the SW wind has been observed 546 times, with corresponding wind speed in the range of 0–2 m/s. It can also be observed that the E and NE-E winds exhibit a very low frequency of occurrence.
Figure A2.
The wind rose of the area for 2020 from the data of the AURA station.

Figure A3 shows the bivariable polar plots of the AURA station for all study periods for (a) 2018, (b) 2019 and (c) 2020, while Figure A4 shows the corresponding plots for P1 (15/2 to 14/3) period before lockdown, for the three years. As mentioned above, the lack of CO values in 2018 is large, so the corresponding plots are not presented. Focusing on Figure A4 and referring to the respective periods before the lockdown, we observe that high concentrations of NO2 are associated with W, NW, and SW winds of low intensity 0–2 m/s for all three years. CO is related to all wind directions mainly at low speeds, while at the same time, high concentrations occur when the wind is NW and with greater intensity. The high concentrations of PM10 for the three years show a correlation of the high concentrations with winds greater than 4 m/s. The above data seem to be in line with the long-term measurements conducted in the area.
Figure A3.
Bivariable polar plots for the three main pollutants NO2 (left column), CO (centre column) and PM10 (right column) of the AURA station for the (a) 2018, (b) 2019 and (c) 2020 study periods. Concentric circles record the wind speed, while the colour scale refers to the concentrations of pollutants.

Figure A4.
Respective bivariate polar plots for the three main pollutants NO2 (left column), CO (center column) and PM10 (right column) of the AURA station for (a) 2018, (b) 2019 and (c) 2020, for the periods before the lockdown.
Figure A4.
Respective bivariate polar plots for the three main pollutants NO2 (left column), CO (center column) and PM10 (right column) of the AURA station for (a) 2018, (b) 2019 and (c) 2020, for the periods before the lockdown.

References
- Lu, H.; Stratton, C.W.; Tang, Y.-W. Outbreak of pneumonia of unknown etiology in Wuhan, China: The mystery and the miracle. Wiley J. Med. Virol. 2020, 92, 401–402. [Google Scholar] [CrossRef] [Green Version]
- Chen, H.; Guo, J.; Wang, C.; Luo, F.; Yu, X.; Zhang, W.; Li, J.; Zhao, D.; Xu, D.; Gong, Q.; et al. Clinical characteristics and intrauterine vertical transmission potential of COVID-19 infection in nine pregnant women: A retrospective review of medical records. Lancet 2020, 395, 809–815. [Google Scholar] [CrossRef] [Green Version]
- Center for Systems Science and Engineering (CSSE) at Johns Hopkins University (JHU). Available online: https://coronavirus.jhu.edu/map.html (accessed on 10 January 2021).
- Kraemer, M.U.G.; Yang, C.-H.; Gutierrez, B.; Wu, C.-H.; Klein, B.; Pigott, D.M.; Plessis, L.; Faria, N.R.; Li, R.; Hanage, W.P.; et al. The effect of human mobility and control measures on the COVID-19 epidemic in China. Science 2020, 368, 493–497. [Google Scholar] [CrossRef] [PubMed] [Green Version]
- Cyprus Government Page about COVID-19. Available online: https://www.covid19.cy/ (accessed on 10 August 2021).
- Quattrocchi, A.; Mamais, I.; Tsioutis, C.; Christaki, E.; Constantinou, C.; Koliou, M.; Pana, Z.D.; Silvestros, V.; Theophanous, F.; Haralambous, C.; et al. Extensive Testing and Public Health Interventions for the Control of COVID-19 in the Republic of Cyprus between March and May 2020. J. Clin. Med. 2020, 9, 3598. [Google Scholar] [CrossRef] [PubMed]
- Ozili, P.K.; Arun, T. Spillover of COVID-19: Impact on the Global Economy. 2020. Available online: http://dx.doi.org/10.2139/ssrn.3562570 (accessed on 3 October 2021).
- Berman, J.D.; Ebisu, K. Changes in U.S. air pollution during the COVID-19 pandemic. Sci. Total Environ. 2020, 739, 139864. [Google Scholar] [CrossRef] [PubMed]
- Otmani, A.; Benchrif, A.; Tahri, M.; Bounakhla, M.; Chakir, M.; Bouch, M.; Krombi, M. Impact of Covid-19 lockdown on PM10, SO2 and NO2 concentrations in Salé City (Morocco). Sci. Total Environ. 2020, 735, 139541. [Google Scholar] [CrossRef]
- Venter, Z.S.; Aunan, K.; Chowdhury, S.; Lelieveld, J. COVID-19 lockdowns cause global air pollution declines. Proc. Natl. Acad. Sci. USA 2020, 117, 18984–18990. [Google Scholar] [CrossRef]
- Forster, P.M.; Forster, H.I.; Evans, M.J.; Gidden, M.J.; Jones, C.D.; Keller, C.A.; Lamboll, R.D.; Quéré, C.; Rogelj, J.; Rosen, D.; et al. Current and future global climate impacts resulting from COVID-19. Nat. Clim. Chang. 2020, 10, 913–919. [Google Scholar] [CrossRef]
- Tobías, A.; Carnerero, C.; Reche, C.; Massagué, J.; Via, M.; Minguillón, M.C.; Alastuey, A.; Querol, X. Changes in air quality during the lockdown in Barcelona (Spain) one month into the SARS-CoV-2 epidemic. Sci. Total Environ. 2020, 726, 138540. [Google Scholar] [CrossRef] [PubMed]
- Munir, S.; Coskuner, G.; Jassim, M.S.; Yusuf, A.; Aina, Y.A.; Asad Ali, A.; Mayfield, M. Changes in air quality associated with mobility trends and meteorological conditions during COVID-19 lockdown in Northern England, UK. Atmosphere 2021, 12, 504. [Google Scholar] [CrossRef]
- Henao, J.J.; Rendón, A.M.; Hernández, K.S.; Giraldo-Ramirez, P.A.; Robledo, V.; Posada-Marín, J.A.; Bernal, N.; Salazar, J.F.; Mejía, J.F. Differential Effects of the COVID-19 Lockdown and Regional Fire on the Air Quality of Medellín, Colombia. Atmosphere 2021, 12, 1137. [Google Scholar] [CrossRef]
- Gamelas, C.; Abecasis, L.; Canha, N.; Almeida, S.M. The Impact of COVID-19 Confinement Measures on the Air Quality in an Urban-Industrial Area of Portugal. Atmosphere 2021, 12, 1097. [Google Scholar] [CrossRef]
- Feng, R.; Xu, H.; Wang, Z.; Gu, Y.; Liu, Z.; Zhang, H.; Zhang, T.; Wang, Q.; Zhang, Q.; Liu, S.; et al. Quantifying Air Pollutant Variations during COVID-19 Lockdown in a Capital City in Northwest China. Atmosphere 2021, 12, 788. [Google Scholar] [CrossRef]
- Skiriene, A.F.; Stasiškiene, Ž. COVID-19 and Air Pollution: Measuring Pandemic Impact to Air Quality in Five European Countries. Atmosphere 2021, 12, 290. [Google Scholar] [CrossRef]
- Bolaño-Ortiz, T.R.; Pascual-Flores, R.M.; Puliafito, E.; Camargo-Caicedo, Y.; Berná-Peña, L.L.; Ruggeri, M.F.; Lopez-Noreña, A.I.; Tames, M.F.; Cereceda-Balic, F. Spread of COVID-19, Meteorological Conditions and Air Quality in the City of Buenos Aires, Argentina: Two Facets Observed during Its Pandemic Lockdown. Atmosphere 2020, 11, 1045. [Google Scholar] [CrossRef]
- Fu, F.; Purvis-Roberts, K.L.; Williams, B. Impact of the COVID-19 Pandemic Lockdown on Air Pollution in 20 Major Cities around the World. Atmosphere 2020, 11, 1189. [Google Scholar] [CrossRef]
- Sokhi, R.S.; Singh, V.; Querol, X.; Finardi, S.; Targino, A.C.; Andrade, M.F.; Pavlovic, R.; Garland, R.M.; Massague, J.; Kong, S.; et al. A global observational analysis to understand changes in air quality during exceptionally low anthropogenic emission conditions. Environ. Int. 2021, 157, 106818. [Google Scholar] [CrossRef]
- Kumari, P.; Toshniwa, D. Impact of lockdown on air quality over major cities across the globe during COVID-19 pandemic. Urban Clim. 2020, 34, 100719. [Google Scholar] [CrossRef]
- Mouzourides, P.; Kumar, P.; Neophytou, M.K.-A. Assessment of long-term measurements of particulate matter and gaseous pollutants in South-East Mediterranean. Atmos. Environ. 2015, 107, 148–165. [Google Scholar] [CrossRef] [Green Version]
- Tsangari, H.; Paschalidou, A.K.; Kassomenos, A.P.; Vardoulakis, S.; Heaviside, C.; Georgiou, K.E.; Yamasaki, E.N. Extreme weather and air pollution effects on cardiovascular and respiratory hospital admissions in Cyprus. Sci. Total Environ. 2016, 542, 247–253. [Google Scholar] [CrossRef]
- Carslaw, D.C.; Beevers, S.D. Characterising and understanding emission sources using bivariate polar plots and k-means clustering. Environ. Model. Softw. 2013, 40, 325–329. [Google Scholar] [CrossRef]
- Querol, X.; Pey, J.; Pandolfi, M.; Alastuey, A.; Cusack, M.; Pérez, N.; Moreno, T.; Viana, M.; Mihalopoulos, N.; Kallos, G.; et al. African dust contributions to mean ambient PM10 mass-levels across the Mediterranean Basin. Atmos. Environ. 2009, 43, 4266–4277. [Google Scholar] [CrossRef]
- Ministry of Labour, Welfare, and Social Insurance, Government of Cyprus. Air Quality and Strategic Planning Section of Department of Labour Inspection (DLI). Available online: https://www.airquality.dli.mlsi.gov.cy/reports (accessed on 27 February 2019).
- Georgiou, G.K.; Kushta, J.; Christoudias, T.; Proestos, Y.; Lelieveld, J. Air quality modelling over the Eastern Mediterranean: Seasonal sensitivity to anthropogenic emissions. Atmos. Environ. 2020, 222, 117119. [Google Scholar] [CrossRef]
- Khalil, M.A.K.; Rasmussen, R.A. The global cycle of carbon monoxide: Trends and mass balance. Chemosphere 1990, 20, 227–242. [Google Scholar] [CrossRef]
- Zhang, L.; Lee, C.S.; Zhang, R.; Chen, L. Spatial and temporal evaluation of long term trend (2005-2014) of OMI retrieved NO2 and SO2 concentrations in Henan Province, China. Atmos. Environ. 2017, 154, 151–166. [Google Scholar] [CrossRef]
- Kleanthous, S.; Vrekoussis, M.; Mihalopoulos, N.; Kalabokas, P.; Lelieveld, J. On the temporal and spatial variation of ozone in Cyprus. Sci. Total Environ. 2014, 476–477, 677–687. [Google Scholar] [CrossRef]
- Pikridas, M.; Vrekoussis, M.; Sciare, J.; Kleanthous, S.; Vasiliadou, E.; Kizas, C.; Savvides, C.; Mihalopoulos, N. Spatial and temporal (short and long-term) variability of submicron, fine and sub-10 μm particulate matter (PM1, PM2.5, PM10) in Cyprus. Atmos. Environ. 2018, 191, 79–93. [Google Scholar] [CrossRef]
- Achilleos, S.; Mouzourides, P.; Kalivitis, N.; Katra, I.; Kloog, I.; Kouis, P.; Middleton, N.; Mihalopoulos, N.; Neophytou, M.; Panayiotoua, A.; et al. Spatio-temporal variability of desert dust storms in Eastern Mediterranean (Crete, Cyprus, Israel) between 2006 and 2017 using a uniform methodology. Sci. Total Environ. 2020, 714, 136693. [Google Scholar] [CrossRef]
- Ialongo, I.; Hakkarainen, J.; Hyttinen, N.; Jalkanen, J.-P.; Johansson, L.; Boersma, K.F.; Krotkov, N.; Tamminen, J. Characterization of OMI tropospheric NO2 over the Baltic Sea region. Atmos. Chem. Phys. 2014, 14, 7795–7805. [Google Scholar] [CrossRef] [Green Version]
- Khoder, M.I. Atmospheric conversion of sulfur dioxide to particulate sulfate and nitrogen dioxide to particulate nitrate and gaseous nitric acid in an urban area. Chemosphere 2002, 49, 675–684. [Google Scholar] [CrossRef]
- Bakwin, P.S.; Tans, P.P.; Novelli, P.C. Carbon monoxide budget in the northern hemisphere. Geophys. Res. Lett. 1994, 21, 433–436. [Google Scholar] [CrossRef]
- Drori, R.; Dayan, U.; Edwards, D.P.; Emmons, L.K.; Erlick, C. Attributing and quantifying carbon monoxide sources affecting the Eastern Mediterranean: A combined satellite, modelling, and synoptic analysis study. Atmos. Chem. Phys. 2012, 12, 1067–1082. [Google Scholar] [CrossRef] [Green Version]
- Saxena, A.; Raj, S. Impact of lockdown during COVID-19 pandemic on the air quality of North Indian cities. Urban Clim. 2021, 35, 100754. [Google Scholar] [CrossRef]
- Hu, M.; Chen, Z.; Cui, H.; Wang, T.; Zhang, C.; Yun, K. Air pollution and critical air pollutant assessment during and after COVID-19 lockdowns: Evidence from pandemic hotspots in China, the Republic of Korea, Japan, and India. Atmos. Pollut. Res. 2021, 12, 316–329. [Google Scholar] [CrossRef] [PubMed]
- Cabaneros, S.M.; Calautit, J.K.; Hughes, B. Spatial estimation of outdoor NO2 levels in Central London using deep neural networks and a wavelet decomposition technique. Ecol. Model. 2020, 424, 109017. [Google Scholar] [CrossRef]
- Chan, K.L.; Hartl, A.; Lam, Y.F.; Xie, P.H.; Liu, W.Q.; Cheung, H.M.; Lampel, J.; Pöhler, D.; Li, A.; Xu, J.; et al. Observations of tropospheric NO2 using ground based MAX-DOAS and OMI measurements during the Shanghai World Expo 2010. Atmos. Environ. 2015, 119, 45–58. [Google Scholar] [CrossRef]
- Beirle, S.; Platt, U.; Wenig, M.; Wagner, T. Weekly cycle of NO2 by GOME measurements: A signature of anthropogenic sources. Atmos. Chem. Phys. 2003, 3, 2225–2232. [Google Scholar] [CrossRef] [Green Version]
- Henry, R.; Norris, G.A.; Vedantham, R.; Turner, J.R. Source Region Identification Using Kernel Smoothing. Environ. Sci. Technol. 2009, 43, 4090–4097. [Google Scholar] [CrossRef]
- Cui, S.; Xian, J.; Shen, F.; Zhang, L.; Deng, B.; Zhang, Y.; Ge, X. One-Year Real-Time Measurement of Black Carbon in the Rural Area of Qingdao, Northeastern China: Seasonal Variations, Meteorological Effects, and the COVID-19 Case Analysis. Atmosphere 2021, 12, 394. [Google Scholar] [CrossRef]
- Carslaw, D.C.; Beevers, S.D.; Ropkins, K.; Bell, M.G. Detecting and quantifying aircraft and other on-airport contributions to ambient nitrogen oxides in the vicinity of a large international airport. Atmos. Environ. 2006, 40, 5424–5434. [Google Scholar] [CrossRef]
- Clapp, L.J.; Jenkin, M.E. Analysis of the relationship between ambient levels of O3, NO2 and NO as a function of NOx in the UK. Atmos. Environ. 2001, 35, 6391–6405. [Google Scholar] [CrossRef]
- Hatzianastassiou, N.; Katsoulis, B.; Antakis, B. Extreme Nitrogen Oxide and Ozone Concentrations in Athens Atmosphere in Relation to Meteorological Conditions. Environ. Monit. Assess. 2007, 128, 447–464. [Google Scholar] [CrossRef] [PubMed]
- Barcelona Supercomputing Center—BSC Dust Daily Forecast. Available online: https://ess.bsc.es/bsc-dust-daily-forecast (accessed on 3 October 2021).
- Țîmpu, S.; Sfîcă, L.; Dobri, R.V.; Cazacu, M.-M.; Nita, A.-I.; Birsan, M.-V. Tropospheric Dust and Associated Atmospheric Circulations over the Mediterranean Region with Focus on Romania’s Territory. Atmosphere 2020, 11, 342. [Google Scholar] [CrossRef] [Green Version]
Figure 1.
Google Earth image depicting the different locations of stations and the two avenues.

Figure 2.
The hourly variation of the traffic load over the entire study period in (a) Strovolos Avenue and (b) Athalassis Avenue in 2020. The solid horizontal line illustrates the average number of vehicles where the percentages depict the corresponding load reduction per period in relation to the P1 period. The separation of periods is presented with a vertical black dashed line.

Figure 3.
The hourly variation of the concentration values of (a) NO2, (b) CO, (c) PM10, and (d) the number of cars at Athalassis Avenue at the AURA station for 2018, 2019 and 2020. Different time periods are demarcated using a black dashed line.
Figure 3.
The hourly variation of the concentration values of (a) NO2, (b) CO, (c) PM10, and (d) the number of cars at Athalassis Avenue at the AURA station for 2018, 2019 and 2020. Different time periods are demarcated using a black dashed line.


Figure 4.
The average daily variation of the three pollutants concentrations in coloured lines for (a) NO2, (b) CO, (c) PM10, at the AURA station, as well as (d) the daily variation of car number in Athalassis Avenue in 2018, 2019 and 2020. (Black line denotes the trend line of the daily average (using the LOESS method), and the grey shaded area denotes their corresponding standard deviation.).

Figure 5.
The hourly concentration variations of NO2 (first row), CO (second row), PM10 (third row) and vehicles (forth row) in Athalassis Avenue from P1/2020 (before lockdown) until the P2a/2020 (beginning of lockdown); black line denotes the period mean concentration value as calculated in Table 1.

Figure 6.
The change of the normalized average value (a) of each hour per day of the week and the change of the normalized average value (b) of each hour during the day, for the three study pollutants (NO2 (red), CO (blue), PM10 (green)) for the P2/2019 and P2/2020 and average number of cars for Athalassis avenues (purple).

Figure 7.
The daily averages of the concentrations of the three pollutants (a) NO2, (b) CO, (c) PM10 in 2018, 2019 and 2020 at three different stations: the AURA station (red), the AGM background station (black line) and for NicTr station (orange line).
Figure 7.
The daily averages of the concentrations of the three pollutants (a) NO2, (b) CO, (c) PM10 in 2018, 2019 and 2020 at three different stations: the AURA station (red), the AGM background station (black line) and for NicTr station (orange line).

Figure 8.
The box plots of the three pollutants concentrations: (a) NO2, (b) CO and (c) PM10 at the three stations, AURA (red), AGM (black) and NicTr (orange), for the study periods in 2018, 2019 and 2020. The median is represented by the horizontal line in the middle of the rectangle, while the top and bottom lines of the rectangle represent the 25% and 75% percentiles; the grey crosses denote the extreme data values.

Figure 9.
(a) The daily average of PM2.5 concentrations 2020 at three different stations: the AURA station (red), the AGM background station (black line) and for NicTr station (orange line). (b) The average daily variation of PM2.5 concentrations in coloured line at the AURA station 2020. (Black line denotes the trend line of the daily average (using the LOESS method), and the grey shaded area denotes their corresponding standard deviation.) (c) The box plots of the PM2,5 concentrations at the three stations, AURA (red), AGM (black) and NicTr (orange).

Figure 10.
The time series of the daily mean values of ambient temperature (AT), relative humidity (RH), solar radiation (SR), rainfall (RF) and wind speed (WS) for the study period of (a) 2018, (b) 2019 and (c) 2020 at AURA station.
Figure 10.
The time series of the daily mean values of ambient temperature (AT), relative humidity (RH), solar radiation (SR), rainfall (RF) and wind speed (WS) for the study period of (a) 2018, (b) 2019 and (c) 2020 at AURA station.

Figure 11.
Pollution roses of the three pollutants, NO2 (left column), CO (centre column) and PM10 (right column) for the P2 (lockdown) study period in the years of 2018 (a), 2019 (b) and 2020 (c) at the AURA station.
Figure 11.
Pollution roses of the three pollutants, NO2 (left column), CO (centre column) and PM10 (right column) for the P2 (lockdown) study period in the years of 2018 (a), 2019 (b) and 2020 (c) at the AURA station.

Figure 12.
The respective bivariate polar plots for the three main pollutants NO2 (left column), CO (centre column) and PM10 (right column) of the AURA station for (a) 2018, (b) 2019 and (c) 2020 for the lockdown periods.
Figure 12.
The respective bivariate polar plots for the three main pollutants NO2 (left column), CO (centre column) and PM10 (right column) of the AURA station for (a) 2018, (b) 2019 and (c) 2020 for the lockdown periods.

Figure 13.
Respective weighted bivariate polar plots for the three main pollutants NO2 (left column), CO (centre column) and PM10 (right column) at the AURA station, during (a) 2018, (b) 2019 and (c) 2020 for the lockdown periods.
Figure 13.
Respective weighted bivariate polar plots for the three main pollutants NO2 (left column), CO (centre column) and PM10 (right column) at the AURA station, during (a) 2018, (b) 2019 and (c) 2020 for the lockdown periods.

Figure 14.
The air mass back trajectories from 06/05 to 14/05/2020 for the area of AURA station and AGM at elevations of 700 m,1500 m, 2500 m, 4000 m above sea level. The asterisk denotes the 72-h back-trajectory origins at 12:00 UTC of the respective date.
Figure 14.
The air mass back trajectories from 06/05 to 14/05/2020 for the area of AURA station and AGM at elevations of 700 m,1500 m, 2500 m, 4000 m above sea level. The asterisk denotes the 72-h back-trajectory origins at 12:00 UTC of the respective date.


Figure 15.
The time series of NO2 concentrations categorized by wind direction in one-day stacked bars.
Figure 15.
The time series of NO2 concentrations categorized by wind direction in one-day stacked bars.

Figure 16.
Images from the results of BSC-DREAM8b for the prediction of dust near the surface for 16–19 May 2020 and Hysplit back-trajectory for 17 May 2020 at elevations of 700 m,1500 m, 2500 m.
Figure 16.
Images from the results of BSC-DREAM8b for the prediction of dust near the surface for 16–19 May 2020 and Hysplit back-trajectory for 17 May 2020 at elevations of 700 m,1500 m, 2500 m.


Table 1.
The periods and their corresponding dates based on the lockdown measures.
| Period | Dates | Type of Restriction | |
|---|---|---|---|
| Study Period | 15/2–08/6 (16 Weeks) | All Periods | |
| P1 | 15/2−14/3 (4 weeks) | Before the restriction measures | |
| P2 | a | 15/3−23/3 (1 week) | Loose restriction measures |
| b | 24/3−03/5 (6 weeks) | Strict restriction measures | |
| c | 04/5−20/5 (2 weeks) | Loose restriction measures | |
| P3 | 21/5−08/6 (3 weeks) | No restriction measures | |
Table 2.
The average number of vehicles per hour passing through each avenue over the study periods in the years 2018, 2019 and 2020 along with the decrease in the average number of vehicles compared to P1/2020 where no lockdown measures were taking place.
Table 2.
The average number of vehicles per hour passing through each avenue over the study periods in the years 2018, 2019 and 2020 along with the decrease in the average number of vehicles compared to P1/2020 where no lockdown measures were taking place.
| Periods | Strovolos Avenue | Decrease Compared to P1/2020 | Athalassis Avenue | Decrease Compared to P1/2020 | ||||
|---|---|---|---|---|---|---|---|---|
| 2018 | 2019 | 2020 | 2018 | 2019 | 2020 | |||
| P1 | 1409 | 1391 | 1314 | 816 | 821 | 783 | ||
| P2a | 1491 | 1446 | 829 | −6.9% | 869 | 841 | 465 | −40.6% |
| P2b | 1410 | 1348 | 469 | −64.3% | 806 | 786 | 262 | −66.5% |
| P2c | 1462 | 1427 | 981 | −35.3% | 844 | 836 | 561 | −28.4% |
| P3 | 1452 | 1480 | 1235 | −6.0% | 857 | 875 | 693 | −11.4% |
Table 3.
Average concentration values for each criterion pollutant (CO (ppm), (NO2) (ppb) and PM10 (μg/m3)) during each study period in 2018, 2019 and 2020 as recorded by the AURA station; percentage comparisons as obtained for each subperiod with reference to the P1 subperiod within the same year; and percentage comparisons of the 2020 subperiods with the corresponding subperiod of previous years. Positive percentages denote increase and negative correspondingly decrease.
| Pollutant | Periods | 2018 | 2019 | 2020 | |||||
|---|---|---|---|---|---|---|---|---|---|
| Concentr. | Pos./Neg. Percentage Comparison w.r.t P1/2018 | Concentr. | Pos./Neg. Percentage Comparison w.r.t P1/2019 | Concentr. | Pos./Neg. Percentage Comparison w.r.t P1/2020 | Pos./Neg. | |||
| Percent. Compar. w.r.t. Period of 2018 | Percent. Compar. w.r.t. Period of 2019 | ||||||||
| CO (ppm) | All periods | 0.29 | 0.23 | ||||||
| P1 | - | - | 0.38 | 0.28 | - | −26% | |||
| P2a | - | - | 0.28 | −26% | 0.20 | −29% | - | −29% | |
| P2b | - | - | 0.29 | −24% | 0.21 | −25% | - | −28% | |
| P2c | 0.29 | - | 0.26 | −32% | 0.20 | −29% | −31% | −23% | |
| P3 | 0.32 | - | 0.26 | −32% | 0.20 | −29% | −38% | −23% | |
| NO2 (ppb) | All periods | 6.29 | 6.67 | 8.98 | |||||
| P1 | 8.43 | 8.50 | 7.88 | −10% | −7% | ||||
| P2a | 7.71 | −9% | 6.59 | −23% | 4.51 | −43% | −42% | −32% | |
| P2b | 6.24 | −26% | 6.94 | −18% | 8.51 | +8% | +36% | +23% | |
| P2c | 4.45 | −47% | 5.40 | −37% | 15.82 | +101% | +256% | +193% | |
| P3 | 4.19 | −50% | 4.71 | −45% | 7.68 | −2% | +83% | +63% | |
| PM10 (μg/m3) | All periods | 45.33 | 22.27 | 28.21 | |||||
| P1 | 38.16 | 15.66 | 31.04 | −19% | +98% | ||||
| P2a | 49.45 | +30% | 15.69 | 0% | 17.78 | −43% | −64% | +13% | |
| P2b | 50.23 | +32% | 18.51 | +18% | 25.83 | −17% | −49% | +40% | |
| P2c | 47.09 | +23% | 23.13 | +48% | 36.95 | +19% | −22% | +60% | |
| P3 | 41.77 | +10% | 41.39 | +164% | 25.99 | −16% | −38% | −37% | |
Pos./Neg. stand for the increased and decreased percentage, respectively. “Concentr.” stands for the word concentration. “w.r.t” stands for “with reference to”.
Table 4.
The exceedances of the daily values of PM10 for the years 2018, 2019 and 2020 by dividing the number of exceedances per period.
Table 4.
The exceedances of the daily values of PM10 for the years 2018, 2019 and 2020 by dividing the number of exceedances per period.
| Period | Dates | 2018 | 2019 | 2020 | |
|---|---|---|---|---|---|
| P1 | 15/2–14/3 (4 weeks) | 4 | 0 | 0 | |
| P2 | a | 15/3–23/3 (1 week) | 4 | 0 | 0 |
| b | 24/3–3/5 (6 weeks) | 10 | 0 | 2 | |
| c | 4/5–20/5 (2 weeks) | 4 | 0 | 5 | |
| P3 | 21/5–8/6 (3 weeks) | 5 | 4 | 1 | |
| SUM | 27 | 4 | 8 | ||
Table 5.
The period averages for AGM, NicTr station and AURA station for 2018, 2019 and 2020.
| Pollutant | Period | AGM (Background Station) | NicTr (Urban Station) | AURA (Suburban Station) | ||||||
|---|---|---|---|---|---|---|---|---|---|---|
| 2018 | 2019 | 2020 | 2018 | 2019 | 2020 | 2018 | 2019 | 2020 | ||
| CO (ppm) | All periods | 0.14 | 0.14 | 0.14 | 0.35 | 0.35 | 0.29 | -- | 0.29 | 0.23 |
| P1 | 0.14 | 0.15 | 0.15 | 0.44 | 0.49 | 0.41 | -- | 0.38 | 0.28 | |
| P2a | 0.14 | 0.13 | 0.14 | 0.35 | 0.35 | 0.32 | -- | 0.28 | 0.20 | |
| P2b | 0.14 | 0.14 | 0.14 | 0.34 | 0.33 | 0.22 | -- | 0.29 | 0.21 | |
| P2c | 0.13 | 0.13 | 0.13 | 0.29 | 0.25 | 0.27 | 0.29 | 0.26 | 0.20 | |
| P3 | 0.12 | 0.12 | 0.16 | 0.31 | 0.25 | 0.24 | 0.32 | 0.26 | 0.20 | |
| NO2 (ppb) | All periods | 1.07 | 1.32 | 1.25 | 13.45 | 13.66 | 9.93 | 6.29 | 6.67 | 8.98 |
| P1 | 1.11 | 1.26 | 1.71 | 14.72 | 17.29 | 16.56 | 8.43 | 8.50 | 7.88 | |
| P2a | 1.11 | 1.38 | 1.57 | 15.06 | 15.50 | 10.00 | 7.71 | 6.59 | 4.51 | |
| P2b | 1.31 | 1.36 | 1.12 | 13.90 | 12.32 | 5.91 | 6.24 | 6.94 | 8.51 | |
| P2c | 0.92 | 1.34 | 1.03 | 11.68 | 11.45 | 9.89 | 4.45 | 5.40 | 15.82 | |
| P3 | -- | 1.29 | 0.92 | 11.46 | 12.17 | 8.36 | 4.19 | 4.71 | 7.68 | |
| PM10 (μg/m3) | All periods | 36.01 | 19.20 | 21.98 | 44.59 | 37.78 | 26.88 | 45.33 | 22.27 | 28.21 |
| P1 | 27.50 | 12.25 | 18.80 | 46.55 | 41.42 | 35.59 | 38.16 | 15.66 | 31.04 | |
| P2a | 35.91 | 10.68 | -- | 47.42 | 37.50 | 20.66 | 49.45 | 15.69 | 17.78 | |
| P2b | 37.32 | 19.68 | 20.75 | 49.38 | 38.07 | 26.63 | 50.23 | 18.51 | 25.83 | |
| P2c | 55.68 | 19.77 | 30.56 | 37.18 | 32.85 | 21.97 | 47.09 | 23.13 | 36.95 | |
| P3 | 42.56 | 26.74 | 18.87 | 37.28 | 36.18 | 20.03 | 41.77 | 41.39 | 25.99 | |
Table 6.
The average values of the study periods of the AURA station in 2018, 2019 and 2020 for the ambient temperature (AT), relative humidity (RH), solar radiation (SR), rainfall (RF), barometric pressure (BP), wind speed (WS), wind direction (WD) and sigma theta (SIGMATHETA).
Table 6.
The average values of the study periods of the AURA station in 2018, 2019 and 2020 for the ambient temperature (AT), relative humidity (RH), solar radiation (SR), rainfall (RF), barometric pressure (BP), wind speed (WS), wind direction (WD) and sigma theta (SIGMATHETA).
| Year | Period | AΤ (°C) | RH (%) | SR (W/m2) | RF (mm/h) | BP (mbar) | WS (m/s) | WD (deg) | SIGMA THETA (deg) |
|---|---|---|---|---|---|---|---|---|---|
| 2018 | All periods | 18.72 | 239.55 | 0.03 | 998.24 | 2.37 | 214 | 30 | |
| P1 | 12.81 | 171.64 | 0.01 | 996.70 | 2.21 | 207 | 29 | ||
| P2a | 14.69 | 75.44 | 226.69 | 0 | 1000 | 2.37 | 195 | 31 | |
| P2b | 18.09 | 58.02 | 257.33 | 0.02 | 1000 | 2.47 | 219 | 30 | |
| P2c | 22.07 | 61.39 | 279.27 | 0.03 | 996.70 | 2.53 | 214 | 29 | |
| P3 | 23.64 | 63.91 | 271.84 | 0.06 | 997.20 | 2.22 | 222 | 32 | |
| 2019 | All periods | 15.97 | 58.30 | 236.35 | 0.03 | 996.01 | 1.96 | 239 | 27 |
| P1 | 9.39 | 70.39 | 167.29 | 0.13 | 994.34 | 1.97 | 256 | 26 | |
| P2a | 12.46 | 64.64 | 213.64 | 0 | 995.33 | 2.00 | 247 | 28 | |
| P2b | 13.48 | 61.62 | 222.46 | 0 | 995.84 | 1.49 | 224 | 28 | |
| P2c | 19.75 | 47.06 | 313.21 | 0 | 996.35 | 2.23 | 243 | 29 | |
| P3 | 28.46 | 41.54 | 304.89 | 0 | 997.18 | 2.64 | 241 | 27 | |
| 2020 | All periods | 19.20 | 57.78 | 257.47 | 0.03 | 997.09 | 2.41 | 214 | 31 |
| P1 | 14.33 | 68.83 | 162.24 | 0.07 | 999.37 | 2.14 | 193 | 30 | |
| P2a | 13.40 | 61.74 | 200.46 | 0.06 | 997.31 | 2.14 | 206 | 31 | |
| P2b | 18.45 | 60.90 | 244.43 | 0.02 | 996.04 | 2.38 | 223 | 31 | |
| P2c | 26.35 | 42.49 | 299.36 | 0 | 996.63 | 2.40 | 199 | 32 | |
| P3 | 24.60 | 46.00 | 322.96 | 0 | 996.14 | 3.04 | 245 | 32 |
Publisher’s Note: MDPI stays neutral with regard to jurisdictional claims in published maps and institutional affiliations. |
© 2021 by the authors. Licensee MDPI, Basel, Switzerland. This article is an open access article distributed under the terms and conditions of the Creative Commons Attribution (CC BY) license (https://creativecommons.org/licenses/by/4.0/).
Share and Cite
MDPI and ACS Style
Alexandrou, G.; Mouzourides, P.; Eleftheriou, A.; Neophytou, M.K.-A. The Impact on Urban Air Quality of the COVID-19 Lockdown Periods in 2020: The Case of Nicosia, Cyprus. Atmosphere 2021, 12, 1310. https://doi.org/10.3390/atmos12101310
AMA Style
Alexandrou G, Mouzourides P, Eleftheriou A, Neophytou MK-A. The Impact on Urban Air Quality of the COVID-19 Lockdown Periods in 2020: The Case of Nicosia, Cyprus. Atmosphere. 2021; 12(10):1310. https://doi.org/10.3390/atmos12101310
Chicago/Turabian StyleAlexandrou, Giorgos, Petros Mouzourides, Andreas Eleftheriou, and Marina K.-A. Neophytou. 2021. "The Impact on Urban Air Quality of the COVID-19 Lockdown Periods in 2020: The Case of Nicosia, Cyprus" Atmosphere 12, no. 10: 1310. https://doi.org/10.3390/atmos12101310
Note that from the first issue of 2016, this journal uses article numbers instead of page numbers. See further details here.