
Remotely Monitoring COVID-19 Patient Health Condition Using Metaheuristics Convolute Networks from IoT-Based Wearable Device Health Data

 ,
,  ,
,  ,
,  ,
, 
Abstract
:1. Introduction
- IoT-wearable-devices-based COVID-19-patient health-monitoring process on minimizing the virus spread;
- The utilization of the optimized deep-learning model to maximize the disease-classification process with minimum deviations; and
- The design and implementation of a 3D model with sensors and a prototype for effectively conveying a patient’s details.
2. Related Works
3. Materials and Methods
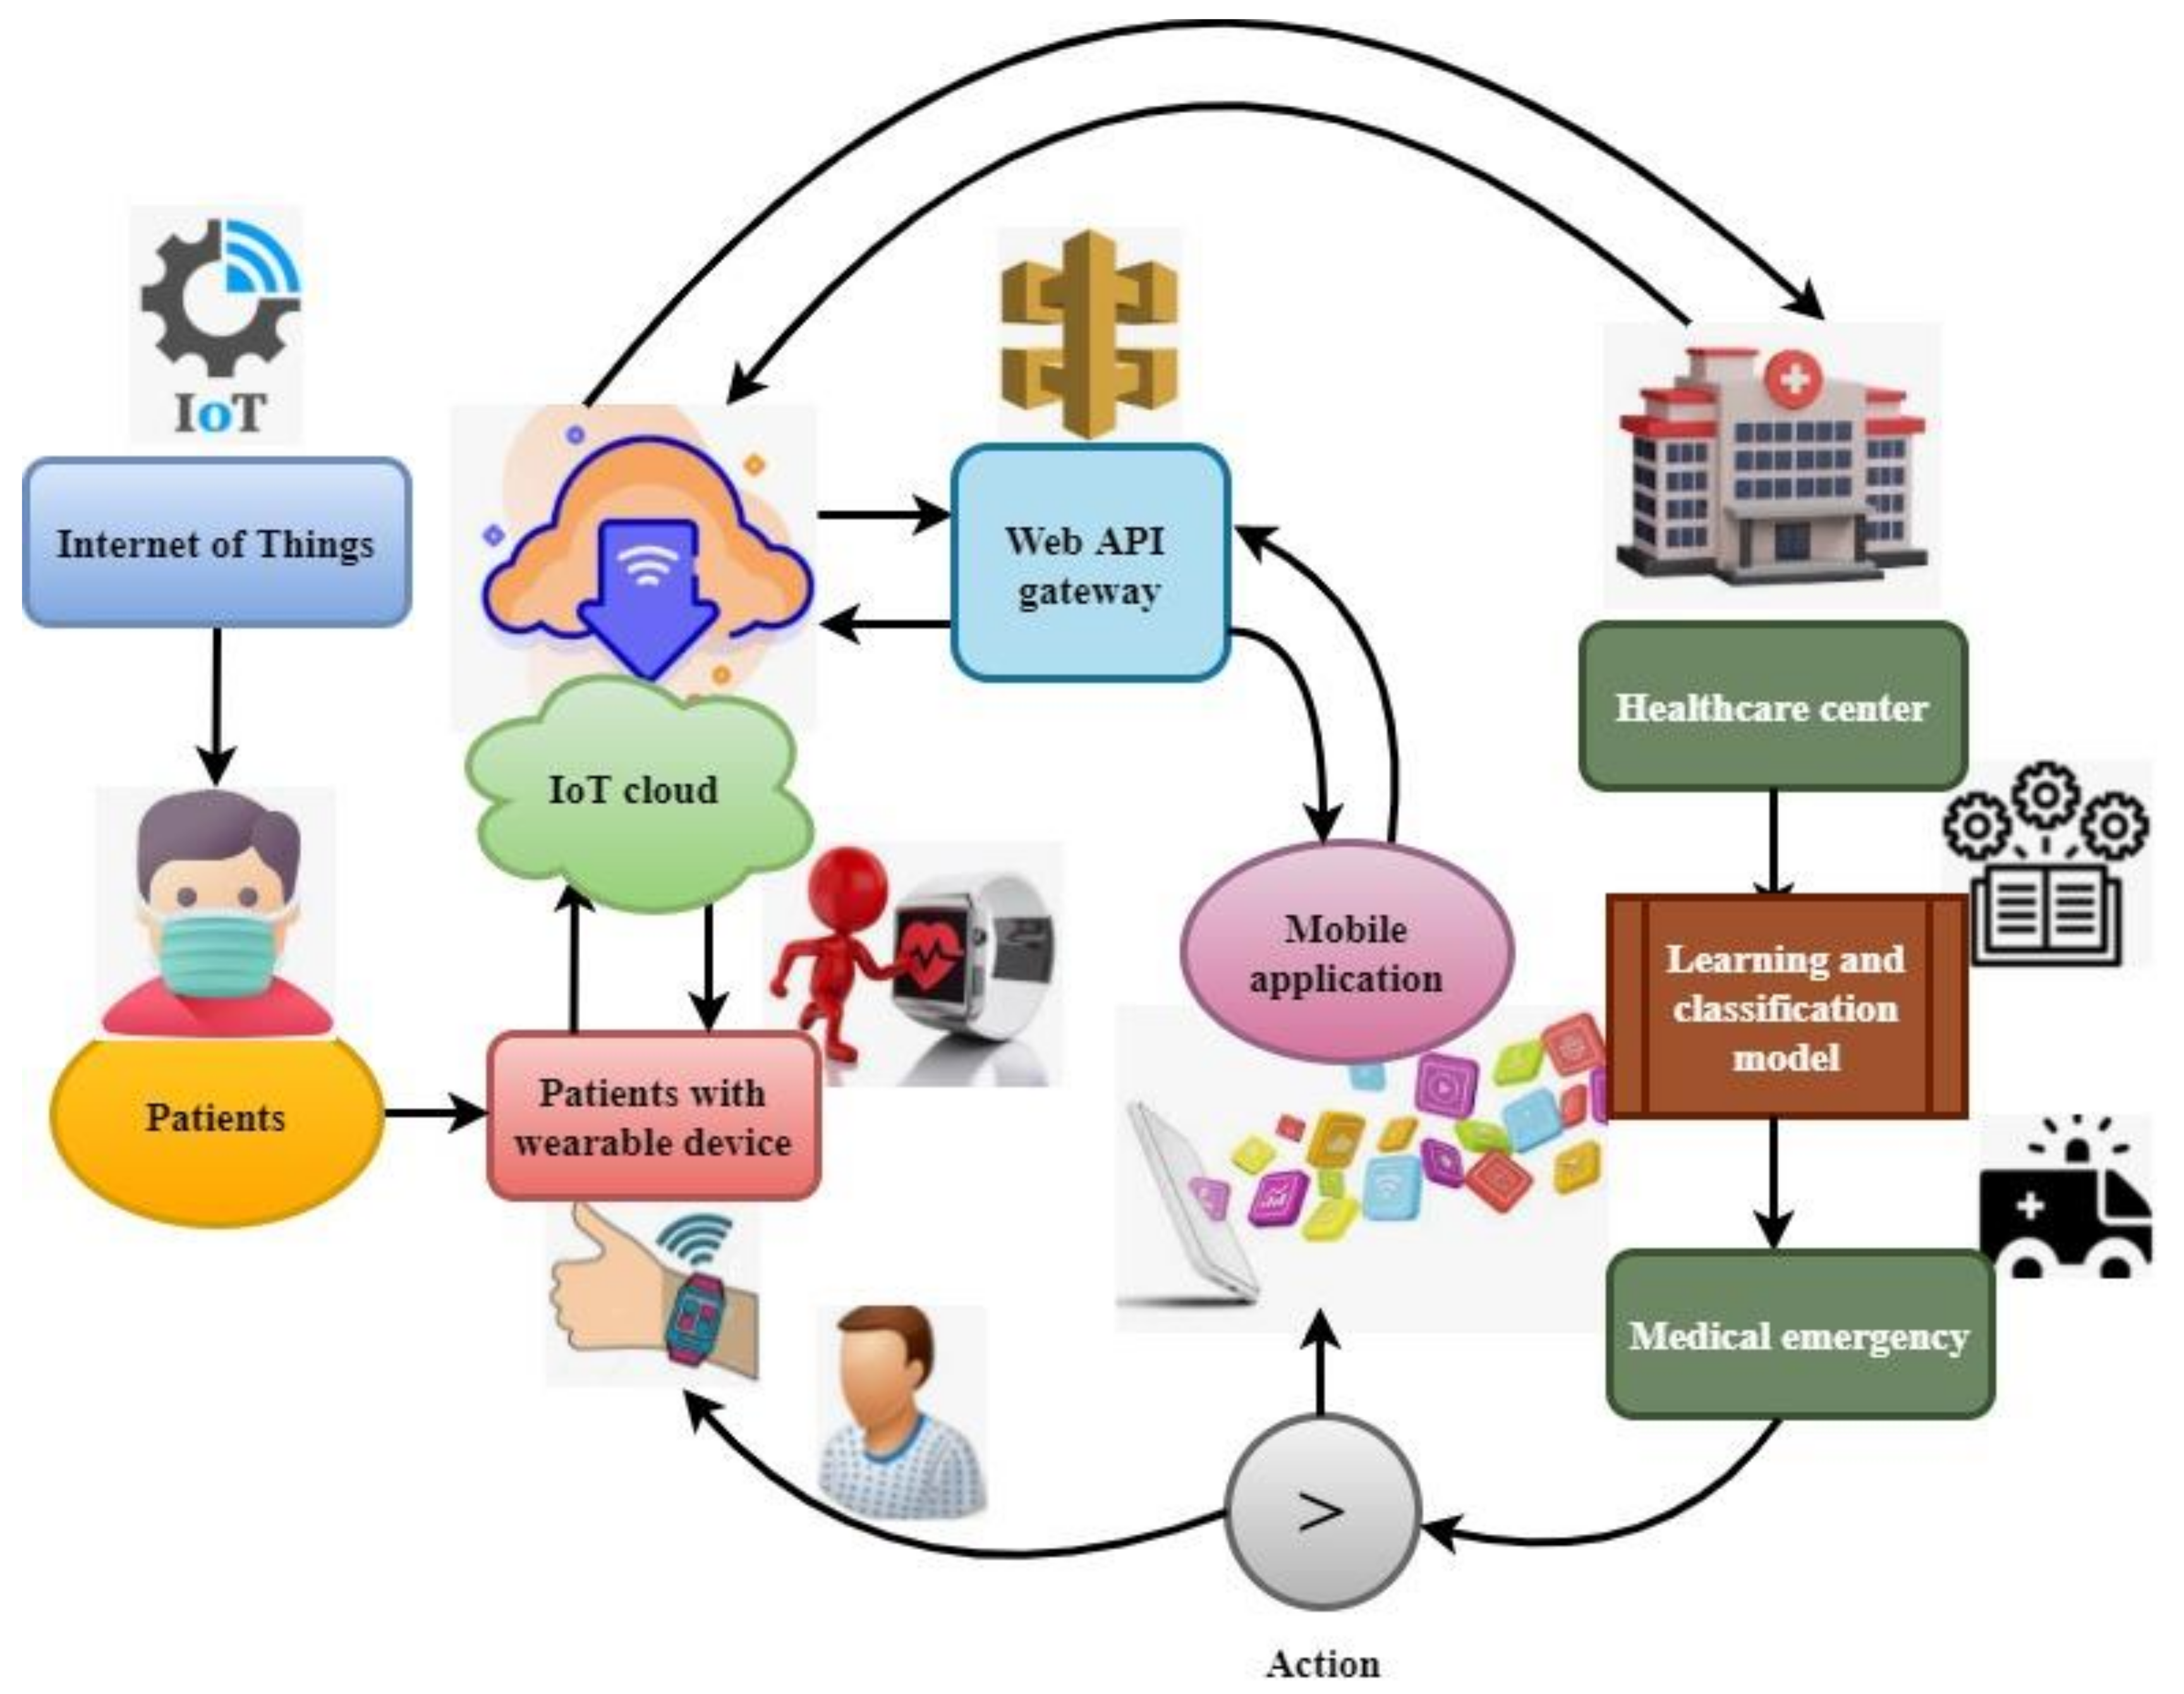
3.1. Proposed System Design
3.1.1. Layer 1: IoT Layer
3.1.2. Layer 2: Cloud Layer
3.1.3. Layer 3: Web Front Layer
3.2. Data Processing and Selection
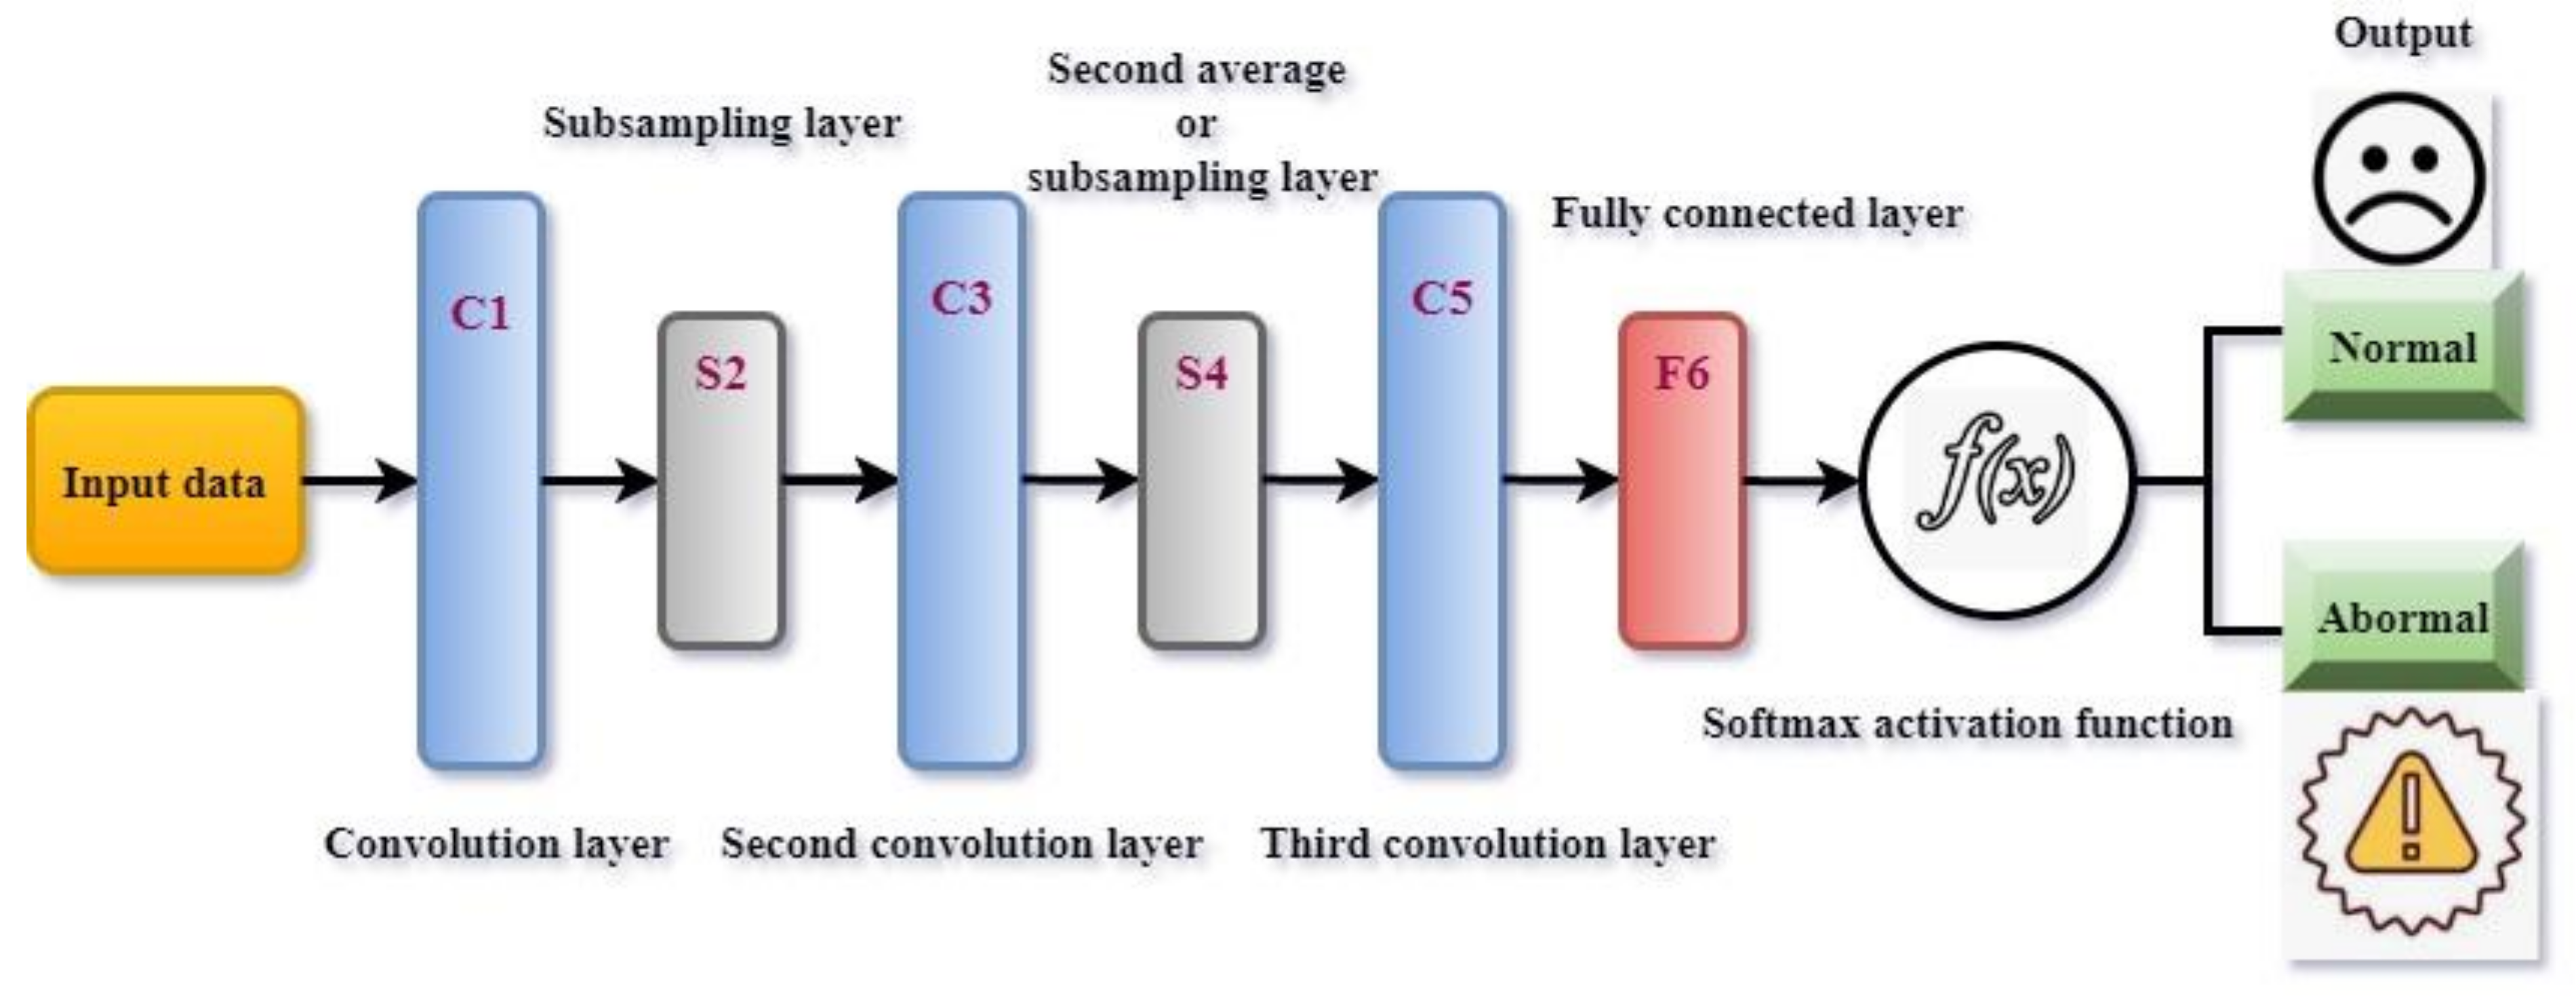
3.3. Health-Status Classification
4. Results and Discussion
5. Conclusions
Limitations and Future Research
Author Contributions
Funding
Institutional Review Board Statement
Informed Consent Statement
Data Availability Statement
Conflicts of Interest
References
- Daniel, J. Education and the COVID-19 pandemic. Prospects 2020, 49, 91–96. [Google Scholar] [CrossRef] [PubMed] [Green Version]
- Pfefferbaum, B.; North, C.S. Mental health and the COVID-19 pandemic. N. Engl. J. Med. 2020, 383, 510–512. [Google Scholar] [CrossRef] [PubMed]
- Ciotti, M.; Ciccozzi, M.; Terrinoni, A.; Jiang, W.C.; Wang, C.-B.; Bernardini, S. The COVID-19 pandemic. Crit. Rev. Clin. Lab. Sci. 2020, 57, 365–388. [Google Scholar] [CrossRef] [PubMed]
- Malasinghe, L.P.; Ramzan, N.; Dahal, K. Remote patient monitoring: A comprehensive study. J. Ambient Intell. Humaniz. Comput. 2019, 10, 57–76. [Google Scholar] [CrossRef] [Green Version]
- Archip, A.; Botezatu, N.; Şerban, E.; Herghelegiu, P.-C.; Zală, A. An IoT based system for remote patient monitoring. In Proceedings of the 17th International Carpathian Control Conference (ICCC), High Tatras, Slovakia, 29 May–1 June 2016; pp. 1–6. [Google Scholar] [CrossRef]
- De Morais Barroca Filho, I.; Aquino, G.; Malaquias, R.S.; Girão, G.; Melo., S.R.M. An IoT-based healthcare platform for patients in ICU beds during the COVID-19 outbreak. IEEE Access 2021, 9, 27262–27277. [Google Scholar] [CrossRef]
- Paganelli, A.I.; Velmovitsky, P.E.; Miranda, P.; Branco, A.; Alencar, P.; Cowan, D.; Endler, M.; Morita, P.P. A conceptual IoT-based early-warning architecture for remote monitoring of COVID-19 patients in wards and at home. Internet Things 2021, 100399. [Google Scholar] [CrossRef]
- Jaafari, S.; Alhasani, A.; Almutairi, S.M. Certain Investigations on IoT system for COVID-19. In Proceedings of the 2020 International Conference on Computing and Information Technology (ICCIT-1441), Tabuk, Saudi Arabia, 9–10 September 2020; pp. 1–4. [Google Scholar] [CrossRef]
- Javaid, M.; Khan, I.H. Internet of Things (IoT) enabled healthcare helps to take the challenges of COVID-19 Pandemic. J. Oral Biol. Craniofacial Res. 2021, 11, 209–214. [Google Scholar] [CrossRef]
- Altan, A.; Karasu, S. Recognition of COVID-19 disease from X-ray images by hybrid model consisting of 2D curvelet transform, chaotic salp swarm algorithm and deep learning technique. Chaos Solitons Fractals 2020, 140, 110071. [Google Scholar] [CrossRef]
- Alsharif, M.H.; Alsharif, Y.H.; Yahya, K.; Alomari, O.A.; Albreem, M.A.; Jahid, A. Deep learning applications to combat the dissemination of COVID-19 disease: A review. Eur. Rev. Med. Pharmacol. Sci. 2020, 24, 11455–11460. [Google Scholar] [CrossRef]
- Kalane, P.; Patil, S.; Patil, B.; Sharma, D.P. Automatic detection of COVID-19 disease using U-Net architecture based fully convolutional network. Biomed. Signal Process. Control 2021, 67, 102518. [Google Scholar] [CrossRef]
- Özdemir, O. Coronavirus Disease 2019 (COVID-19): Diagnosis and Management (narrative review). Erciyes Med. J. 2020, 42, 242–247. [Google Scholar] [CrossRef]
- Pecho-Silva, S.; Navarro-Solsol, A.C.; Panduro-Correa, V.; Rabaan, A.A.; Maguiña, J.L.; Rodriguez-Morales, A.J.; Kovy, A.L. Viral replication and antibody kinetics in the recognition of asymptomatic COVID-19 patients. Chemotherapy 2021, 66, 53–57. [Google Scholar] [CrossRef]
- Han, H.; Xu, Z.; Cheng, Z.; Zhong, Y.; Yuan, L.; Wang, F.; Li, Y.; Fubing, W.; Yan, L.; Liu, F.; et al. Descriptive, retrospective study of the clinical characteristics of asymptomatic COVID-19 patients. MSphere 2020, 5, e00922-20. [Google Scholar] [CrossRef]
- Wei, L.; Lin, J.; Duan, X.; Huang, W.; Lu, X.; Zhou, J.; Zong, Z. Asymptomatic COVID-19 Patients Can Contaminate Their Surroundings: An Environment Sampling Study. mSphere 2020, 5, e00442-20. [Google Scholar] [CrossRef]
- Alam, T. Internet of Things and Blockchain-Based Framework for Coronavirus (COVID-19) Disease. 2020. Available online: https://papers.ssrn.com/sol3/papers.cfm?abstract_id=3660503 (accessed on 25 November 2021).
- AlsAlsyouf, A.; Masa’deh, R.E.; Albugami, M.; Al-Bsheish, M.; Lutfi, A.; Alsubahi, N. Risk of Fear and Anxiety in Utilising Health App Surveillance Due to COVID-19: Gender Differences Analysis. Risks 2021, 9, 179. [Google Scholar] [CrossRef]
- Al-Turjman, F.; Deebak, B. Privacy-Aware Energy-Efficient Framework Using the Internet of Medical Things for COVID-19. IEEE Internet Things Mag. 2020, 3, 64–68. [Google Scholar] [CrossRef]
- El-Rashidy, N.; El-Sappagh, S.; Islam, S.M.; El-Bakry, H.M.; Abdelrazek, S. End-to-end deep learning framework for coronavirus (COVID-19) detection and monitoring. Electronics 2020, 9, 1439. [Google Scholar] [CrossRef]
- Rahman, A.; Hossain, M.S.; Alrajeh, N.A.; Guizani, N. B5G and Explainable Deep Learning Assisted Healthcare Vertical at the Edge: COVID-I9 Perspective. IEEE Netw. 2020, 34, 98–105. [Google Scholar] [CrossRef]
- Tan, L.; Yu, K.; Bashir, A.K.; Cheng, X.; Ming, F.; Zhao, L.; Zhou, X. Toward real-time and efficient cardiovascular monitoring for COVID-19 patients by 5G-enabled wearable medical devices: A deep learning approach. Neural Comput. Appl. 2021, 1–14. [Google Scholar] [CrossRef]
- Rathee, G.; Garg, S.; Kaddoum, G.; Wu, Y.; Jayakody, D.N.K.; Alamri, A. ANN Assisted-IoT enabled COVID-19 patient monitoring. IEEE Access 2021, 9, 42483–42492. [Google Scholar] [CrossRef]
- Otoom, M.; Otoum, N.; Alzubaidi, M.A.; Etoom, Y.; Banihani, R. An IoT-based framework for early identification and monitoring of COVID-19 cases. Biomed. Signal Process. Control 2020, 62, 102149. [Google Scholar] [CrossRef]
- Ucar, F.; Korkmaz, D. COVIDiagnosis-Net: Deep Bayes-SqueezeNet based diagnosis of the coronavirus disease 2019 (COVID-19) from X-ray images. Med. Hypotheses 2020, 140, 109761. [Google Scholar] [CrossRef]
- Mukherjee, R.; Kundu, A.; Mukherjee, I.; Gupta, D.; Tiwari, P.; Khanna, A.; Shorfuzzaman, M. IoT-cloud based healthcare model for COVID-19 detection: An enhanced k-Nearest Neighbour classifier based approach. Computing 2021, 1–21. [Google Scholar] [CrossRef]
- Mahmud, T.; Rahman, M.A.; Fattah, A.S. CovXNet: A multi-dilation convolutional neural network for automatic COVID-19 and other pneumonia detection from chest X-ray images with transferable multi-receptive feature optimisation. Comput. Biol. Med. 2020, 122, 103869. [Google Scholar] [CrossRef]
- Yang, F.; He, S.; Sadanand, S.; Yusuf, A.; Bolic, M. Contactless Measurement of Vital Signs Using Thermal and RGB Cameras: A Study of COVID 19-Related Health Monitoring. Sensors 2022, 22, 627. [Google Scholar] [CrossRef]
- Khan, I.U.; Aslam, N.; Anwar, T.; Alsaif, H.S.; Chrouf, S.M.; Alzahrani, N.A.; Alamoudi, F.A.; Kamaleldin, M.M.A.; Awary, K.B. Using a Deep Learning Model to Explore the Impact of Clinical Data on COVID-19 Diagnosis Using Chest X-ray. Sensors 2022, 22, 669. [Google Scholar] [CrossRef]
- Siam, A.I.; Elazm, A.A.; El-Bahnasawy, N.A.; El Banby, G.M.; El-Samie, F.E.A. PPG-based human identification using Mel-frequency cepstral coefficients and neural networks. Multimed. Tools. Appl. 2021, 80, 26001–26019. [Google Scholar] [CrossRef]
- Azure Open Datasets Documentation. Available online: https://docs.microsoft.com/en-us/azure/open-datasets/ (accessed on 21 November 2021).


| Method | Advantages | Disadvantages |
|---|---|---|
| ETEDL | Integrates the fog, cloud, and wireless body network and uses clinical decision-making concepts. | This method can only track a patient’s health condition up to 97.5% accuracy. |
| BG5D EDL | Effective deep-learning architecture to support data privacy. | Three-phase reconciliation global DL framework that is less than our proposed work. |
| ODBSN | Reduce the false recognition rate and minimize the computation time. | A Bayesian optimization algorithm is utilized only during the classification process. |
| MHCNN | The effectiveness of an IoT wearable-sensor-based remote health-monitoring system for COVID-19 patient health conditions can be measured. | The temperature and cough threshold values are used to investigate particular COVID-19 infection features. This limitation is considered a major drawback of this proposed work. |
| Measure | Value | Derivations |
|---|---|---|
| Sensitivity | 0.9998 | TPR =TP/(TP + FN) |
| Specificity | 0.9984 | SPC = TN/(FP + TN) |
| Precision | 0.9984 | PPV = TP/(TP + FP) |
| Negative Predictive Value | 0.9998 | NPV = TN/(TN + FN) |
| False Positive Rate | 0.0016 | FPR = FP/(FP + TN) |
| False Discovery Rate | 0.0016 | FDR = FP/(FP +TP) |
| False Negative Rate | 0.0002 | FNR = FN/(FN + TP) |
| Accuracy | 0.9991 | ACC = (TP + TN)/(P + N) |
| F1 Score | 0.9991 | F1 = 2TP/(2TP + FP + FN) |
| Matthews Correlation Coefficient | 0.9982 | TPsTN − FP FN/sqrt ((TP + FP) (TP + FN) (TN + FP) (TN + FN)) |
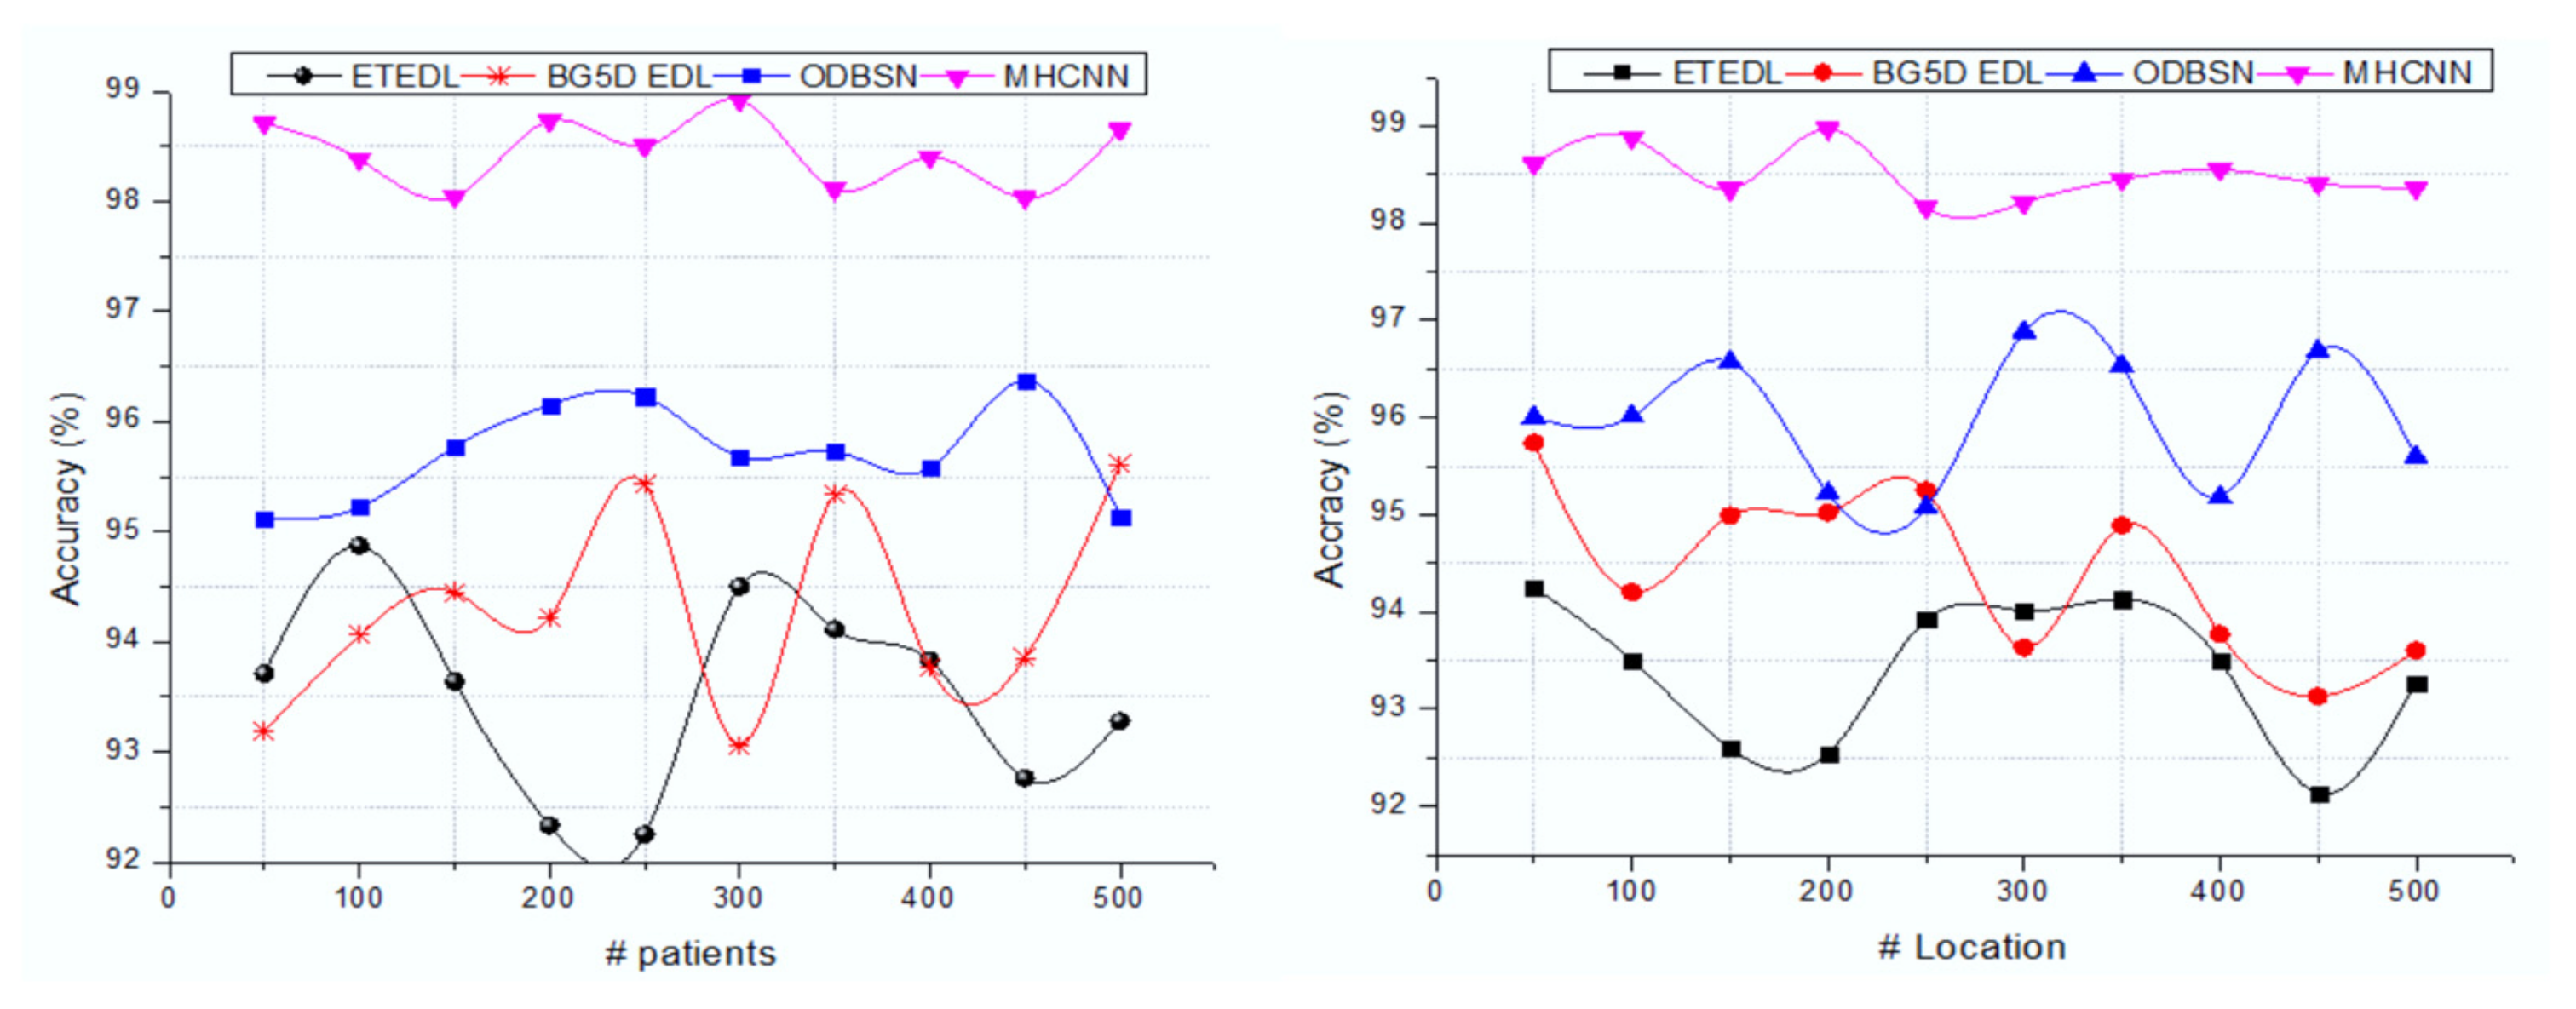
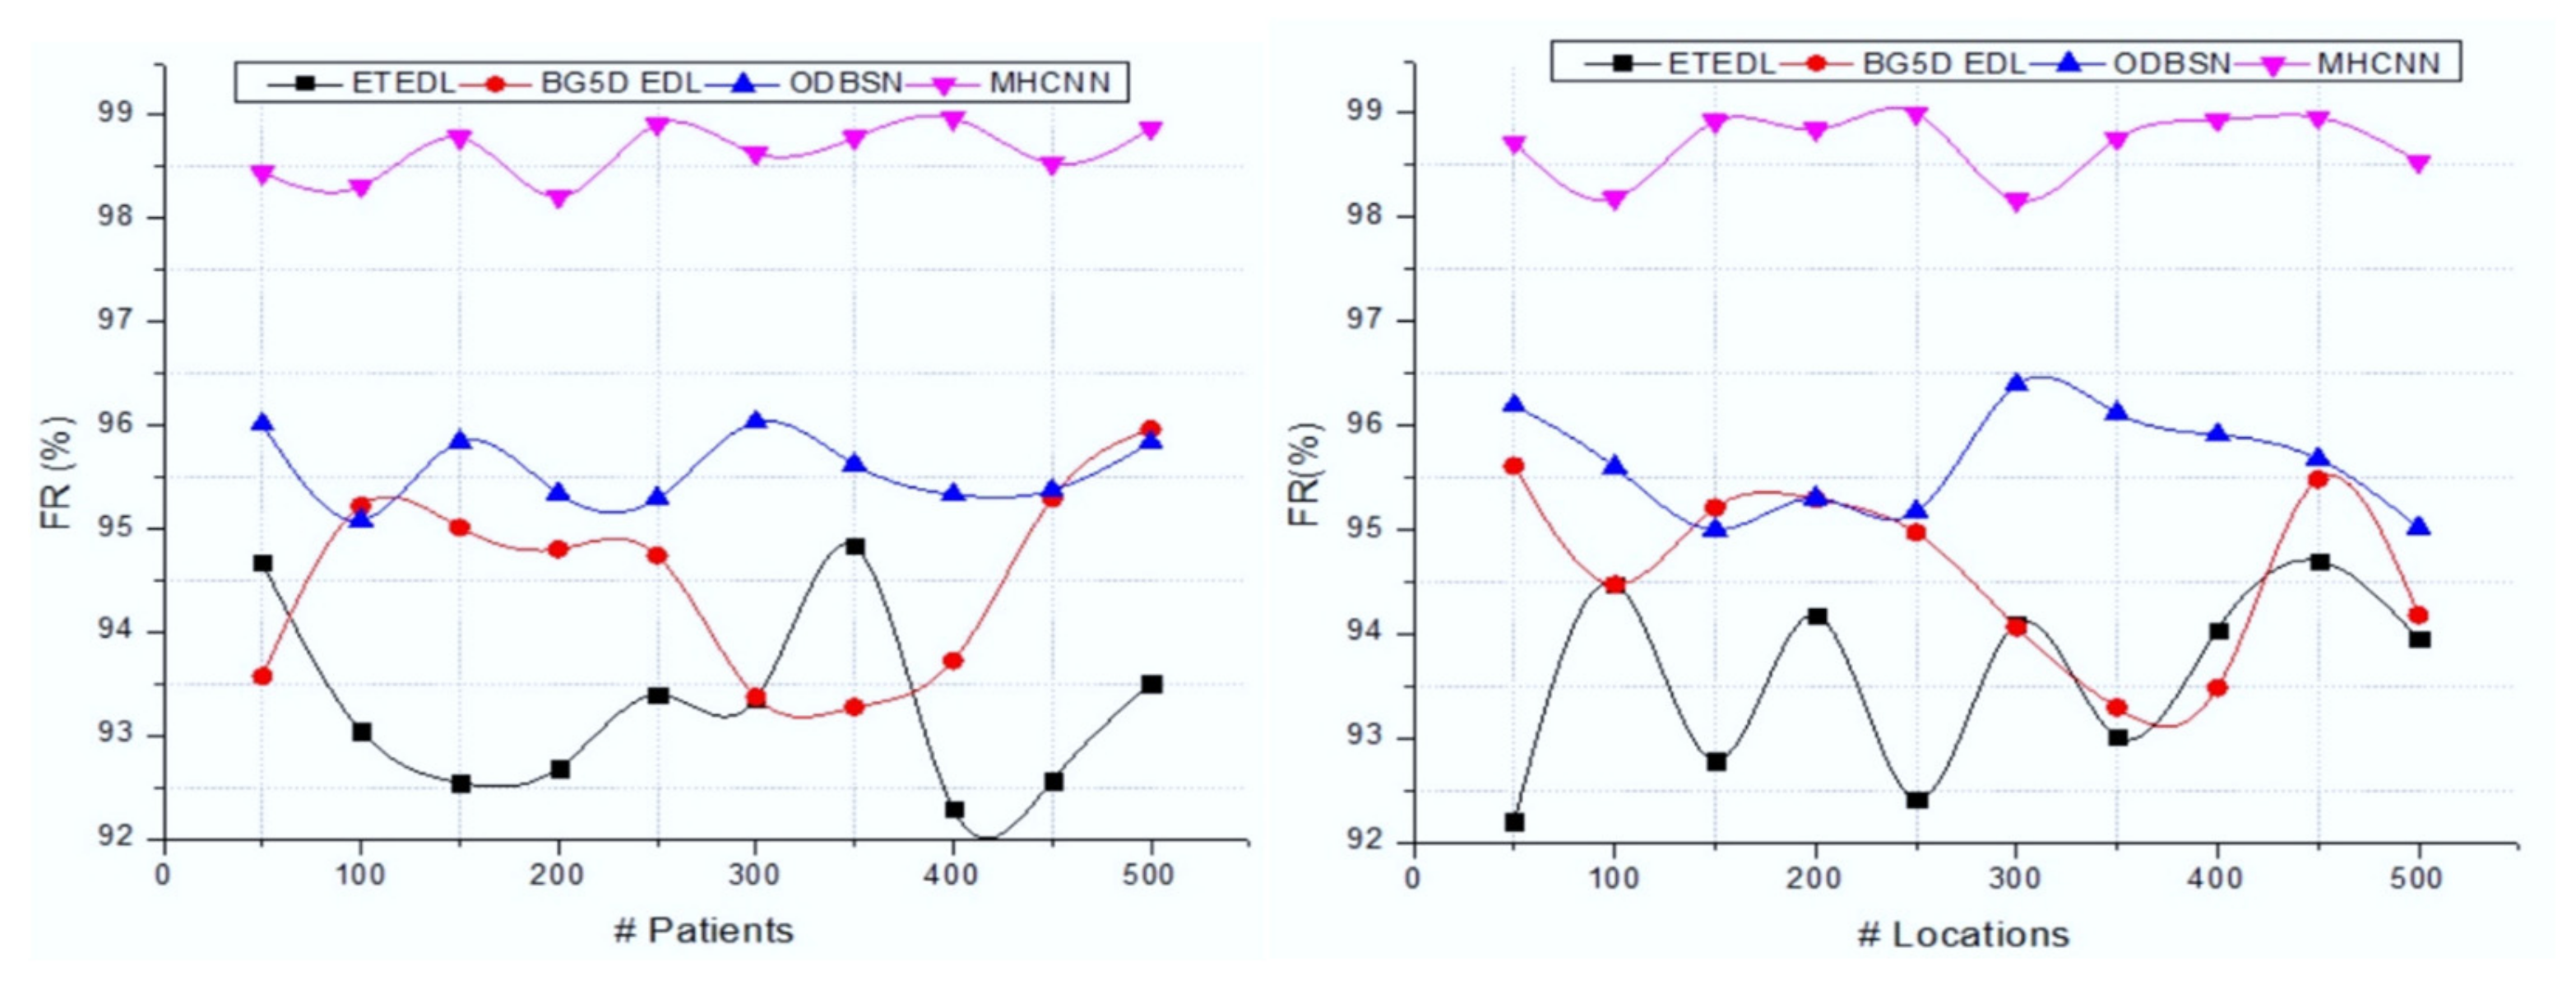
| Methods | Number of Patients | |||||||||
|---|---|---|---|---|---|---|---|---|---|---|
| 50 | 100 | 150 | 200 | 250 | 300 | 350 | 400 | 450 | 500 | |
| ETEDL | 92.47 | 93.96 | 94.23 | 92.44 | 93.53 | 94.45 | 94.9 | 94.05 | 92.71 | 93.91 |
| BG5D EDL | 94.54 | 93.67 | 94.4 | 93.74 | 93.1 | 93.89 | 94.65 | 94.02 | 93.84 | 93.57 |
| ODBSN | 95.43 | 95.7 | 95.67 | 95.89 | 96.61 | 96.38 | 96.53 | 96.17 | 96.05 | 96.2 |
| MHCNN | 98.85 | 98.78 | 98.74 | 98.33 | 98.5 | 98.44 | 98.34 | 98.81 | 98.56 | 98.67 |
| Methods | Number of Locations | |||||||||
| 50 | 100 | 150 | 200 | 250 | 300 | 350 | 400 | 450 | 500 | |
| ETEDL | 94.28 | 94.6 | 94.25 | 94.83 | 93.53 | 92.61 | 94.65 | 94.93 | 94.58 | 93.37 |
| BG5D EDL | 93.55 | 94.8 | 94.12 | 95.75 | 94.96 | 94.02 | 93.87 | 93.71 | 93.96 | 95.4 |
| ODBSN | 96.75 | 95.7 | 96.33 | 96.46 | 96.1 | 96.98 | 95.39 | 95.91 | 96.73 | 96.51 |
| MHCNN | 98.35 | 98.78 | 98.67 | 98.31 | 98.74 | 98.32 | 98.27 | 98.48 | 98.44 | 98.3 |
Publisher’s Note: MDPI stays neutral with regard to jurisdictional claims in published maps and institutional affiliations. |
© 2022 by the authors. Licensee MDPI, Basel, Switzerland. This article is an open access article distributed under the terms and conditions of the Creative Commons Attribution (CC BY) license (https://creativecommons.org/licenses/by/4.0/).
Share and Cite
Jaber, M.M.; Alameri, T.; Ali, M.H.; Alsyouf, A.; Al-Bsheish, M.; Aldhmadi, B.K.; Ali, S.Y.; Abd, S.K.; Ali, S.M.; Albaker, W.; et al. Remotely Monitoring COVID-19 Patient Health Condition Using Metaheuristics Convolute Networks from IoT-Based Wearable Device Health Data. Sensors 2022, 22, 1205. https://doi.org/10.3390/s22031205
Jaber MM, Alameri T, Ali MH, Alsyouf A, Al-Bsheish M, Aldhmadi BK, Ali SY, Abd SK, Ali SM, Albaker W, et al. Remotely Monitoring COVID-19 Patient Health Condition Using Metaheuristics Convolute Networks from IoT-Based Wearable Device Health Data. Sensors. 2022; 22(3):1205. https://doi.org/10.3390/s22031205
Chicago/Turabian StyleJaber, Mustafa Musa, Thamer Alameri, Mohammed Hasan Ali, Adi Alsyouf, Mohammad Al-Bsheish, Badr K. Aldhmadi, Sarah Yahya Ali, Sura Khalil Abd, Saif Mohammed Ali, Waleed Albaker, and et al. 2022. "Remotely Monitoring COVID-19 Patient Health Condition Using Metaheuristics Convolute Networks from IoT-Based Wearable Device Health Data" Sensors 22, no. 3: 1205. https://doi.org/10.3390/s22031205