
Humoral Responses and Chronic GVHD Exacerbation after COVID-19 Vaccination Post Allogeneic Stem Cell Transplantation

 , ,
, ,  , , ,
, , ,
Abstract
:1. Introduction
2. Materials and Methods
2.1. Study Design
2.2. Neutralizing Capacity of SARS-CoV-2 Antibodies in Surrogate Virus Neutralization Assays
2.3. Cytokine Levels
2.4. Statistical Analysis
3. Results
4. Discussion
5. Conclusions
Author Contributions
Funding
Institutional Review Board Statement
Informed Consent Statement
Data Availability Statement
Acknowledgments
Conflicts of Interest
Appendix A

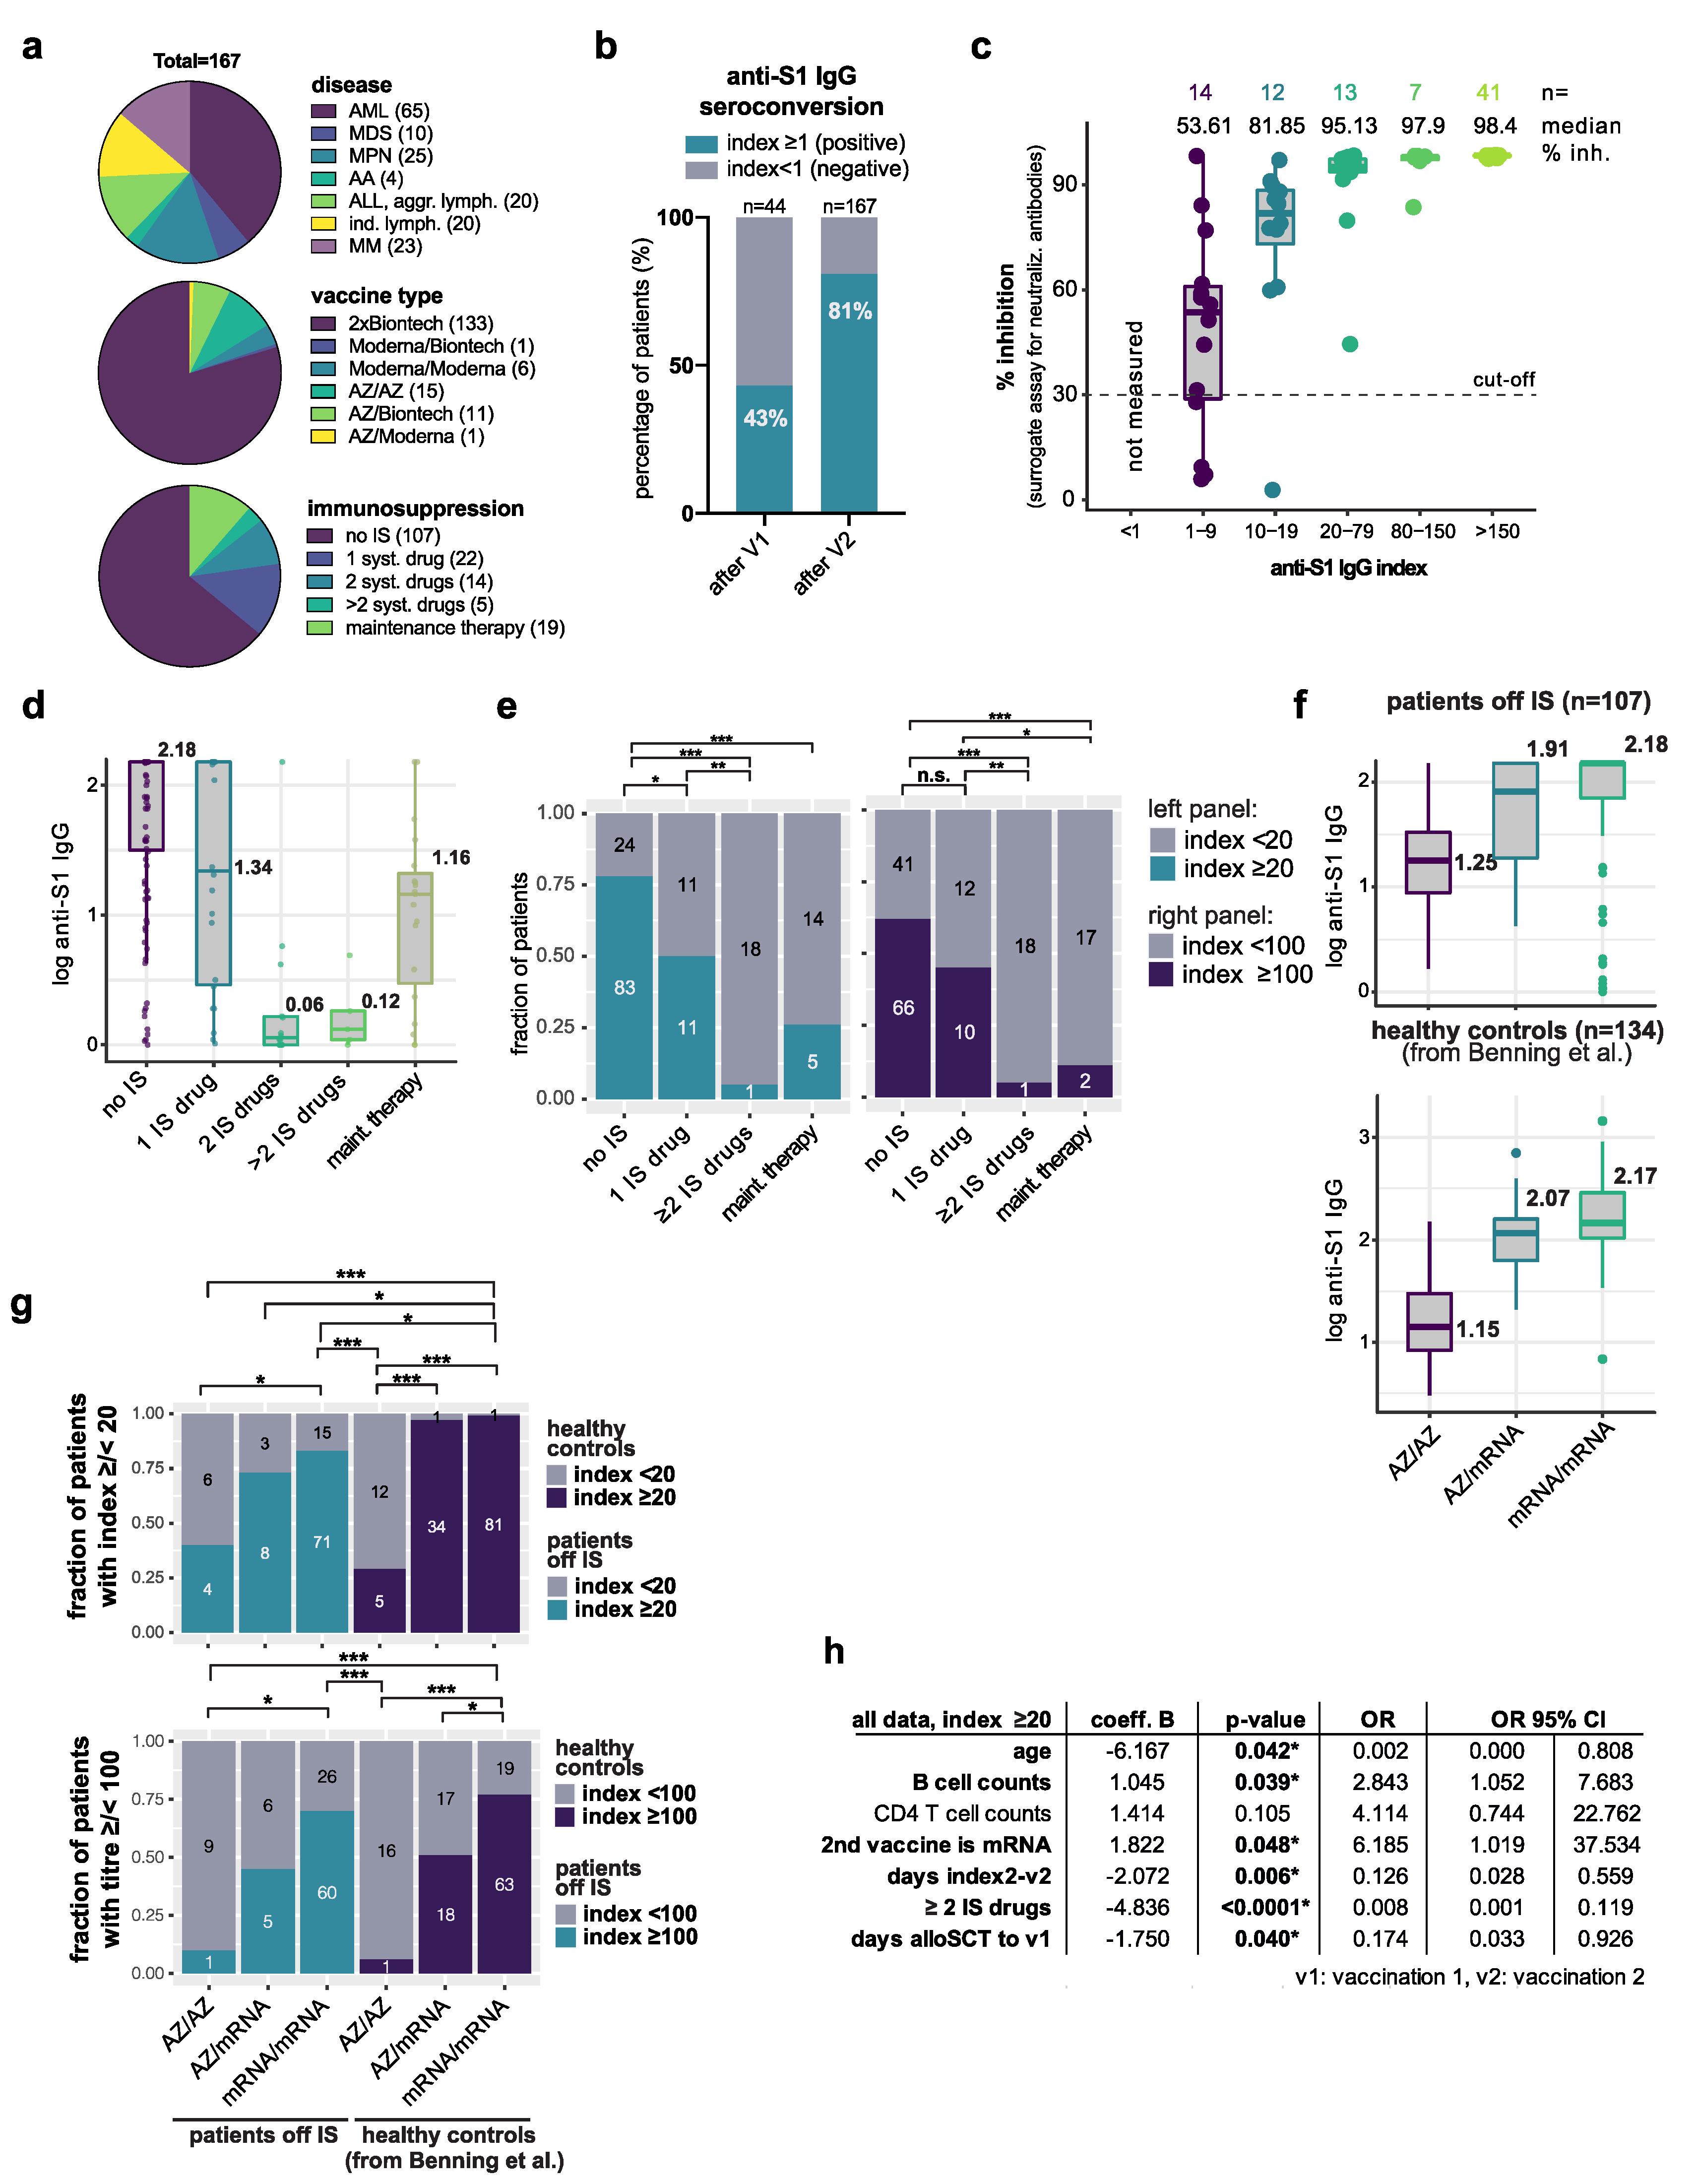
| Values | Median | Percentage (%) | |
|---|---|---|---|
| Total Patients post alloSCT | 167 | ||
| disease type | |||
| AML | 65 | 38.9 | |
| MDS | 10 | 6.0 | |
| MPN | 25 | 15.0 | |
| Aplastic Anemia | 4 | 2.4 | |
| ALL, aggressive lymphoma | 20 | 12.0 | |
| indolent lymphoma | 20 | 12.0 | |
| Multiple Myeloma | 23 | 13.8 | |
| age | 19–79 | 60 | |
| age above 60 years | 80 | 47.9 | |
| sex | |||
| female | 65 | 38.9 | |
| male | 102 | 61.1 | |
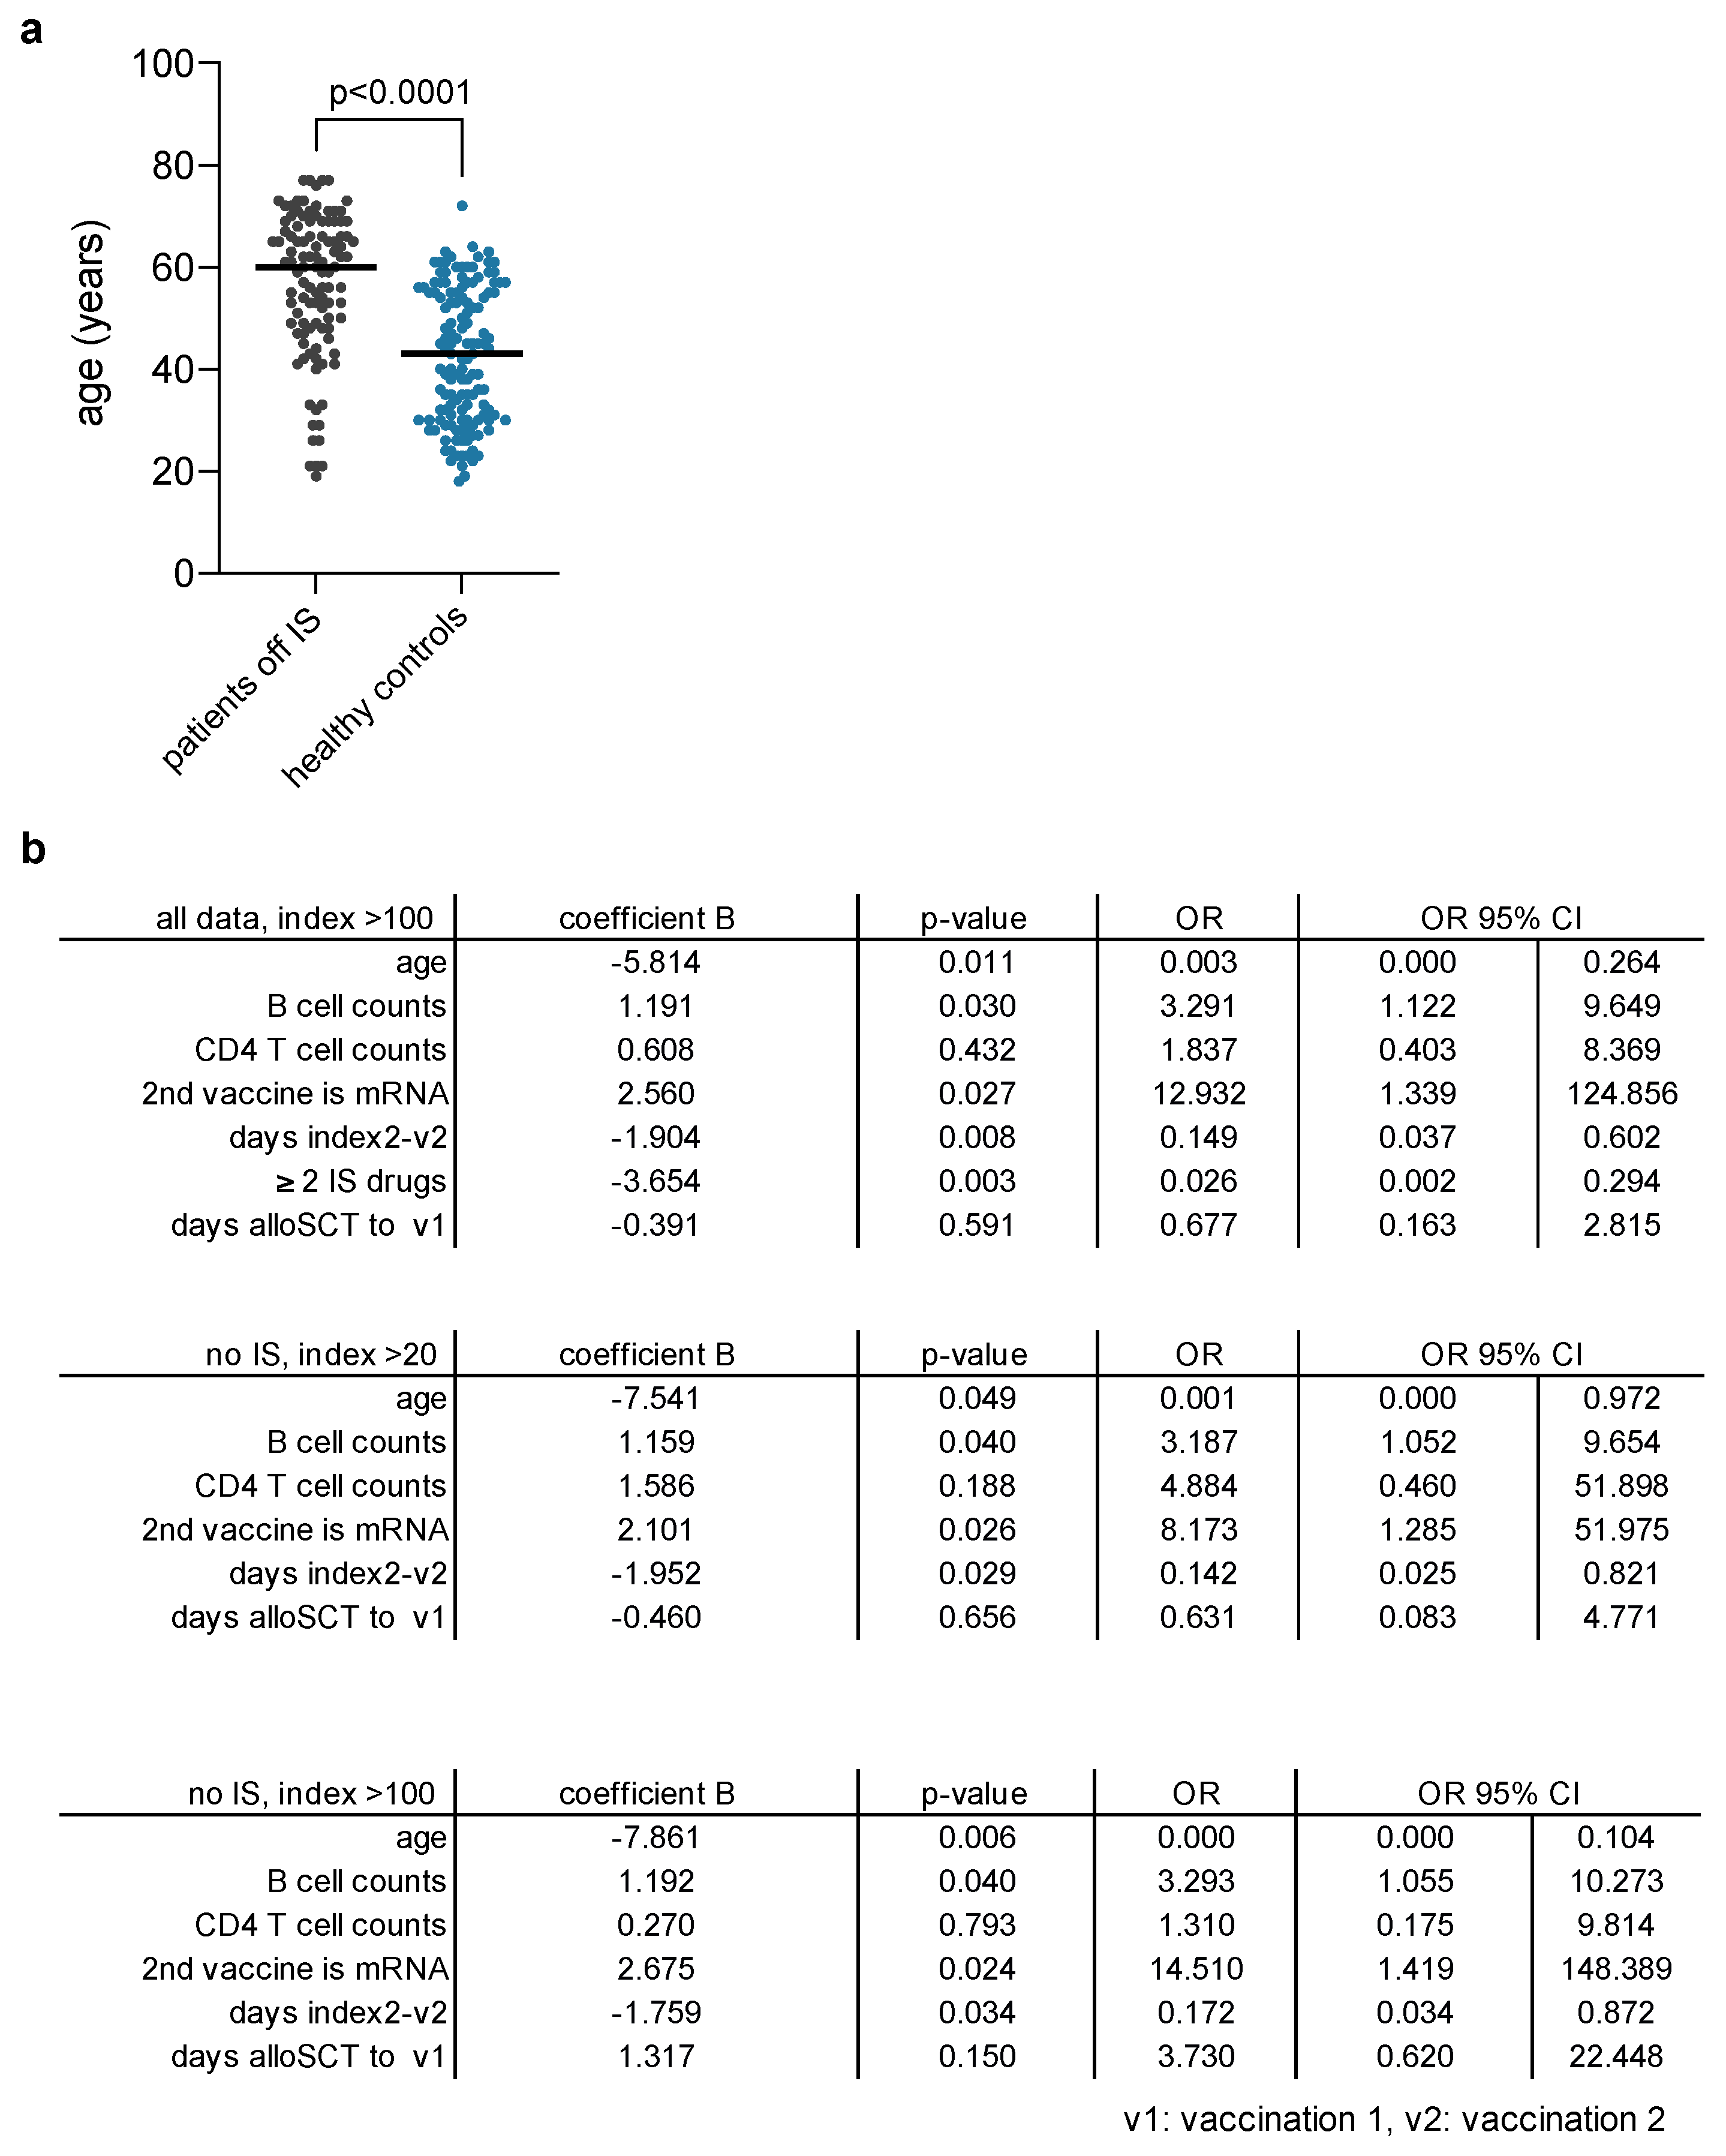
| Days last alloSCT to 1st vaccination | |||
| 106–9111 | 1215 | ||
| Remission status | |||
| complete remission | 158 | 94.6 | |
| Immunosuppression (IS) | |||
| no IS | 107 | 64.1 | |
| one systemic IS drug | 22 | 13.2 | |
| 2 systemic IS drugs | 14 | 8.4 | |
| 3 or more systemic IS drugs | 5 | 3.0 | |
| total IS | 41 | 24.6 | |
| maintenance therapy | 19 | 11.4 | |
| Seroconversion | |||
| positive S-AK after V1 | 19/44 | 43.2 | |
| positive S-AK after V2 | 135/167 | 80.8 | |
| positive N-AK after V2 | 0 | 0.0 | |
| vaccines | |||
| AZ/AZ | 15 | 9.0 | |
| AZ/Moderna | 1 | 0.6 | |
| AZ/Biontech | 11 | 6.6 | |
| Biontech/Biontech | 133 | 79.6 | |
| Moderna/Biontech | 1 | 0.6 | |
| Moderna/Moderna | 6 | 3.6 | |
| type of regimen | |||
| homologous AZ/AZ | 15 | 9.0 | |
| heterolohous AZ/mRNA | 12 | 7.2 | |
| homologous mRNA/mRNA | 140 | 83.8 |


References
- Mamez, A.-C.; Pradier, A.; Giannotti, F.; Petitpas, A.; Urdiola, M.F.; Vu, D.-L.; Masouridi-Levrat, S.; Morin, S.; Dantin, C.; Clerc-Renaud, D.; et al. Antibody responses to SARS-CoV2 vaccination in allogeneic hematopoietic stem cell transplant recipients. Bone Marrow Transplant. 2021, 56, 3094–3096. [Google Scholar] [CrossRef] [PubMed]
- Canti, L.; Humblet-Baron, S.; Desombere, I.; Neumann, J.; Pannus, P.; Heyndrickx, L.; Henry, A.; Servais, S.; Willems, E.; Ehx, G.; et al. Predictors of neutralizing antibody response to BNT162b2 vaccination in allogeneic hematopoietic stem cell transplant recipients. J. Hematol. Oncol. 2021, 14, 174. [Google Scholar] [CrossRef] [PubMed]
- Benning, L.; Töllner, M.; Hidmark, A.; Schaier, M.; Nusshag, C.; Kälble, F.; Reichel, P.; Buylaert, M.; Grenz, J.; Ponath, G.; et al. Heterologous ChAdOx1 nCoV-19/BNT162b2 Prime-Boost Vaccination Induces Strong Humoral Responses among Health Care Workers. Vaccines 2021, 9, 857. [Google Scholar] [CrossRef] [PubMed]
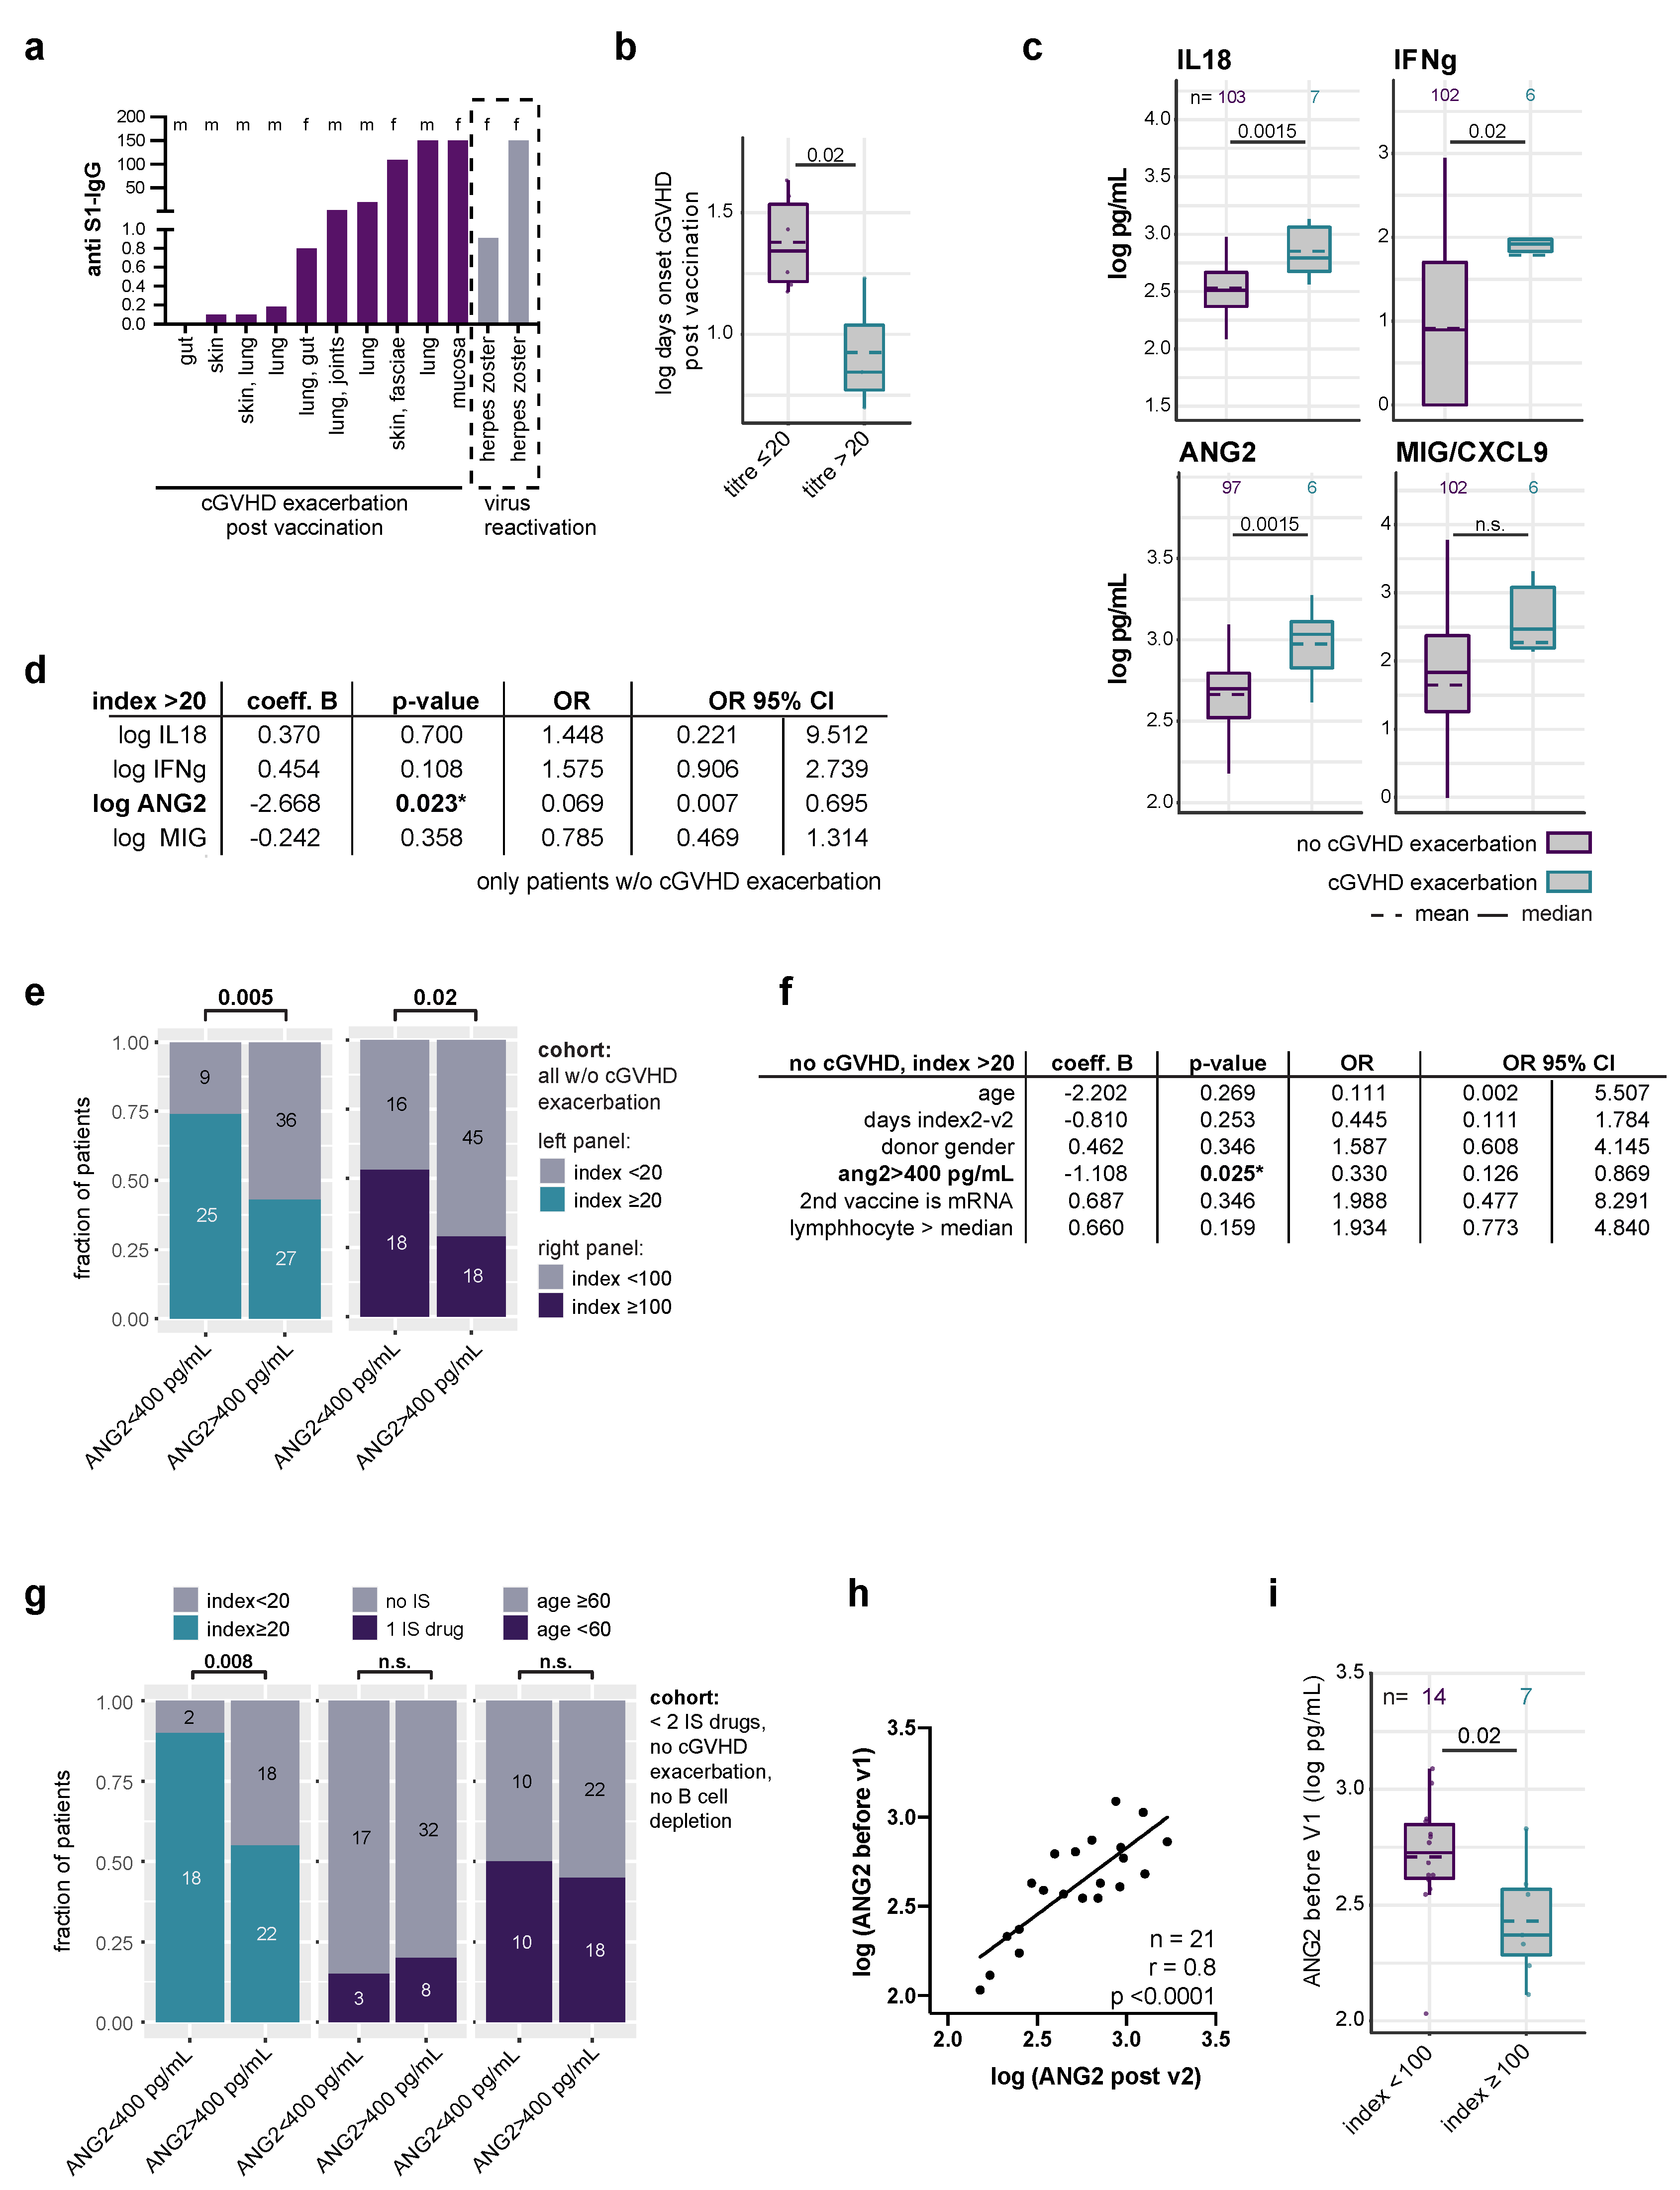
- Luft, T.; Dietrich, S.; Falk, C.; Conzelmann, M.; Hess, M.; Benner, A.; Neumann, F.; Isermann, B.; Hegenbart, U.; Ho, A.D.; et al. Steroid-refractory GVHD: T-cell attack within a vulnerable endothelial system. Blood 2011, 118, 1685–1692. [Google Scholar] [CrossRef] [PubMed] [Green Version]
- Giesen, N.; Schwarzbich, M.-A.; Dischinger, K.; Becker, N.; Hummel, M.; Benner, A.; Radujkovic, A.; Müller-Tidow, C.; Dreger, P.; Luft, T. CXCL9 Predicts Severity at the Onset of Chronic Graft-versus-host Disease. Transplantation 2020, 104, 2354–2359. [Google Scholar] [CrossRef] [PubMed]
- Radujkovic, A.; Kordelas, L.; Dai, H.; Schult, D.; Majer-Lauterbach, J.; Beelen, D.; Müller-Tidow, C.; Dreger, P.; Luft, T. Interleukin-18 and outcome after allogeneic stem cell transplantation: A retrospective cohort study. EBioMedicine 2019, 49, 202–212. [Google Scholar] [CrossRef] [PubMed] [Green Version]
- Tartari, F.; Spadotto, A.; Zengarini, C.; Zanoni, R.; Guglielmo, A.; Adorno, A.; Valzania, C.; Pileri, A. Herpes zoster in COVID-19-positive patients. Int. J. Dermatol. 2020, 59, 1028–1029. [Google Scholar] [CrossRef] [PubMed]
- Katsikas Triantafyllidis, K.; Giannos, P.; Mian, I.T.; Kyrtsonis, G.; Kechagias, K.S. Varicella Zoster Virus Reactivation Following COVID-19 Vaccination: A Systematic Review of Case Reports. Vaccines 2021, 9, 1013. [Google Scholar] [CrossRef] [PubMed]
- Orsatti, L.; Stiehl, T.; Dischinger, K.; Speziale, R.; Di Pasquale, P.; Monteagudo, E.; Müller-Tidow, C.; Radujkovic, A.; Dreger, P.; Luft, T. Kynurenine pathway activation and deviation to anthranilic and kynurenic acid in fibrosing chronic graft-versus-host disease. Cell Rep. Med. 2021, 2, 100409. [Google Scholar] [CrossRef] [PubMed]
- Le Bourgeois, A.; Coste-Burel, M.; Guillaume, T.; Peterlin, P.; Garnier, A.; Béné, M.C.; Chevallier, P. Safety and Antibody Response After 1 and 2 Doses of BNT162b2 mRNA Vaccine in Recipients of Allogeneic Hematopoietic Stem Cell Transplant. JAMA Netw. Open 2021, 4, e2126344. [Google Scholar] [CrossRef] [PubMed]
- Smadja, D.M.; Guerin, C.L.; Chocron, R.; Yatim, N.; Boussier, J.; Gendron, N.; Khider, L.; Hadjadj, J.; Goudot, G.; Debuc, B.; et al. Angiopoietin-2 as a marker of endothelial activation is a good predictor factor for intensive care unit admission of COVID-19 patients. Angiogenesis 2020, 23, 611–620. [Google Scholar] [CrossRef] [PubMed]


Publisher’s Note: MDPI stays neutral with regard to jurisdictional claims in published maps and institutional affiliations. |
© 2022 by the authors. Licensee MDPI, Basel, Switzerland. This article is an open access article distributed under the terms and conditions of the Creative Commons Attribution (CC BY) license (https://creativecommons.org/licenses/by/4.0/).
Share and Cite
Pabst, C.; Benning, L.; Liebers, N.; Janssen, M.; Caille, L.; Speer, C.; He, L.; Schubert, M.-L.; Simons, L.; Hegenbart, U.; et al. Humoral Responses and Chronic GVHD Exacerbation after COVID-19 Vaccination Post Allogeneic Stem Cell Transplantation. Vaccines 2022, 10, 330. https://doi.org/10.3390/vaccines10020330
Pabst C, Benning L, Liebers N, Janssen M, Caille L, Speer C, He L, Schubert M-L, Simons L, Hegenbart U, et al. Humoral Responses and Chronic GVHD Exacerbation after COVID-19 Vaccination Post Allogeneic Stem Cell Transplantation. Vaccines. 2022; 10(2):330. https://doi.org/10.3390/vaccines10020330
Chicago/Turabian StylePabst, Caroline, Louise Benning, Nora Liebers, Maike Janssen, Leandra Caille, Claudius Speer, Lixiazi He, Maria-Luisa Schubert, Laura Simons, Ute Hegenbart, and et al. 2022. "Humoral Responses and Chronic GVHD Exacerbation after COVID-19 Vaccination Post Allogeneic Stem Cell Transplantation" Vaccines 10, no. 2: 330. https://doi.org/10.3390/vaccines10020330