
Platelet Distribution Width and Increased D-Dimer at Admission Predicts Subsequent Development of ARDS in COVID-19 Patients

 ,
,
Abstract
:1. Introduction
2. Materials and Methods
2.1. Patient Selection and Data Collection
- Moderate severity COVID-19—with manifestation of pneumonia and saturation of hemoglobin on room air during hospitalization ≥ 90%
- Severe COVID-19—severe bilateral pneumonia plus one of the following: respiratory rate > 30 breaths per minute or SpO2 < 90% on room air [8].
- Mild ARDS: 200 mmHg < PaO2/FiO2 ≤ 300 mmHg (with PEEP or CPAP ≥ 5 cmH2O, or non-ventilated)
- Moderate ARDS: 100 mmHg < PaO2/FiO2 ≤ 200 mmHg (with PEEP ≥ 5 cmH2O, or non-ventilated)
- Severe ARDS: PaO2/FiO2 ≤ 100 mmHg (with PEEP ≥ 5 cmH2O, or non-ventilated)” [9].
2.2. Laboratory Measurements
2.3. Statistical Analysis
3. Results
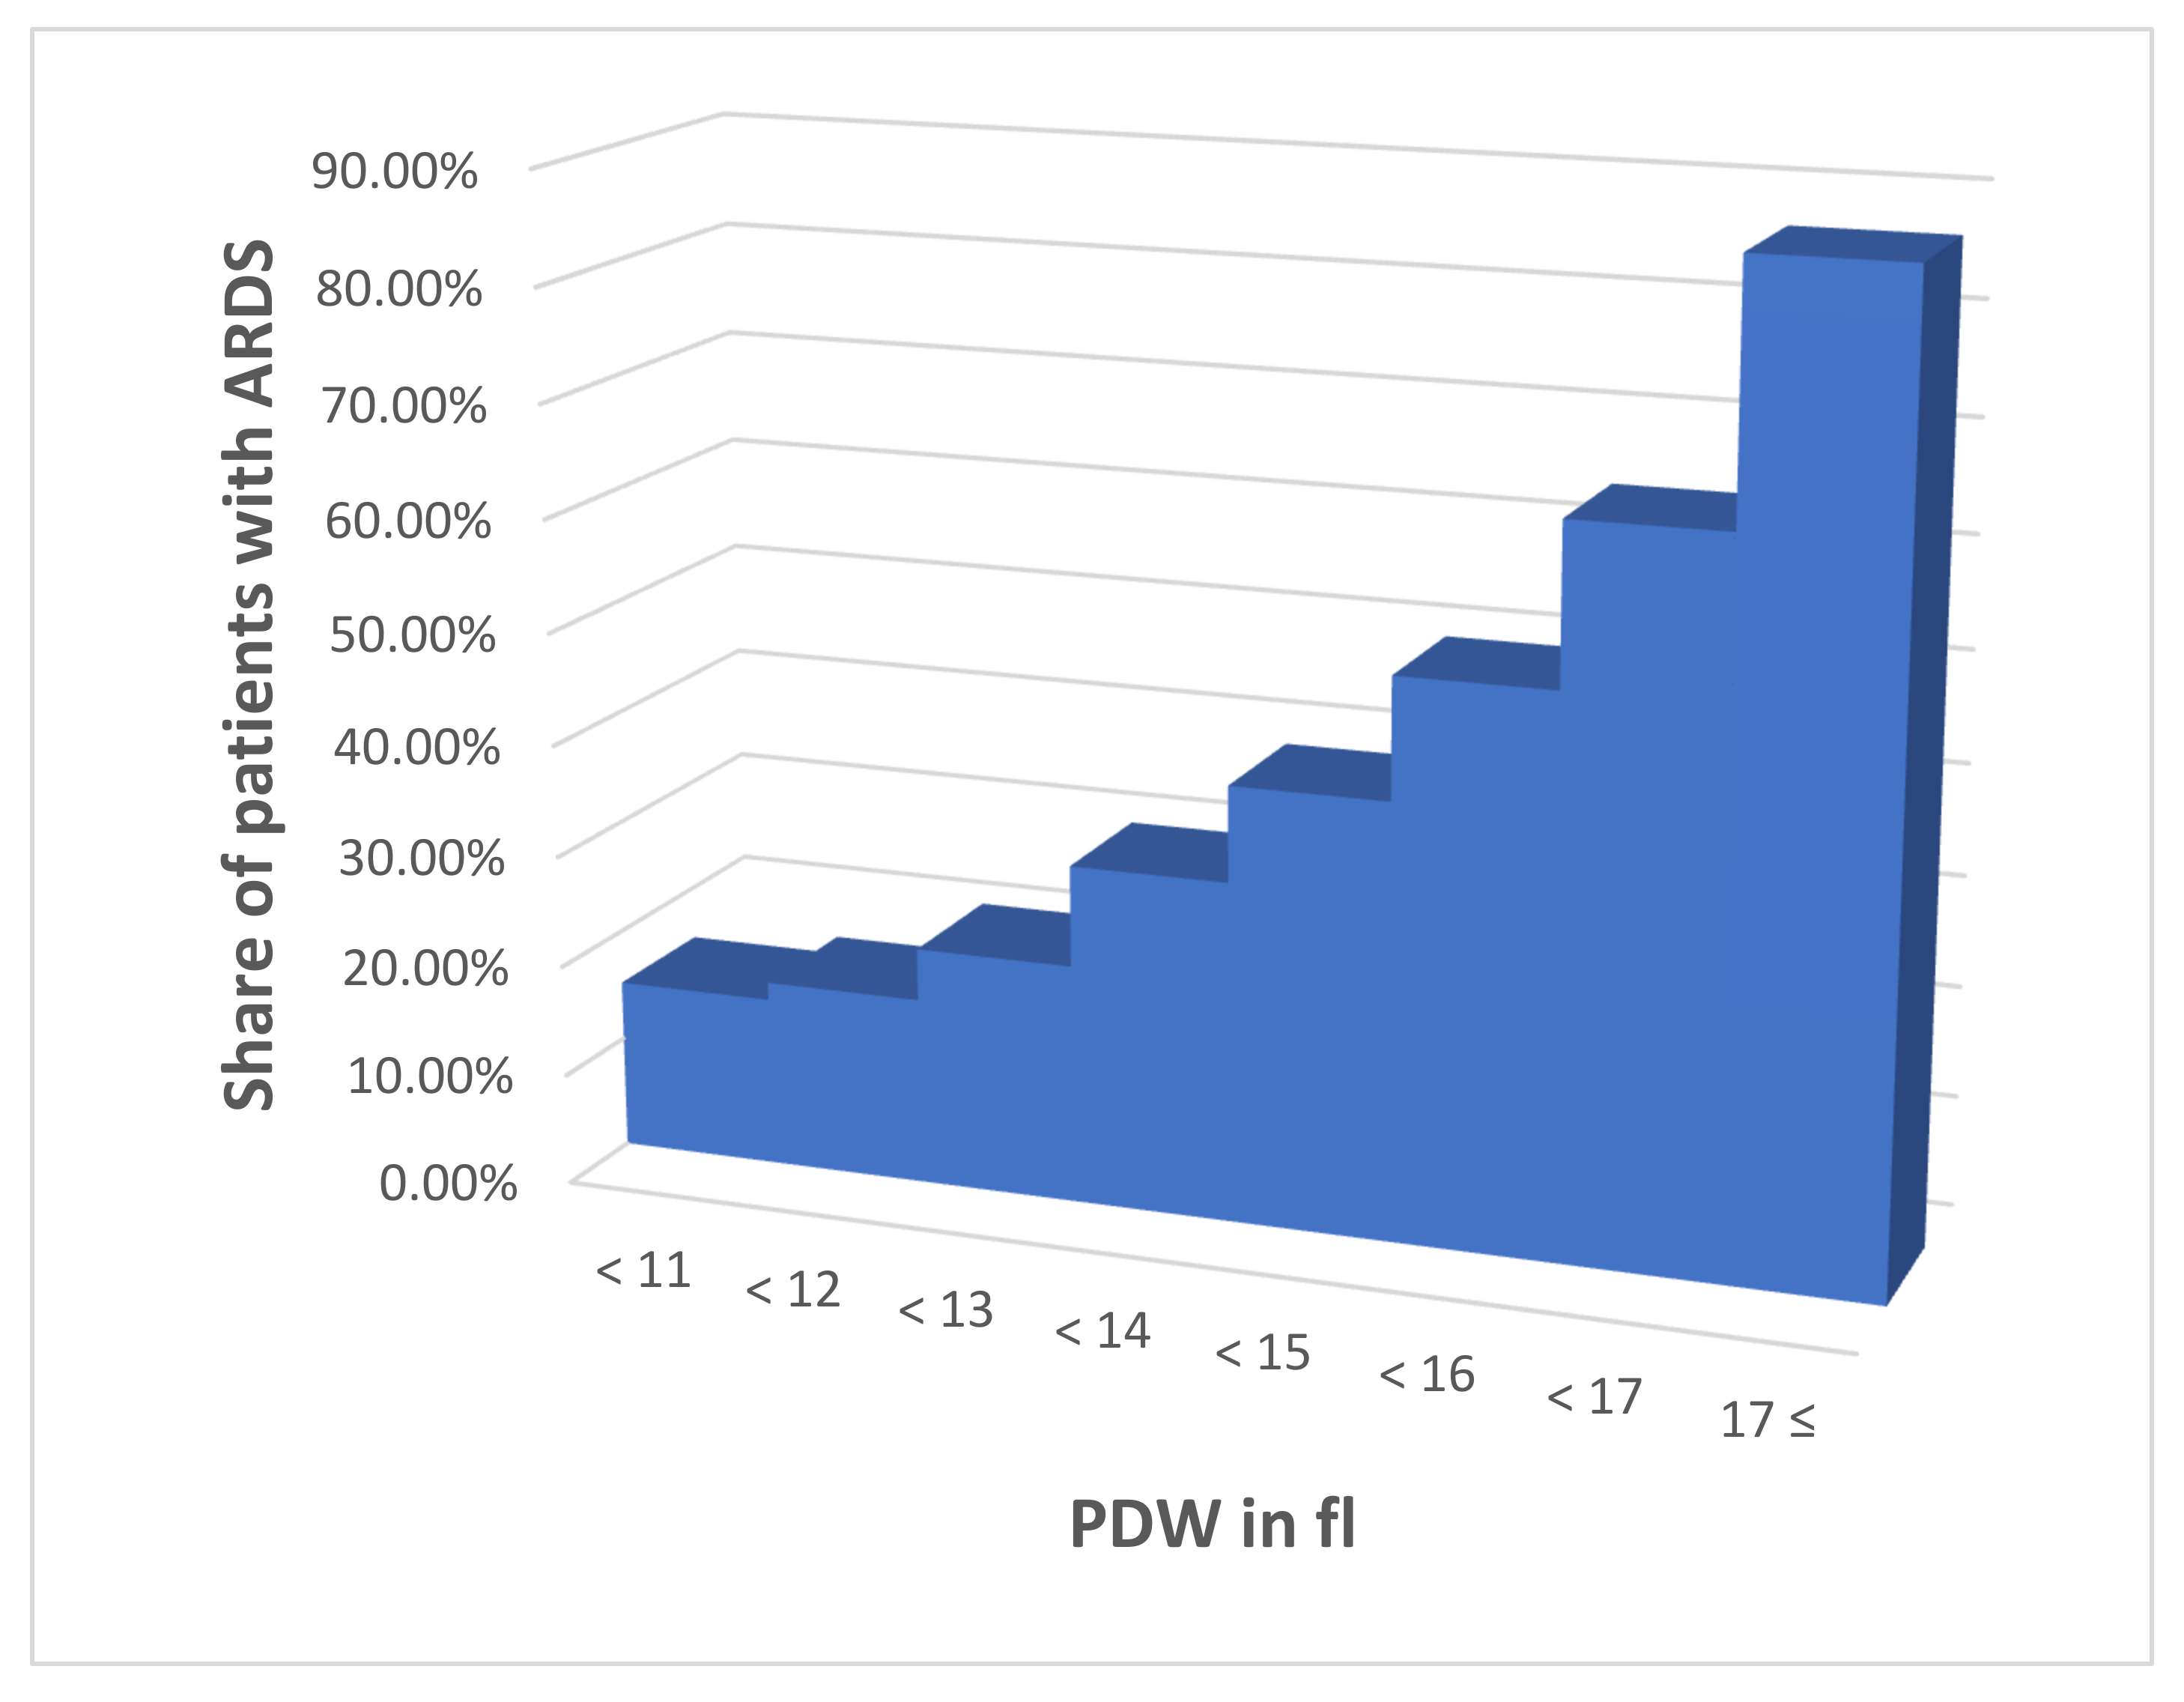
- PDW < 11
- 11 ≤ PDW < 12
- 12 ≤ PDW < 13
- 13 ≤ PDW < 14
- 14 ≤ PDW < 15
- 15 ≤ PDW < 16
- 16 ≤ PDW < 17
- 17 ≤ PDW
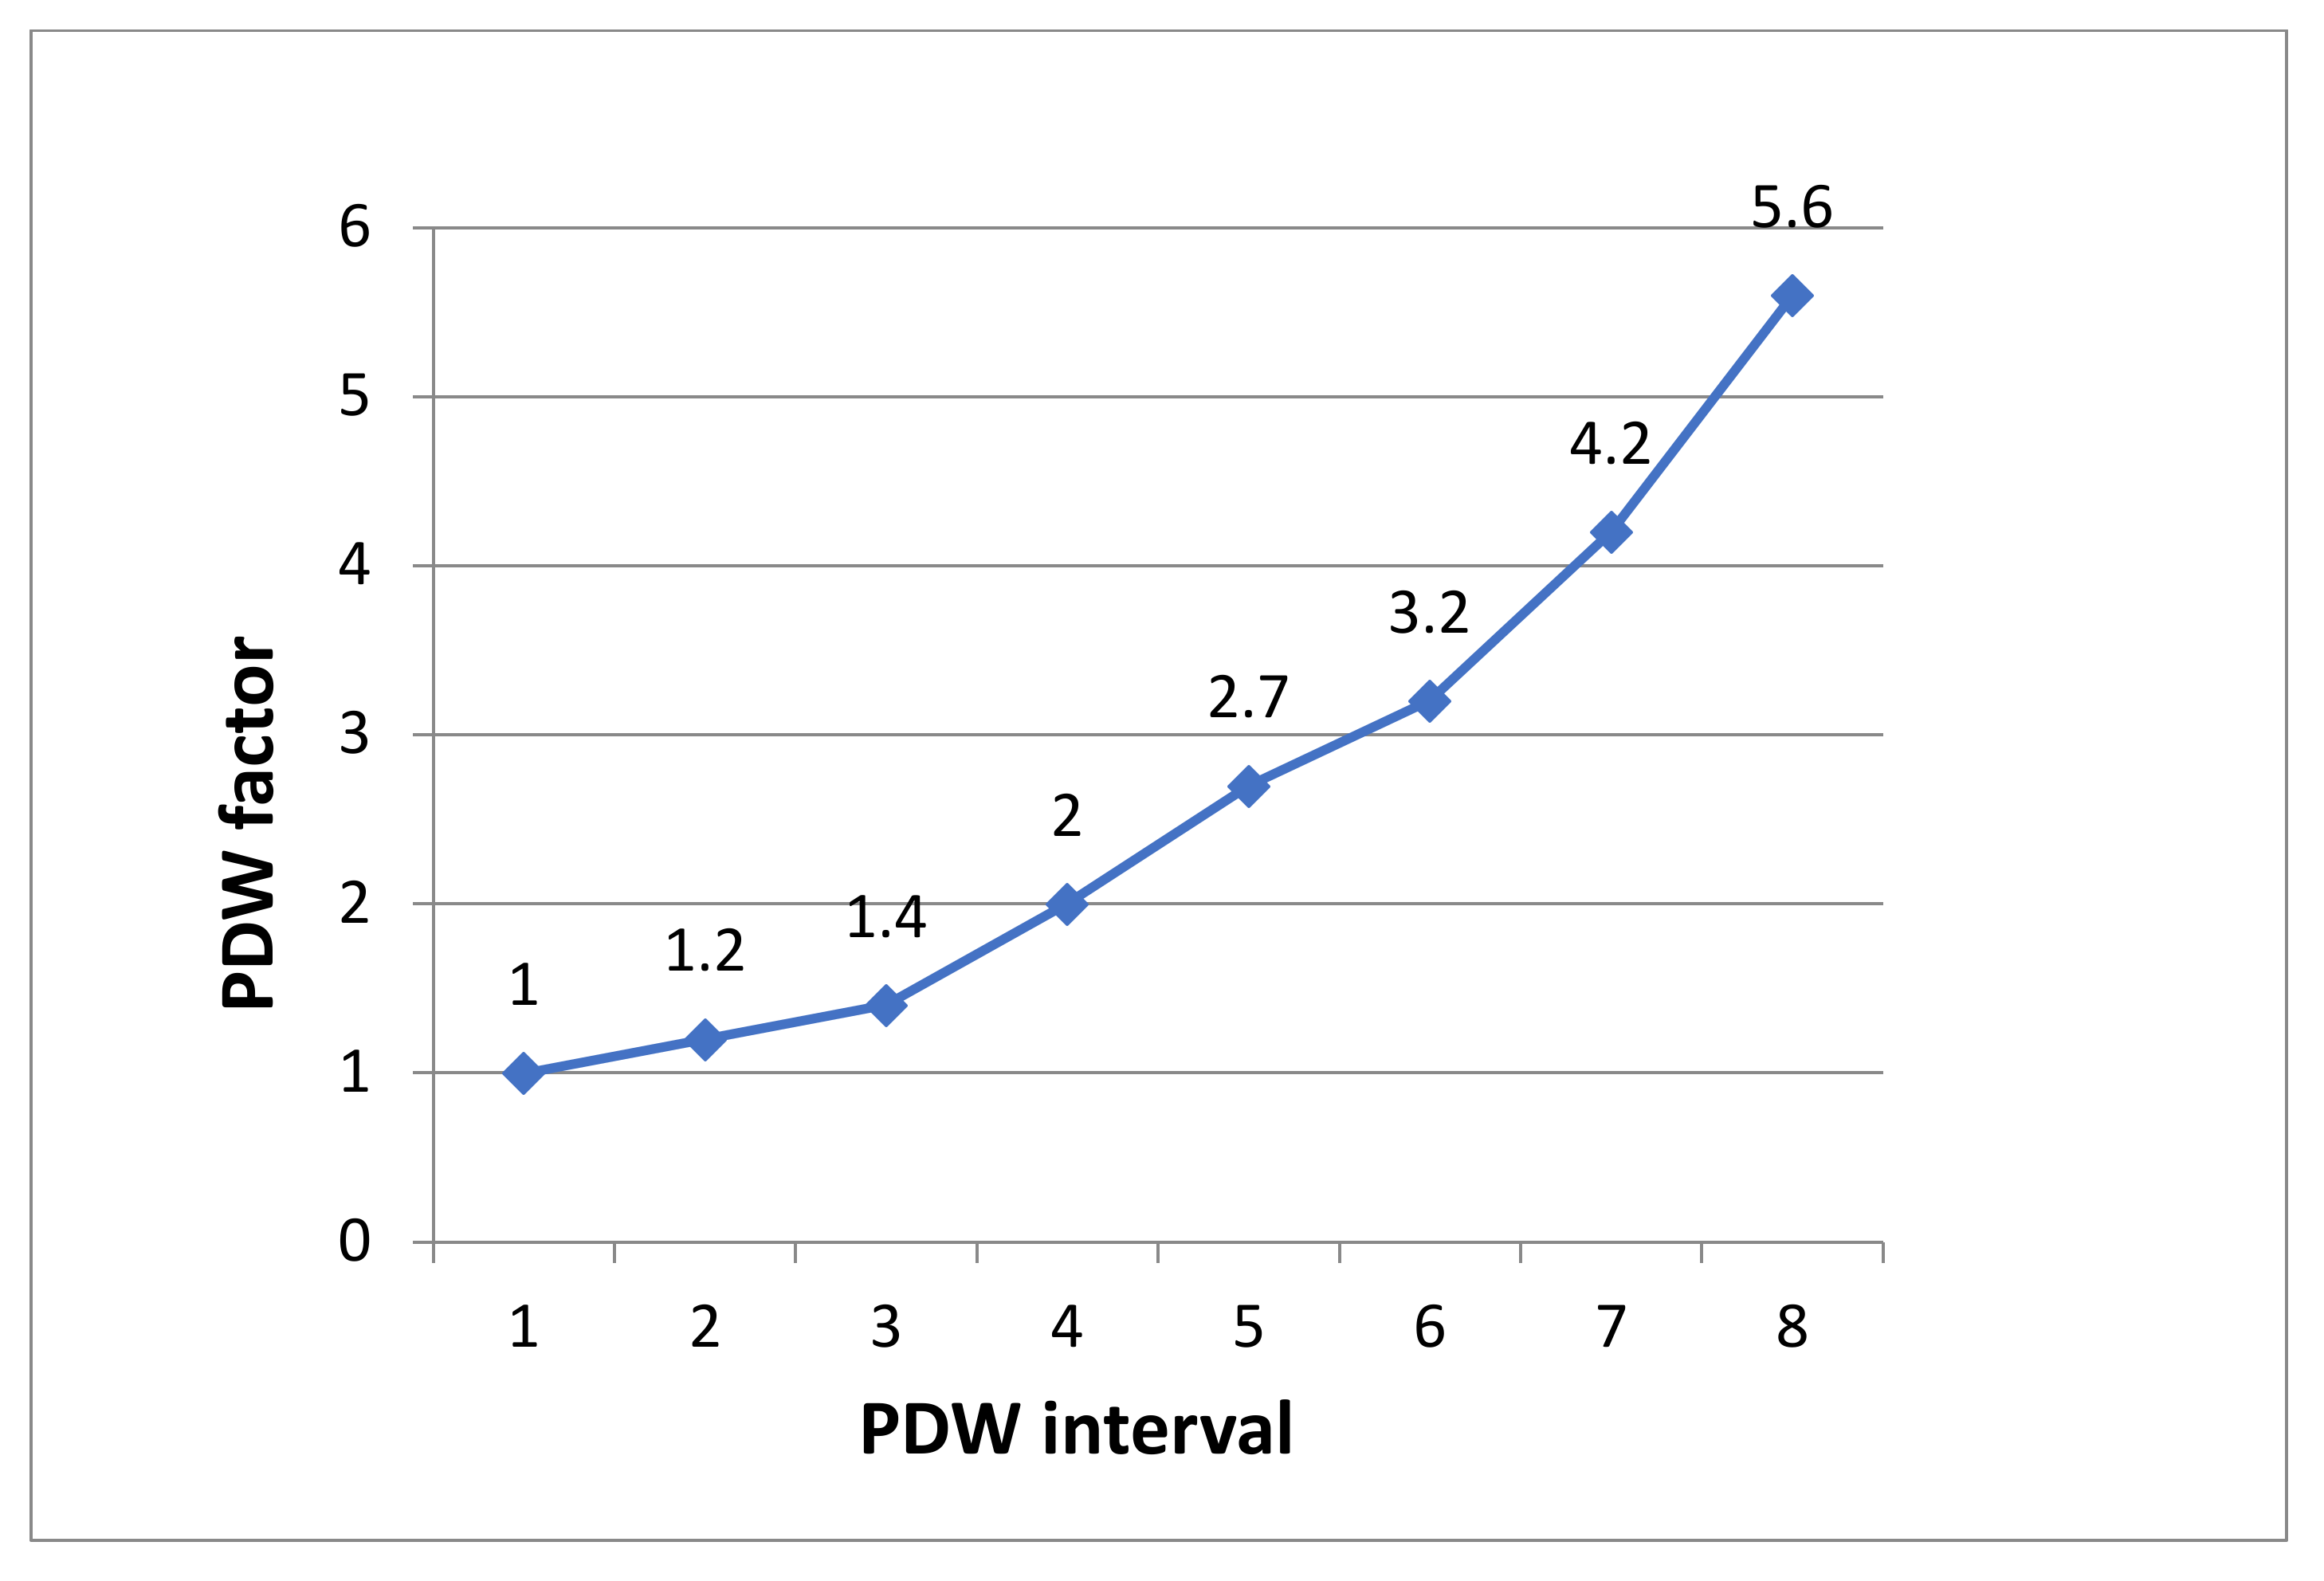
- interval 1
- 1;
- interval 2
- 1.2;
- interval 3
- 1.4;
- interval 4
- 2;
- interval 5
- 2.7;
- interval 6
- 3.2;
- interval 7
- 4.2;
- interval 8
4. Discussion
5. Conclusions
Author Contributions
Funding
Institutional Review Board Statement
Informed Consent Statement
Data Availability Statement
Acknowledgments
Conflicts of Interest
References
- Zhou, F.; Yu, T.; Du, R.; Fan, G.; Liu, Y.; Liu, Z.; Xiang, J.; Wang, Y.; Song, B.; Gu, X.; et al. Clinical course and risk factors for mortality of adult inpatients with COVID-19 in Wuhan, China: A retrospective cohort study. Lancet 2020, 395, 1054–1062. [Google Scholar] [CrossRef]
- Gu, S.X.; Tyagi, T.; Jain, K.; Gu, V.W.; Lee, S.H.; Hwa, J.M.; Kwan, J.M.; Krause, D.S.; Lee, A.I.; Halene, S.; et al. Thrombocytopathy and endotheliopathy: Crucial contributors to COVID-19 thromboinflammation. Nat. Rev. Cardiol. 2020, 18, 194–209. [Google Scholar] [CrossRef] [PubMed]
- Hottz, E.D.; Bozza, F.A.; Bozza, P. Platelets in Immune Response to Virus and Immunopathology of Viral Infections. Front. Med. 2018, 5, 121. [Google Scholar] [CrossRef] [PubMed]
- Koupenova, M.; Clancy, L.; Corkrey, H.A.; Freedman, J.E. Circulating Platelets as Mediators of Immunity, Inflammation, and Thrombosis. Circ. Res. 2018, 122, 337–351. [Google Scholar] [CrossRef]
- Du, F.; Liu, B.; Zhang, S. COVID-19: The role of excessive cytokine release and potential ACE2 down-regulation in promoting hypercoagulable state associated with severe illness. J. Thromb. Thrombolysis 2020, 51, 313–329. [Google Scholar] [CrossRef]
- Thompson, C.B.; Jakubowski, J.A.; Quinn, P.G.; Deykin, D.; Valeri, C.R. Platelet size and age determine platelet function independently. Blood 1984, 63, 1372–1375. [Google Scholar] [CrossRef] [PubMed] [Green Version]
- O’Donnell, J.S.; Peyvandi, F.; Martin-Loeches, I. Pulmonary immuno-thrombosis in COVID-19 ARDS pathogenesis. Intensive Care Med. 2021, 47, 899–902. [Google Scholar] [CrossRef] [PubMed]
- World Health Organization. Living Guidance for Clinical Management of COVID-19. Available online: https://www.who.int/publications/i/item/WHO-2019-nCoV-clinical-2021-2 (accessed on 1 April 2022).
- Riviello, E.D.; Kiviri, W.; Twagirumugabe, T.; Mueller, A.L.; Banner-Goodspeed, V.; Officer, L.; Novack, V.; Mutumwinka, M.; Talmor, D.S.; Fowler, R.A. Hospital Incidence and Outcomes of the Acute Respiratory Distress Syndrome Using the Kigali Modification of the Berlin Definition. Am. J. Respir. Crit. Care Med. 2016, 193, 52–59. [Google Scholar] [CrossRef] [PubMed]
- Sharma, S.; Danckers, M.; Sanghavi, D.; Chakraborty, R.K. High Flow Nasal Cannula; StatPearls Publishing: Treasure Island, FL, USA, 2022. [Google Scholar]
- Seyoum, M.; Enawgaw, B.; Melku, M. Human blood platelets and viruses: Defense mechanism and role in the removal of viral pathogens. Thromb. J. 2018, 16, 1–6. [Google Scholar] [CrossRef] [PubMed]
- Zhang, S.; Liu, Y.; Wang, X.; Yang, L.; Li, H.; Wang, Y.; Liu, M.; Zhao, X.; Xie, Y.; Yang, Y.; et al. SARS-CoV-2 binds platelet ACE2 to enhance thrombosis in COVID-19. J. Hematol. Oncol. 2020, 13, 120. [Google Scholar] [CrossRef] [PubMed]
- Vagdatli, E.; Gounari, E.; Lazaridou, E.; Katsibourlia, E.; Tsikopoulou, F.; Labrianou, I. Platelet distribution width: A simple, practical and specific marker of activation of coagulation. Hippokratia 2010, 14, 28–32. [Google Scholar] [PubMed]
- Golebiewska, E.M.; Poole, A.W. Platelet secretion: From haemostasis to wound healing and beyond. Blood Rev. 2014, 29, 153–162. [Google Scholar] [CrossRef] [PubMed] [Green Version]
- Gao, Y.; Li, Y.; Yu, X.; Guo, S.; Ji, X.; Sun, T.; Lan, C.; Lavergne, V.; Ghannoum, M.; Li, L. The Impact of Various Platelet Indices as Prognostic Markers of Septic Shock. PLoS ONE 2014, 9, e103761. [Google Scholar] [CrossRef] [PubMed]
- Nakamichi, K.; Shen, J.Z.; Lee, C.S.; Lee, A.; Roberts, E.A.; Simonson, P.D.; Roychoudhury, P.; Andriesen, J.; Randhawa, A.K.; Mathias, P.C.; et al. Hospitalization and mortality associated with SARS-CoV-2 viral clades in COVID-19. Sci. Rep. 2021, 11, 1–11. [Google Scholar] [CrossRef] [PubMed]


| Parameter and Indexes | With ARDS (190) | Without ARDS (303) | p |
|---|---|---|---|
| Age (years) | 55.06 ± 13.08 | 62.70 ± 12.66 | <0.001 |
| HGB (g/L) | 143.13 ± 17.60 | 145.81 ± 14.12 | =0.63 |
| MCV (fl) | 88.34 ± 6.26 | 86.49 ± 6.05 | =0.001 |
| RDW-CV (%) | 13.82 ± 1.37 | 13.48 ± 0.83 | <0.001 |
| RDW-SD (fl) | 45.36 ± 5.43 | 43.20 ± 2.60 | =0.001 |
| PLT (×109/L) | 229.79 ± 101.86 | 213.53 ± 72.13 | =0.039 |
| PCT (%) | 1.559 ± 1.240 | 0.675 ± 0.904 | <0.001 |
| MPV (fl) | 9.77 ± 1.44 | 8.64 ± 1.05 | <0.001 |
| PDW (fl) | 15.10 ± 2.08 | 12.94 ± 2.12 | <0.001 |
| P-LCR (%) | 29.28 ± 8.39 | 23.14 ± 6.88 | <0.001 |
| P-LCC (×109/L) | 62.99 ± 24.02 | 50.32 ± 16.75 | <0.001 |
| WBC (×109/L) | 8.47 ± 4.50 | 6.46 ± 2.48 | <0.001 |
| Granulocytes (×109/L) | 7.05 ± 4.37 | 4.92 ± 2.36 | <0.001 |
| Lymphocytes (×109/L) | 1.00 ± 0.84 | 1.15 ± 0.62 | =0.030 |
| D-dimer (µg/mL) | 0.600 ± 0.430 | 0.317 ± 0.228 | <0.001 |
| Creatinine (µmol/L) | 104.55 ± 66.74 | 90.18 ± 35.69 | =0.003 |
| LDH (IU/L) | 441.80 ± 164.53 | 301.61 ± 128.29 | <0.001 |
| CRP (mg/L) | 157.73 ± 99.41 | 73.15 ± 58.85 | <0.001 |
| Ferritin (ng/mL) | 1,140.18 ± 1,079.55 | 732.44 ± 730.94 | <0.001 |
| G/L | 8.99 ± 7.26 | 5.62 ± 4.91 | <0.001 |
| PLT/L | 284.77 ± 163.08 | 235.35 ± 188.92 | =0.003 |
| WBC/CRP | 0.082 ± 0.089 | 0.299 ± 0.988 | =0.003 |
| PDW Interval | Patients without ARDS | Patients with ARDS | Portion with ARDS → Derived Factor (% with ARDS/15.25%) |
|---|---|---|---|
| 1 | 50 | 9 | 15.25% → 1.0 |
| 2 | 79 | 16 | 16.84% → 1.1 |
| 3 | 62 | 17 | 21.52% → 1.4 |
| 4 | 25 | 11 | 30.56% → 2.0 |
| 5 | 14 | 9 | 39.13% → 2.7 |
| 6 | 23 | 23 | 50.00% → 3.2 |
| 7 | 47 | 85 | 64.39% → 4.2 |
| 8 | 3 | 20 | 86.96% → 5.6 |
| Parameter and Indexes | Survivor (133) | Non-Survivor (57) | p |
|---|---|---|---|
| 61.80 ± 12.54 | 64.81 ± 12.79 | =0.133 | |
| HGB (g/L) | 143.11 ± 16.47 | 143.16 ± 20.15 | =0.987 |
| MCV (fl) | 88.26 ± 6.64 | 88.53 ± 5.32 | =0.787 |
| RDW-CV | 13.76 ± 1.51 | 13.97 ± 0.95 | =0.336 |
| RDW-SD | 45.52 ± 6.01 | 44.94 ± 3.52 | =0.641 |
| PLT (×109/L) | 237.99 ± 102.11 | 210.65 ± 99.56 | =0.090 |
| PCT (%) | 1.52 ± 1.22 | 1.64 ± 1.29 | =0.564 |
| MPV (fl) | 9.71 ± 1.46 | 9.93 ± 1.39 | =0.329 |
| PDW (fl) | 14.93 ± 2.16 | 15.48 ± 1.84 | =0.095 |
| P-LCR (%) | 28.87 ± 8.10 | 30.20 ± 9.06 | =0.417 |
| P-LCC (×109/L) | 64.06 ± 23.45 | 60.61 ± 25.42 | =0.464 |
| WBC (×109/L) | 7.95 ± 3.64 | 9.69 ± 5.89 | =0.015 |
| Granulocytes (×109/L) | 6.44 ± 3.31 | 7.98 ± 4.66 | =0.012 |
| Lymphocytes (×109/L) | 1.06 ± 0.95 | 0.85 ± 0.48 | =0.118 |
| D-dimer (µg/mL) | 0.583 ± 0.465 | 0.640 ± 0.333 | =0.407 |
| Creatinine (µmol/L) | 99.41 ± 53.09 | 120.25 ± 85.74 | =0.044 |
| LDH (IU/L) | 419.35 ± 134.31 | 496.01 ± 213.09 | =0.004 |
| CRP mg/L | 147.66 ± 95.56 | 182.35 ± 105.10 | =0.030 |
| Ferritin (ng/mL) | 1146.67 ± 1168.29 | 1125.42 ± 853.59 | =0.904 |
| G/L | 7.67 ± 5.56 | 12.05 ± 9.55 | <0.001 |
| PLT/L | 280.16 ± 154.72 | 295.46 ± 182.06 | =0.559 |
| WBC/CRP | 0.086 ± 0.093 | 0.074 ± 0.077 | =0.391 |
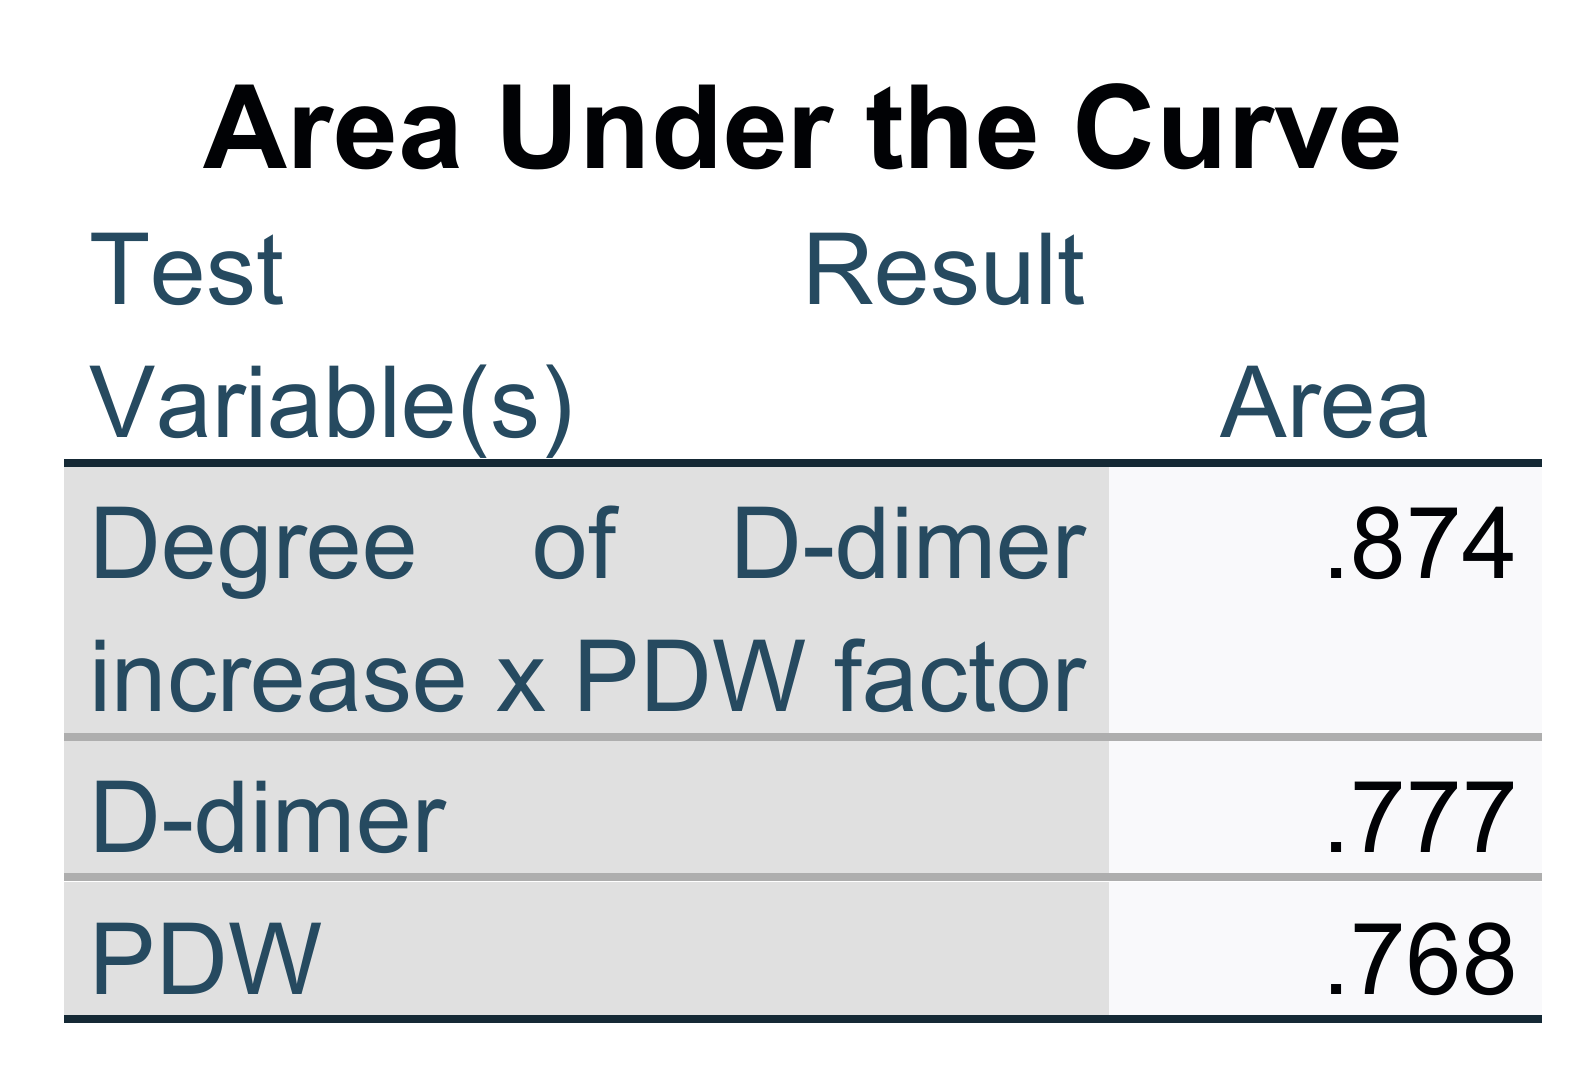
| D-PDWf | 6.670 ± 4.955 | 9.010 ± 987 | =0.006 |
Publisher’s Note: MDPI stays neutral with regard to jurisdictional claims in published maps and institutional affiliations. |
© 2022 by the authors. Licensee MDPI, Basel, Switzerland. This article is an open access article distributed under the terms and conditions of the Creative Commons Attribution (CC BY) license (https://creativecommons.org/licenses/by/4.0/).
Share and Cite
Yovchevska, I.P.; Trenovski, A.B.; Atanasova, M.H.; Georgiev, M.N.; Tafradjiiska-Hadjiolova, R.K.; Lazarov, S.D.; Yovchevski, P.H. Platelet Distribution Width and Increased D-Dimer at Admission Predicts Subsequent Development of ARDS in COVID-19 Patients. Pathophysiology 2022, 29, 233-242. https://doi.org/10.3390/pathophysiology29020019
Yovchevska IP, Trenovski AB, Atanasova MH, Georgiev MN, Tafradjiiska-Hadjiolova RK, Lazarov SD, Yovchevski PH. Platelet Distribution Width and Increased D-Dimer at Admission Predicts Subsequent Development of ARDS in COVID-19 Patients. Pathophysiology. 2022; 29(2):233-242. https://doi.org/10.3390/pathophysiology29020019
Chicago/Turabian StyleYovchevska, Iviana P., Alexandar B. Trenovski, Maria H. Atanasova, Martin N. Georgiev, Radka K. Tafradjiiska-Hadjiolova, Simeon D. Lazarov, and Plamen H. Yovchevski. 2022. "Platelet Distribution Width and Increased D-Dimer at Admission Predicts Subsequent Development of ARDS in COVID-19 Patients" Pathophysiology 29, no. 2: 233-242. https://doi.org/10.3390/pathophysiology29020019