Technical Note

Satellite Retrieval of Air Pollution Changes in Central and Eastern China during COVID-19 Lockdown Based on a Machine Learning Model

1
College of Oceanography, Hohai University, Nanjing 210098, China
2
State Key Laboratory of Satellite Ocean Environment Dynamics, Second Institute of Oceanography, Ministry of Natural Resources, Hangzhou 310012, China
3
Southern Marine Science and Engineering Guangdong Laboratory (Guangzhou), Guangzhou 510000, China
4
School of Oceanography, Shanghai Jiao Tong University, Shanghai 200030, China
*
Author to whom correspondence should be addressed.
Remote Sens. 2021, 13(13), 2525; https://doi.org/10.3390/rs13132525
Submission received: 31 May 2021 / Revised: 22 June 2021 / Accepted: 24 June 2021 / Published: 28 June 2021

Abstract

:
With the implementation of the 2018–2020 Clean Air Action Plan (CAAP) the and impact from COVID-19 lockdowns in 2020, air pollution emissions in central and eastern China have decreased markedly. Here, by combining satellite remote sensing, re-analysis, and ground-based observational data, we established a machine learning (ML) model to analyze annual and seasonal changes in primary air pollutants in 2020 compared to 2018 and 2019 over central and eastern China. The root mean squared errors (RMSE) for the PM2.5, PM10, O3, and CO validation dataset were 9.027 μg/m3, 20.312 μg/m3, 10.436 μg/m3, and 0.097 mg/m3, respectively. The geographical random forest (RF) model demonstrated good performance for four main air pollutants. Notably, PM2.5, PM10, and CO decreased by 44.1%, 43.2%, and 35.9% in February 2020, which was likely influenced by the COVID-19 lockdown and primarily lasted until May 2020. Furthermore, PM2.5, PM10, O3, and CO decreased by 16.4%, 24.2%, 2.7%, and 19.8% in 2020 relative to the average values in 2018 and 2019. Moreover, the reduction in O3 emissions was not universal, with a significant increase (~20–40%) observed in uncontaminated areas.

1. Introduction

With the rapid economic growth, industrialization, and urbanization of China, particulate matter (PM), including PM10 and PM2.5 (<10- and <2.5-micron diameters, respectively), and gaseous pollutants, such as sulfur dioxide (SO2), ozone (O3), carbon monoxide (CO), and nitrogen oxides (NOx), have become a serious concern. In 2012, to improve ambient air quality, the Chinese government issued stringent national ambient air quality standards (NAAQS) [1] and enhanced the monitoring of six major air contaminants (PM10, PM2.5, SO2, NO2, CO, and O3) in 338 Chinese cities [2], with mixed results. For example, the Atmospheric Pollution Prevention and Control Action Plan (2013–2017) greatly contributed to the reduction in PM2.5 [3,4]. However, although various studies have reported an improvement in ambient air quality, O3 concentrations have shown an increasing trend in the last five years [4,5,6].
The implementation of the second-phase Clean Air Action Plan (CAAP) has been impacted by the coronavirus disease 2019 (COVID-19) outbreak during the Chinese New Year holiday (24 January to 8 February 2020) [7,8]. The Chinese government implemented strict lockdown measures during (and beyond) the festival period. Efforts to contain the rapid spread of COVID-19 drastically reduced human activities worldwide, including industrial production, energy consumption, and transportation. Of note, air pollutant emissions also rapidly decreased during the lockdown period [9,10,11,12]. Liu et al., reported a 77% decrease in NOx, leading to a significant increase of O3 in Hangzhou during the COVID-19 lockdown [13]. Bao et al., found that PM2.5, PM10, and CO decreased by 5.93%, 13.66%, and 4.58%, respectively, in 44 cities of northern China [14]. Thus far, however, most studies have assessed changes in primary air pollutants before April 2020, without considering temporal environmental hysteresis [15,16,17,18,19].
Of interest, several studies have reported that despite the decrease in air pollutant emissions in January and February 2020, severe haze episodes in northern China did not show an associated improvement [12,15,20]. These anomalous changes have caused public controversy about the actual effects of the CAAP [8]. However, short-term responses in air quality to variations in anthropogenic emissions may not be obvious at the regional meteorological scale [21]. For example, Li et al., reported that environmental regulations have a stronger hysteresis impact on air pollutants in eastern China than in western China [17]. In addition, the influence of transboundary air pollutants can also lead to uncertainties in assessing the impacts of exhaust emission control on air pollutant reduction over short periods in small regions [21,22]. Therefore, short-term investigations on the changes in air pollutants during the first few months of 2020, as opposed to examining annual variations, are insufficient.
As for the long-term prediction in the geosciences, machine learning (ML) algorithms have demonstrated that they deal with non-linear processes well [23]. Several studies have successfully applied ML algorithms to estimate PM2.5 and PM10 concentrations in China based on satellite remote sensing and meteorological data. Liu et al., developed a ML model to predict the surface O3 in China from 2005 to 2017 and obtained the results with high accuracy [24]. These studies have produced most air pollutants data with high quality and spatial coverage, but still lack CO and other air pollutant predictions [24,25,26]. Moreover, the comprehensive assessments of spatiotemporal distributions of air pollutants and their changes are still deficient during COVID-19 lockdown [14]. Therefore, in the current study, we utilized the ML approach to determine the concentrations of PM2.5, PM10, O3, and CO in central and eastern China. We further analyzed the spatiotemporal distributions and changes in these primary air pollutants from 2018 to 2020 and explored the impact of COVID-19 lockdown on ambient pollution.

2. Materials and Methods
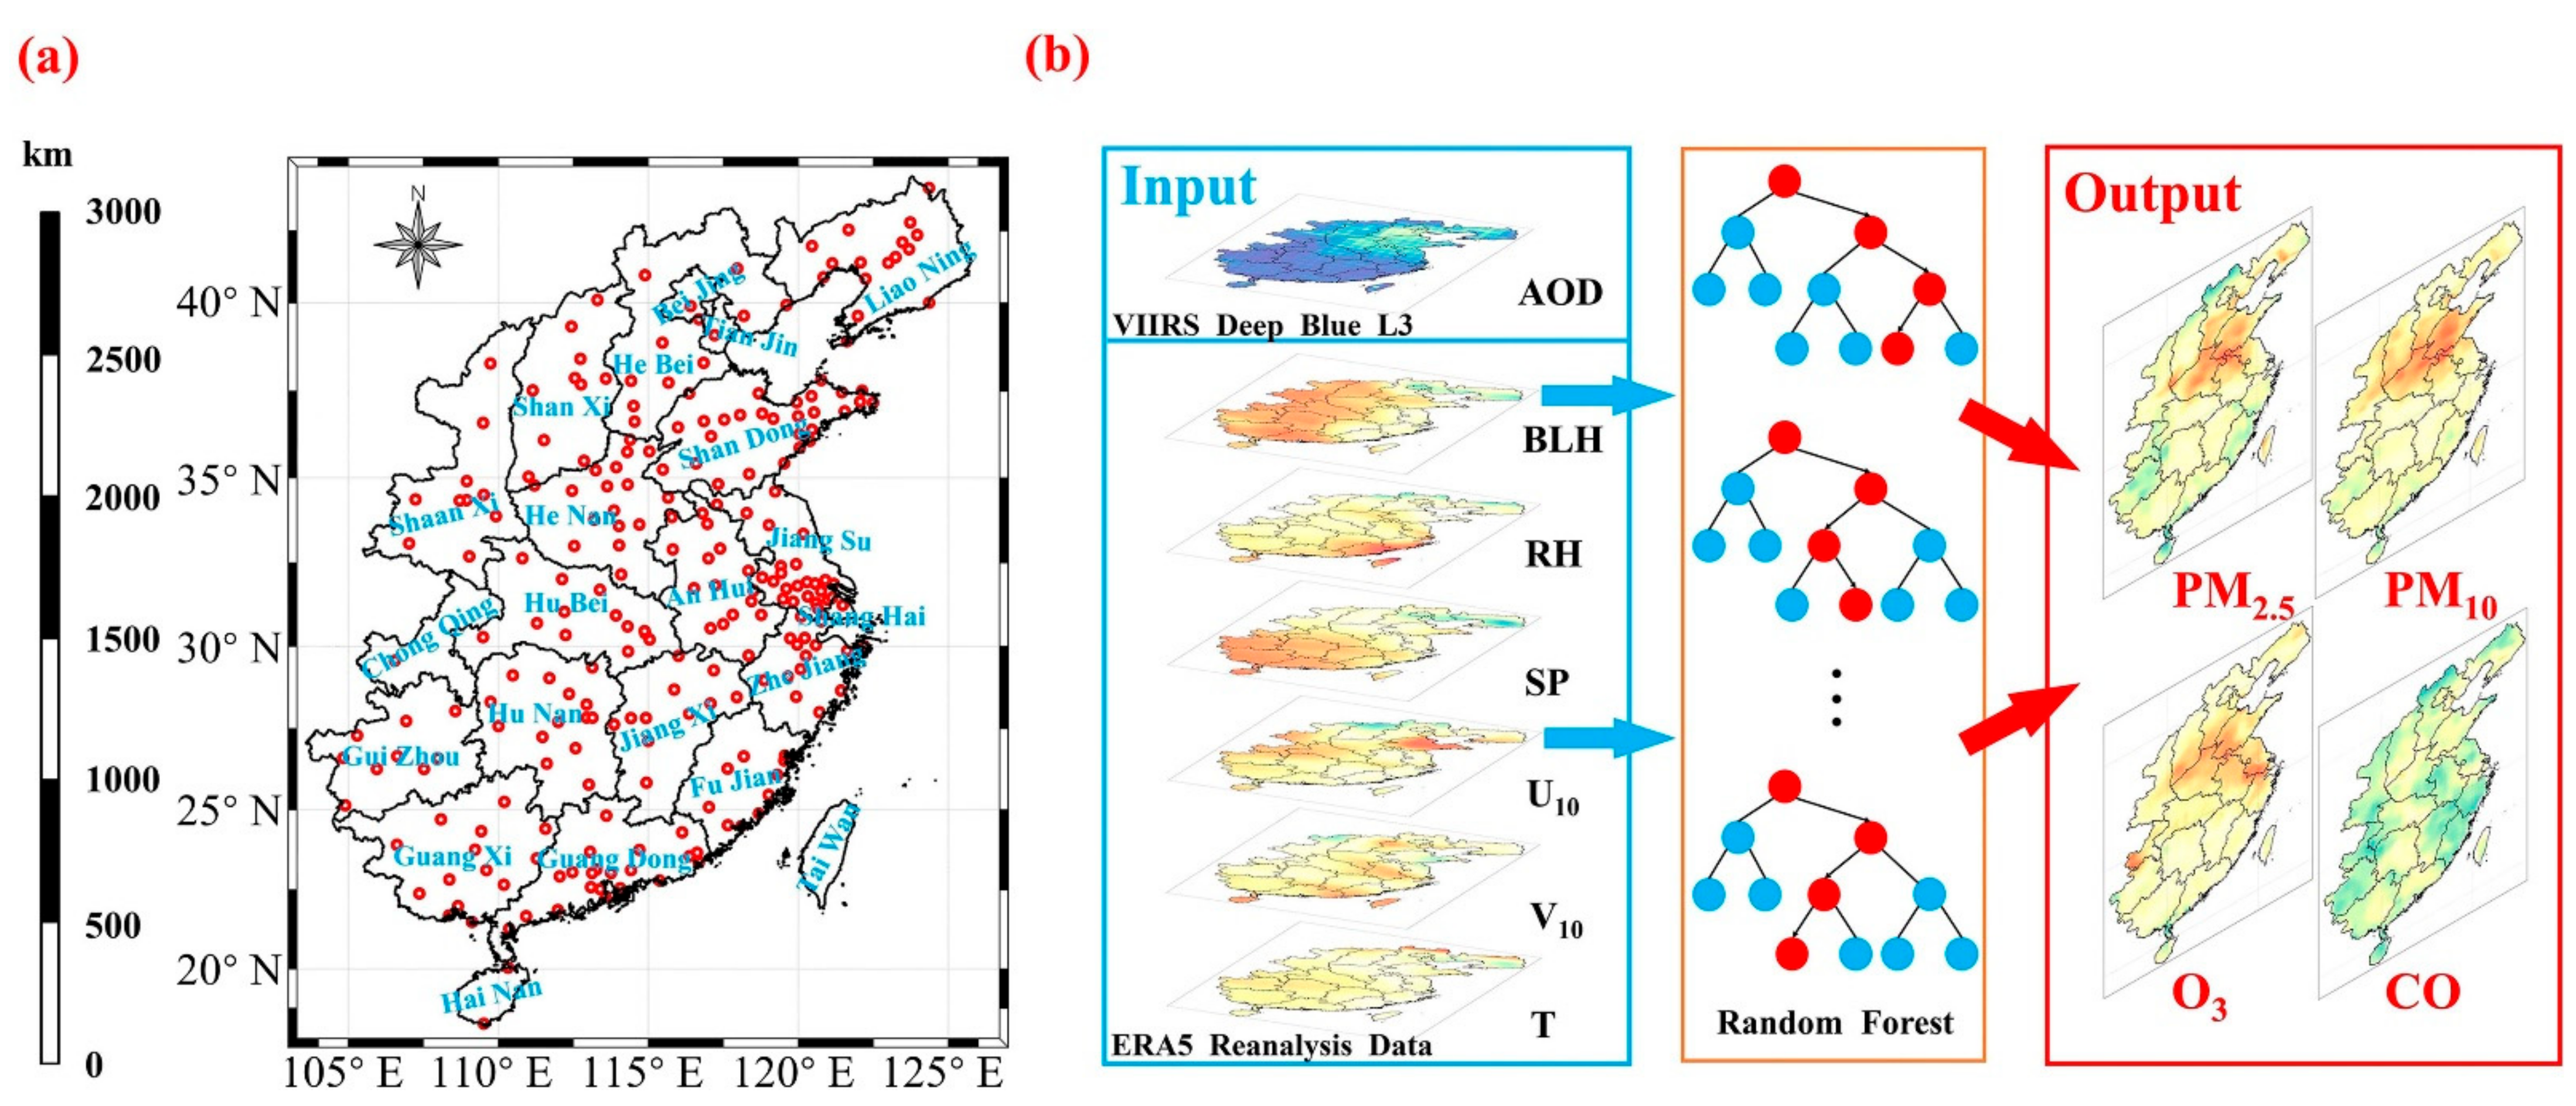
2.1. Study Area

The study area and air quality monitoring stations in 22 provinces and municipalities of central and eastern mainland China are shown in Figure 1a and include economically developed megacities within the Beijing-Tianjin-Hebei Region (BTH), Yangtze River Delta (YRD), and Guangdong-Hong Kong-Macao Greater Bay Area (GBA). These stations and ground-based observations provide a broad range of air monitoring capabilities and data for these regions. Furthermore, the population in the 22 provinces accounts for 82.4% of the total population in China, and Gross Domestic Product (GDP) accounts for 86.2% of the national total according to the China Statistical Yearbook (2019) [27]. Since 2013, the Chinese government has implemented various stringent pollution control policies, resulting in a significant improvement in ambient air quality. COVID-19 lockdowns in early 2020 further enhanced these reductions in emissions. The joint effects of the CAAP and COVID-19 lockdowns have reduced human activities and improved the air environment. Therefore, understanding the concentrations of and changes in air pollutants from 2018 to 2020 is of great significance for future environmental protection and public health in central and eastern China.

2.2. Data Description

The ground-based observational data of the four air pollutants (PM2.5, PM10, O3, and CO) used in this research were provided by the China National Environmental Monitoring Center (CNEMC, see http://www.cnemc.cn/en/, accessed on 10 May 2021). The CNEMC provides hourly, 8 h, and 24 h moving average concentrations for air quality index (AQI), PM2.5, PM10, O3, SO2, NO2, and CO for each station or city. Detailed measurement and quality control (QC) descriptions are available from the China Ministry of Ecology and Environment (MEE, see http://www.mee.gov.cn/, accessed on 10 May 2021).
The Suomi National Polar-Orbiting Partnership (Suomi NPP) spacecraft, which launched on 28 October 2011, carries the Visible Infrared Imaging Radiometer Suite (VIIRS), with 22 radiometric bands ranging from 0.41 to 12.5 microns and a 3060 km swath. We used the VIIRS Level 3 daily deep blue aerosol products (AERDB_D3_VIIRS_SNPP, see https://ladsweb.modaps.eosdis.nasa.gov/search/, accessed on 10 May 2021) from 2018 to 2020, which are derived from VIIRS Level 2, 6 min and swath-based aerosol products gridded on a 1° by 1° horizontal resolution grid. The use of aggregated products can improve data validity and avoid outliers.
We used the European Centre for Medium-Range Weather Forecasts (ECMWF) 5th Re-Analysis (ERA5, see https://cds.climate.copernicus.eu/#!/home, accessed on 10 May 2021) dataset with 0.25° grid resolution from 2018 to 2020. According to previous study and correlation analysis (Figure 2), we selected hourly meteorological data from the ERA5 re-analysis dataset, which included relative humidity (RH, %), surface pressure (SP, Pa), air temperature (T, K), boundary layer height (BLH, m), u-component of wind above 10 m (U10, m/s), and v-component of wind above 10 m (V10, m/s), with the hourly dataset then converted to a daily scale.

2.3. ML Algorithm

In recent years, an ML algorithm has been widely applied in air pollutants prediction mainly due to the superior ability of ML algorithms to capture and employ the features of independent variables and solve complex non-linear problems [25,26,28,29]. Air pollutants are non-linearly affected by multiple ambient factors, such as T, RH, SP, and wind speed. As shown in Figure 2, meteorological factors significantly influenced the concentration of air pollutants (PM2.5, PM10, O3, and CO) and showed relatively strong relationships with aerosol optical depth (AOD) and T. Conventional statistical models have difficulty in addressing the complex non-linear relationship among meteorological factors and air pollutant concentrations. Therefore, ML models can be utilized to resolve this non-linear problem [26].
The random forest (RF) model is a family of ML algorithms and constituted by an ensemble of decision trees. The RF regression model has relatively low generalization error based on ensemble decision tree theory and generates an unbiased output by aggregating the importance of each regression tree branch feature [30]. In the process of RF regression model simulations, the optimal splitting method can be used to split the samples for each regression tree according to the data characteristics, as shown in the red chain in Figure 1b. The detailed structures of RF algorithm for the PM2.5, PM10, O3, and CO are presented in Figures S1–S4.
Considering the differences in resolution between AOD and meteorological data, we interpolated their resolutions linearly to a 0.5° grid for the model input. To assess the relationships among the concentrations of the four air pollutants and input variables, we co-matched ground-based observational data to the nearest input pixel. The specific structure and schematics of the geographical RF model are illustrated in Figure 1b. Following previous research, we set the forest to 2000 trees, maximum depth of trees to 15, and minimum number of splitting samples to 10 [25,31]. Input variable features were extracted by model training and their relative feature importance (RFI) was determined as a predictor. Additionally, sample-based 10-fold cross-validation (CV) was applied to optimize model performance. The RF model emphasizes practical application for substantive interpretation by calculating variable importance compared to neural network (NN) models [30].

3. Results and Discussion

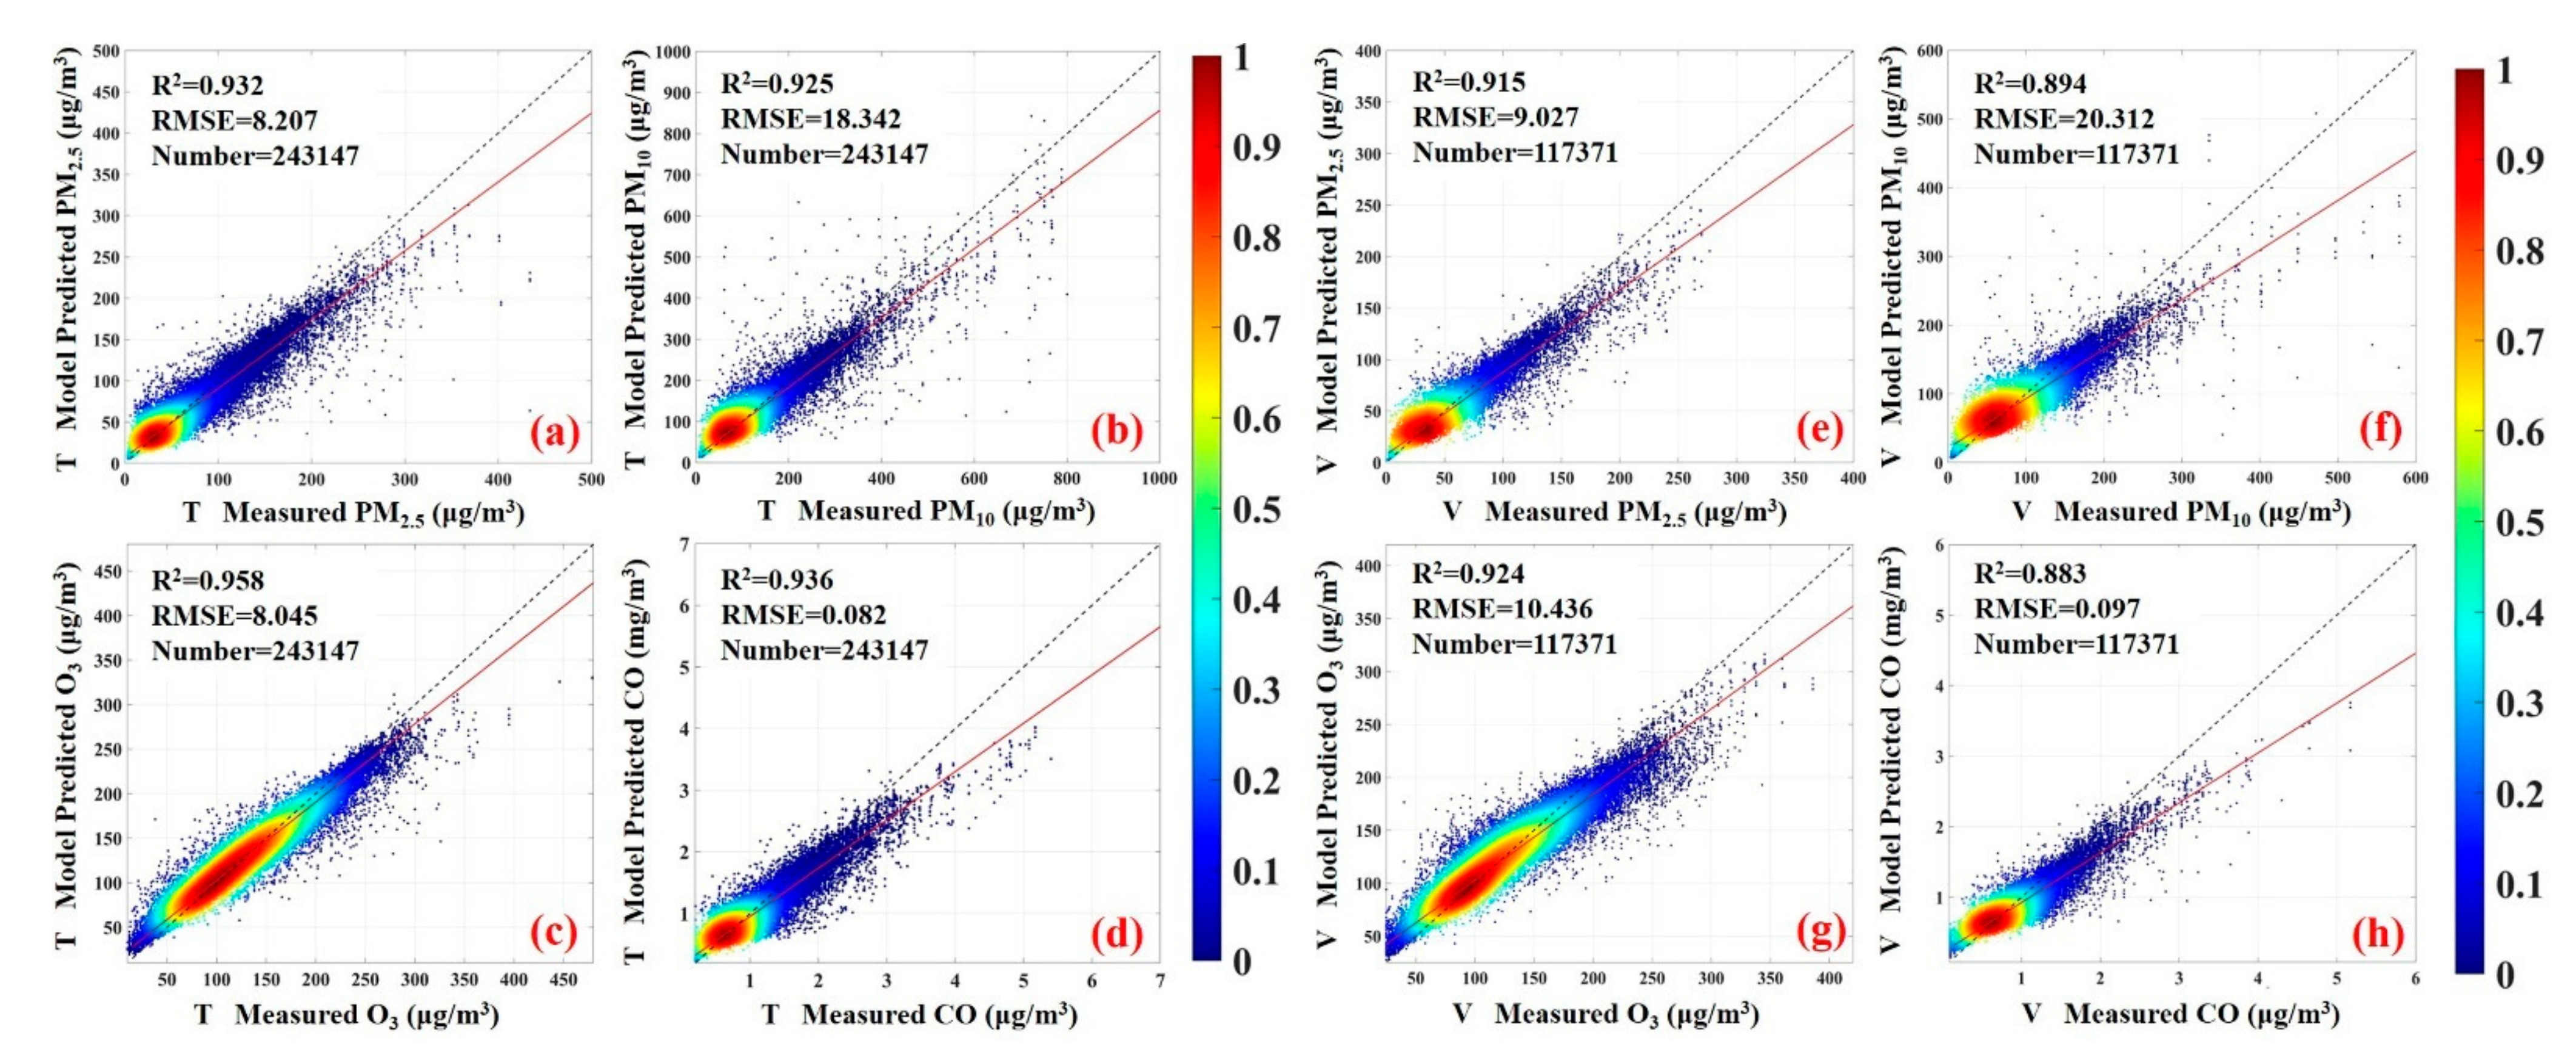
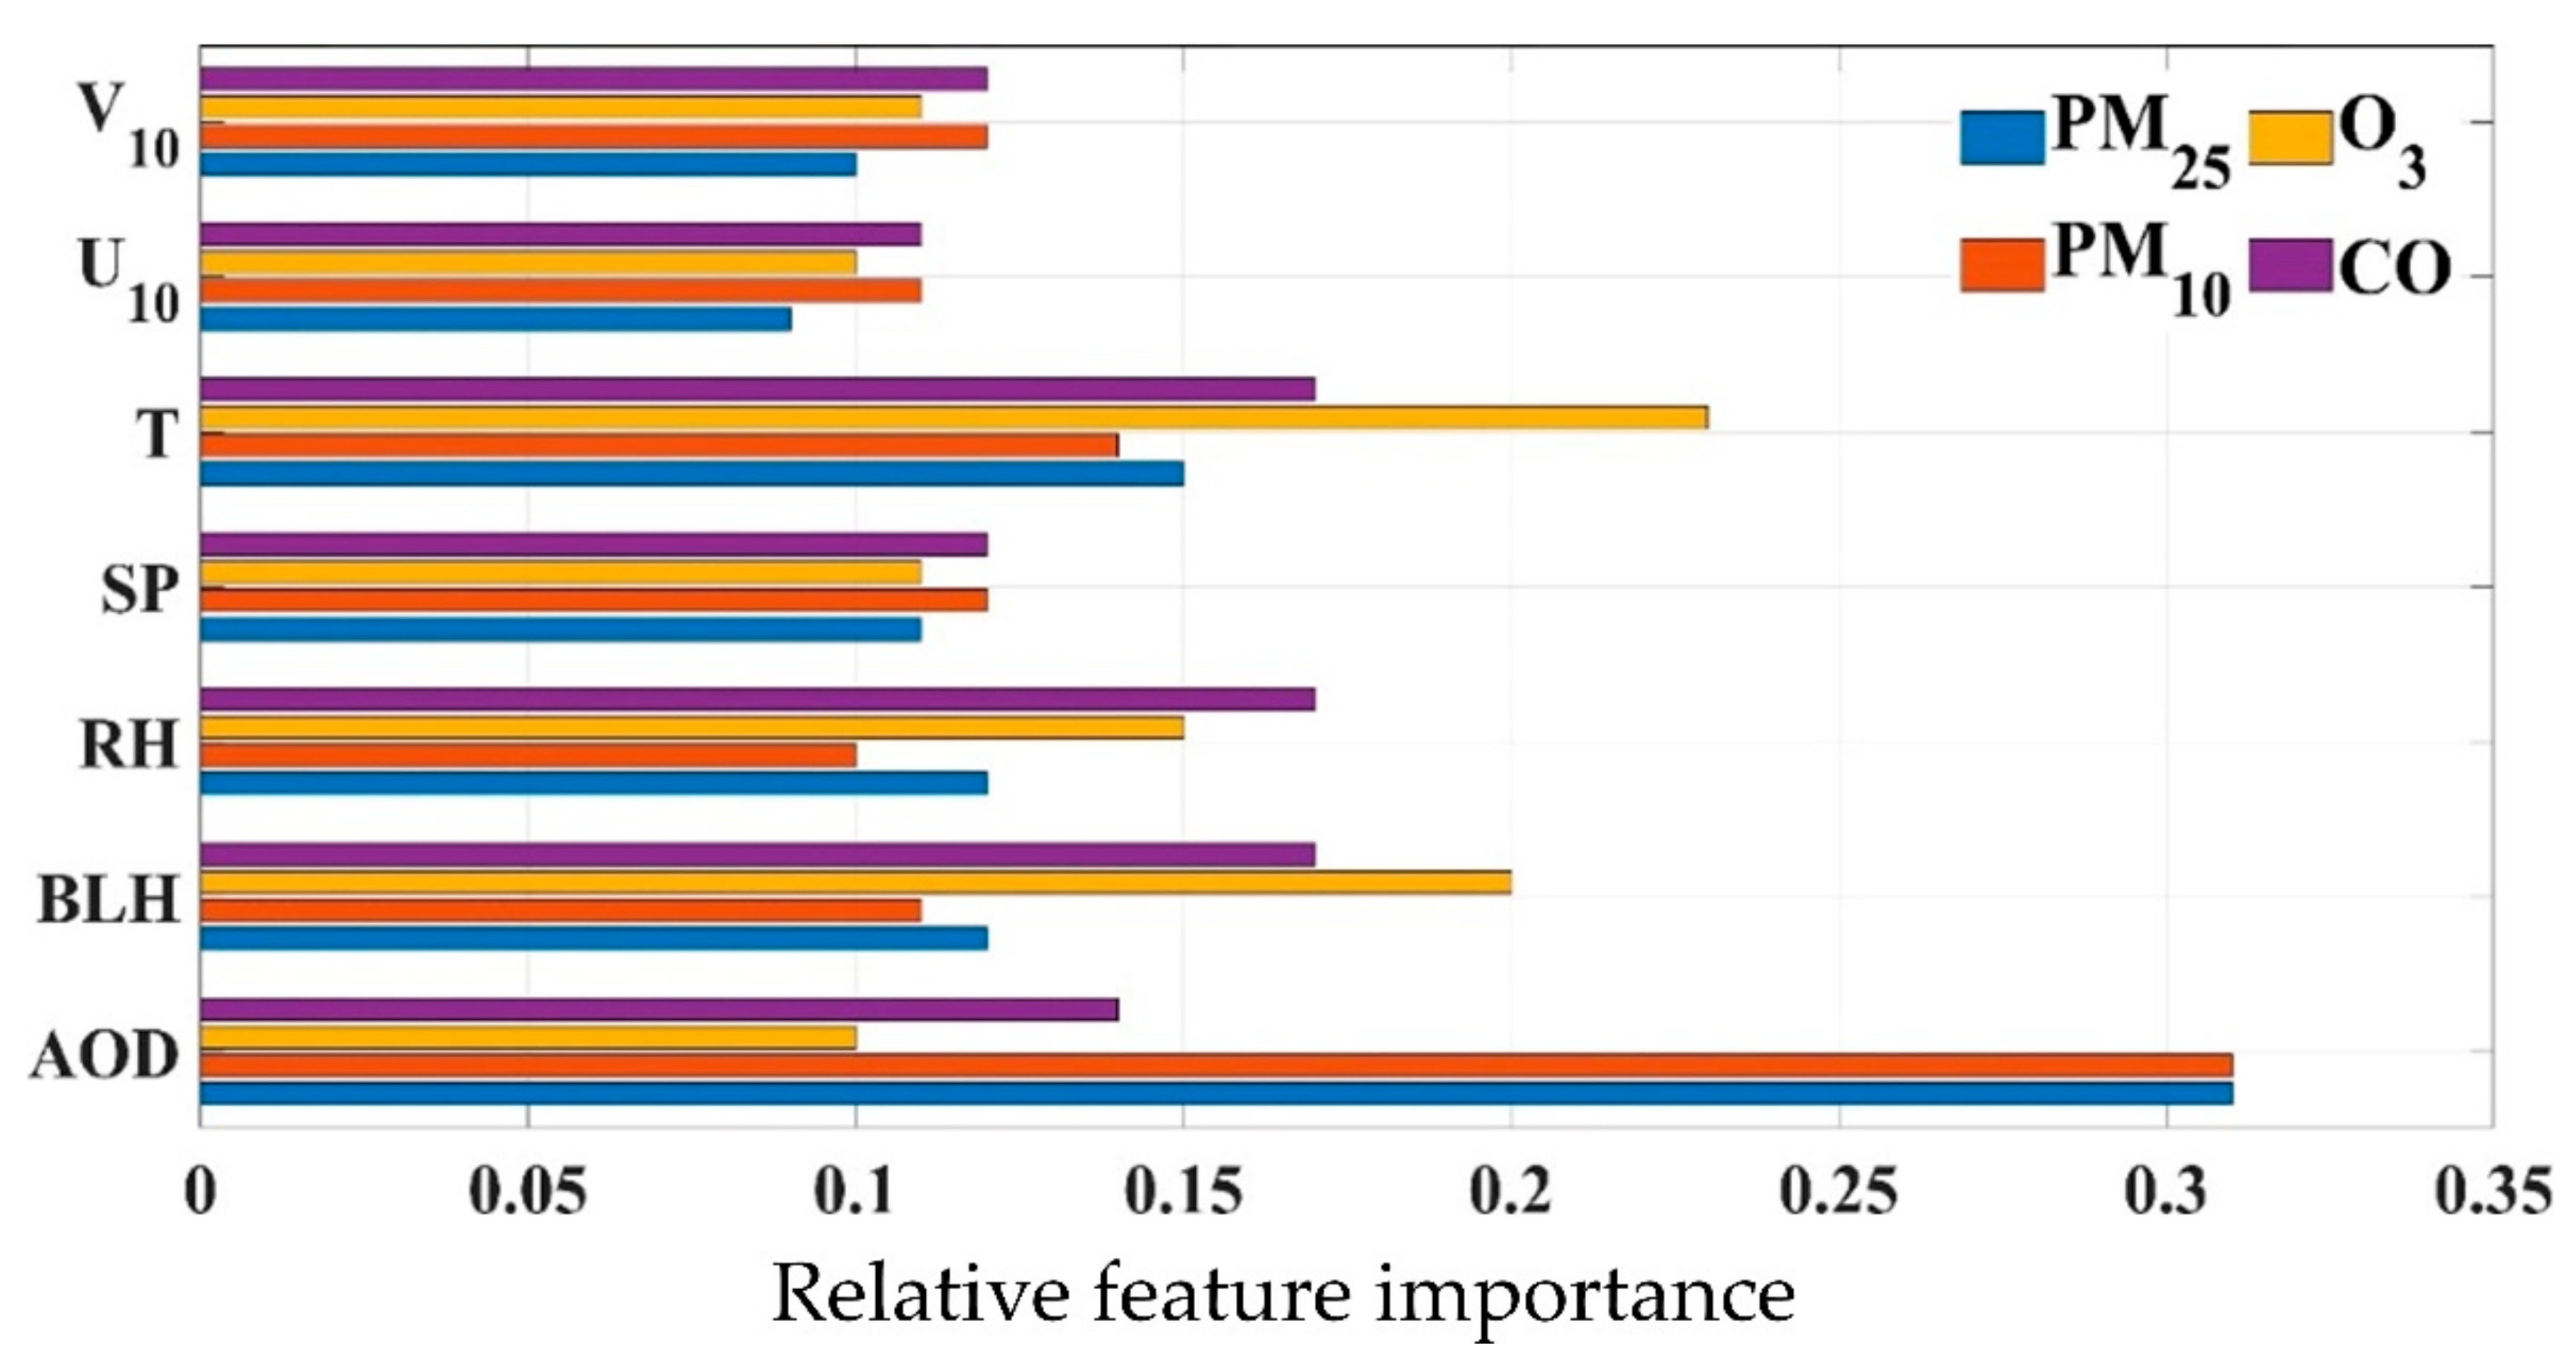
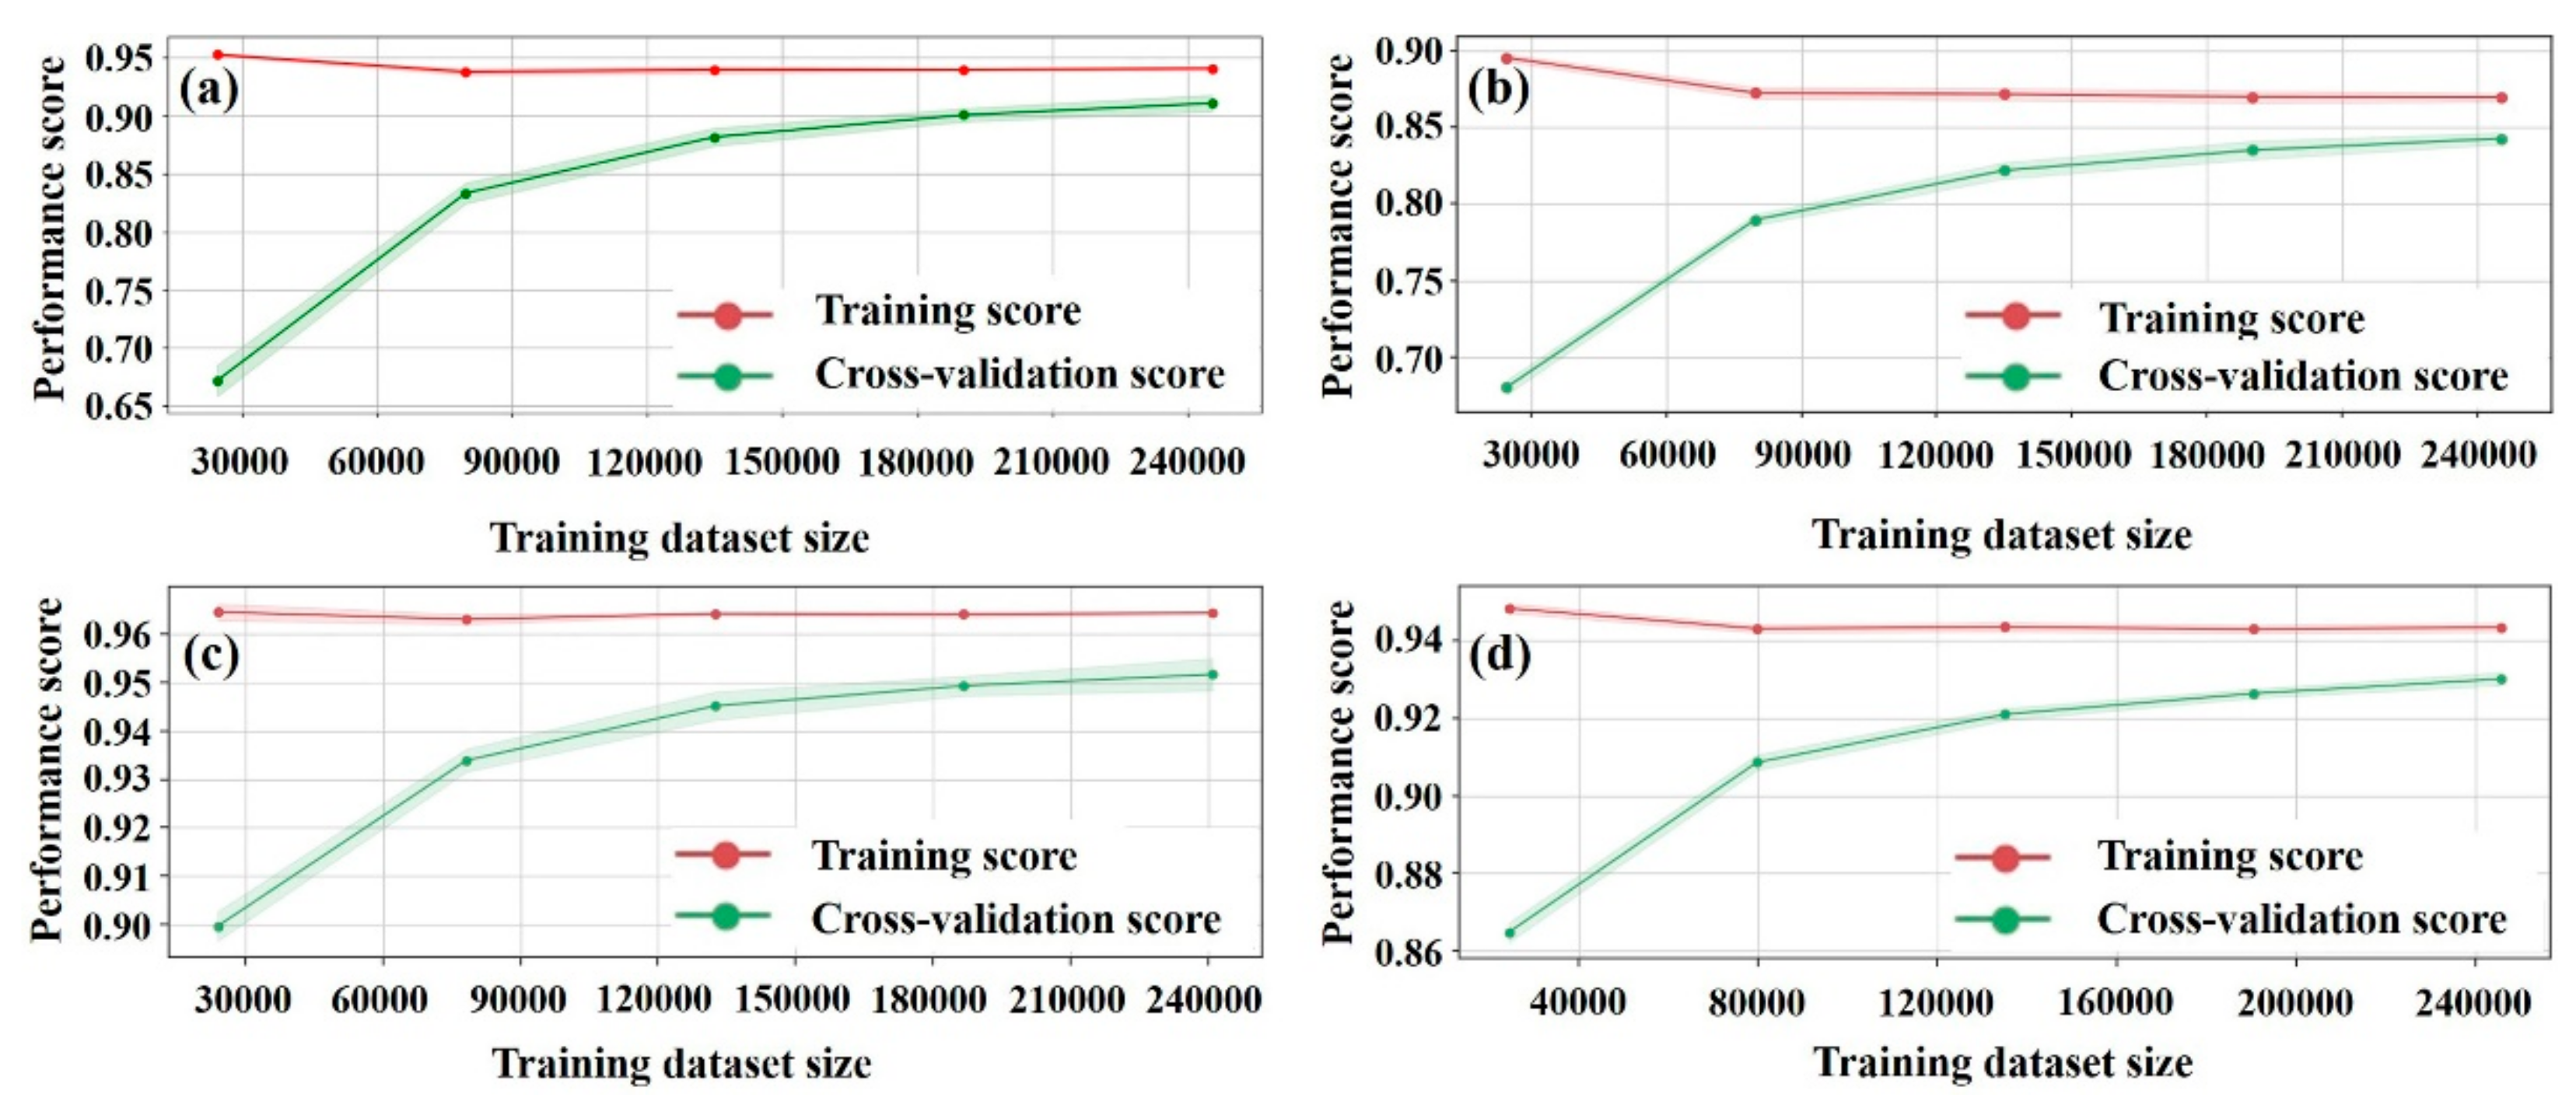
3.1. Evaluation of Model Performance

As shown in Figure 3, the coefficients of determination (R2) between the RF-model predicted and ground-measured air pollutant concentrations were above 0.925 during training (2018–2019) and above 0.883 for independent validation (2020). The root mean squared errors (RMSE) for the PM2.5, PM10, O3, and CO validation dataset were 9.027 μg/m3, 20.312 μg/m3, 10.436 μg/m3, and 0.097 mg/m3, respectively. The R2 and RMSE values of the validation dataset were weaker than those of the training dataset, but were within the permissible range. However, the model tended to underestimate air pollutant levels under high-concentration conditions, which is expected in most ML algorithms [32]. The robustness of the O3 model was better than that of the other three air pollutant models due to its higher correlations with T, BLH, and RH (correlation coefficients (R) of 0.42, 0.36, and −0.3, respectively) (Figure 3). The RFI of the predictors can be shown in Figure 4. We can find that the two most important predictors of PM2.5 and PM10 are AOD and T, whereas the two most important predictors of O3 and CO are T and BLH. The larger RFI means that the predictor contributes more on the output variable. Thus, in geographical RF models, AODs mainly regulate the changes of PM2.5 and PM10, while T mainly controls the changes of O3.
The performance of geographical RF models also need to be diagnosed by the learning curves, which are shown in Figure 5. The learning curve represents the changes in performance score for training and cross-validation with the sample size. Here, the performance score of geographical RF models are determined based on the sample-based 10-fold CV method. As Figure 5a–d show, the CV performance scores are enhanced with the increases of the training dataset size, suggesting that larger training dataset can further improve the model performance. Additionally, the impacts of training dataset size on the performance scores of PM2.5 and PM10 are stronger than of O3 and CO. Overall, our results indicated that four air pollutants concentrations could be accurately predicted using the geographical RF model.

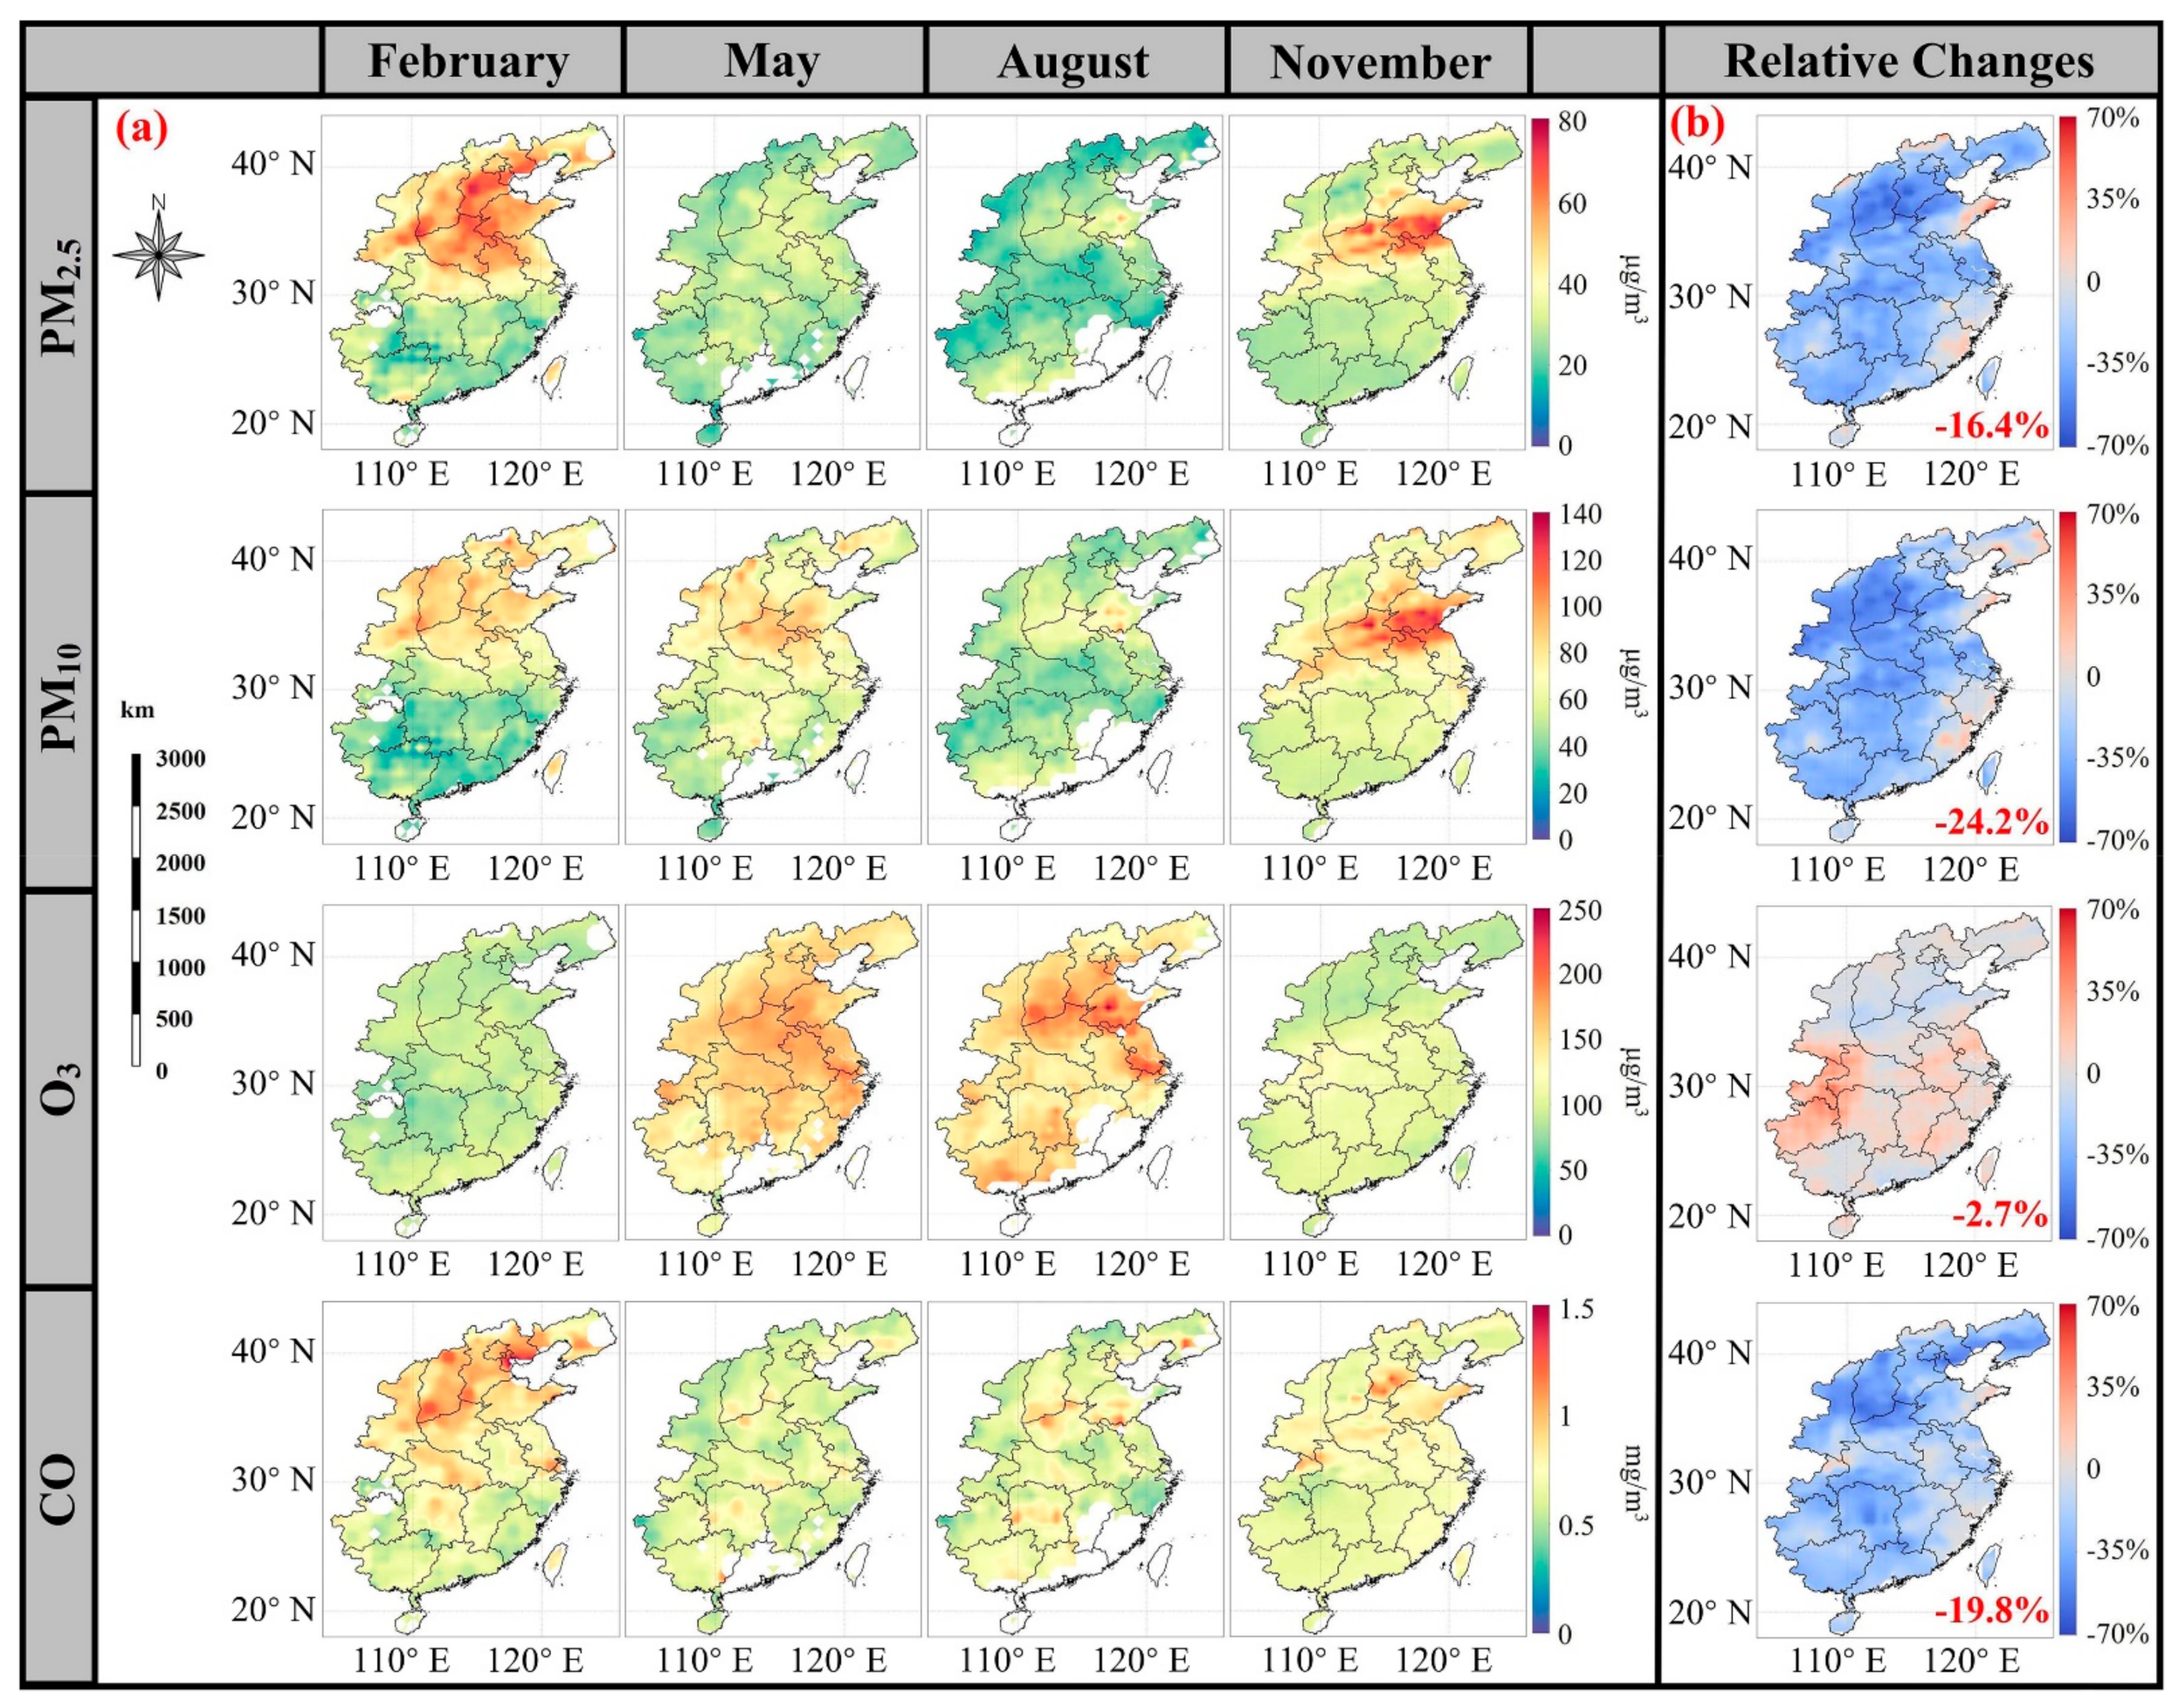
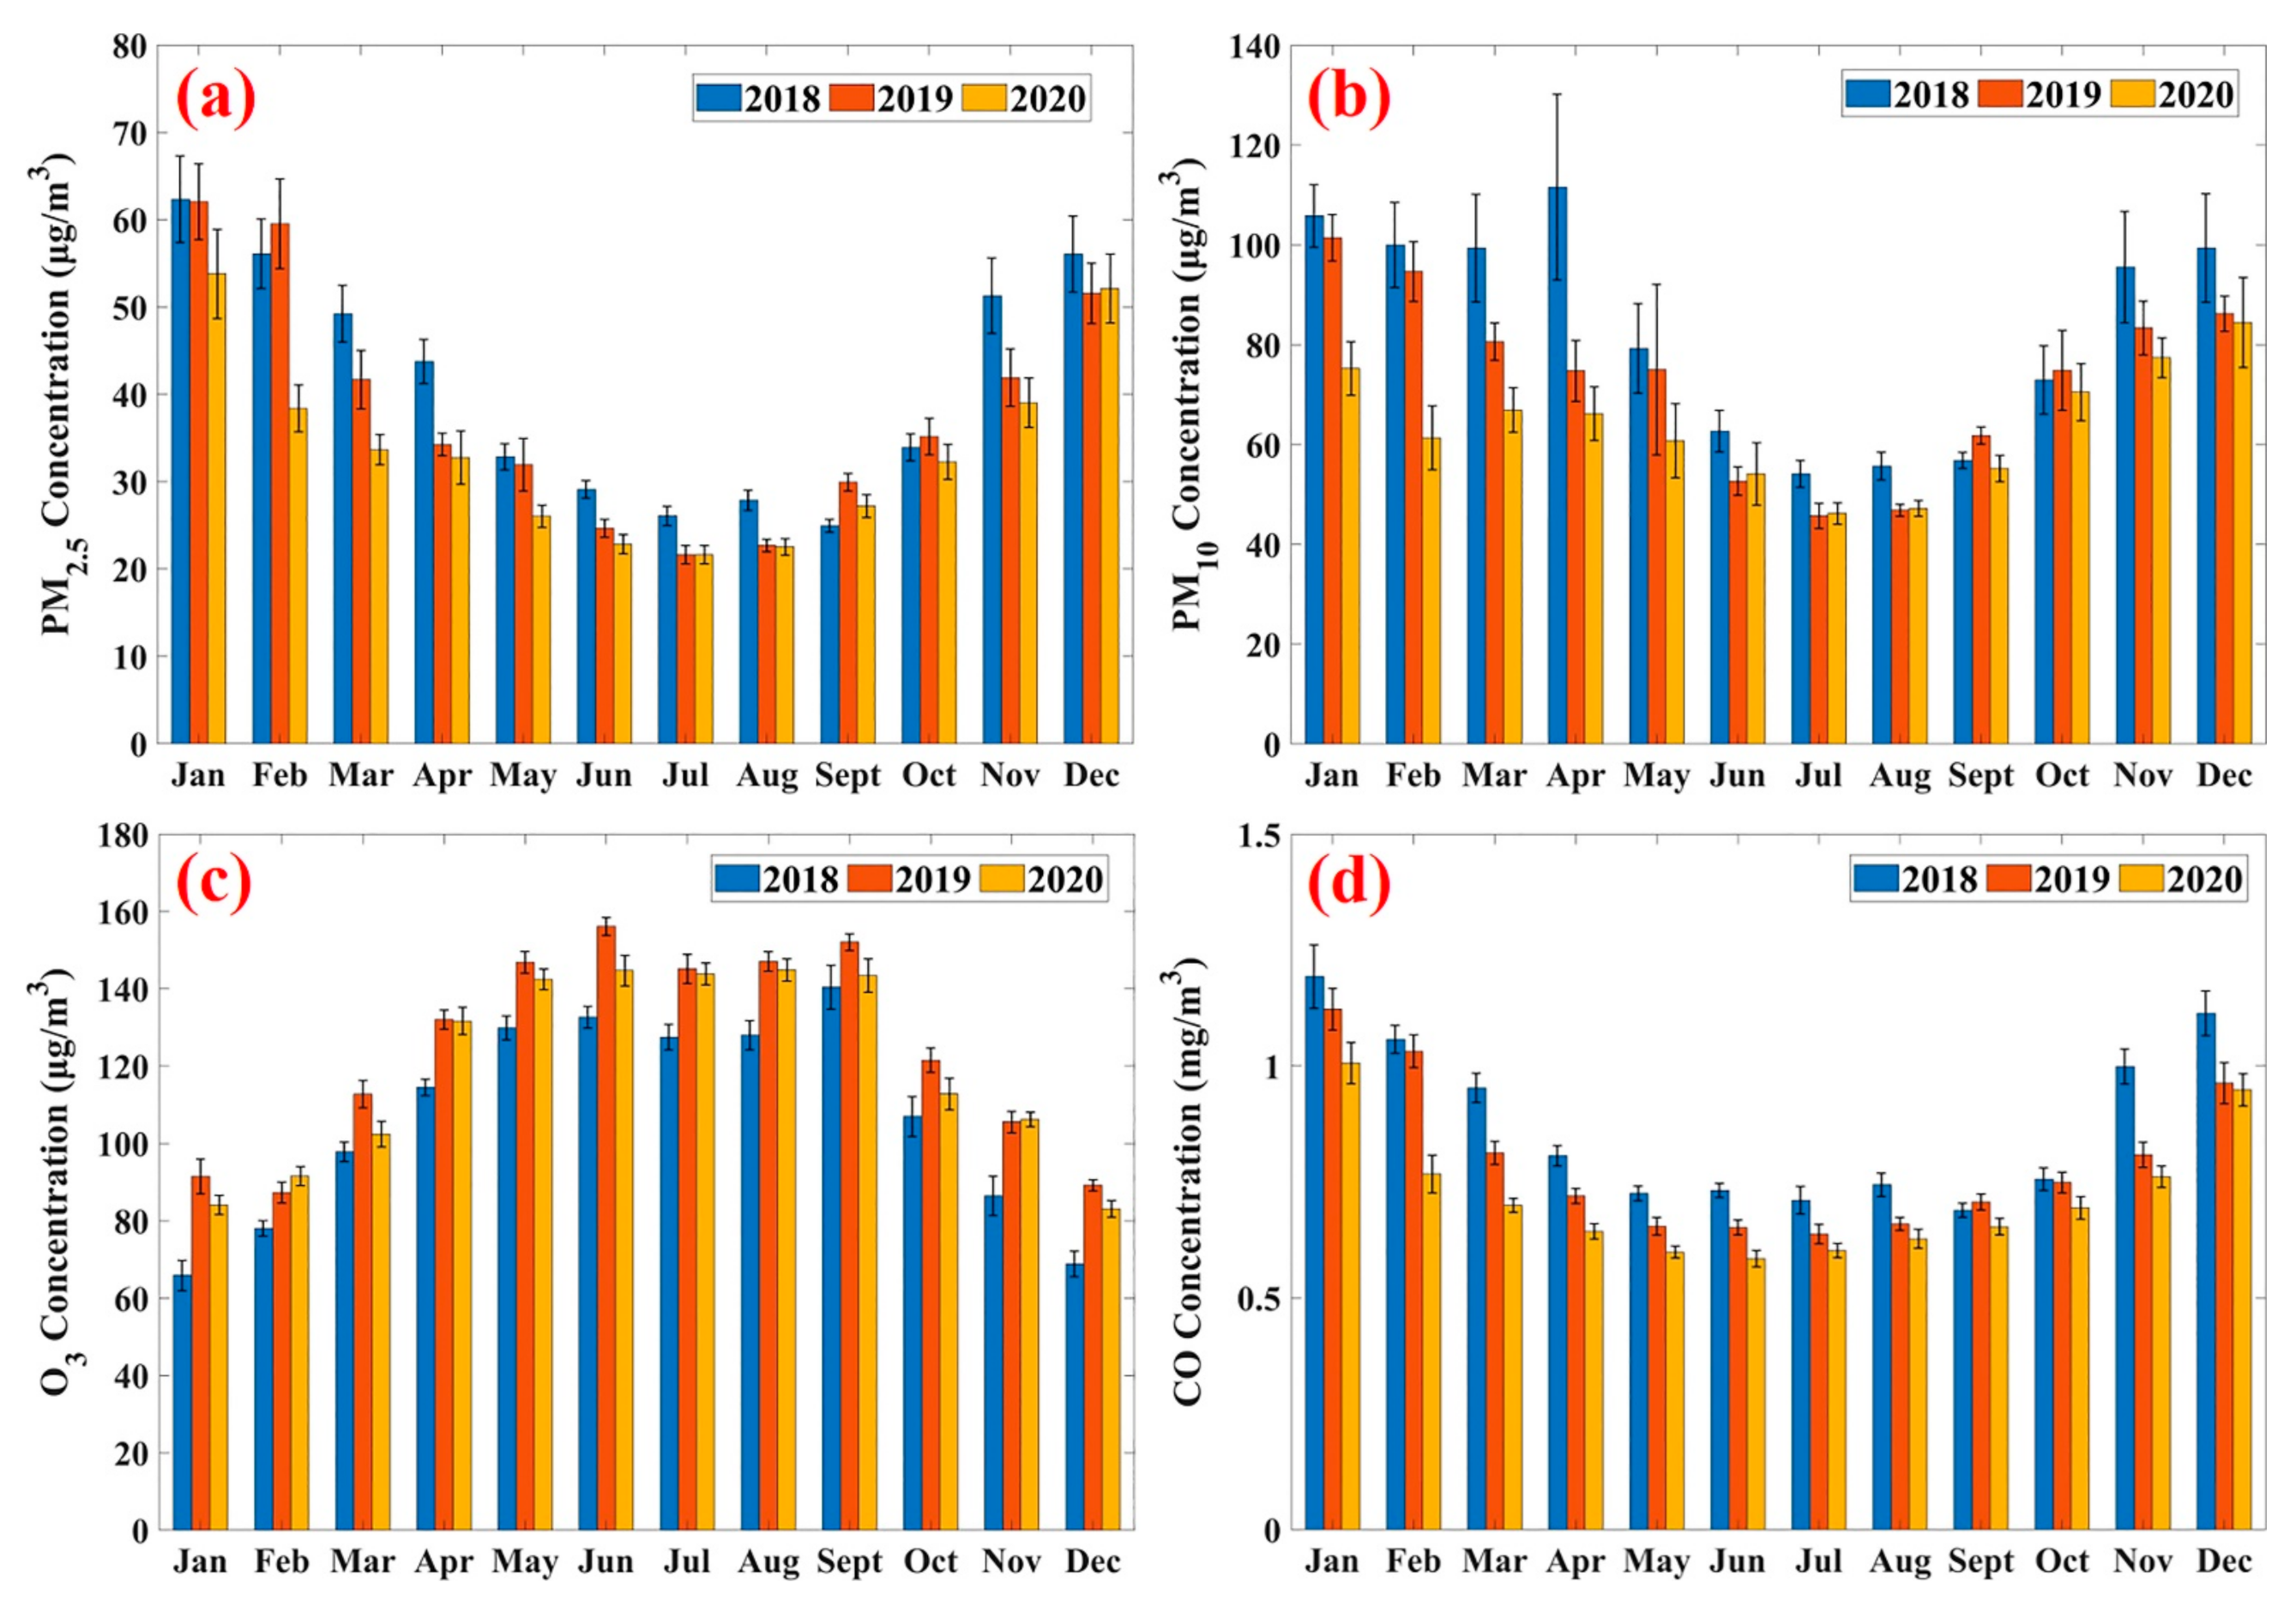
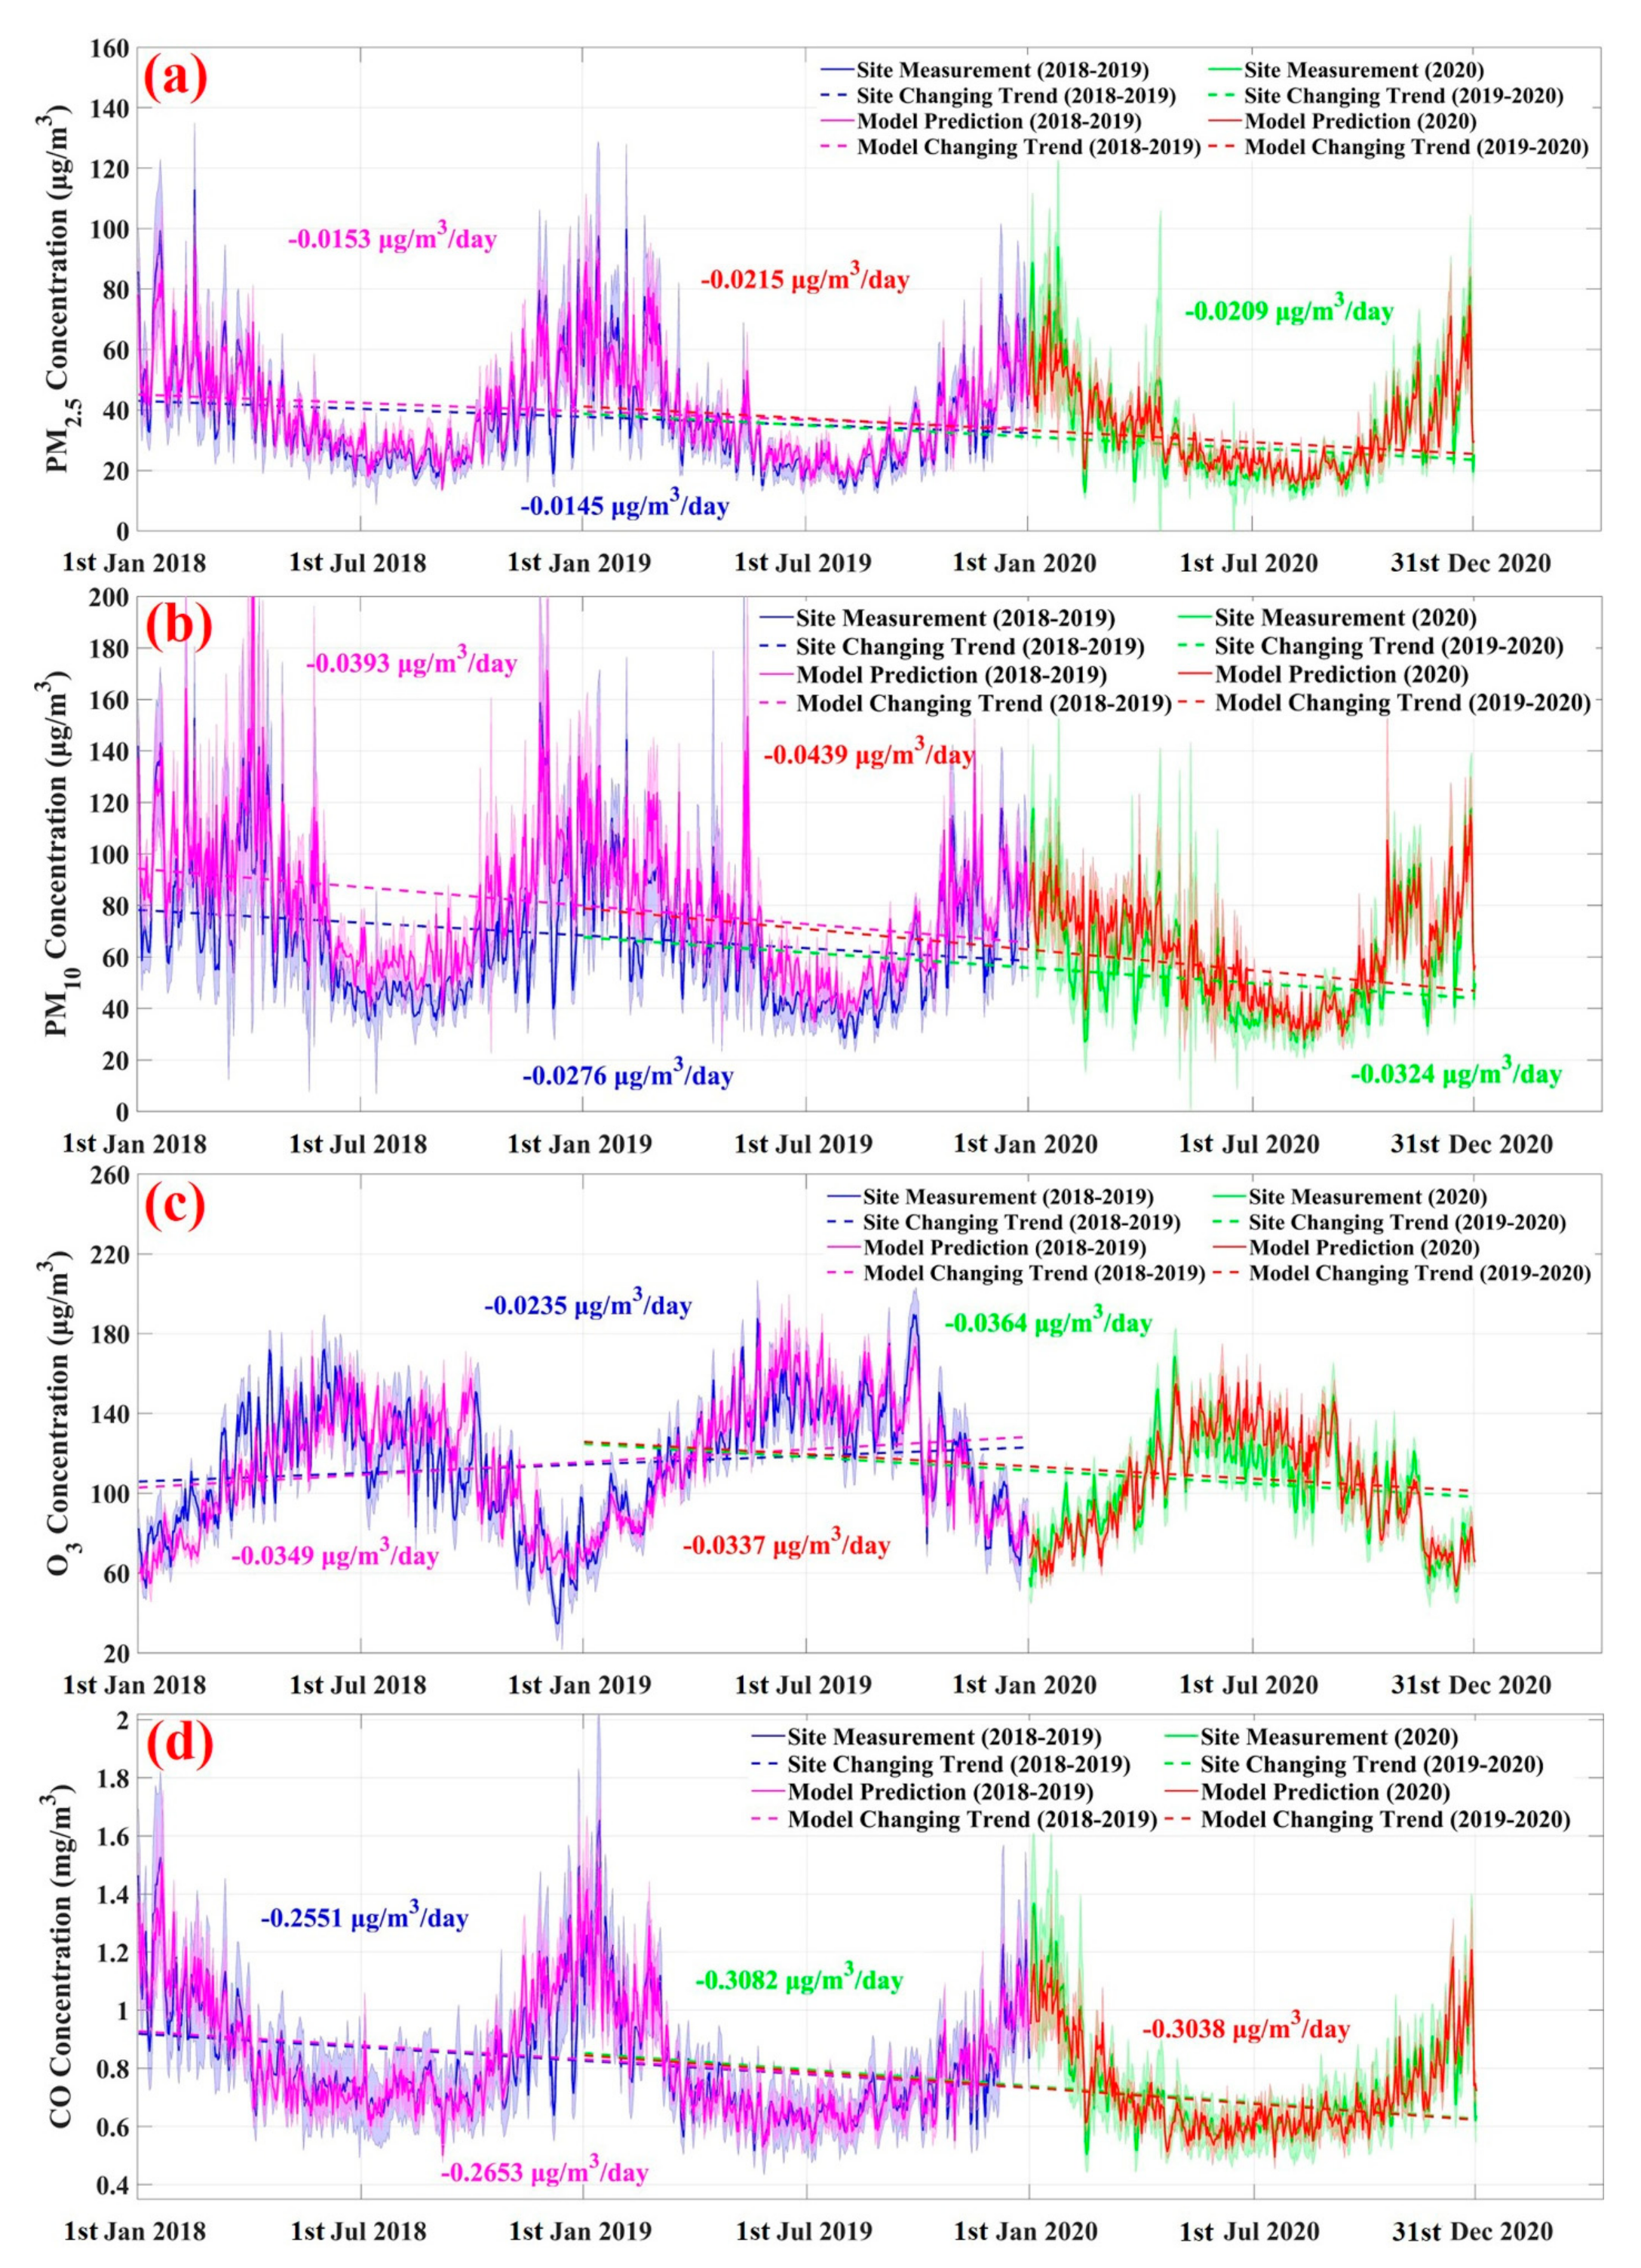
3.2. Annual Changes in Air Pollutants in 2020 Compared to 2018 and 2019

Figure 6a depicts the spatial distribution and variation of the PM2.5, PM10, O3, and CO concentrations in February, May, August, and November 2020 in central and eastern China. Figure 6b shows the annual average changes in four pollutants concentrations relative to their averages in 2018 and 2019. Under the joint impact of COVID-19 lockdown and the CAAP, the PM2.5, PM10, and CO concentrations declined, on average, by 16.4%, 24.2%, and 19.8%, respectively, in 2020. Almost all regions in central and eastern China showed a decline in PM2.5, PM10, and CO, indicating that short-term control of production may improve the air environment quality over a relatively long-term period.
Figure 7 presents the monthly spatial distributions of RF-model predicted PM2.5, PM10, O3, and CO concentration averaged from 2018 to 2019 in central and eastern China. Compared with the model-predicted concentrations shown in Figure 7a,b,d), the PM2.5, PM10, and CO concentrations decreased markedly (65.24%, 58.39%, and 48.12%, respectively) in the North China Plain (NCP) during the Chinese pandemic lockdown. The significant reduction in PM2.5 was linked to the sharp decline in human industrial activity (Bao et al., 2020). The PM2.5 and PM10 concentrations both decreased by ~25–50% in 2020 in the YRD.
Figure 8 shows the monthly spatial distributions of model-predicted PM2.5, PM10, O3, and CO concentration in 2020 over the central and eastern China. Interestingly, although the O3 concentration increased during COVID-19 lockdown, its rate of change was −2.7% in 2020, which may be due to the relatively sharp decline (−22.5%) in summer and autumn compared with the model-predicted concentrations shown in Figure 7c and Figure 8c. The increase in O3 concentration may be due to the higher temperature (~1.8 °C relative to the averages in 2018 and 2019) in February 2020 [33]. Conversely, due to the weak aerosol scattering and absorption effects caused by the sharp decrease in PM2.5 and PM10, higher solar radiation intensity may have led to the increase in O3 [5]. Notably, the changes in air pollutants are consistent with the spatial distributions expected for the O3 concentration due to the similar R and RFI results of the other three air pollutants in Figure 2 and Figure 4. Spatially, in the NCP, GBA, and Liaotung Peninsula regions, the O3 concentration was high but showed a decreasing tendency, whereas in central China, especially Chongqing and Guizhou, the concentration was relatively low but showed an increasing tendency (~20–40%). In contrast, the level of PM2.5 decreased by 32.56%, on average in the above regions. According to previous studies, the O3-PM2.5 relationship (O3 is produced, while PM2.5 scavenges hydroperoxyl (HO2) and nitric oxide (NOx) radicals) may be one of the main reasons for the serious increase in O3 pollution in these regions [6].
Comparing Figure 3b and Figure 7a, we can see that PM2.5 increases more dramatically in low-concentration areas, with PM10 and CO showing similar behavior. Specifically, the increases in air pollutants (except for O3) were obvious (~15–55%, on average, in 2020) in the eastern Shandong Peninsula and southeastern China. However, the changes in O3 were reversed (i.e., decreased by ~5–20%) compared to the changes in the other three pollutants in these areas, which may be explained by the O3-PM2.5 inverse relationship [6]. Although the average rate of change for CO was similar to that of PM2.5 and PM10 in spatial distribution, the concentration distribution was not consistent, especially in spring and autumn (Figure 7d and Figure 8d). This may be because the concentration of CO was less influenced by AOD (R is 0.23, and RFI is 0.14) compared to regional vehicle exhaust and industrial waste gas [34]. Therefore, reducing emissions and controlling anthropogenic activities are effective at alleviating air pollution in central and eastern China.

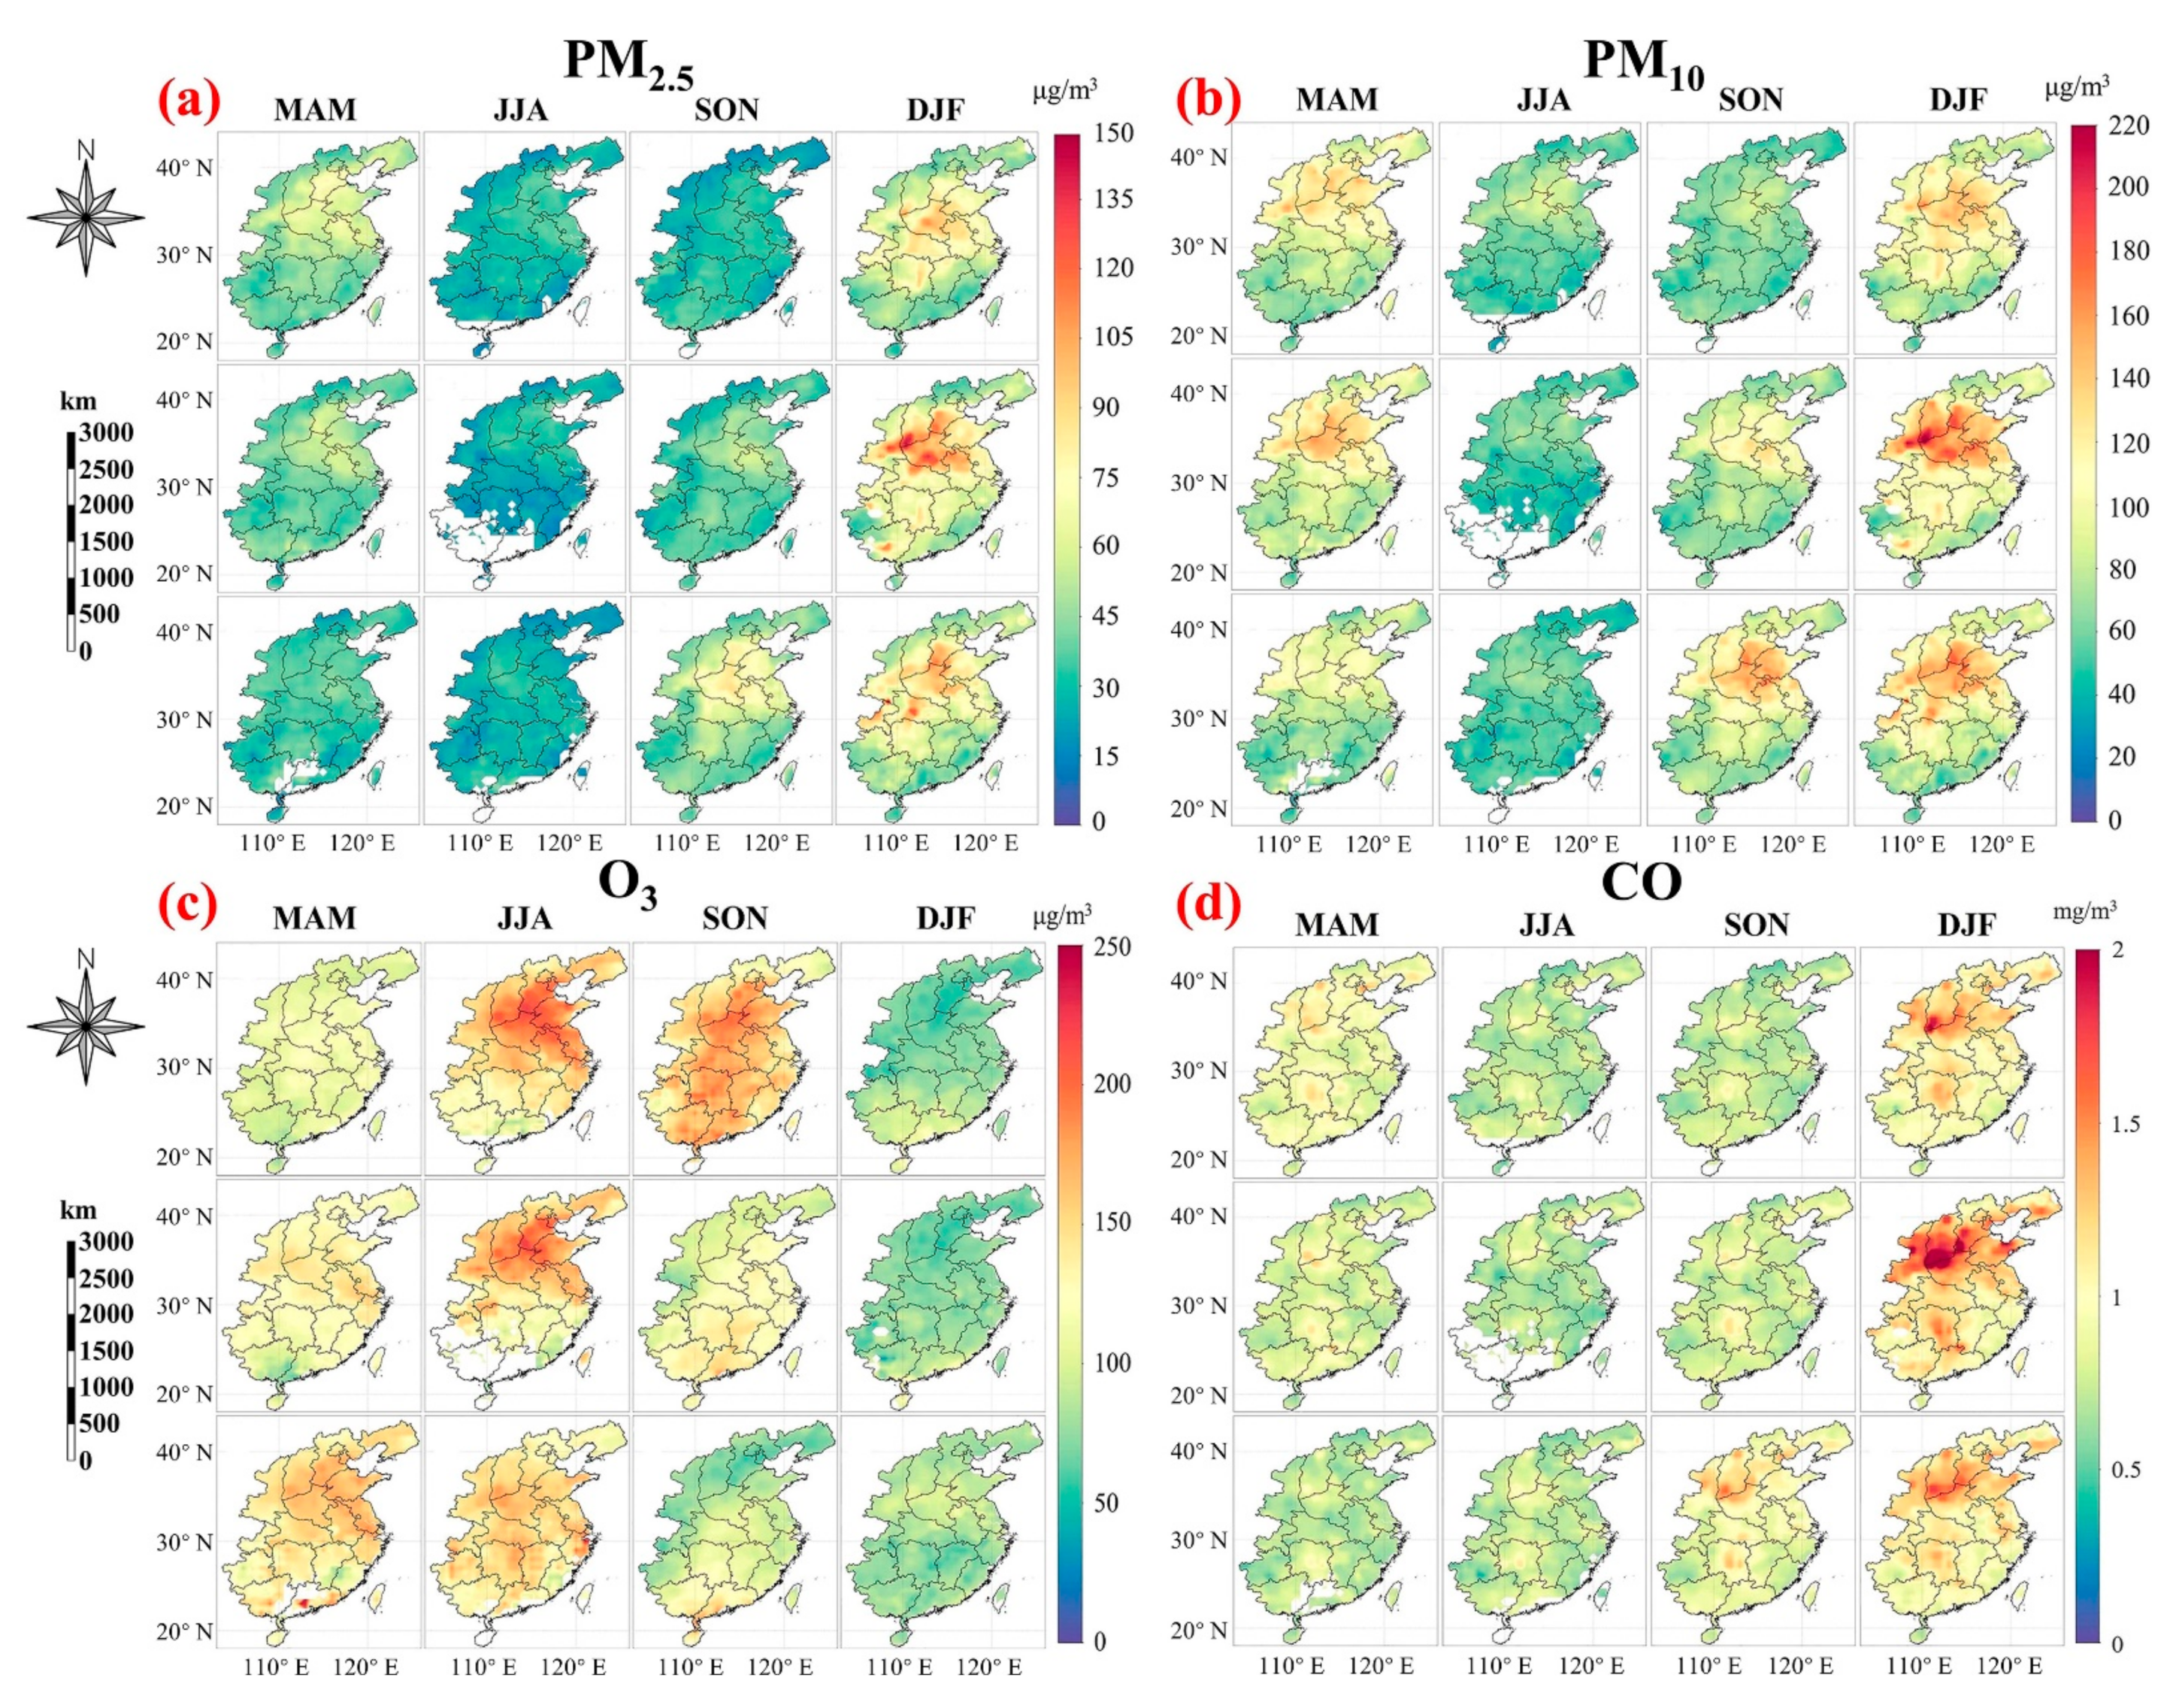
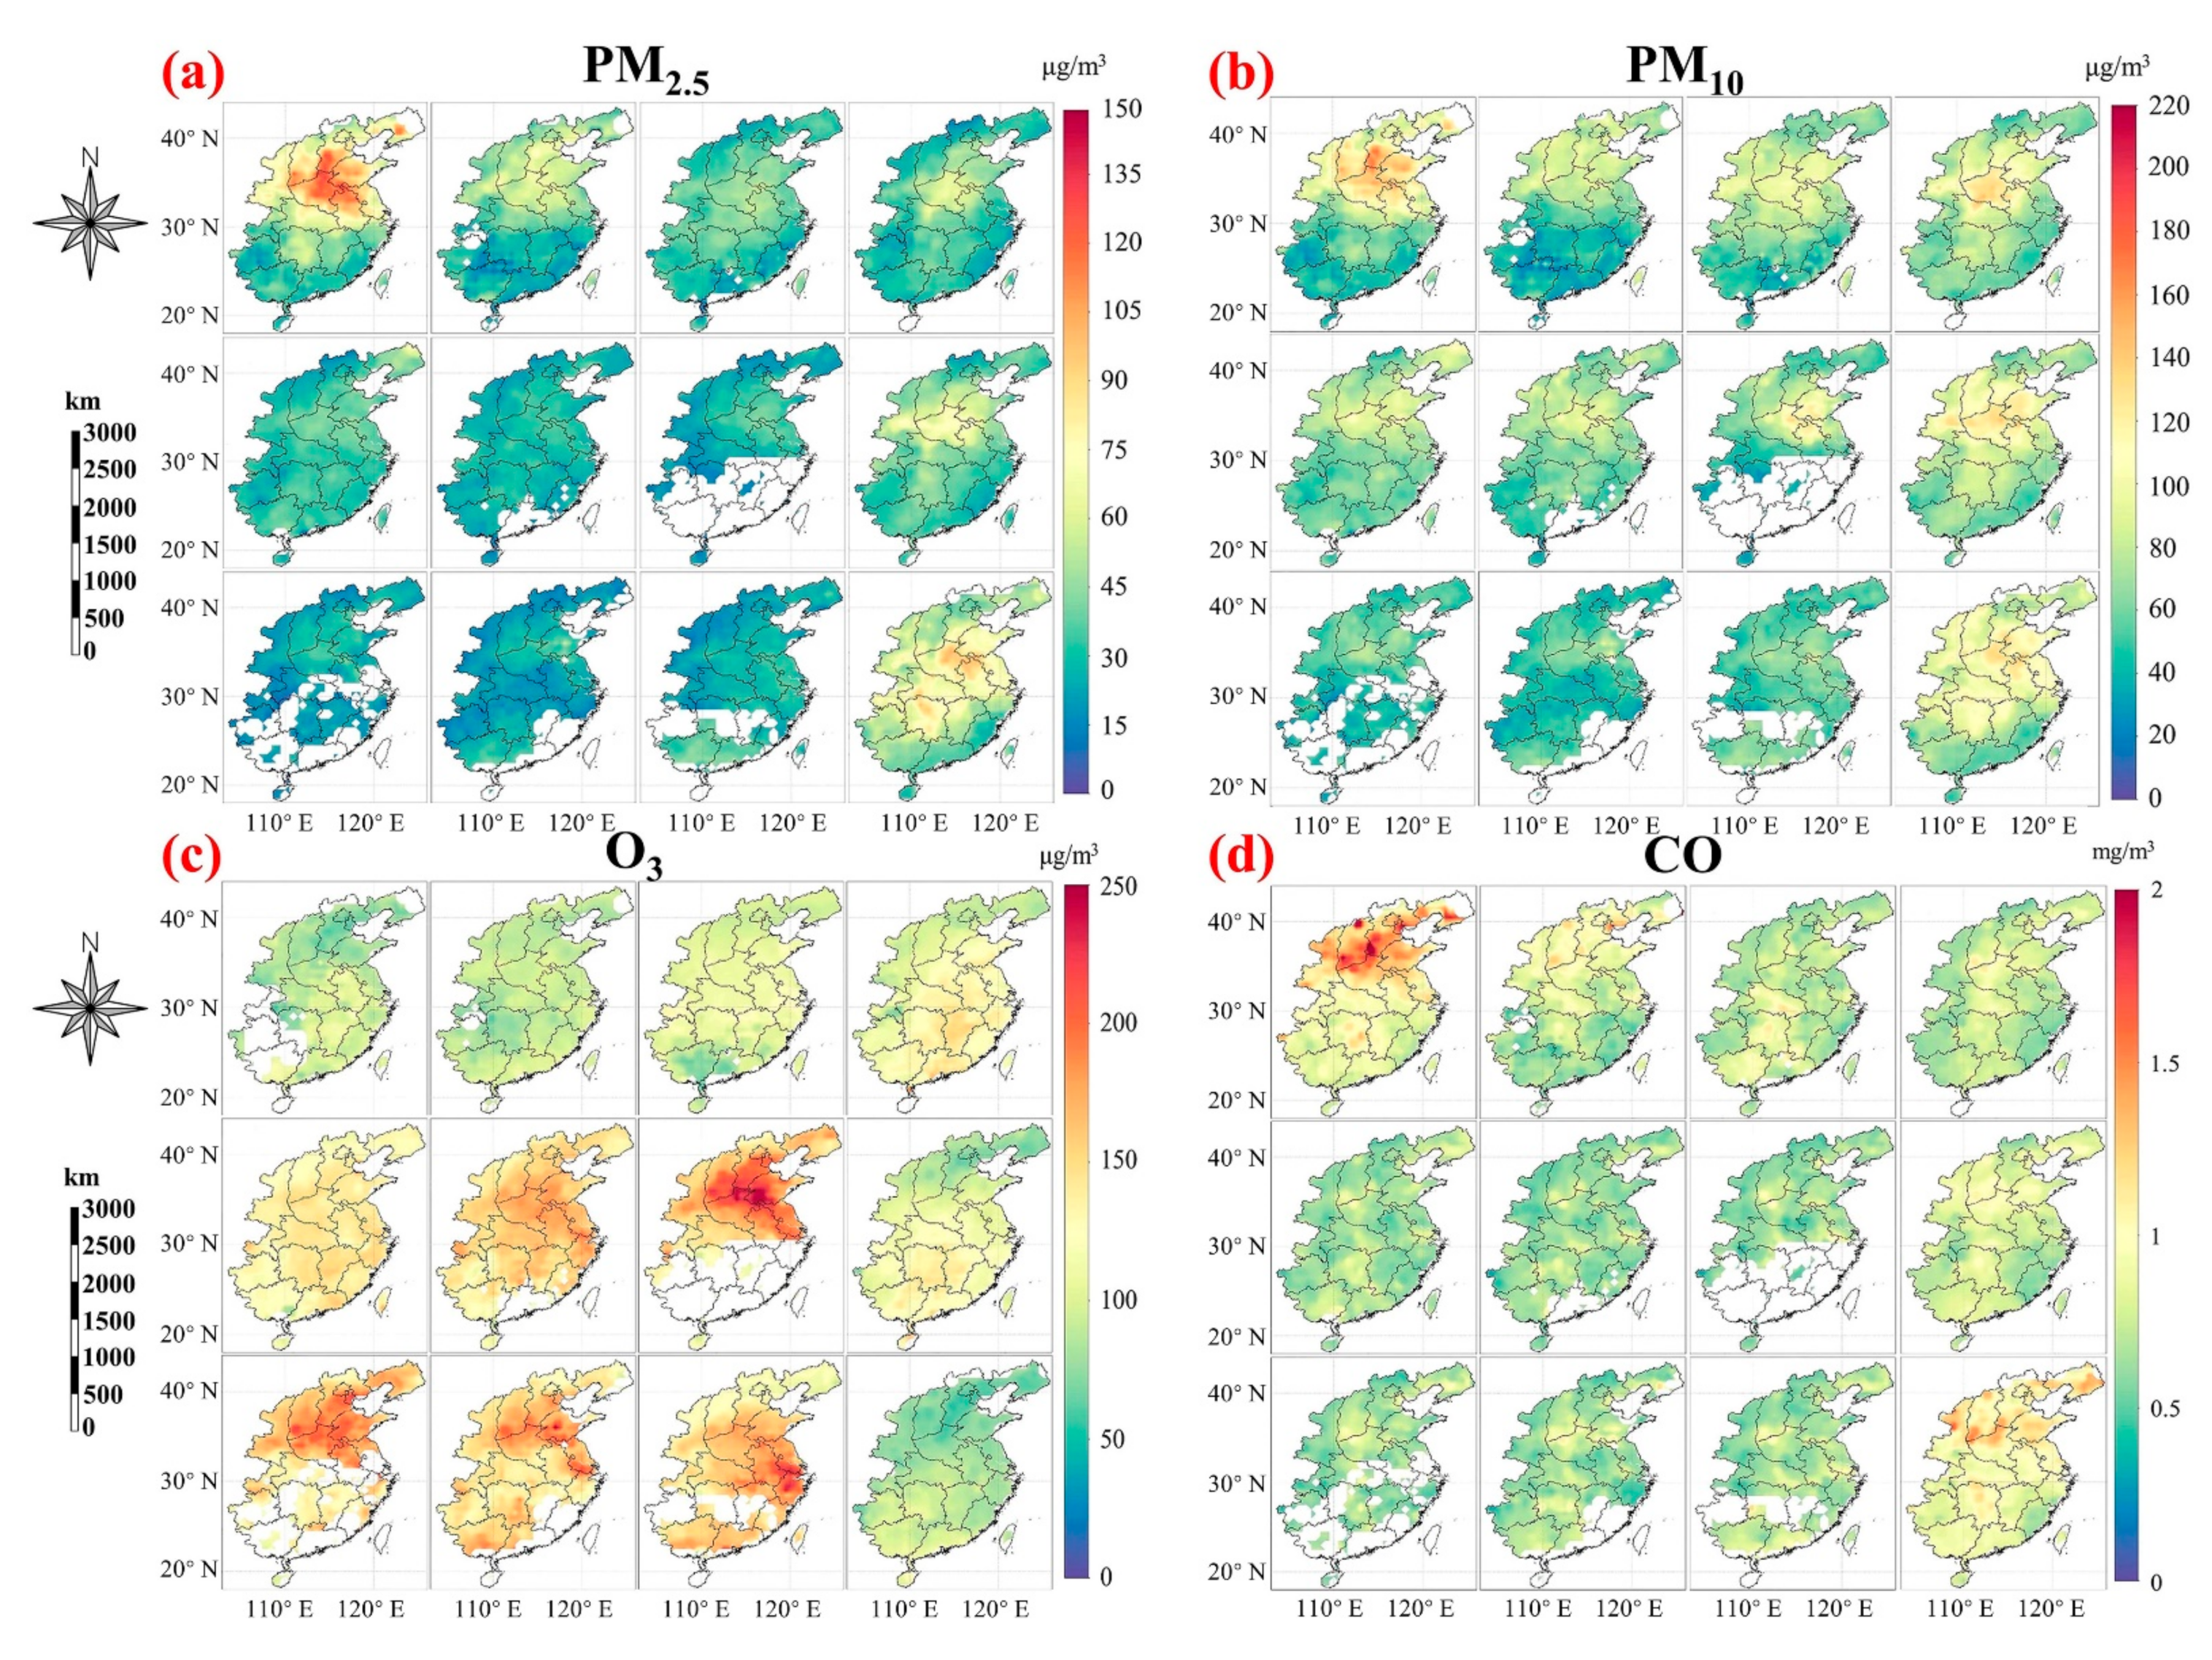
3.3. Seasonal Changes in Air Pollutants in 2020 Compared to 2018 and 2019

The predicted means and standard deviations of the PM2.5, PM10, O3, and CO concentrations are presented in Figure 9. The PM2.5, PM10, and CO concentrations all reach the minimum values in summer 2018–2020, but O3 reaches the maximum value in summer 2018–2020. The rapid changes in PM10 in 2018–2019 occurred in April, but occurred in February for 2019–2020, which may be due to differences in policy implementation. Additionally, the changes in PM10 (−25.8%) in January 2019–2020 were stronger than that of PM2.5 (−13.3%), suggesting that PM10 may be more heavily influenced by policy changes than PM2.5.
Figure 10 shows the daily changes in PM2.5, PM10, O3, and CO concentrations and their linear trends from 2018 to 2020. Results showed that PM2.5, PM10, and CO declined rapidly in February 2020 (44.1%, 43.2%, and 35.9%, respectively) relative to average levels in 2018 and 2019, and their attenuation effects lasted until May (Figure 4 and Figure 10). Similar results have been reported in previous research [13,35]. The changes in PM2.5 and PM10 in the summer of 2020 were not significant, which may be due to the resumption of production [15].
However, the trends of the four air pollutants all reversed in September and October 2020 (decreasing) relative to those in 2018–2019 (increasing) (Figure 4 and Figure 10), which may be linked to the joint attenuation effects of the CAAP and COVID-19 lockdown. Similar seasonal changes in PM2.5, PM10, O3, and CO in 2020 were also predicted from the models, as shown in Figure 7 and Figure 8. Although the declines in O3 concentration were weaker than those of the other three air pollutants, O3 still presented a reversing trend (i.e., rates of change in 2018–2019 and 2019–2020 were 0.0349 and −0.0337 μg/m3/day, respectively). Moreover, the attenuation of air pollutants after lockdown accounted for a large proportion of the annual reduction in 2020.
Figure 10 and Table 1 show that the ground-based observations of changes in air pollutants were relatively consistent with the model predictions, but the rates of changes showed slight differences due to different spatial coverage. However, the model predictions may slightly underestimate the concentrations under extreme weather conditions [32]. Although the reduction ratio of PM10 was larger than that of PM2.5 in 2019–2020, PM2.5 was more strongly influenced by COVID-19 lockdown than PM10. As shown in Figure 4, PM2.5 was the only air pollutant to show a sharply reversing trend in February 2020. Moreover, as shown in Figure 10, the change in O3 concentration was inversely proportional to that of CO, which may be due to their opposite correlation with temperature (0.42 for O3, −0.38 for CO). Likewise, the similar correlations between PM2.5 and PM10 (Figure 2) with input variables may explain their consistent trends in 2018–2020. The three-year time series trends in the concentrations of the air pollutants are consistent with previous studies from 2014 to 2016 [2].

4. Conclusions

We used ground-based observations, re-analysis, and satellite remote sensing data based on ML to analyze the annual and seasonal changes in primary air pollutants over central and eastern China and explore the joint impact of COVID-19 lockdowns and the CAAP on ambient pollution. The RMSE for the PM2.5, PM10, O3, and CO validation dataset were 9.027 μg/m3, 20.312 μg/m3, 10.436 μg/m3, and 0.097 mg/m3, respectively. The differences between the predicted and observed concentrations of PM2.5, PM10, O3, and CO were statistically acceptable, and the geographical RF model showed good performance (R2 = 0.883, RMSE within permissible range) for the four pollutants, indicating that the selected variables were able to explain the changes in the pollutants.
Relative to their concentrations in 2018–2019, the concentrations of PM2.5, PM10, and CO in February 2020 decreased by 44.1%, 43.2%, and 35.9%, respectively. These reductions were influenced by the COVID-19 lockdown and lasted until May 2020. The overall increasing trend in the concentration of O3 was arrested and reversed in 2020. Interestingly, the 2019–2020 trends of the four pollutants all reversed in September and October 2020 relative to the levels observed in 2018–2019, which may be due to the joint effects of the CAAP and COVID-19 lockdown.
Spatially, the concentrations of PM2.5, PM10, and CO showed decreasing trends in almost all regions of central and eastern China, and decreased by 16.4%, 24.2%, and 19.8%, respectively, in 2020 relative to the average levels in 2018 and 2019. The average rate of O3 change was −2.7% in 2020. Although areas with high O3 concentration (NCP, GBA, and Liaotung Peninsula) showed declining trends, the government need still needs to pay attention to uncontaminated areas due to the overall increasing trends (~20–40%). The effect of COVID-19 lockdowns on PM2.5 was stronger than that on PM10, but the annual average rate of PM10 change influenced by policy was larger. Overall, under the combined influence of the CAAP and COVID-19 lockdowns, the ambient air quality improved, but preparations are still required to prevent future haze events.

Supplementary Materials

The following are available online at https://www.mdpi.com/article/10.3390/rs13132525/s1: Figure S1. The detailed structures of RF algorithm for the PM2.5. As the maximum depth of RF algorithm is 15, only the first four levels of decision trees are displayed; Figure S2. The detailed structures of RF algorithm for the PM10. As the maximum depth of RF algorithm is 15, only the first four levels of decision trees are displayed; Figure S3. The detailed structures of RF algorithm for the O3. As the maximum depth of RF algorithm is 15, only the first four levels of decision trees are displayed; Figure S4 The detailed structures of RF algorithm for the CO. As the maximum depth of RF algorithm is 15, only the first four levels of decision trees are displayed.

Author Contributions

Conceptualization, Z.S., X.H., Y.B.; methodology, Z.S., X.H., Y.B.; data analyses and field investigation, Z.S., X.H., Y.B., D.W.; visualization, D.W., T.L.; data interpretation, Z.S., D.W.; writing—original draft, Z.S., X.H., Y.B.; writing—review and editing, X.H., Y.B., T.L.; supervision, X.H., Y.B.; project administration, X.H. and Y.B. All authors have read and agreed to the published version of the manuscript.

Funding

This research was funded by the National Key Research and Development Program of China (Grant #2017YFA0603003), the National Natural Science Foundation of China (Grants #41825014), the Key Special Project for Introduced Talents Team of Southern Marine Science and Engineering Guangdong Laboratory (Guangzhou) (GML2019ZD0602), the Zhejiang Provincial Natural Science Foundation of China (2017R52001), and the Zhejiang Talent Program (LR18D060001).

Institutional Review Board Statement

Not applicable.

Informed Consent Statement

Not applicable.

Data Availability Statement

The ground-based observational data of air pollutant concentrations were provided by the CNEMC (http://www.cnemc.cn/en/, accessed on 10 May 2021). VIIRS data were obtained from NASA LAADS DAAC (https://ladsweb.modaps.eosdis.nasa.gov/search/, accessed on 10 May 2021). The ERA5 re-analysis dataset was downloaded from https://cds.climate.copernicus.eu/#!/home (accessed on 10 May 2021).

Acknowledgments

We gratefully acknowledge NASA LAADS DAAC for providing the VIIRS data, and the European Centre for Medium-Range Weather Forecast (ECMWF) for providing the ERA5 data used in this study. We thank the China National Environmental Monitoring Center (CNEMC) for providing air pollutant concentrations. We thank SOED/SIO/MNR satellite ground station, satellite data processing & sharing center, and marine satellite data online analysis platform (SatCO2) for their help with data collection and processing.

Conflicts of Interest

The authors declare no conflict of interest.

References

  1. Li, R.; Mao, H.; Wu, L.; He, J.; Ren, P.; Li, X. The evaluation of emission control to PM concentration during Beijing APEC in 2014. Atmos. Pollut. Res. 2016, 7, 363–369. [Google Scholar] [CrossRef]
  2. Song, C.; Wu, L.; Xie, Y.; He, J.; Chen, X.; Wang, T.; Lin, Y.; Jin, T.; Wang, A.; Liu, Y.; et al. Air pollution in China: Status and spatiotemporal variations. Environ. Pollut. 2017, 227, 334–347. [Google Scholar] [CrossRef] [PubMed]
  3. Chinese State Council. Action Plan on Air Pollution Prevention and Control 2013. Available online: http://www.gov.cn/zwgk/2013-09/12/content_2486773.htm (accessed on 10 May 2021).
  4. Zhang, M.; Liu, X.; Sun, X.; Wang, W. The influence of multiple environmental regulations on haze pollution: Evidence from China. Atmos. Pollut. Res. 2020, 11, 170–179. [Google Scholar] [CrossRef]
  5. Zhao, S.; Yin, D.; Yu, Y.; Kang, S.; Qin, D.; Dong, L. PM2.5 and O3 pollution during 2015–2019 over 367 Chinese cities: Spatiotemporal variations, meteorological and topographical impacts. Environ. Pollut. 2020, 264, 114694. [Google Scholar] [CrossRef] [PubMed]
  6. Li, K.; Jacob, D.J.; Liao, H.; Zhu, J.; Shah, V.; Shen, L.; Bates, K.H.; Zhang, Q.; Zhai, S. A two-pollutant strategy for improving ozone and particulate air quality in China. Nat. Geosci. 2019, 12, 906–910. [Google Scholar] [CrossRef]
  7. Chen, L.; Zhu, J.; Liao, H.; Yang, Y.; Yue, X. Meteorological influences on PM2.5 and O3 trends and associated health burden since China’s clean air actions. Sci. Total Environ. 2020, 744, 140837. [Google Scholar] [CrossRef] [PubMed]
  8. Chinese State Council. Three-Year Action Plan on Defending the Blue Sky. 2018. Available online: http://www.gov.cn/zhengce/content/2018-07/03/content_5303158.htm (accessed on 10 May 2021). (In Chinese)
  9. Bauwens, M.; Compernolle, S.; Stavrakou, T.; Müller, J.; van Gent, J.; Eskes, H.; Levelt, P.F.; van der A., R.; Veefkind, J.P.; Vlietinck, J.; et al. Impact of coronavirus outbreak on NO2 pollution assessed using TROPOMI and OMI observations. Geophys. Res. Lett. 2020, 47, e2020GL087978. [Google Scholar] [CrossRef] [PubMed]
  10. Ding, J.; van der A., R.J.; Eskes, H.J.; Mijling, B.; Stavrakou, T.; van Geffen, J.H.G.M.; Veefkind, J.P. NOx emissions reduction and rebound in China due to the COVID-19 crisis. Geophys. Res. Lett. 2020, 47. [Google Scholar] [CrossRef]
  11. Griffith, S.M.; Huang, W.-S.; Lin, C.-C.; Chen, Y.-C.; Chang, K.-E.; Lin, T.-H.; Wang, S.-H.; Lin, N.-H. Long-range air pollution transport in East Asia during the first week of the COVID-19 lockdown in China. Sci. Total Environ. 2020, 741, 140214. [Google Scholar] [CrossRef]
  12. Huang, X.; Ding, A.; Gao, J.; Zheng, B.; Zhou, D.; Qi, X.; Tang, R.; Wang, J.; Ren, C.; Nie, W.; et al. Enhanced secondary pollution offset reduction of primary emissions during COVID-19 lockdown in China. Natl. Sci. Rev. 2020, 8. [Google Scholar] [CrossRef]
  13. Liu, L.; Zhang, J.; Du, R.; Teng, X.; Hu, R.; Yuan, Q.; Tang, S.; Ren, C.; Huang, X.; Xu, L.; et al. Chemistry of Atmospheric Fine Particles During the COVID-19 pandemic in a megacity of eastern China. Geophys. Res. Lett. 2020, 48. [Google Scholar] [CrossRef]
  14. Bao, R.; Zhang, A. Does lockdown reduce air pollution? Evidence from 44 cities in northern China. Sci. Total Environ. 2020, 731, 139052. [Google Scholar] [CrossRef]
  15. Sun, Y.; Lei, L.; Zhou, W.; Chen, C.; He, Y.; Sun, J.; Li, Z.; Xu, W.; Wang, Q.; Ji, D.; et al. A chemical cocktail during the COVID-19 outbreak in Beijing, China: Insights from six-year aerosol particle composition measurements during the Chinese New Year holiday. Sci. Total Environ. 2020, 742, 140739. [Google Scholar] [CrossRef]
  16. Nichol, J.; Bilal, M.; Ali, A.; Qiu, Z. Air pollution scenario over China during COVID-19. Remote Sens. 2020, 12, 2100. [Google Scholar] [CrossRef]
  17. Li, L.; Liu, X.; Ge, J.; Chu, X.; Wang, J. Regional differences in spatial spillover and hysteresis effects: A theoretical and empirical study of environmental regulations on haze pollution in China. J. Clean. Prod. 2019, 230, 1096–1110. [Google Scholar] [CrossRef]
  18. Chang, Y.; Huang, R.; Ge, X.; Huang, X.; Hu, J.; Duan, Y.; Zou, Z.; Liu, X.; Lehmann, M.F. Puzzling haze events in China during the coronavirus (COVID-19) shutdown. Geophys. Res. Lett. 2020, 47, e2020GL088533. [Google Scholar] [CrossRef]
  19. Hites, R.A.; Lehman, D.C.; Salamova, A.; Venier, M. Temporal environmental hysteresis: A definition and implications for polybrominated diphenyl ethers. Sci. Total Environ. 2021, 753, 141849. [Google Scholar] [CrossRef]
  20. Yin, S.; Wang, X.; Xiao, Y.; Tani, H.; Zhong, G.; Sun, Z. Study on spatial distribution of crop residue burning and PM2.5 change in China. Environ. Pollut. 2017, 220, 204–221. [Google Scholar] [CrossRef]
  21. Lai, I.-C.; Lee, C.-L.; Huang, H.-C. A new conceptual model for quantifying transboundary contribution of atmospheric pollutants in the East Asian Pacific rim region. Environ. Int. 2016, 88, 160–168. [Google Scholar] [CrossRef] [Green Version]
  22. Lee, S.; Ho, C.-H.; Lee, Y.G.; Choi, H.-J.; Song, C.-K. Influence of transboundary air pollutants from China on the high-PM10 episode in Seoul, Korea for the period October 16–20, 2008. Atmos. Environ. 2013, 77, 430–439. [Google Scholar] [CrossRef]
  23. Lary, D.; Alavi, A.H.; Gandomi, A.; Walker, A.L. Machine learning in geosciences and remote sensing. Geosci. Front. 2016, 7, 3–10. [Google Scholar] [CrossRef] [Green Version]
  24. Liu, R.Y.; Ma, Z.W.; Liu, Y.; Shao, Y.C.; Zhao, W.; Bi, J. Spatiotemporal distributions of surface ozone levels in China from 2005 to 2017: A machine learning approach. Environ. Int. 2020, 142, 105823. [Google Scholar] [CrossRef] [PubMed]
  25. Wei, J.; Huang, W.; Li, Z.; Xue, W.; Peng, Y.; Sun, L.; Cribb, M. Estimating 1-km-resolution PM2.5 concentrations across China using the space-time random forest approach. Remote Sens. Environ. 2019, 231, 111221. [Google Scholar] [CrossRef]
  26. Zhan, Y.; Luo, Y.; Deng, X.; Chen, H.; Grieneisen, M.L.; Shen, X.; Zhu, L.; Zhang, M. Spatiotemporal prediction of continuous daily PM2.5 concentrations across China using a spatially explicit machine learning algorithm. Atmos. Environ. 2017, 155, 129–139. [Google Scholar] [CrossRef]
  27. National Bureau of Statistics of China. China Statistical Yearbook 2019. 2019. Available online: http://www.stats.gov.cn/tjsj/ndsj/2019/indexeh.htm (accessed on 10 May 2021).
  28. Chen, G.; Li, S.; Knibbs, L.; Hamm, N.; Cao, W.; Li, T.; Guo, J.; Ren, H.; Abramson, M.J.; Guo, Y. A machine learning method to estimate PM2.5 concentrations across China with remote sensing, meteorological and land use information. Sci. Total Environ. 2018, 636, 52–60. [Google Scholar] [CrossRef]
  29. Chen, G.; Wang, Y.; Li, S.; Cao, W.; Ren, H.; Knibbs, L.; Abramson, M.J.; Guo, Y. Spatiotemporal patterns of PM10 concentrations over China during 2005–2016: A satellite-based estimation using the random forests approach. Environ. Pollut. 2018, 242, 605–613. [Google Scholar] [CrossRef]
  30. Jones, Z.M.; Linder, F.J. edarf: Exploratory data analysis using random forests. J. Open Source Softw. 2016, 1, 92. [Google Scholar] [CrossRef] [Green Version]
  31. Vu, T.V.; Shi, Z.; Cheng, J.; Zhang, Q.; He, K.; Wang, S.; Harrison, R.M. Assessing the impact of clean air action on air quality trends in Beijing using a machine learning technique. Atmos. Chem. Phys. 2019, 19, 11303–11314. [Google Scholar] [CrossRef] [Green Version]
  32. Liu, J.; Weng, F.; Li, Z. Satellite-based PM2.5 estimation directly from reflectance at the top of the atmosphere using a machine learning algorithm. Atmos. Environ. 2019, 208, 113–122. [Google Scholar] [CrossRef]
  33. Wang, T.; Xue, L.; Brimblecombe, P.; Lam, Y.F.; Li, L.; Zhang, L. Ozone pollution in China: A review of concentrations, meteorological influences, chemical precursors, and effects. Sci. Total Environ. 2017, 575, 1582–1596. [Google Scholar] [CrossRef]
  34. Fan, H.; Zhao, C.; Ma, Z.; Yang, Y. Atmospheric inverse estimates of CO emissions from Zhengzhou, China. Environ. Pollut. 2020, 267, 115164. [Google Scholar] [CrossRef]
  35. Su, T.; Li, Z.; Zheng, Y.; Luan, Q.; Guo, J. Abnormally shallow boundary layer associated with severe air pollution during the COVID-19 lockdown in China. Geophys. Res. Lett. 2020, 47, e2020GL090041. [Google Scholar] [CrossRef]
Figure 1. (a) Study area, including 22 provinces and air quality monitoring stations (red dots) in the central and eastern China; (b) Schematics of geographical random forest (RF) model.
Remotesensing 13 02525 g001
Figure 2. The correlative analysis between input and output variables.
Remotesensing 13 02525 g002
Figure 3. Density plots of daily PM2.5, PM10, O3, and CO concentrations for model training and independent validation. The results for (ad) model training (2018–2019) and (eh) independent validation (2020) for PM2.5, PM10, O3, and CO concentration.
Remotesensing 13 02525 g003
Figure 4. Relative feature importance of the predictors in geographical RF model simulations.
Remotesensing 13 02525 g004
Figure 5. The learning curve of the geographical RF models for (a) PM2.5, (b) PM10, (c) O3, and (d) CO.
Remotesensing 13 02525 g005
Figure 6. Spatial distributions of model-predicted PM2.5, PM10, O3, and CO concentrations in February, May, August, and November 2020 and their relative annual rates of change. (a) Spatial distributions of PM2.5, PM10, O3, and CO, respectively; (b) Relative annual average changes in PM2.5, PM10, O3, and CO concentrations, respectively. White area indicates no data.
Remotesensing 13 02525 g006
Figure 7. Seasonal spatial distributions of model-predicted PM2.5, PM10, O3, and CO concentration averaged from 2018 to 2019 over the central and eastern China. (a) PM2.5; (b) PM10; (c) O3; (d) CO. White area indicates no data.
Remotesensing 13 02525 g007
Figure 8. Monthly spatial distributions of model-predicted PM2.5, PM10, O3, and CO concentration in 2020 over the central and eastern China. (a) PM2.5; (b) PM10; (c) O3; (d) CO. White area indicates no data.
Remotesensing 13 02525 g008
Figure 9. Mean concentrations changes of PM2.5, PM10, O3, and CO based on geographical RF model from 2018 to 2020. (a) PM2.5, (b) PM10, (c) O3, and (d) CO.
Remotesensing 13 02525 g009
Figure 10. The three-year time series changes of daily PM2.5, PM10, O3, and CO concentration based on site measurement and model prediction from 1 January 2018 to 31 December 2020 over the Central and Eastern China. (a) The changes for PM2.5; (b) PM10; (c) O3; (d) CO.
Remotesensing 13 02525 g010
Table 1. The rates of changes of daily PM2.5, PM10, O3, and CO concentration based on site measurement and model prediction from 1 January 2018 to 31 December 2020 over Central and Eastern China.
Air Pollutant TypeRate of Change (2018–2019)
Unit: μg/m3/day
Rate of Change (2019–2020)
Unit: μg/m3/day
Site MeasurementModel PredictionSite MeasurementModel Prediction
PM2.5−0.0145−0.0153−0.0209−0.0215
PM10−0.0276−0.0393−0.0324−0.0439
O30.02350.0349−0.0364−0.0337
CO−0.2551−0.2653−0.3082−0.3038
Publisher’s Note: MDPI stays neutral with regard to jurisdictional claims in published maps and institutional affiliations.

