
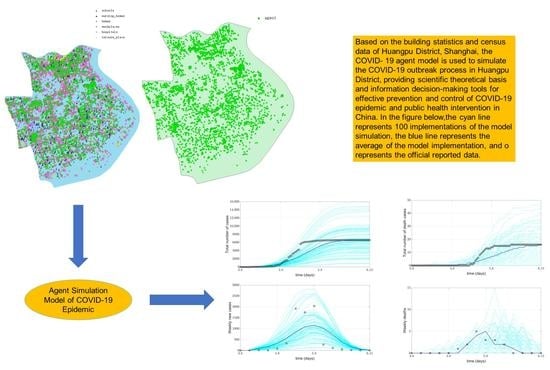
Agent Simulation Model of COVID-19 Epidemic Agent-Based on GIS: A Case Study of Huangpu District, Shanghai

Abstract
:
1. Introduction
2. Materials and Methods
2.1. Data Sources
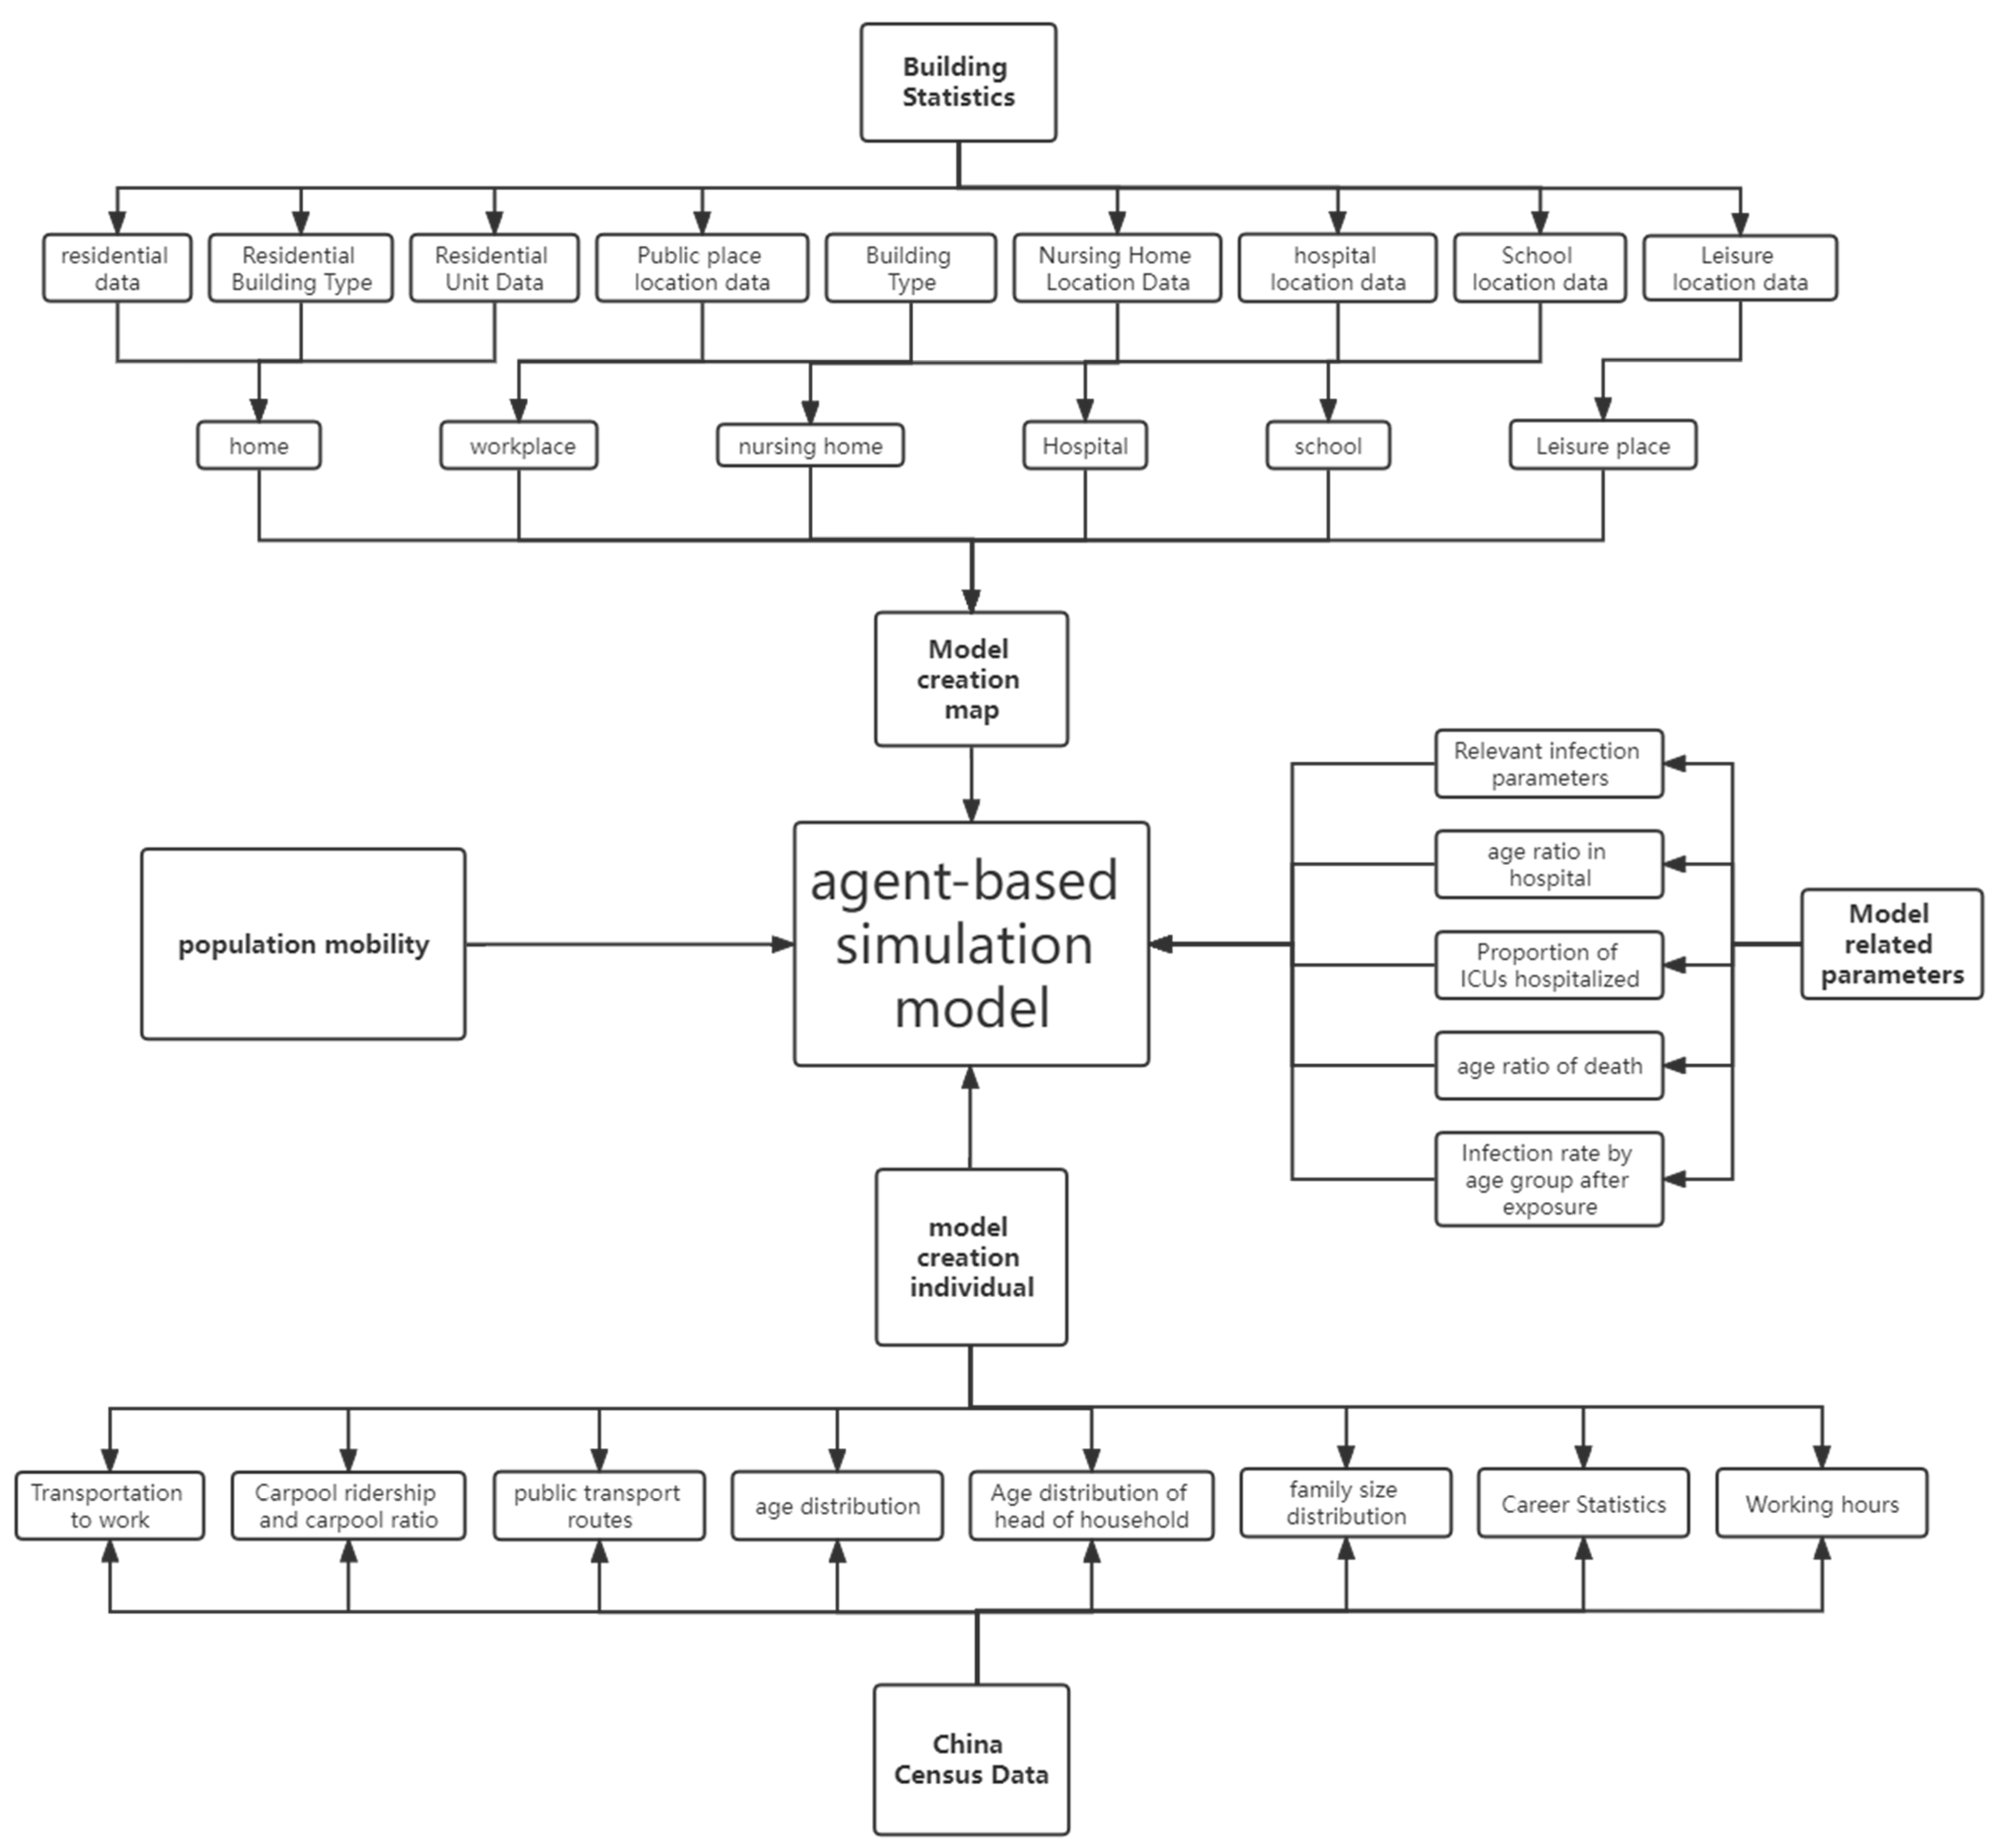
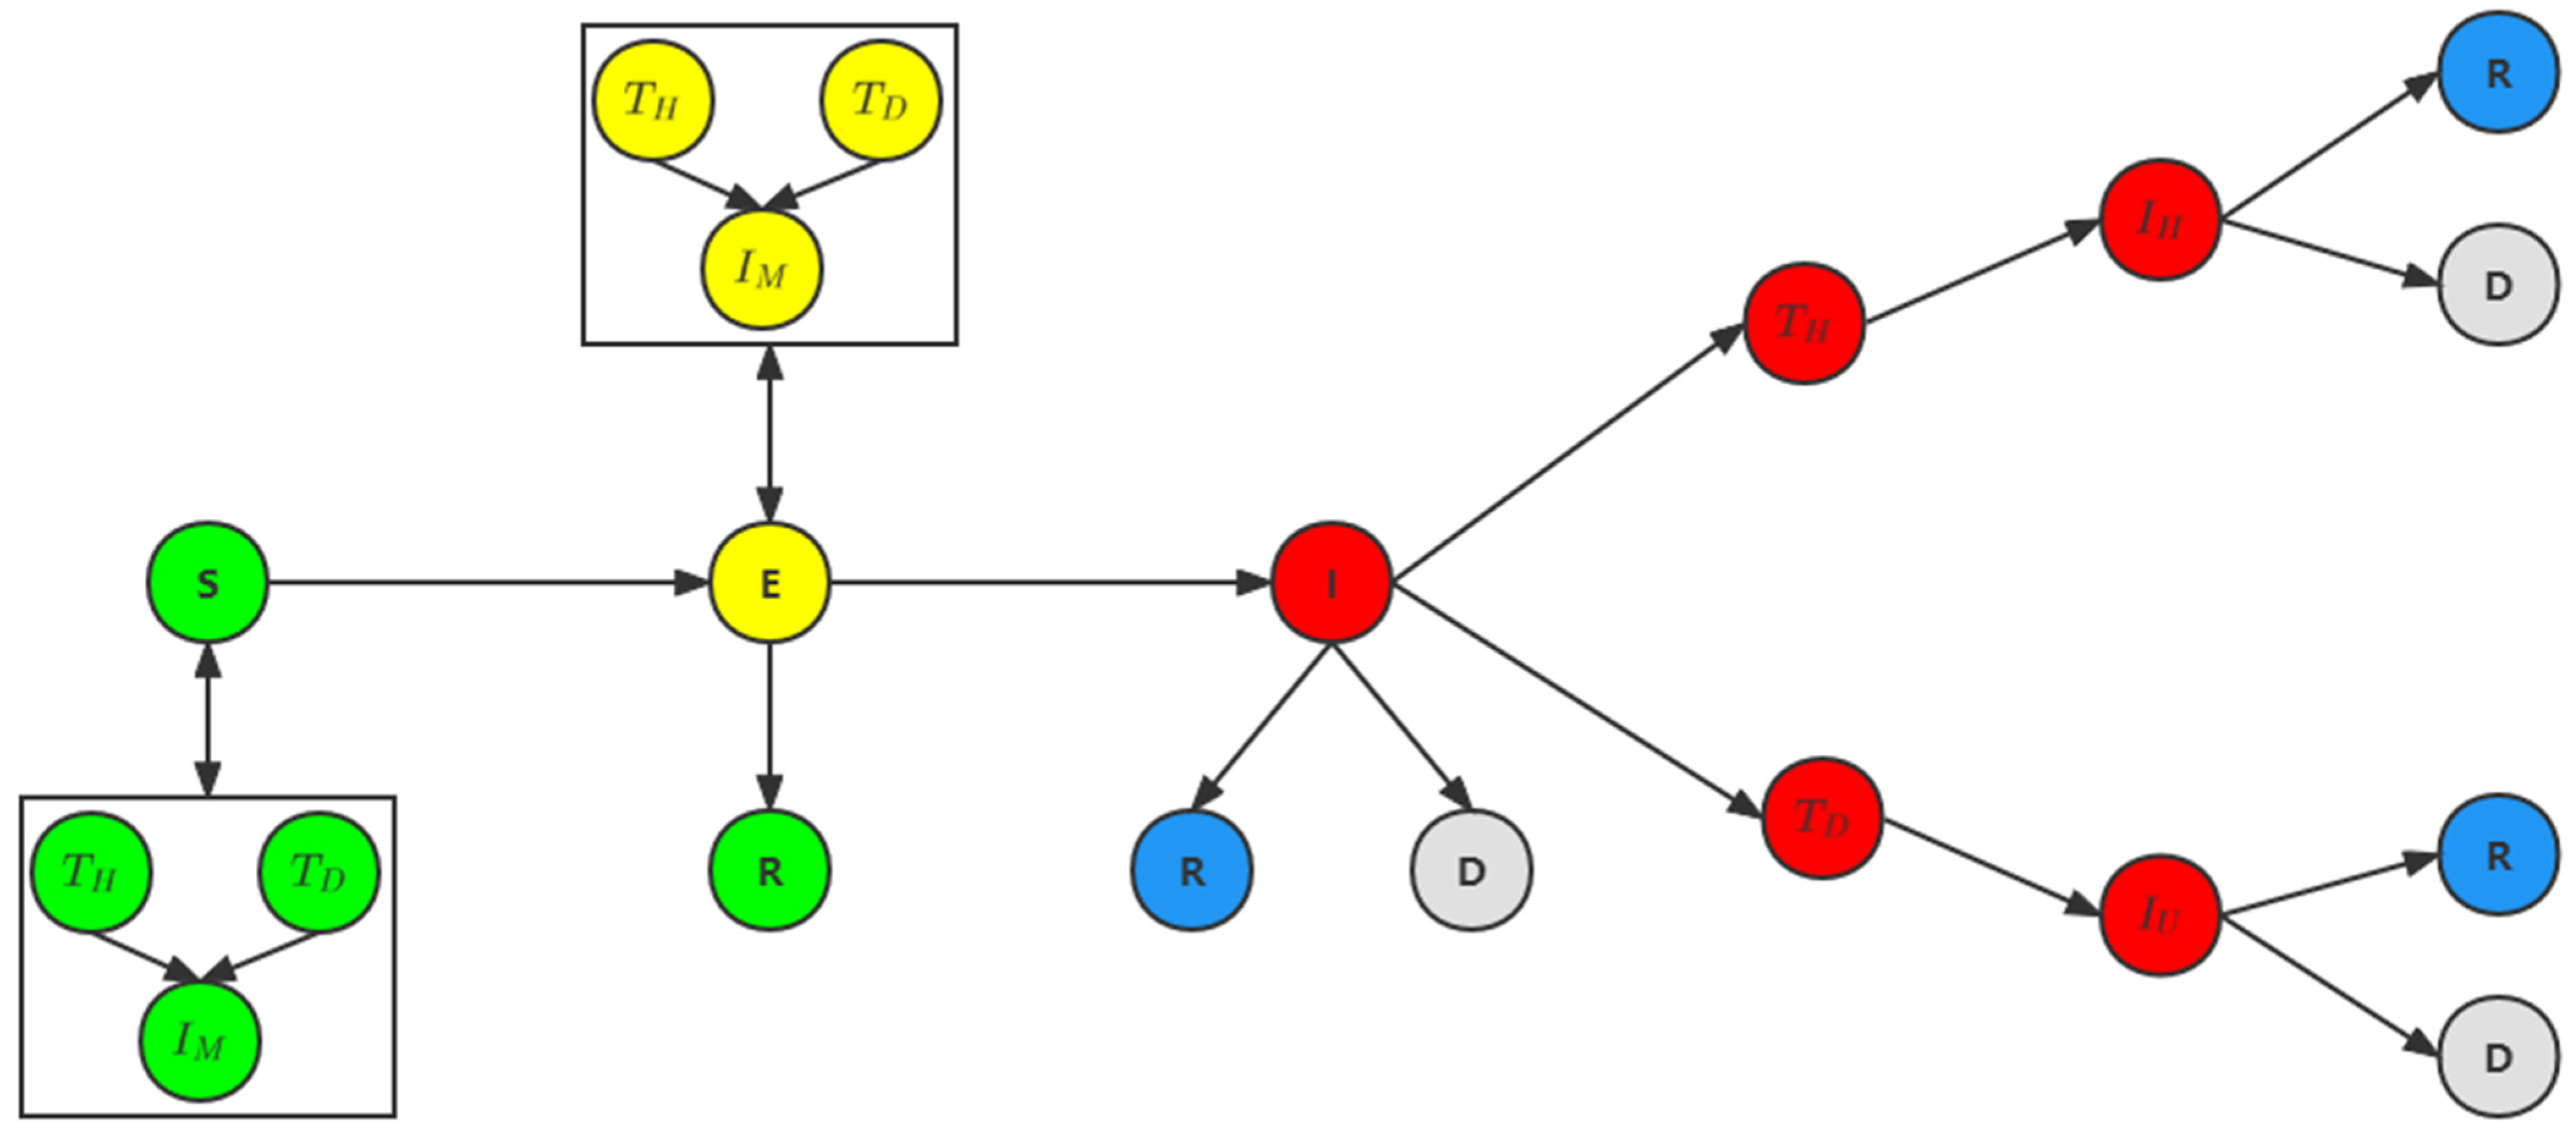
2.2. Model Overview
2.3. Model Calibration
3. Results
3.1. Descriptive Analysis
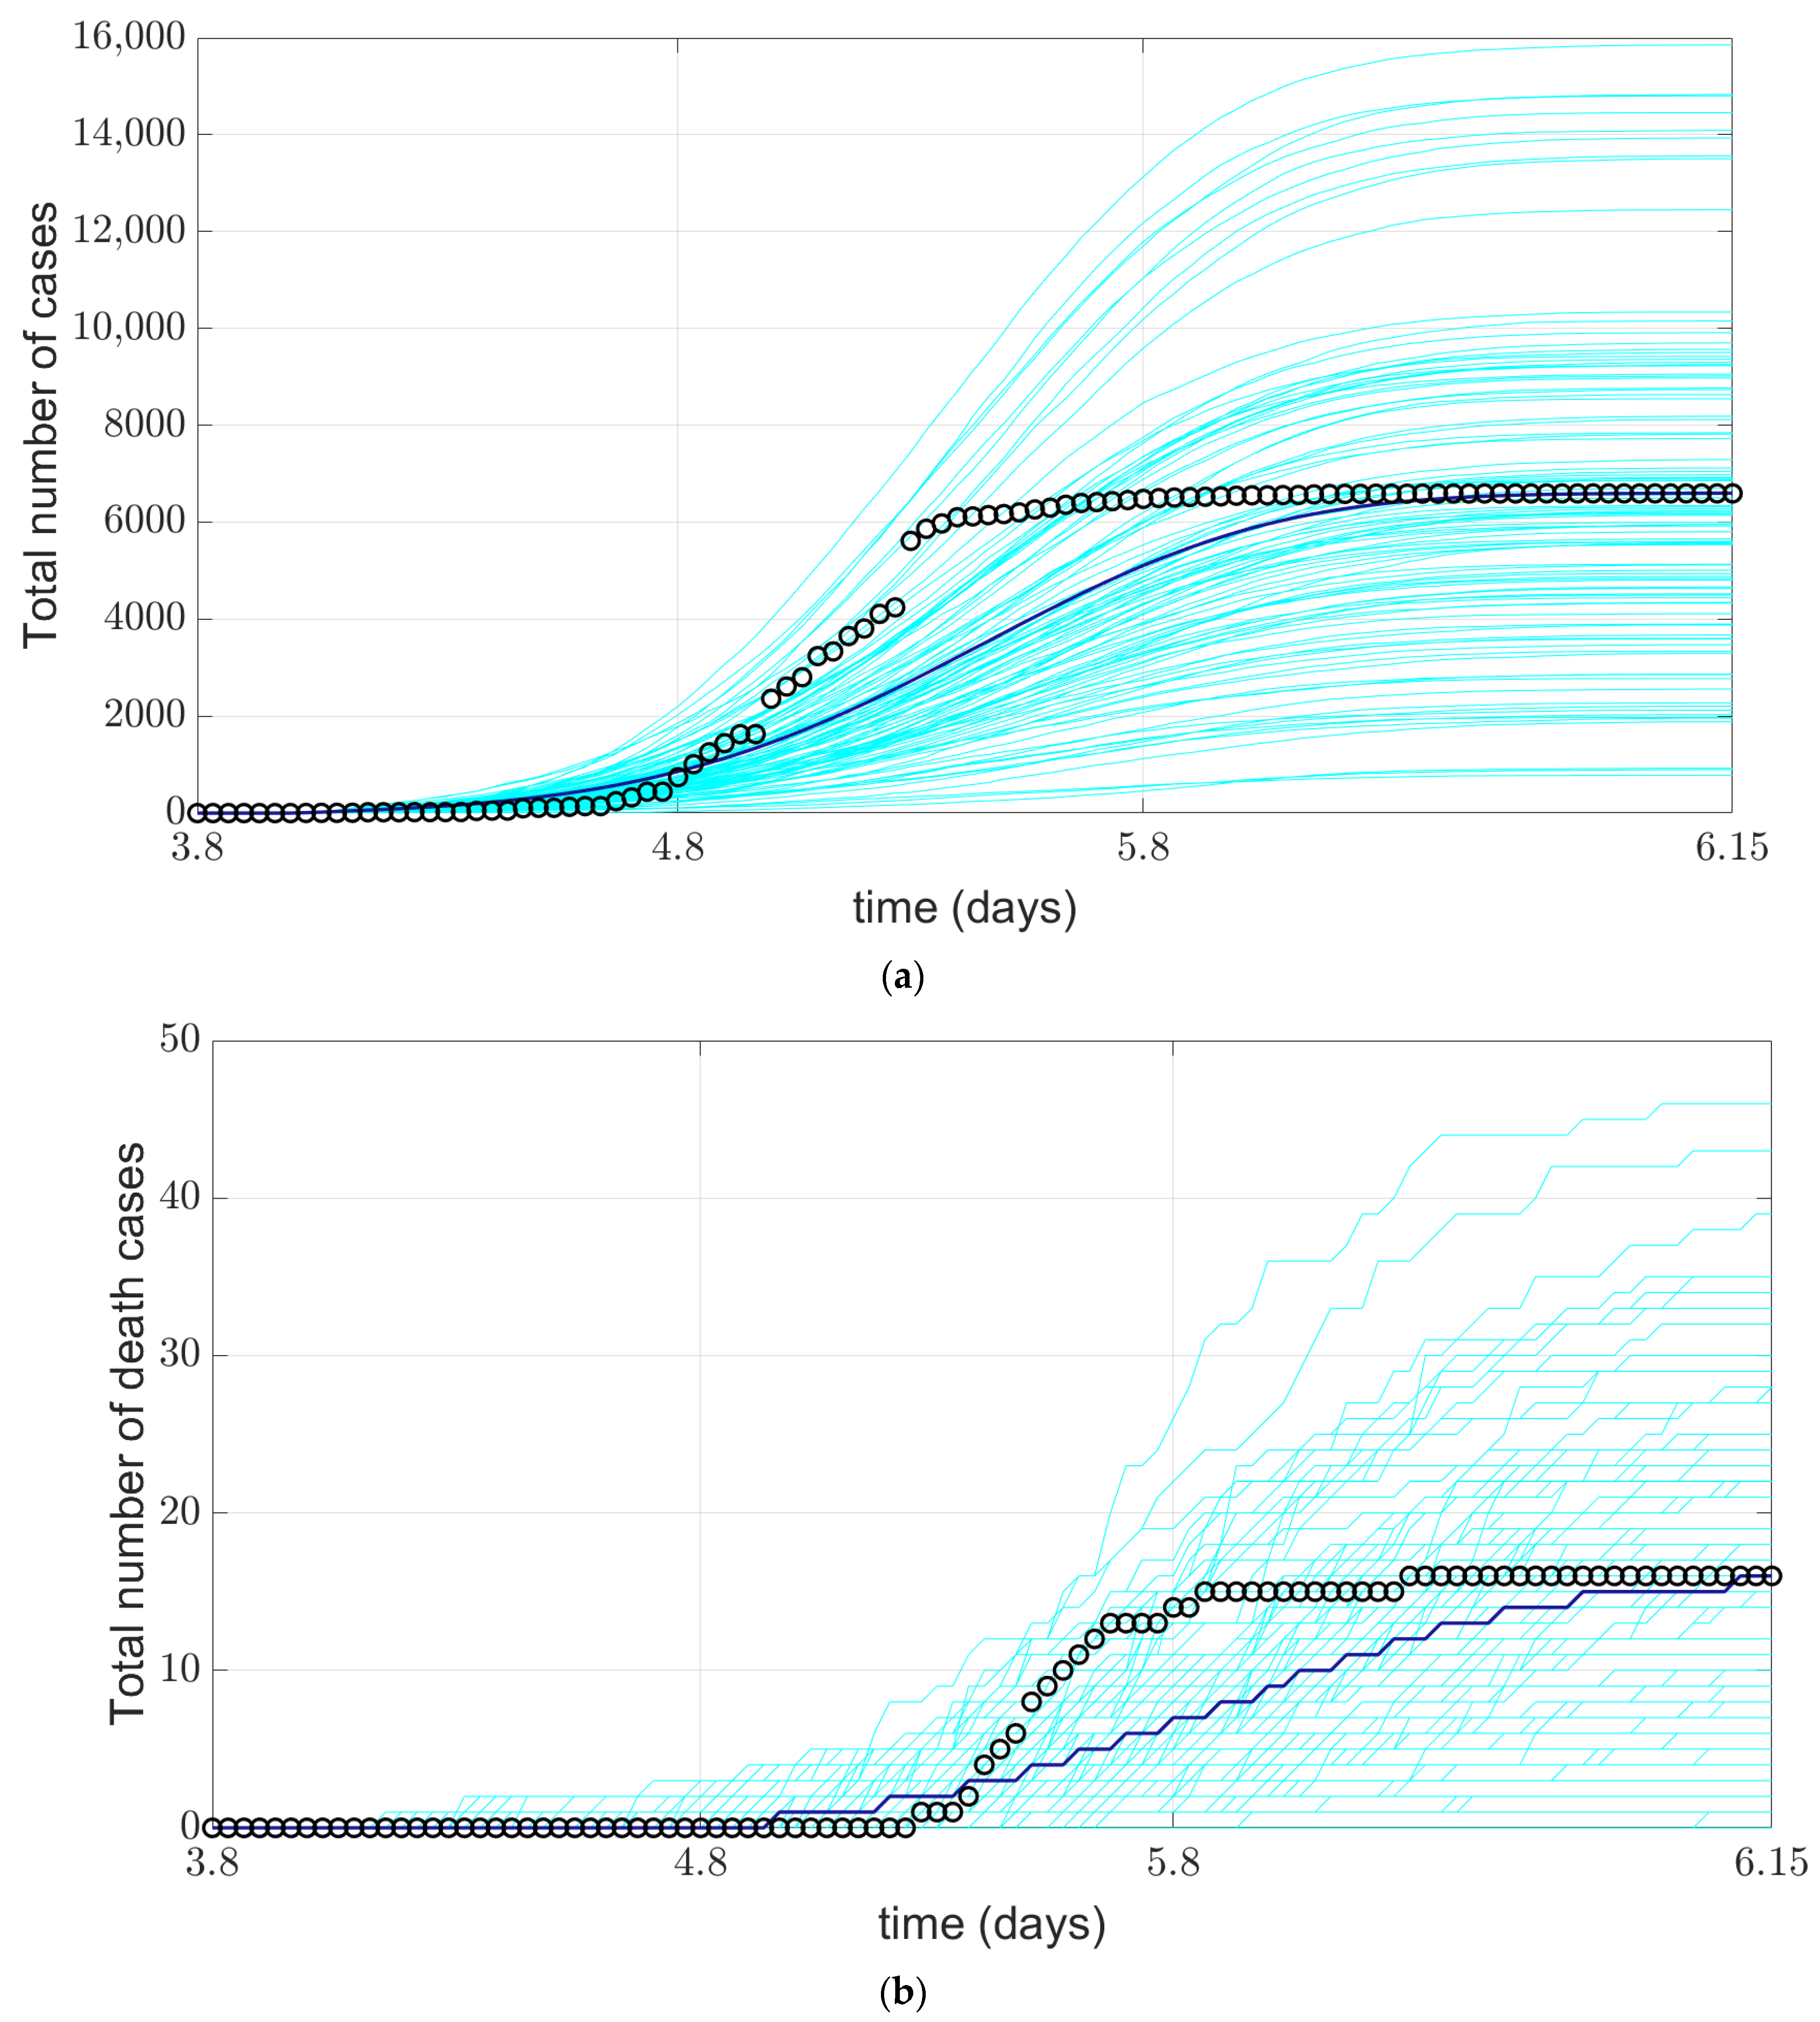
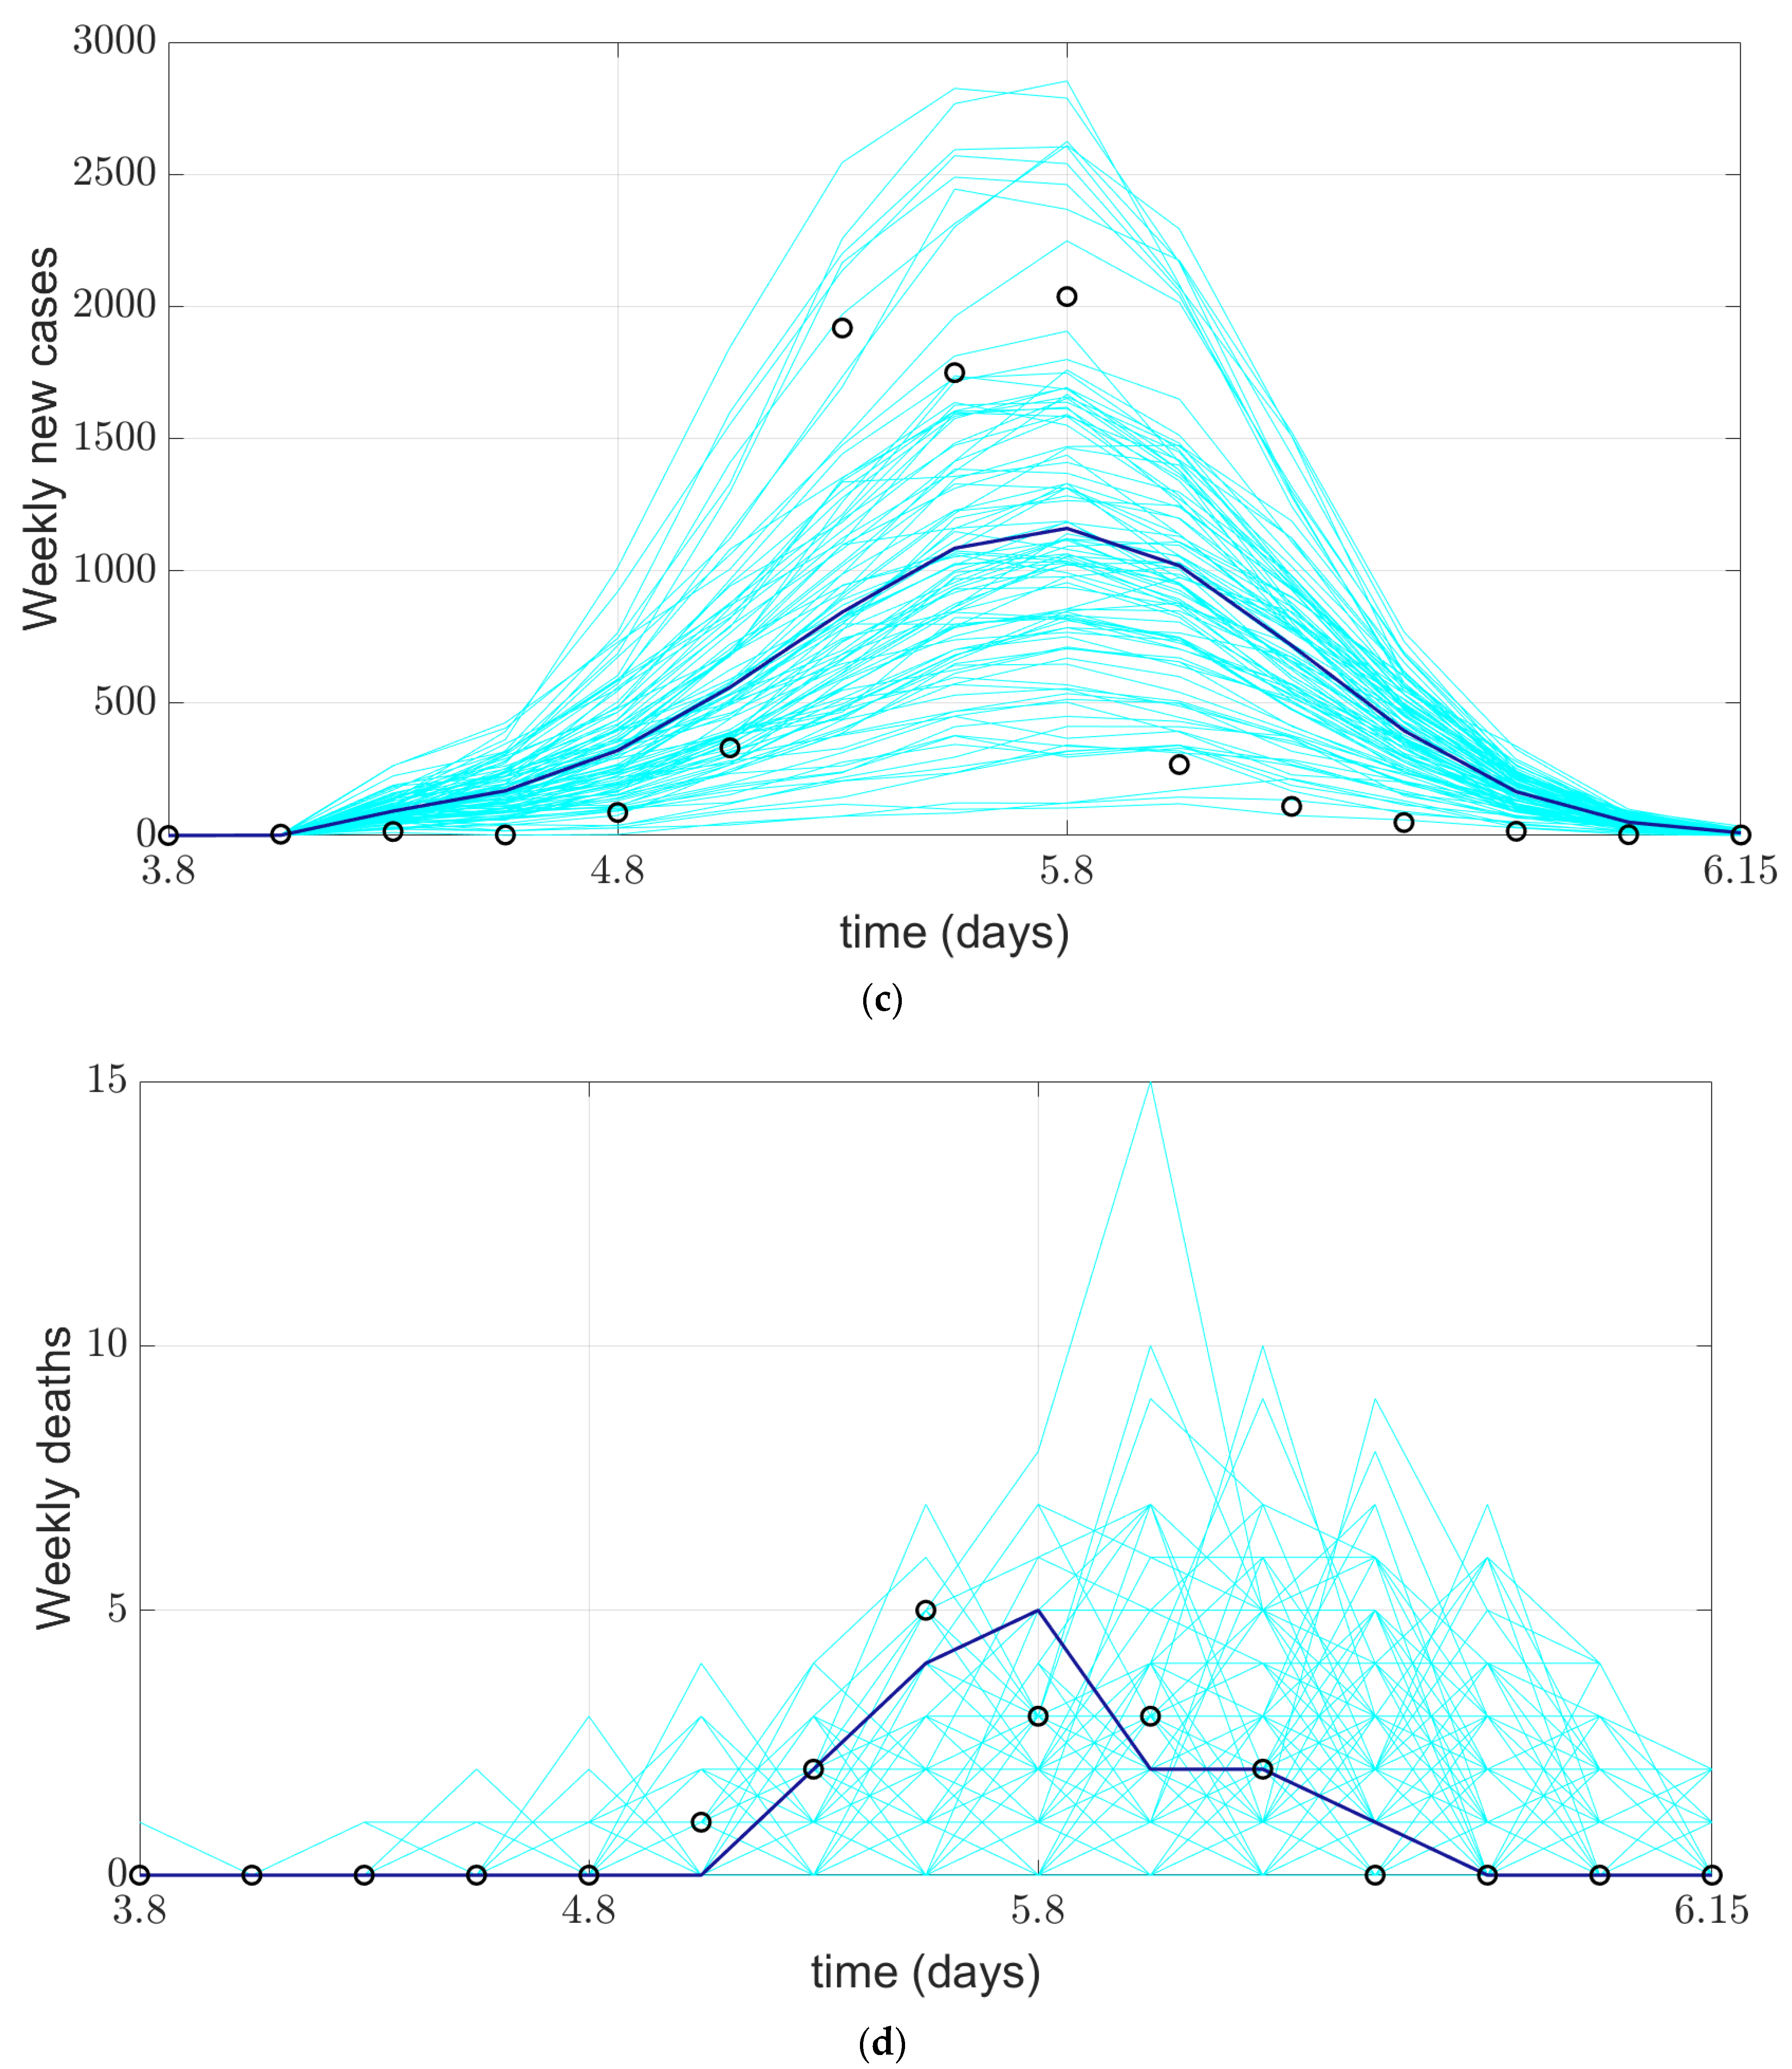
3.2. Model Implementation
4. Discussion
5. Conclusions
Author Contributions
Funding
Institutional Review Board Statement
Informed Consent Statement
Data Availability Statement
Acknowledgments
Conflicts of Interest
References
- Huang, C.; Wang, Y.; Li, X.; Ren, L.; Zhao, J.; Hu, Y.; Zhang, L.; Fan, G.; Xu, J.; Gu, X.; et al. Clinical features of patients infected with 2019 novel coronavirus in Wuhan, China. Lancet 2020, 395, 497–506. [Google Scholar] [CrossRef]
- Sherpa, L.S. A review on various aspect of COVID-19. J. Drug Deliv. Ther. 2020, 10, 300–303. [Google Scholar] [CrossRef]
- World Health Organization. WHO Coronavirus Disease (COVID-19) Dashboard. 2022. Available online: https://covid19.who.int (accessed on 15 June 2022).
- Salathé, M.; Althaus, C.L.; Neher, R.; Stringhini, S.; Hodcroft, E.; Fellay, J.; Zwahlen, M.; Senti, G.; Battegay, M.; Wilder-Smith, A.; et al. COVID-19 epidemic in Switzerland: On the importance of testing, contact tracing and isolation. Swiss Med. Wkly. 2020, 150, w20225. [Google Scholar] [CrossRef] [PubMed]
- Aleta, A.; Martín-Corral, D.; Piontti, A.P.; Ajelli, M.; Litvinova, M.; Chinazzi, M.; Dean, N.E.; Halloran, M.E.; Longini, I.M., Jr.; Merler, S.; et al. Modelling the impact of testing, contact tracing and household quarantine on second waves of COVID-19. Nat. Hum. Behav. 2020, 4, 964–971. [Google Scholar] [CrossRef] [PubMed]
- Unwin, H.J.T.; Mishra, S.; Bradley, V.C.; Gandy, A.; Mellan, T.A.; Coupland, H.; Ish-Horowicz, J.; Vollmer, M.A.C.; Whittaker, C.; Filippi, S.L.; et al. State-level tracking of COVID-19 in the United States. Nat. Commun. 2020, 11, 6189. [Google Scholar] [CrossRef]
- Reyna-Lara, A.; Soriano-Paños, D.; Gómez, S.; Granell, C.; Matamalas, J.T.; Steinegger, B.; Arenas, A.; Gómez-Gardeñes, J. Virus spread versus contact tracing: Two competing contagion processes. Phys. Rev. Res. 2021, 3, 013163. [Google Scholar] [CrossRef]
- Singh, R.; Liu, F.; Shroff, N.B. A Partially Observable MDP Approach for Sequential Testing for Infectious Diseases such as COVID-19. arXiv 2020, arXiv:2007.13023. [Google Scholar]
- Heidarzadeh, A.; Narayanan, K. Two-Stage Adaptive Pooling with RT-qPCR for COVID-19 Screening. In Proceedings of the ICASSP 2021—2021 IEEE International Conference on Acoustics, Speech and Signal Processing (ICASSP), Toronto, ON, Canada, 6–11 June 2021. [Google Scholar]
- Qi, H.; Xiao, S.; Shi, R.; Ward, M.P.; Chen, Y.; Tu, W.; Su, Q.; Wang, W.; Wang, X.; Zhang, Z. COVID-19 transmission in Mainland China is associated with temperature and humidity: A time-series analysis. Sci. Total Environ. 2020, 728, 138778. [Google Scholar] [CrossRef]
- Amir-Behghadami, M.; Janati, A. The importance of designing and implementing participatory surveillance system: An approach as early detection and prevention of novel coronavirus (2019-nCov). Am. J. Infect. Control 2020, 48, 731. [Google Scholar] [CrossRef]
- Evans, L.K.; Shinagawa, A.; Sutton, S.; Calvo, L. COVID-19 Drive-Through Point of Screening and Testing (POST) System: A Safe, Efficient, and Adaptable Model for Nasopharyngeal Swab Collection. Disaster Med. Public Health Prep. 2020, 16, 194–200. [Google Scholar] [CrossRef]
- Lindholm, D.A.; Kiley, J.L.; Jansen, N.K.; Hoard, R.T.; Bondaryk, M.R.; Stanley, E.M.; Alvarado, G.R.; Markelz, A.E.; Cybulski, R.J.; Okulicz, J.F. Outcomes of Coronavirus Disease 2019 Drive-Through Screening at an Academic Military Medical Center. Open Forum Infect. Dis. 2020, 7, ofaa306. [Google Scholar] [CrossRef] [PubMed]
- Jiao, J.; Liu, Z.; Cai, S. Dynamics of an SEIR model with infectivity in incubation period and homestead-isolation on the susceptible. Appl. Math. Lett. 2020, 107, 106442. [Google Scholar] [CrossRef] [PubMed]
- Della Rossa, F.; Salzano, D.; Di Meglio, A.; De Lellis, F.; Coraggio, M.; Calabrese, C.; Guarino, A.; Cardona-Rivera, R.; De Lellis, P.; Liuzza, D.; et al. A network model of Italy shows that intermittent regional strategies can alleviate the COVID-19 epidemic. Nat. Commun. 2020, 11, 5106. [Google Scholar] [CrossRef] [PubMed]
- Estrada, E. COVID-19 and SARS-CoV-2. Modeling the present, looking at the future. Phys. Rep. 2020, 869, 1–51. [Google Scholar] [CrossRef] [PubMed]
- Vespignani, A.; Tian, H.; Dye, C.; Lloyd-Smith, J.O.; Eggo, R.M.; Shrestha, M.; Scarpino, S.V.; Gutierrez, B.; Kraemer, M.U.; Wu, J.; et al. Modelling COVID-19. Nat. Rev. Phys. 2020, 2, 279–281. [Google Scholar] [CrossRef]
- Gilbert, M.; Pullano, G.; Pinotti, F.; Valdano, E.; Poletto, C.; Boëlle, P.-Y.; D’Ortenzio, E.; Yazdanpanah, Y.; Eholie, S.P.; Altmann, M.; et al. Preparedness and vulnerability of African countries against importations of COVID-19: A modelling study. Lancet 2020, 395, 871–877. [Google Scholar] [CrossRef]
- Baldea, I. Suppression of Groups Intermingling as an Appealing Option for Flattening and Delaying the Epidemiological Curve While Allowing Economic and Social Life at a Bearable Level during the COVID-19 Pandemic. Adv. Theory Simul. 2020, 3, 2000132. [Google Scholar] [CrossRef]
- Perez, L.; Dragicevic, S. An agent-based approach for modeling dynamics of contagious disease spread. Int. J. Health Geogr. 2009, 8, 50. [Google Scholar] [CrossRef]
- Ajelli, M.; Gonçalves, B.; Balcan, D.; Colizza, V.; Hu, H.; Ramasco, J.J.; Merler, S.; Vespignani, A. Comparing large-scale computational approaches to epidemic modeling: Agent-based versus structured metapopulation models. BMC Infect. Dis. 2010, 10, 190. [Google Scholar] [CrossRef]
- Perra, N.; Gonçalves, B. Modeling and Predicting Human Infectious Diseases. In Social Phenomena; Springer: Cham, Switzerland, 2015. [Google Scholar]
- Ferguson, N.M.; Cummings, D.A.; Cauchemez, S.; Fraser, C.; Riley, S.; Meeyai, A.; Iamsirithaworn, S.; Burke, D.S. Strategies for containing an emerging influenza pandemic in Southeast Asia. Nature 2005, 437, 209–214. [Google Scholar] [CrossRef]
- Ferguson, N.M.; Cummings, D.A.T.; Fraser, C.; Cajka, J.; Cooley, P.C.; Burke, D.S. Strategies for mitigating an influenza pandemic. Nature 2006, 442, 448–452. [Google Scholar] [CrossRef] [PubMed]
- Truszkowska, A.; Behring, B.; Hasanyan, J.; Zino, L.; Butail, S.; Caroppo, E.; Jiang, Z.P.; Rizzo, A.; Porfiri, M. High-Resolution Agent-Based Modeling of COVID-19 Spreading in a Small Town. Adv. Theory Simul. 2021, 4, 2000277. [Google Scholar] [CrossRef]
- Ferguson, N.M.; Laydon, D.; Nedjati-Gilani, G.; Imai, N.; Ainslie, K.; Baguelin, M.; Bhatia, S.; Boonyasiri, A.; Cucunubá, Z.; Cuomo-Dannenburg, G.; et al. Impact of Non-Pharmaceutical Interventions (NPIs) to Reduce COVID-19 Mortality and Healthcare Demand; Imperial College COVID-19 Response Team: London, UK, 2020. [Google Scholar]
- Koo, J.R.; Cook, A.R.; Park, M.; Sun, Y.; Sun, H.; Lim, J.T.; Tam, C.; Dickens, B.L. Interventions to mitigate early spread of SARS-CoV-2 in Singapore: A modelling study. Lancet Infect. Dis. 2020, 20, 678–688. [Google Scholar] [CrossRef]
- Müller, S.A.; Balmer, M.; Charlton, W.; Ewert, R.; Neumann, A.; Rakow, C.; Schlenther, T.; Nagel, K. Predicting the effects of COVID-19 related interventions in urban settings by combining activity-based modelling, agent-based simulation, and mobile phone data. PLoS ONE 2021, 16, e0259037. [Google Scholar] [CrossRef] [PubMed]
- Gressman, P.T.; Peck, J.R. Simulating COVID-19 in a university environment. Math. Biosci. 2020, 328, 108436. [Google Scholar] [CrossRef]
- Hinch, R.; Probert, W.J.; Nurtay, A.; Kendall, M.; Wymant, C.; Hall, M.; Lythgoe, K.; Bulas Cruz, A.; Zhao, L.; Stewart, A.; et al. OpenABM-COVID-19—An agent-based model for non-pharmaceutical interventions against COVID-19 including contact tracing. PLoS Comput. Biol. 2021, 17, e1009146. [Google Scholar] [CrossRef]
- Yin, L.; Zhang, H.; Li, Y.; Liu, K.; Chen, T.; Luo, W.; Lai, S.; Li, Y.; Tang, X.; Ning, L.I.; et al. Effectiveness of Contact Tracing, Mask Wearing and Prompt Testing on Suppressing COVID-19 Resurgences in Megacities: An Individual-Based Modelling Study. 2021. Available online: https://papers.ssrn.com/sol3/papers.cfm?abstract_id=3750214 (accessed on 15 June 2022).
- Tatapudi, H.; Das, R.; Das, T.K. Impact of vaccine prioritization strategies on mitigating COVID-19: An agent-based simulation study using an urban region in the United States. BMC Med. Res. Methodol. 2021, 21, 272. [Google Scholar] [CrossRef]
- Kuzdeuov, A.; Baimukashev, D.; Karabay, A.; Ibragimov, B.; Mirzakhmetov, A.; Nurpeiissov, M.; Lewis, M.; Varol, H.A. A Network-Based Stochastic Epidemic Simulator: Controlling COVID-19 With Region-Specific Policies. IEEE J. Biomed. Heal Inform. 2020, 24, 2743–2754. [Google Scholar] [CrossRef]
- Kerr, C.C.; Stuart, R.M.; Mistry, D.; Abeysuriya, R.G.; Rosenfeld, K.; Hart, G.R.; Núñez, R.C.; Cohen, J.A.; Selvaraj, P.; Hagedorn, B.; et al. Covasim: An agent-based model of COVID-19 dynamics and interventions. PLoS Comput. Biol. 2021, 17, e1009149. [Google Scholar] [CrossRef]
- SO, A. Geospatially Referenced Demographic Agent-Based Modeling of SARS-CoV-2-Infection (COVID-19) Dynamics and Mitigation Effects in a Real-world Community. medRxiv, 2020; preprint. [Google Scholar]
- Gopalan, A.; Tyagi, H. How Reliable are Test Numbers for Revealing the COVID-19 Ground Truth and Applying Interventions? J. Indian Inst. Sci. 2020, 100, 863–884. [Google Scholar] [CrossRef]
- Keskinocak, P.; Oruc, B.E.; Baxter, A.; Asplund, J.; Serban, N. The impact of social distancing on COVID19 spread: State of Georgia case study. PLoS ONE 2020, 15, e0239798. [Google Scholar] [CrossRef] [PubMed]
- Zhou, S.; Zhou, S.; Zheng, Z.; Lu, J.; Song, T. Risk assessment for precise intervention of COVID-19 epidemic based on available big data and spatio-temporal simulation method: Empirical evidence from different public places in Guangzhou, China. Appl. Geogr. 2022, 143, 102702. [Google Scholar] [CrossRef] [PubMed]
- Jiang, J.; Luo, L. Influence of population mobility on the novel coronavirus disease (COVID-19) epidemic: Based on panel data from Hubei, China. Glob. Health Res. Policy 2020, 5, 30. [Google Scholar] [CrossRef] [PubMed]
- NASDAQ:AMAP. 2022. Available online: https://mobile.amap.com/ (accessed on 10 March 2022).
- Google, Google Maps. 2022. Available online: https://www.google.com/maps (accessed on 10 March 2022).
- National Health Commission of the People’s Republic of China, 2020. 2020. Available online: http://www.nhc.gov.cn/ (accessed on 15 June 2022).
- Shanghai Municipal Health Commission. 2022. Available online: https://wsjkw.sh.gov.cn/ (accessed on 10 February 2022).
- Cooke, K.L.; Driessche, P.V.D. Analysis of an SEIRS epidemic model with two delays. J. Math. Biol. 1996, 35, 240–260. [Google Scholar] [CrossRef]
- Oxley, T.J.; Mocco, J.; Majidi, S.; Kellner, C.P.; Shoirah, H.; Singh, I.P.; De Leacy, R.A.; Shigematsu, T.; Ladner, T.R.; Yaeger, K.A.; et al. Large-Vessel Stroke as a Presenting Feature of COVID-19 in the Young. N. Engl. J. Med. 2020, 382, e60. [Google Scholar] [CrossRef]
- Pulla, P. What counts as a COVID-19 death? BMJ 2020, 370, m2859. [Google Scholar] [CrossRef]
- Salje, H.; Tran Kiem, C.; Lefrancq, N.; Courtejoie, N.; Bosetti, P.; Paireau, J.; Andronico, A.; Hozé, N.; Richet, J.; Dubost, C.L.; et al. Estimating the burden of SARS-CoV-2 in France. Science 2020, 369, 208–211. [Google Scholar] [CrossRef]
- Xie, J.; Tong, Z.; Guan, X.; Du, B.; Qiu, H.; Slutsky, A.S. Critical care crisis and some recommendations during the COVID-19 epidemic in China. Intensiv. Care Med. 2020, 46, 837–840. [Google Scholar] [CrossRef]
- Phua, J.; Weng, L.; Ling, L.; Egi, M.; Lim, C.-M.; Divatia, J.V.; Shrestha, B.R.; Arabi, Y.M.; Ng, J.; Gomersall, C.D.; et al. Intensive care management of coronavirus disease 2019 (COVID-19): Challenges and recommendations. Lancet Respir. Med. 2020, 8, 506–517. [Google Scholar] [CrossRef]
- Richardson, S.; Hirsch, J.S.; Narasimhan, M.; Crawford, J.M.; McGinn, T.; Davidson, K.W.; the Northwell COVID-19 Research Consortium. Presenting Characteristics, Comorbidities, and Outcomes among 5700 Patients Hospitalized with COVID-19 in the New York City Area. JAMA 2020, 323, 2052–2059. [Google Scholar] [CrossRef]
- Nishiura, H.; Kobayashi, T.; Yang, Y.; Hayashi, K.; Miyama, T.; Kinoshita, R.; Linton, N.; Jung, S.-M.; Yuan, B.; Suzuki, A.; et al. The Rate of Underascertainment of Novel Coronavirus (2019-nCoV) Infection: Estimation Using Japanese Passengers Data on Evacuation Flights. J. Clin. Med. 2020, 9, 419. [Google Scholar] [CrossRef] [PubMed]
- Lauer, S.A.; Grantz, K.H.; Bi, Q.; Jones, F.K.; Zheng, Q.; Meredith, H.R.; Azman, A.S.; Reich, N.G.; Lessler, J. The incubation period of 2019-nCoV from publicly reported confirmed cases: Estimation and application. Ann. Intern. Med. 2020, 172, 577–582. [Google Scholar] [CrossRef] [PubMed]
- Verity, R.; Okell, L.C.; Dorigatti, I.; Winskill, P.; Whittaker, C.; Imai, N.; Cuomo-Dannenburg, G.; Thompson, H.; Walker, P.G.T.; Fu, H.; et al. Estimates of the severity of coronavirus disease 2019: A model-based analysis. Lancet Infect. Dis. 2020, 20, 669–677. [Google Scholar] [CrossRef]
- Centers for Disease Control and Prevention. Similarities and Differences between Flu and COVID-19. 2022. Available online: https://www.cdc.gov/flu/symptoms/flu-vs-covid19.htm (accessed on 5 June 2022).


Publisher’s Note: MDPI stays neutral with regard to jurisdictional claims in published maps and institutional affiliations. |
© 2022 by the authors. Licensee MDPI, Basel, Switzerland. This article is an open access article distributed under the terms and conditions of the Creative Commons Attribution (CC BY) license (https://creativecommons.org/licenses/by/4.0/).
Share and Cite
Dong, T.; Dong, W.; Xu, Q. Agent Simulation Model of COVID-19 Epidemic Agent-Based on GIS: A Case Study of Huangpu District, Shanghai. Int. J. Environ. Res. Public Health 2022, 19, 10242. https://doi.org/10.3390/ijerph191610242
Dong T, Dong W, Xu Q. Agent Simulation Model of COVID-19 Epidemic Agent-Based on GIS: A Case Study of Huangpu District, Shanghai. International Journal of Environmental Research and Public Health. 2022; 19(16):10242. https://doi.org/10.3390/ijerph191610242
Chicago/Turabian StyleDong, Tao, Wen Dong, and Quanli Xu. 2022. "Agent Simulation Model of COVID-19 Epidemic Agent-Based on GIS: A Case Study of Huangpu District, Shanghai" International Journal of Environmental Research and Public Health 19, no. 16: 10242. https://doi.org/10.3390/ijerph191610242