
The Impact of Mobility Restriction Strategies in the Control of the COVID-19 Pandemic: Modelling the Relation between COVID-19 Health and Community Mobility Data

 , ,
, ,
Abstract
:1. Introduction
2. Methodology
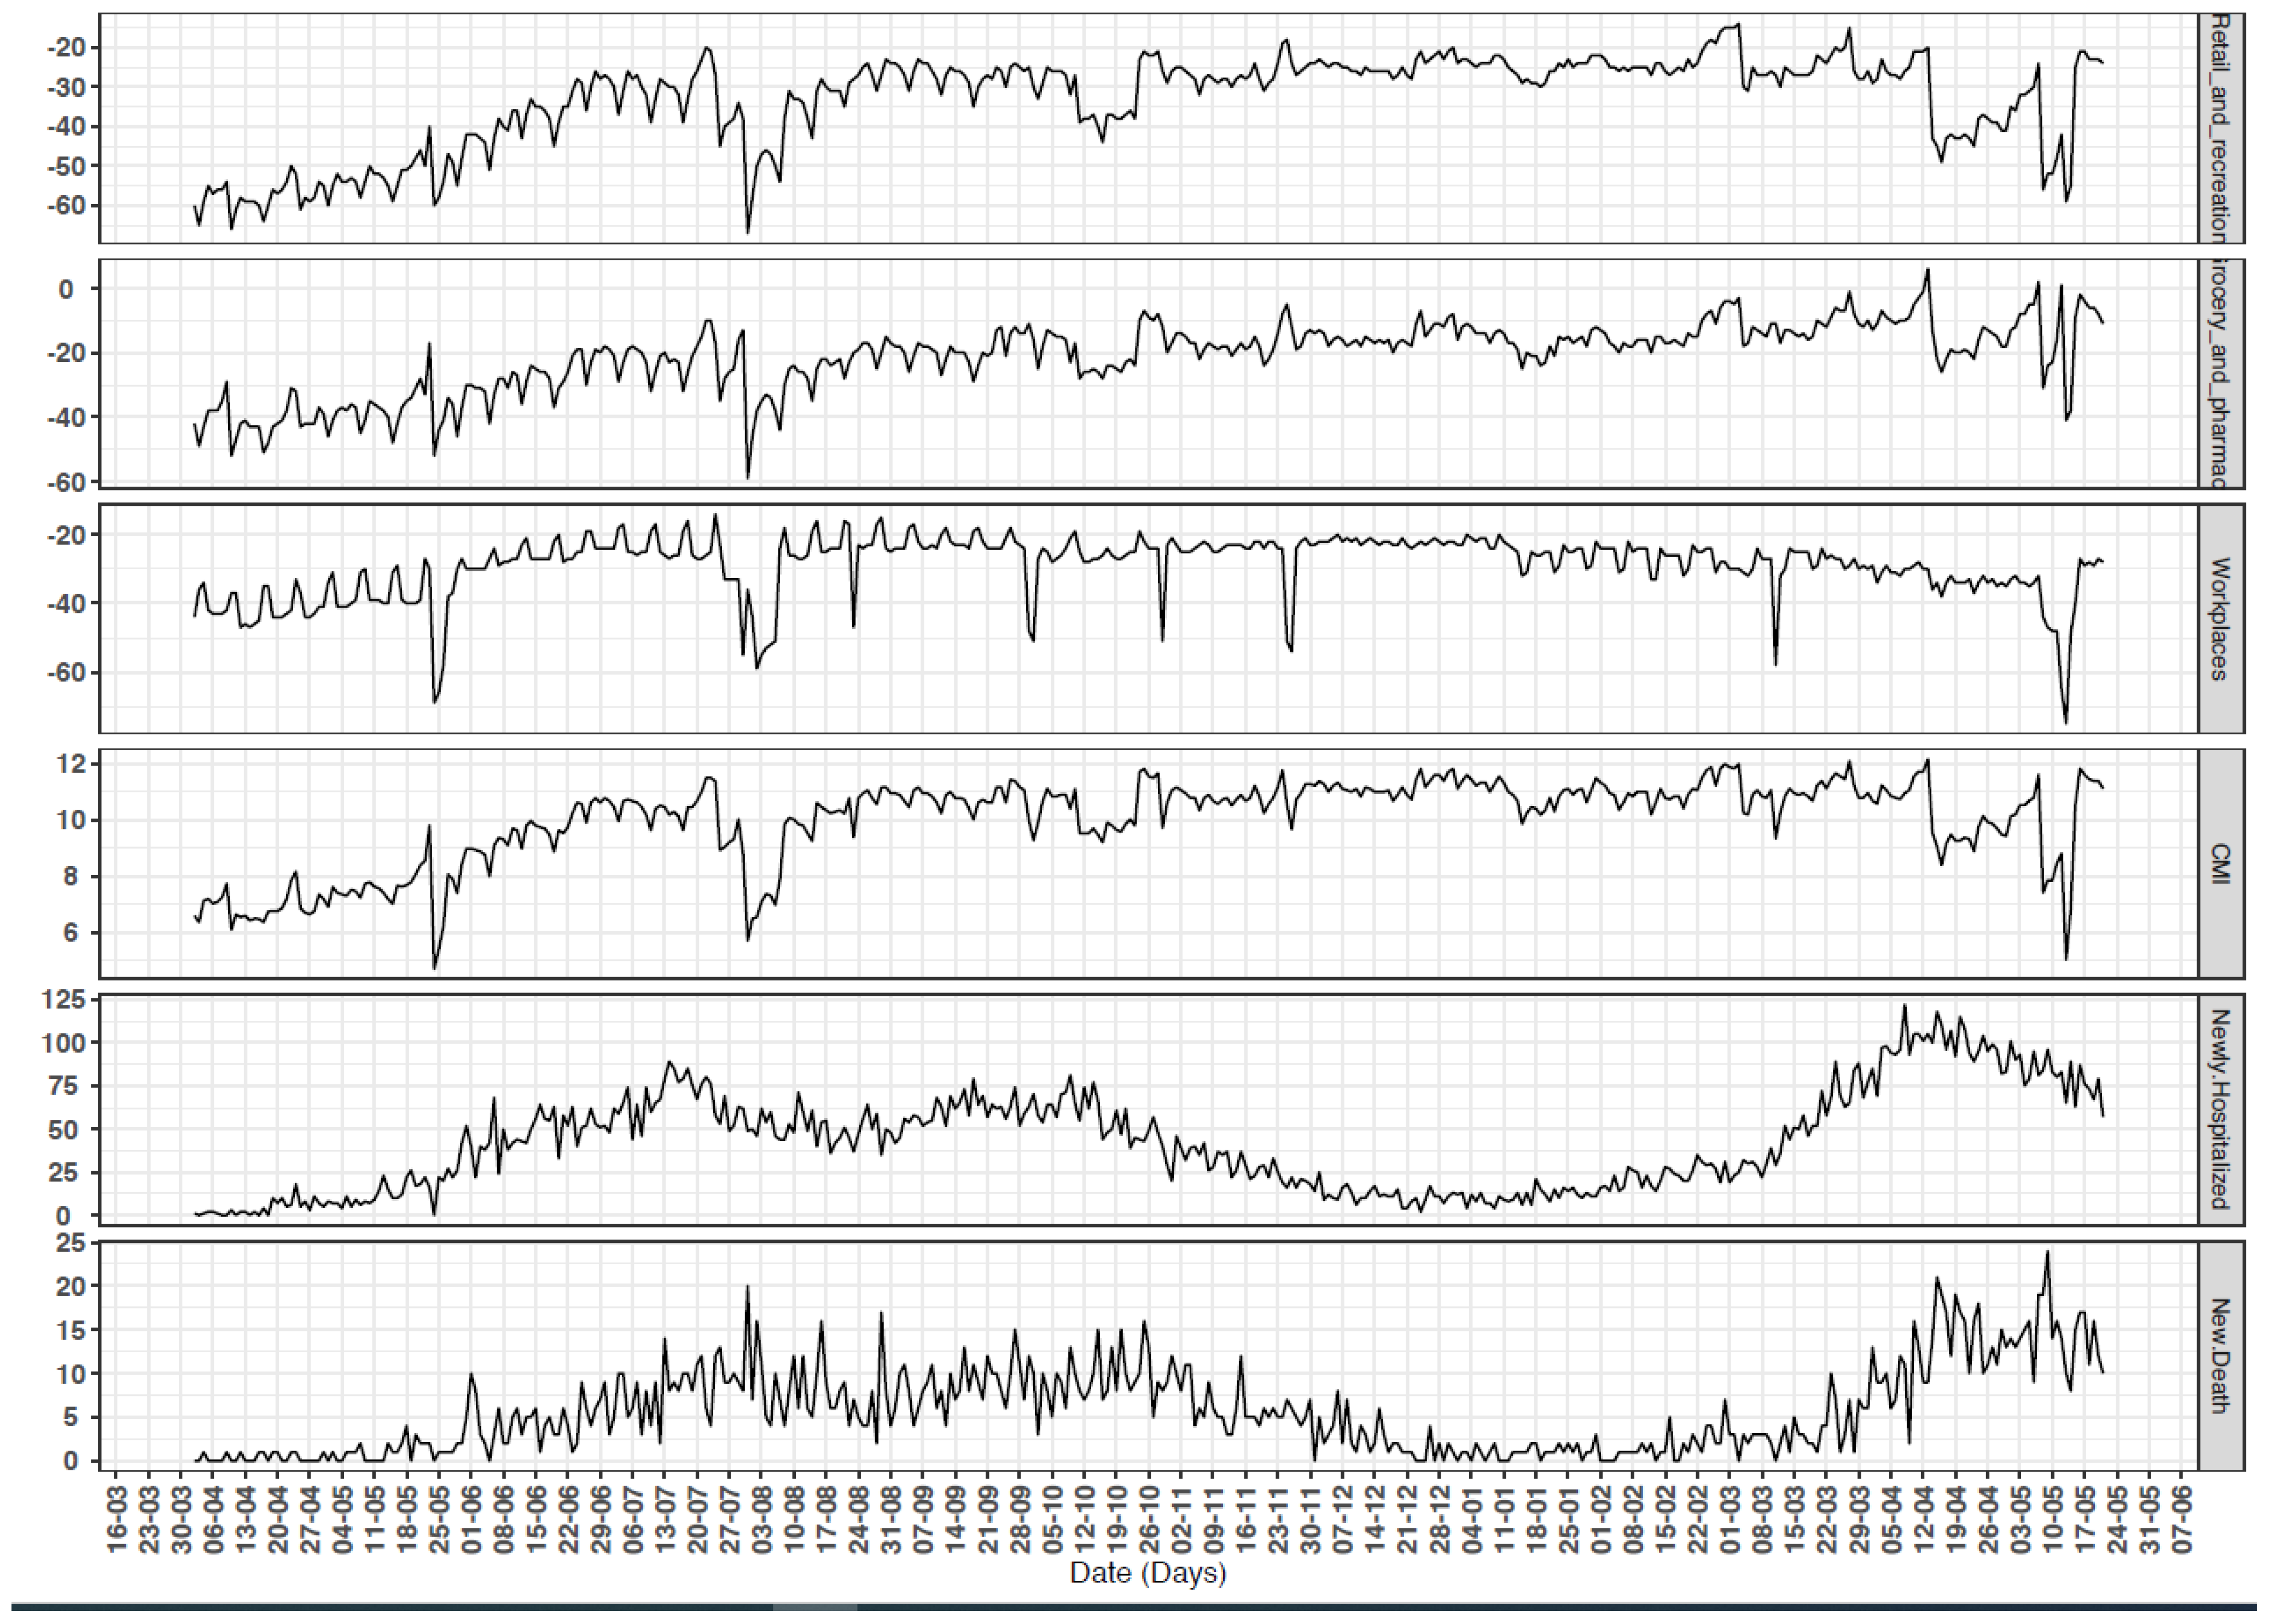
2.1. Health Data
2.2. CMR
2.3. Descriptive Statistics and Correlation
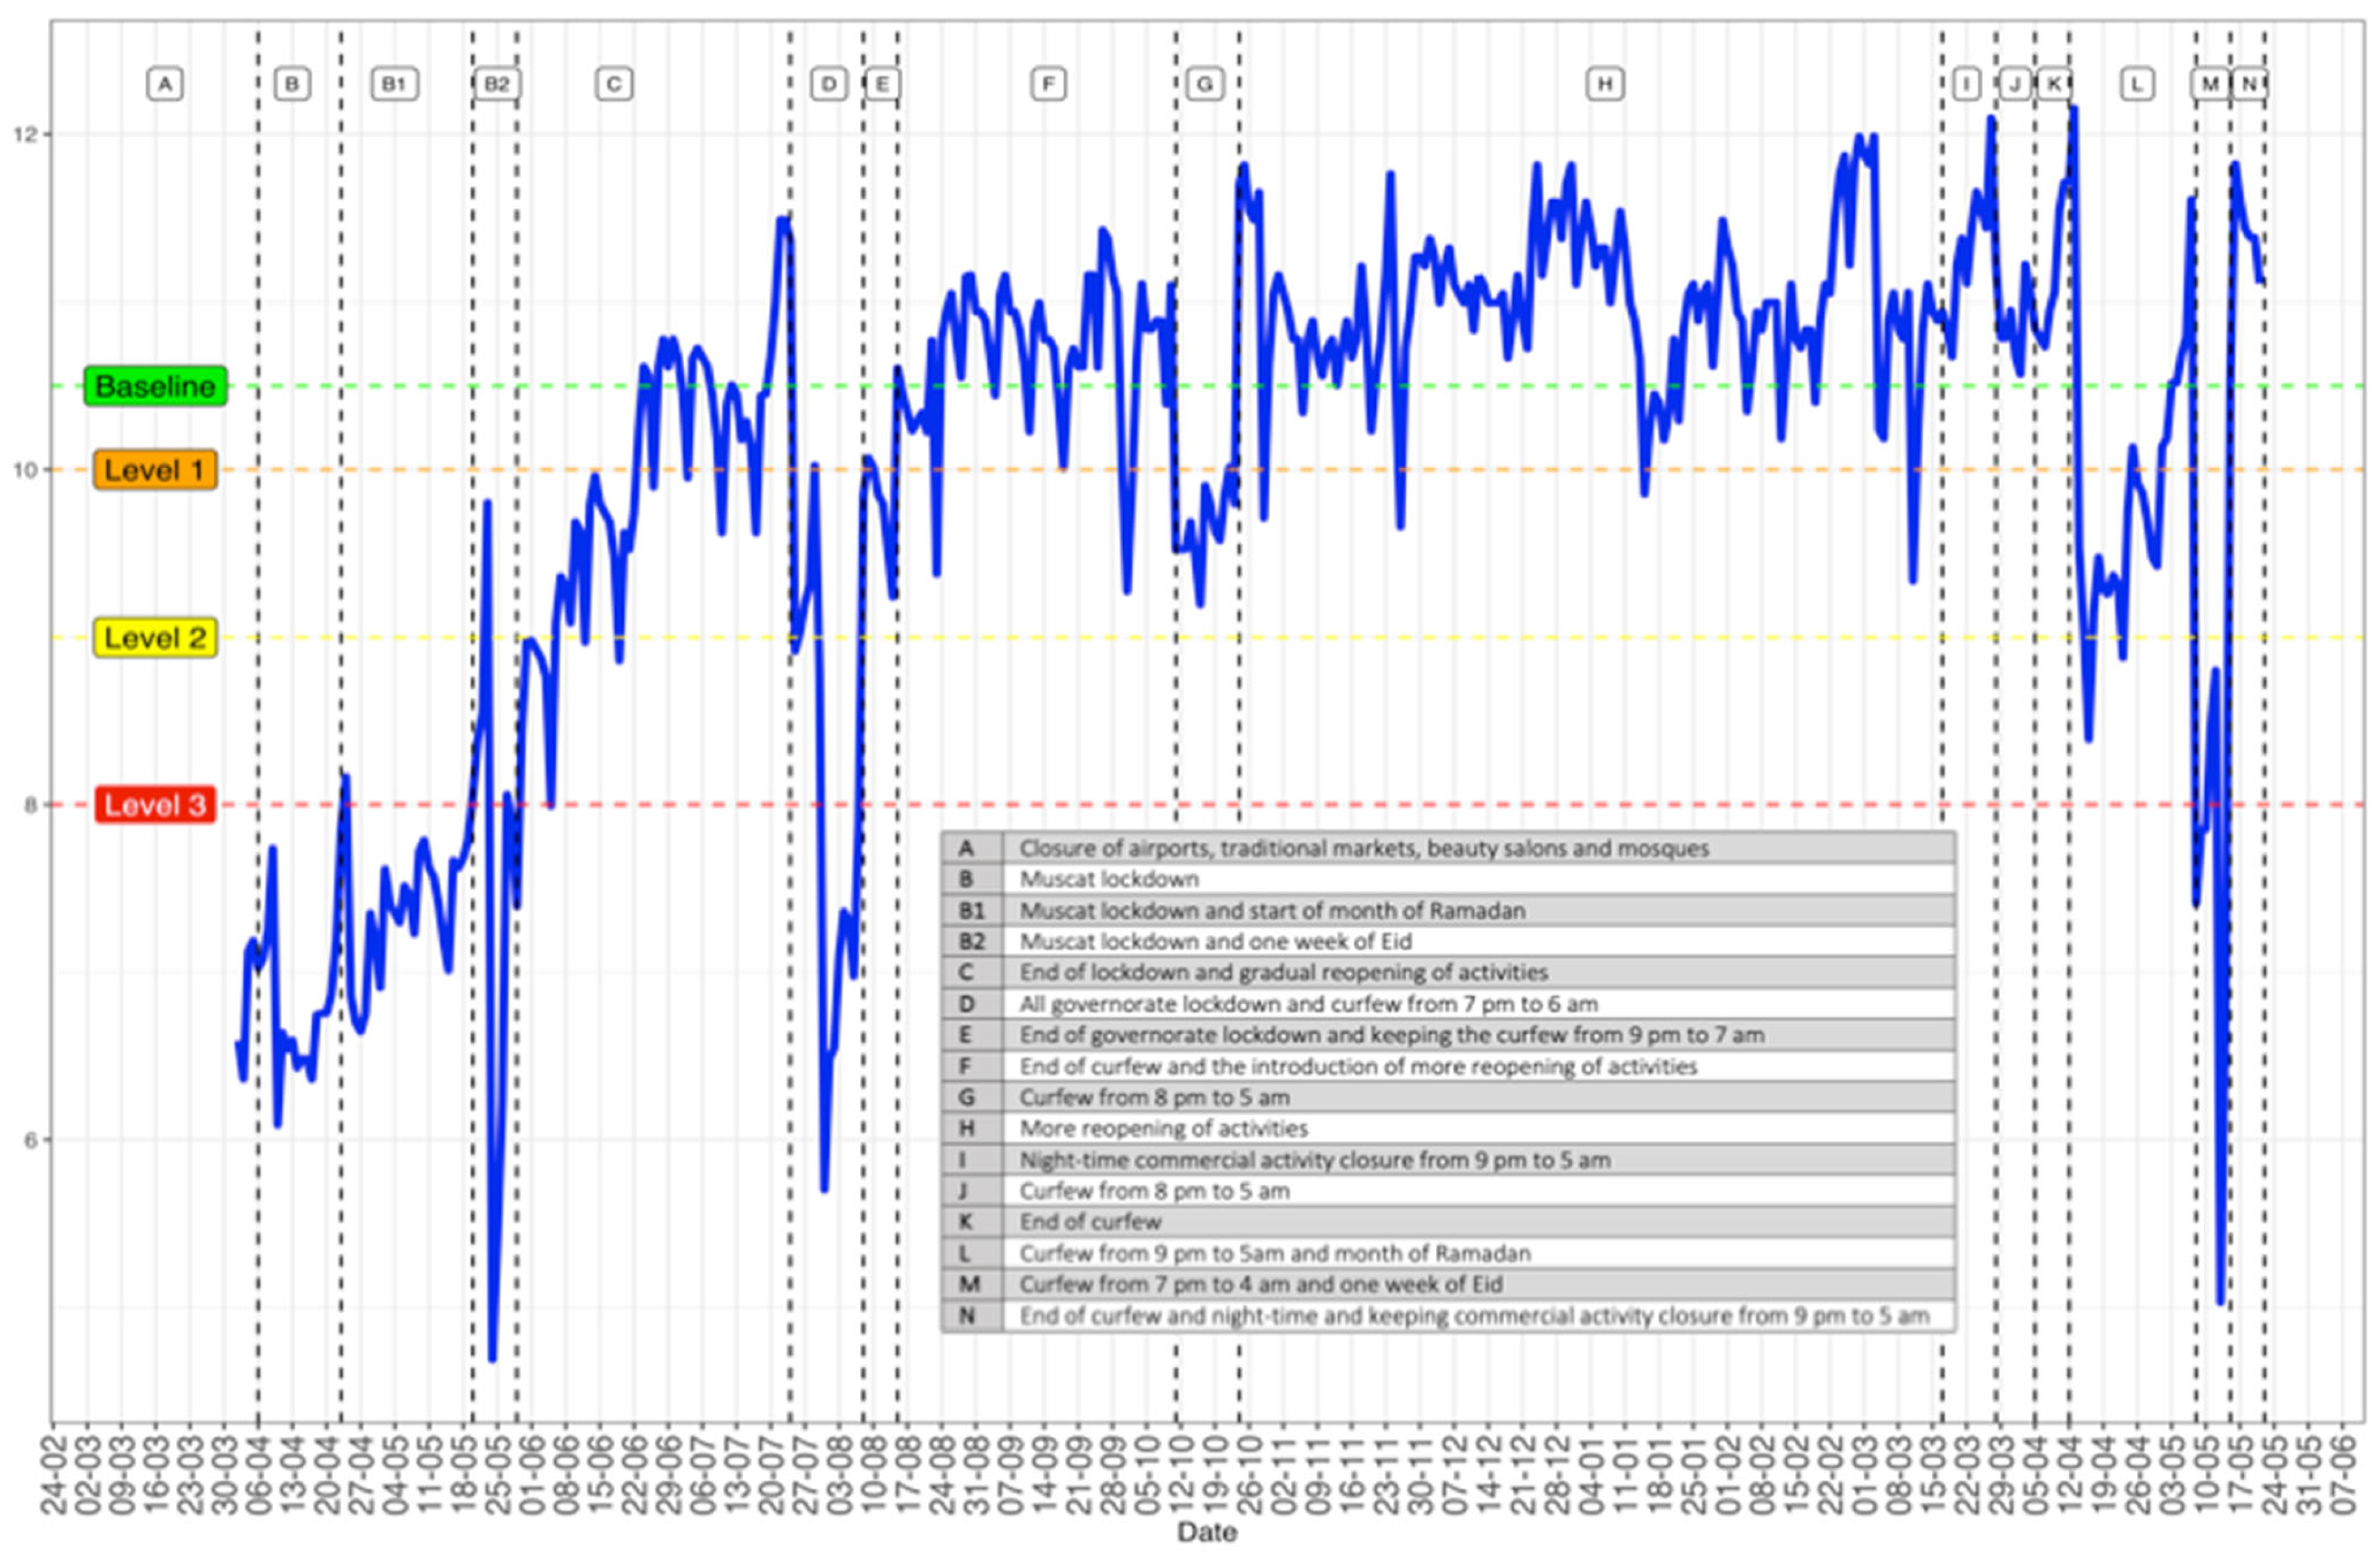
2.4. CMR and Oman’s Mobility Restriction NPIs
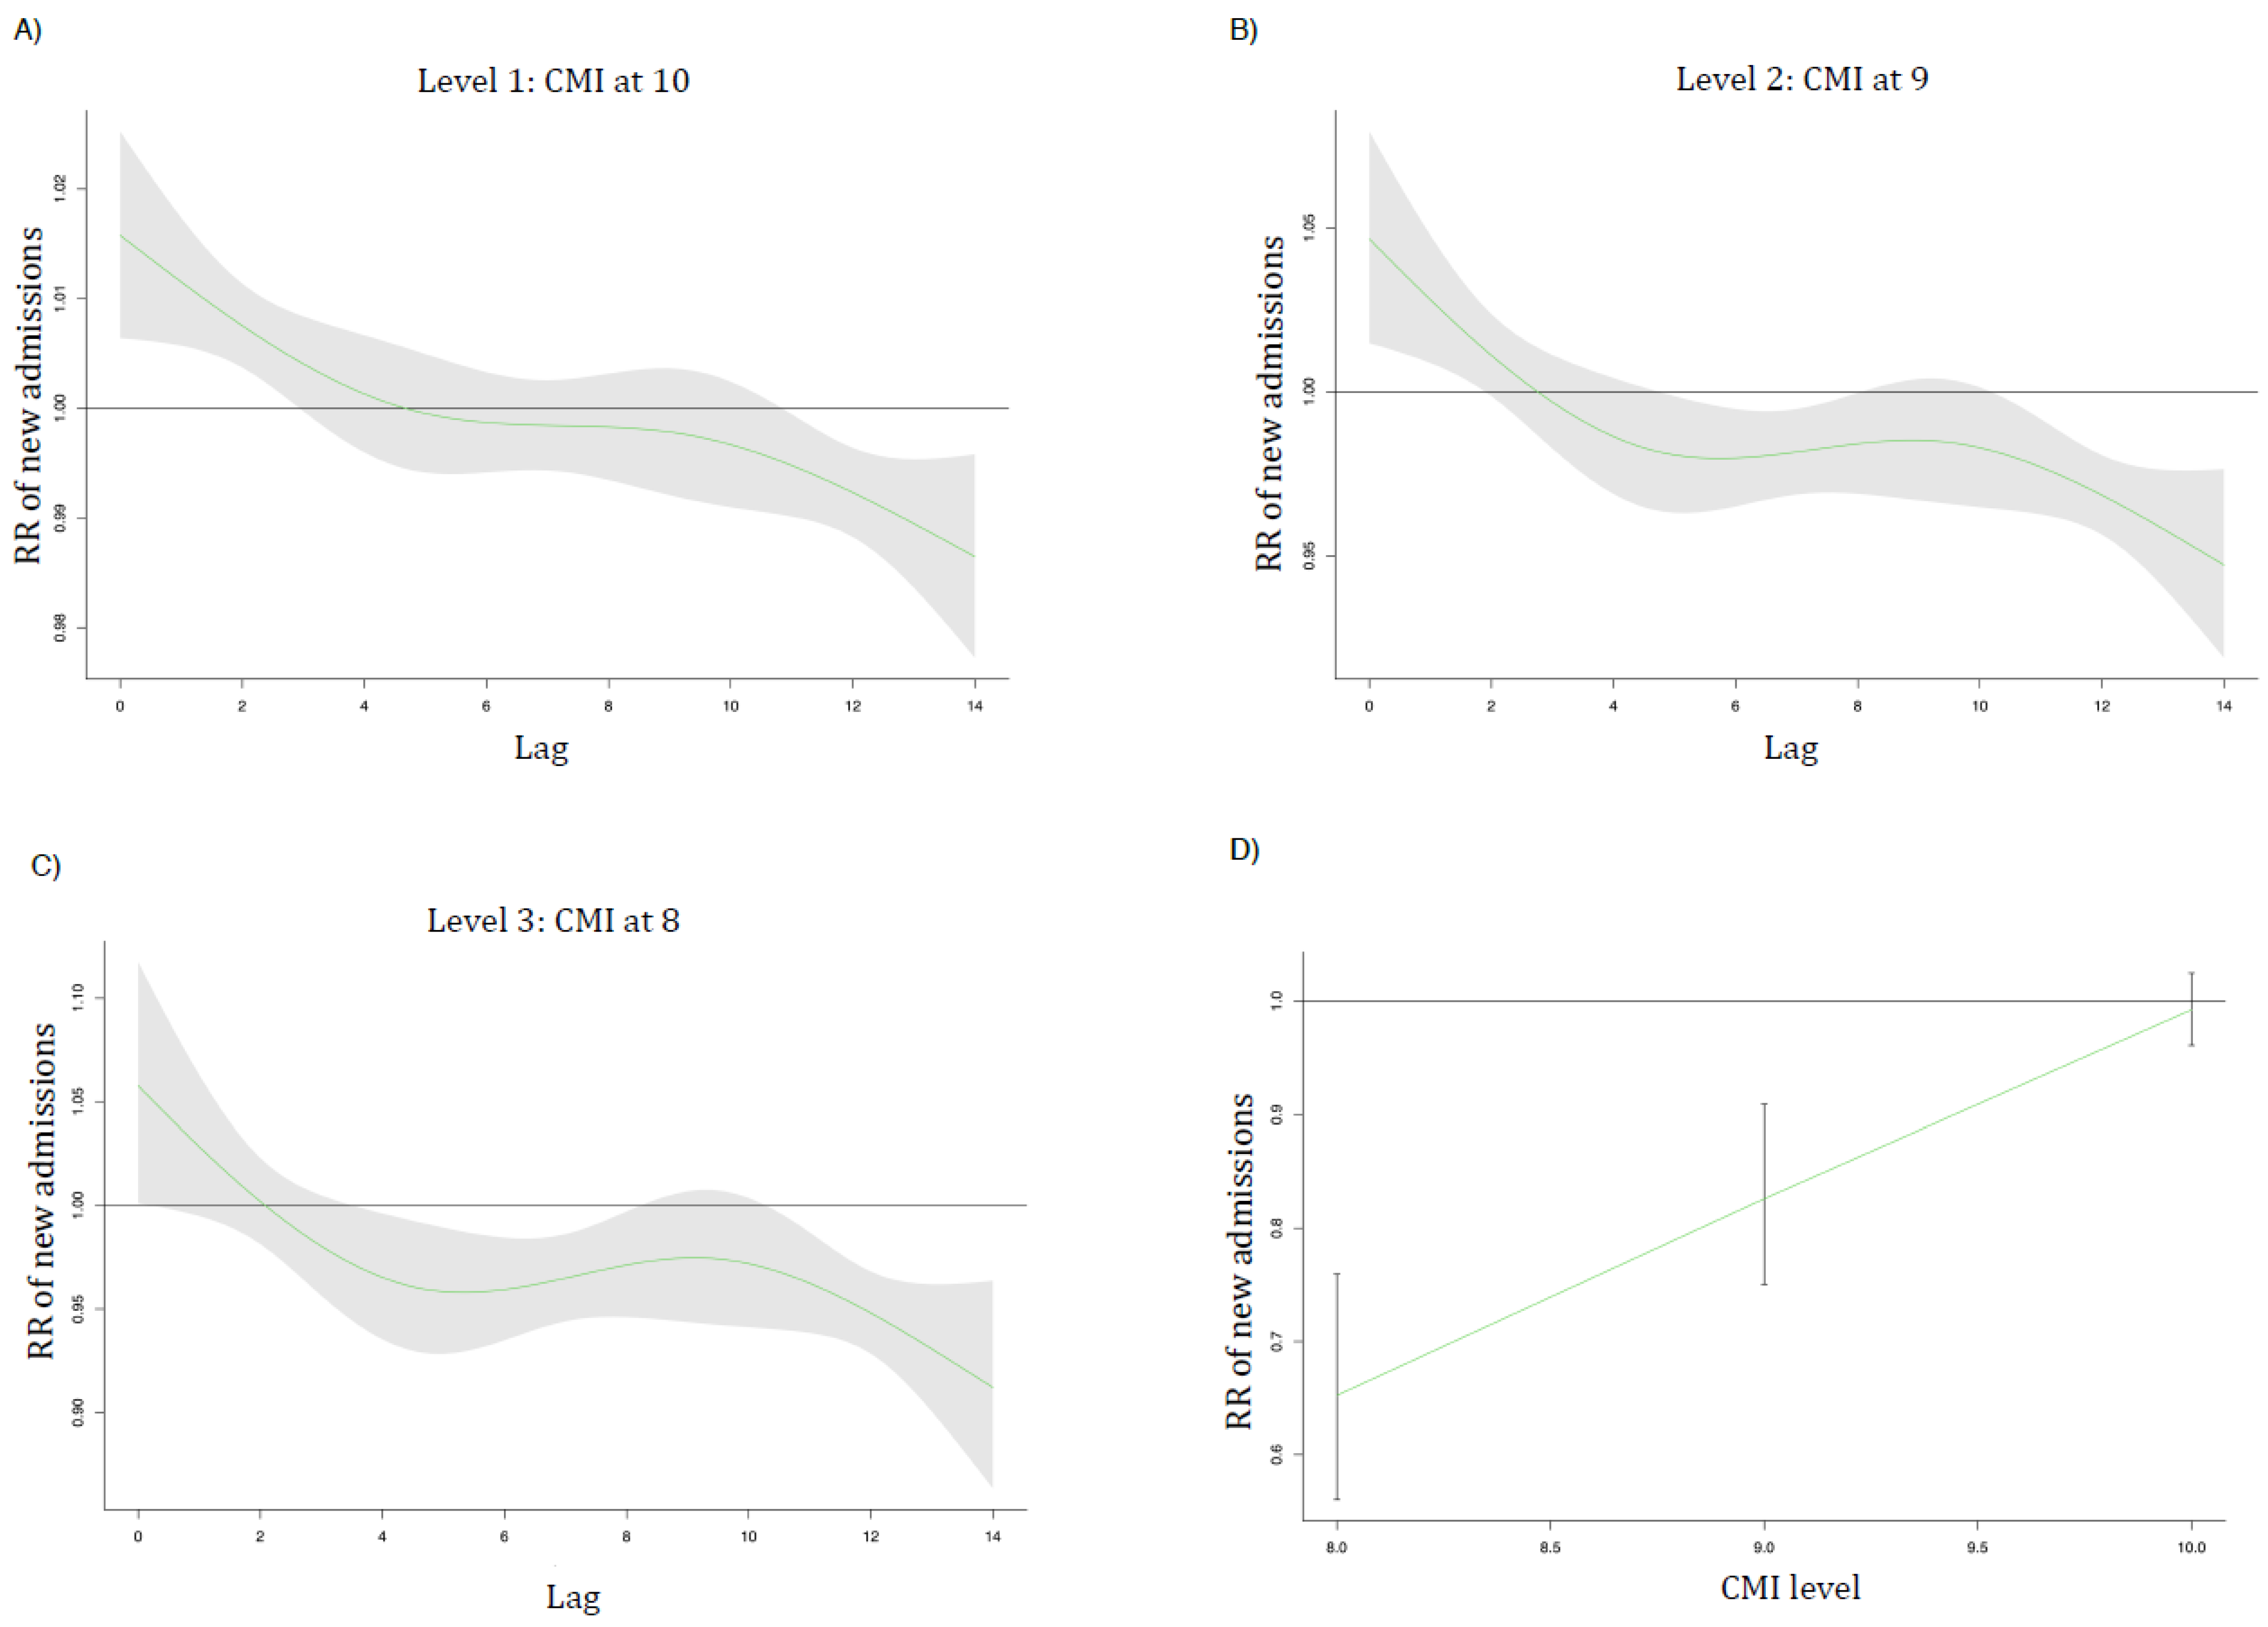
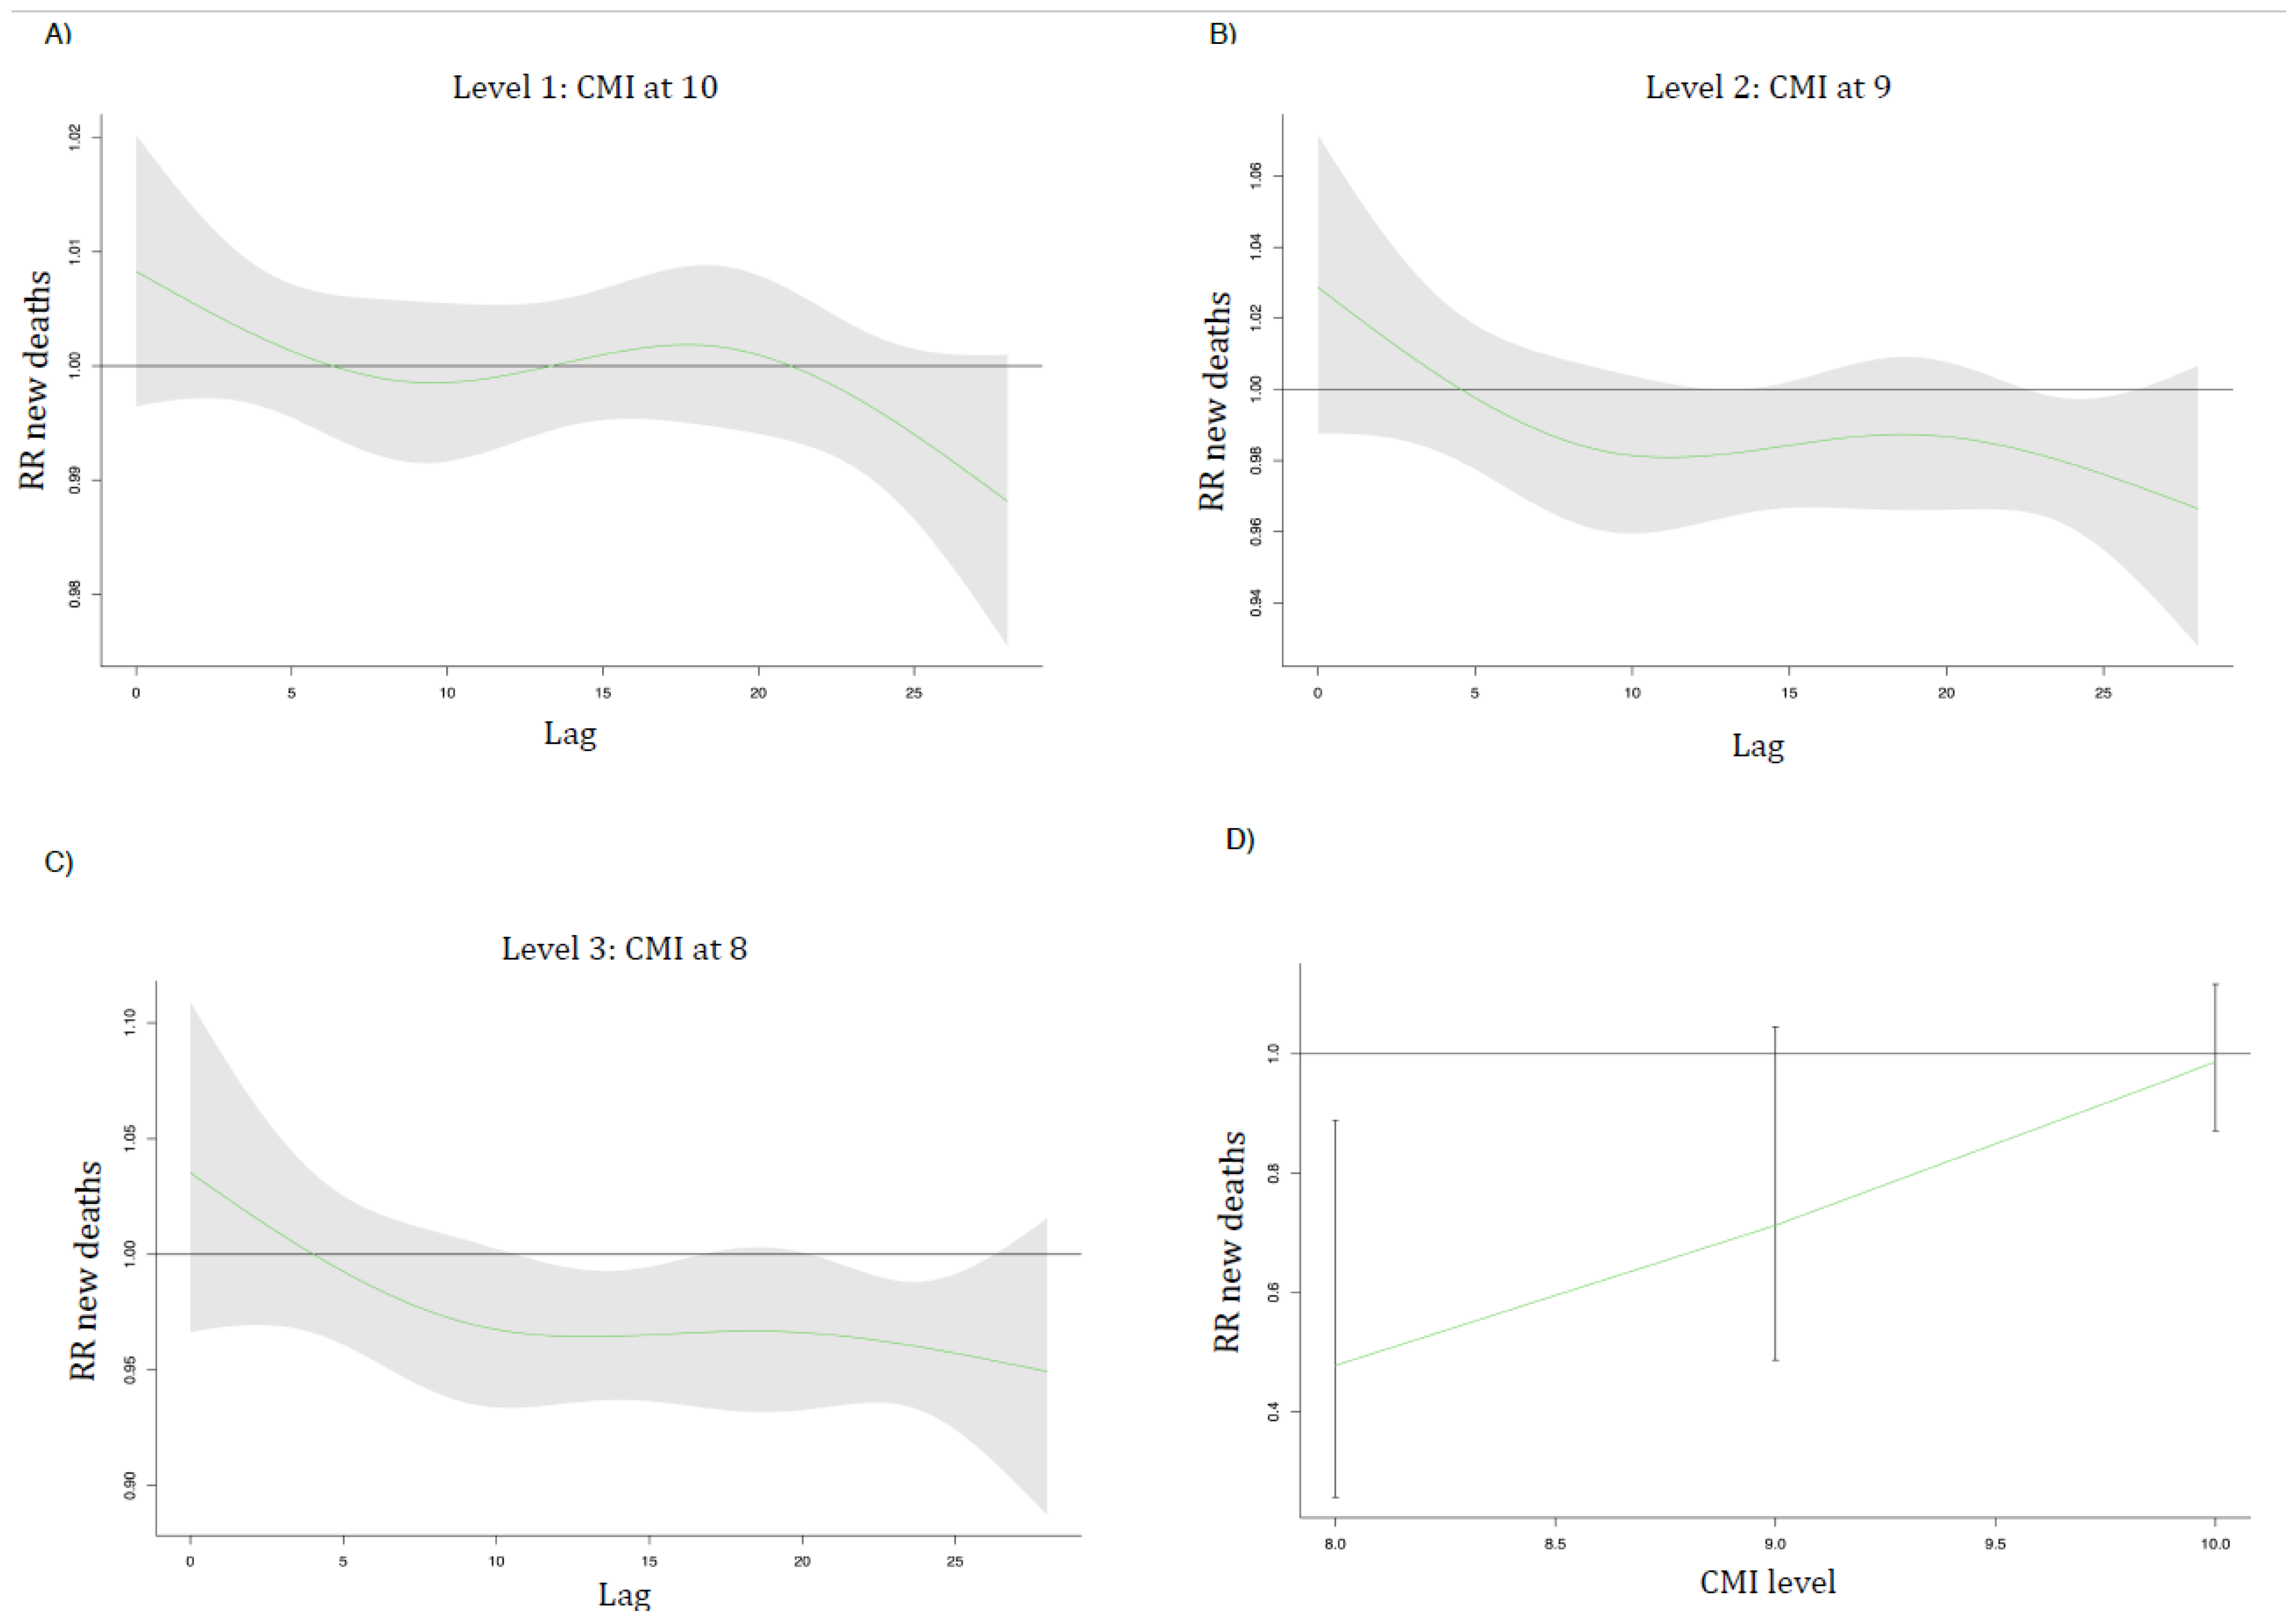
2.5. Modelling
2.6. Model Validation and Sensitivity Analysis
3. Results
4. Discussion
5. Conclusions
Supplementary Materials
Author Contributions
Funding
Institutional Review Board Statement
Informed Consent Statement
Data Availability Statement
Acknowledgments
Conflicts of Interest
References
- Meyerowitz, E.A.; Richterman, A.; Gandhi, R.T.; Sax, P.E. Transmission of SARS-CoV-2: A review of viral, host, and environmental factors. Ann. Intern. Med. 2021, 174, 69–79. [Google Scholar] [CrossRef] [PubMed]
- Tang, B.; Xia, F.; Tang, S.; Bragazzi, N.L.; Li, Q.; Sun, X.; Liang, J.; Xiao, Y.; Wu, J. The Effectiveness of quarantine and isolation determine the trend of the COVID-19 epidemics in the final phase of the current outbreak in China. Int. J. Infect. Dis 2020, 95, 288–293. [Google Scholar] [CrossRef] [PubMed]
- Soltesz, K.; Gustafsson, F.; Timpka, T.; Jaldén, J.; Jidling, C.; Heimerson, A.; Schön, T.B.; Spreco, A.; Ekberg, J.; Dahlström, Ö.; et al. The Effect of Interventions on COVID-19. Nature 2020, 588, E26–E28. [Google Scholar] [CrossRef] [PubMed]
- Al Wahaibi, A.; Al Manji, A.; Al Maani, A.; Al Rawahi, B.; Al Harthy, K.; Alyaquobi, F.; Al-Jardani, A.; Petersen, E.; Al Abri, S. COVID-19 epidemic monitoring after non-pharmaceutical interventions: The use of time-varying reproduction number in a country with a large migrant population. Int. J. Infect. Dis 2020, 99, 466–472. [Google Scholar] [CrossRef]
- Liu, Y.; Morgenstern, C.; Kelly, J.; Lowe, R.; Jit, M. The impact of non-pharmaceutical interventions on SARS-CoV-2 transmission across 130 Countries and Territories. BMC Med. 2021, 19, 40. [Google Scholar] [CrossRef]
- Lai, S.; Ruktanonchai, N.W.; Zhou, L.; Prosper, O.; Luo, W.; Floyd, J.R.; Wesolowski, A.; Santillana, M.; Zhang, C.; Du, X.; et al. Effect of non-pharmaceutical interventions for containing the COVID-19 Outbreak in China. Nature 2020, 585, 410–413. [Google Scholar] [CrossRef]
- Perra, N. Non-Pharmaceutical Interventions during the COVID-19 Pandemic: A Review. Phys. Rep. 2021, 913, 1–52. [Google Scholar] [CrossRef]
- Sulyok, M.; Walker, M.D. Mobility and COVID-19 mortality across Scandinavia: A modeling study. Travel Med. Infect. Dis. 2021, 41, 102039. [Google Scholar] [CrossRef]
- COVID-19 Community Mobility Reports. Available online: https://www.google.com/covid19/mobility/?hl=en (accessed on 8 May 2021).
- Aktay, A.; Bavadekar, S.; Cossoul, G.; Davis, J.; Desfontaines, D.; Fabrikant, A.; Gabrilovich, E.; Gadepalli, K.; Gipson, B.; Guevara, M.; et al. Google COVID-19 Community Mobility Reports: Anonymization Process Description (Version 1.0). arXiv 2020, arXiv:2004.04145. [Google Scholar]
- Oman News Agency. COVID-19 Supreme Committee Issues New Decisions. Available online: https://omannews.gov.om/NewsDescription/ArtMID/392/ArticleID/31628/Covid-19-Supreme-Committee-Issues-New-Decisions (accessed on 16 June 2021).
- Gasparrini, A. Distributed lag linear and non-linear models in r: The package dlnm. J. Stat. Softw. 2011, 43, 1–20. [Google Scholar] [CrossRef] [Green Version]
- Wood, S.N. Generalized Additive Models: An Introduction with R, 2nd ed.; Chapman and Hall/CRC: London, UK, 2017. [Google Scholar]
- R Core Team. R: A Language and Environment for Statistical Computing; R Foundation for Statistical Computing: Vienna, Austria, 2020. [Google Scholar]
- Di Domenico, L.; Sabbatini, C.E.; Pullano, G.; Lévy-Bruhl, D.; Colizza, V. Impact of January 2021 curfew measures on SARS-CoV-2 B. 1.1. 7 circulation in France. Eurosurveillance 2021, 26, 2100272. [Google Scholar] [CrossRef]
- Jiang, J.; Luo, L. Influence of population mobility on the novel coronavirus disease (COVID-19) epidemic: Based on panel data from Hubei, China. Glob. Health Res. Policy 2020, 5, 1–10. [Google Scholar]
- Hadjidemetriou, G.M.; Sasidharan, M.; Kouyialis, G.; Parlikad, A.K. The impact of government measures and human mobility trend on COVID-19 related deaths in the UK. Transp. Res. Interdiscip. Perspect. 2020, 6, 100167. [Google Scholar] [CrossRef]
- Huber, M.; Langen, H. Timing Matters: The impact of response measures on COVID-19-related hospitalization and death rates in Germany and Switzerland. Swiss J. Econ. Stat. 2020, 156, 1–19. [Google Scholar] [CrossRef]
- Haug, N.; Geyrhofer, L.; Londei, A.; Dervic, E.; Desvars-Larrive, A.; Loreto, V.; Pinior, B.; Thurner, S.; Klimek, P. Ranking the effectiveness of worldwide COVID-19 government interventions. Nat. Hum. Behav. 2020, 4, 1303–1312. [Google Scholar] [CrossRef]
- Zhang, X.; Owen, G.; Green, M.; Buchan, I.; Barr, B. Evaluating the impacts of tiered restrictions introduced in England, during October and December 2020 on COVID-19 cases: A synthetic control study. medRxiv 2021. [Google Scholar] [CrossRef]
- Charoenwong, B.; Kwan, A.; Pursiainen, V. Social connections with COVID-19–affected areas increase compliance with mobility restrictions. Sci. Adv. 2020, 6, eabc3054. [Google Scholar] [CrossRef]
- Alfano, V.; Ercolano, S. The Efficacy of Lockdown Against COVID-19: A Cross-Country Panel Analysis. Appl. Health Econ. Health Policy 2020, 18, 509–517. [Google Scholar] [CrossRef] [PubMed]
- Roux, J.; Massonnaud, C.; Crépey, P. COVID-19: One-Month Impact of the French Lockdown on the Epidemic Burden. medRxiv 2020. [Google Scholar] [CrossRef]
- Gozzi, N.; Tizzani, M.; Starnini, M.; Ciulla, F.; Paolotti, D.; Panisson, A.; Perra, N. Collective response to media coverage of the COVID-19 pandemic on Reddit and Wikipedia: Mixed-methods analysis. J. Med. Internet Res. 2020, 22, e21597. [Google Scholar] [CrossRef] [PubMed]
- Kartal, M.T.; Depren, Ö.; Depren, S.K. The relationship between mobility and COVID-19 pandemic: Daily evidence from an emerging country by causality analysis. Transp. Interdiscip. Perspect. 2021, 10, 100366. [Google Scholar]
- Weill, J.A.; Stigler, M.; Deschenes, O.; Springborn, M.R. Social distancing responses to COVID-19 emergency declarations strongly differentiated by income. Proc. Natl. Acad. Sci. USA 2020, 117, 19658–19660. [Google Scholar] [CrossRef]
- Badr, H.S.; Du, H.; Marshall, M.; Dong, E.; Squire, M.M.; Gardner, L.M. Association between mobility patterns and COVID-19 transmission in the USA: A mathematical modelling study. Lancet Infect. Dis. 2020, 20, 1247–1254. [Google Scholar] [CrossRef]
- Lee, M.; Zhao, J.; Sun, Q.; Pan, Y.; Zhou, W.; Xiong, C.; Zhang, L. Human mobility trends during the early stage of the COVID-19 pandemic in the United States. PLoS ONE 2020, 15, e0241468. [Google Scholar] [CrossRef]
- Bonaccorsi, G.; Pierri, F.; Cinelli, M.; Flori, A.; Galeazzi, A.; Porcelli, F.; Schmidt, A.L.; Valensise, C.M.; Scala, A.; Quattrociocchi, W.; et al. Economic and social consequences of human mobility restrictions under COVID-19. Proc. Natl. Acad. Sci. USA 2020, 117, 15530–15535. [Google Scholar] [CrossRef] [PubMed]
- Oman News Agency. COVID-19 Immunization Team Holds First Meeting. Available online: https://omannews.gov.om/NewsDescription/ArtMID/392/ArticleID/31839/Covid-19-Immunization-Team-Holds-First-Meeting (accessed on 16 June 2021).
- Adams-Prassl, A.; Boneva, T.; Golin, M.; Rauh, C. The Impact of the Coronavirus Lockdown on Mental Health: Evidence from the US; University of Oxford: Oxford, UK, 2020. [Google Scholar] [CrossRef]
- Baig, A.S.; Butt, H.A.; Haroon, O.; Rizvi, S.A.R. Deaths, Panic, Lockdowns and US equity markets: The case of COVID-19 pandemic. Financ. Res. Lett. 2021, 38, 101701. [Google Scholar] [CrossRef]


| Mean | Median | Min | Max | |
|---|---|---|---|---|
| Retail and Recreation | −33.2 | −28.0 | −67.0 | −14.0 |
| Grocery and Pharmacy | −21.1 | −18.0 | −59.0 | 6.0 |
| Workplaces | −29.0 | −26.0 | −75.0 | −14.0 |
| CMI | 10.0 | 10.5 | 4.7 | 12.2 |
| Newly Hospitalised | 42.3 | 42.0 | 0.0 | 122.0 |
| New Death | 5.7 | 5.0 | 0.0 | 24.0 |
Publisher’s Note: MDPI stays neutral with regard to jurisdictional claims in published maps and institutional affiliations. |
© 2021 by the authors. Licensee MDPI, Basel, Switzerland. This article is an open access article distributed under the terms and conditions of the Creative Commons Attribution (CC BY) license (https://creativecommons.org/licenses/by/4.0/).
Share and Cite
Al Wahaibi, A.; Al Maani, A.; Alyaquobi, F.; Al Manji, A.; Al Harthy, K.; Al Rawahi, B.; Alqayoudhi, A.; Al Khalili, S.; Al-Jardani, A.; Al-Abri, S. The Impact of Mobility Restriction Strategies in the Control of the COVID-19 Pandemic: Modelling the Relation between COVID-19 Health and Community Mobility Data. Int. J. Environ. Res. Public Health 2021, 18, 10560. https://doi.org/10.3390/ijerph181910560
Al Wahaibi A, Al Maani A, Alyaquobi F, Al Manji A, Al Harthy K, Al Rawahi B, Alqayoudhi A, Al Khalili S, Al-Jardani A, Al-Abri S. The Impact of Mobility Restriction Strategies in the Control of the COVID-19 Pandemic: Modelling the Relation between COVID-19 Health and Community Mobility Data. International Journal of Environmental Research and Public Health. 2021; 18(19):10560. https://doi.org/10.3390/ijerph181910560
Chicago/Turabian StyleAl Wahaibi, Adil, Amal Al Maani, Fatma Alyaquobi, Abdullah Al Manji, Khalid Al Harthy, Bader Al Rawahi, Abdullah Alqayoudhi, Sulien Al Khalili, Amina Al-Jardani, and Seif Al-Abri. 2021. "The Impact of Mobility Restriction Strategies in the Control of the COVID-19 Pandemic: Modelling the Relation between COVID-19 Health and Community Mobility Data" International Journal of Environmental Research and Public Health 18, no. 19: 10560. https://doi.org/10.3390/ijerph181910560