GDF15 and ACE2 stratify COVID-19 patients according to severity while ACE2 mutations increase infection susceptibility
 Margalida Torrens-Mas1†
  Catalina M. Perelló-Reus2†
  Neus Trias-Ferrer1 Lesly Ibargüen-González2
  Catalina Crespí3 Aina Maria Galmes-Panades1,4 Cayetano Navas-Enamorado1 Andres Sanchez-Polo1 Javier Piérola-Lopetegui5 Luis Masmiquel6 Lorenzo Socias Crespi7
  Carles Barcelo2*‡
  Marta Gonzalez-Freire1*‡
- 1Translational Research in Aging and Longevity Group (TRIAL group), Health Research Institute of the Balearic Islands (IdISBa), Palma de Mallorca, Spain
- 2Translational Pancreatic Cancer Oncogenesis Group, Health Research Institute of the Balearic Islands (IdISBa), Palma de Mallorca, Spain
- 3Cell Culture and Flow Cytometry Facility, Health Research Institute of the Balearic Islands (IdISBa), Palma de Mallorca, Spain
- 4Physical Activity and Sport Sciences Research Group (GICAFE), Institute for Educational Research and Innovation (IRIE), University of the Balearic Islands, Palma de Mallorca, Spain
- 5Microscopy Facility, Health Research Institute of the Balearic Islands (IdISBa), Palma de Mallorca, Spain
- 6Vascular and Metabolic Pathologies Group, Health Research Institute of the Balearic Islands (IdISBa), Palma de Mallorca, Spain
- 7Intensive Care Unit, Health Research Institute of the Balearic Islands (IdISBa), Son Llatzer University Hospital, Palma de Mallorca, Spain
Coronavirus disease 19 (COVID-19) is a persistent global pandemic with a very heterogeneous disease presentation ranging from a mild disease to dismal prognosis. Early detection of sensitivity and severity of COVID-19 is essential for the development of new treatments. In the present study, we measured the levels of circulating growth differentiation factor 15 (GDF15) and angiotensin-converting enzyme 2 (ACE2) in plasma of severity-stratified COVID-19 patients and uninfected control patients and characterized the in vitro effects and cohort frequency of ACE2 SNPs. Our results show that while circulating GDF15 and ACE2 stratify COVID-19 patients according to disease severity, ACE2 missense SNPs constitute a risk factor linked to infection susceptibility.
Introduction
In December 2019, several cases of pneumonia emerged in Wuhan, China, which were caused by a novel coronavirus initially named 2019-nCoV (Zhu et al., 2020). Due to its phylogenetic proximity to SARS-CoV, this new coronavirus was renamed as ‘SARS-CoV-2’ by the International Committee on Taxonomy of Viruses (Coronaviridae Study Group of the International Committee on Taxonomy of Viruses, 2020). This virus rapidly spread around the world due to its high transmissibility and the presence of asymptomatic subjects, which led to the declaration of a global pandemic by the World Health Organization. COVID-19 shows a very heterogeneous disease presentation, and clinical symptoms may differ with age and sex. Disease severity has been associated with older age, male sex, and comorbidities such as hypertension, diabetes, obesity, cardiovascular disease, chronic obstructive pulmonary disease, and lung, liver, and kidney disease (Huang C et al., 2020; Chen et al., 2020; Sanyaolu et al., 2020). Severe or fatal cases of COVID-19 usually present with increased levels of pro-inflammatory cytokines and chemokines, known as cytokine storm (de la Rica et al., 2020), low albumin levels (de la Rica et al., 2020), as well as decreased lymphocyte counts and platelets, elevated levels of C-Reactive Protein (CRP), procalcitonin, D-dimer, lactate dehydrogenase, and ferritin, among others (Guan et al., 2020; Zhou et al., 2020; Malik et al., 2021). Similarly, recent studies report that GDF15 levels, a member of the transforming growth factor-β (TGF-β) superfamily, are increased in COVID-19 patients who require hospitalization, and its levels are associated with viremia, hypoxemia, and worse clinical outcome (Notz et al., 2020; Myhre et al., 2020; Luis García de Guadiana et al., 2021). It is known that GDF15 levels are upregulated by inflammation, cancer, cardiovascular and metabolic diseases (Adela and Banerjee, 2015; Wischhusen et al., 2020). Also, circulating GDF15 levels show a high correlation with age and are primarily expressed under conditions of inflammation and oxidative stress (Doerstling et al., 2018). On the other hand, a predisposing genetic background may contribute to the wide clinical variability of COVID-19. To date, genetic markers of susceptibility to COVID-19 have not yet been identified.
The most well-known and evaluated mechanism of SARS-CoV-2 infection is the binding and uptake of viral particle through the ACE2 receptor, a type 1 integral membrane glycoprotein. The spike protein of the SARS-CoV-2 virus mediates its entry into the host cell through its interaction with ACE2. Transmembrane protease serine 2 (TMPRSS2) also participates in the cleavage of the spike protein, facilitating the entry. Both ACE2 and TMPRSS2 are highly expressed in different tissues and cell types, including the type II alveolar epithelial cells (Sungnak et al., 2020; Li et al., 2020). It has been observed that ACE2 expression in this type of cells increases with age, which could contribute to the severity of COVID-19 symptoms among elderly patients (Pinto et al., 2020; Inde et al., 2021). For instance, plasma levels of ACE2 have been found elevated in kidney disease and cardiovascular disease (Narula et al., 2020). Recent studies show that ACE2 plasma levels are increased in COVID-19 patients compared to healthy subjects (Lundström et al., 2021; van Lier et al., 2021).
The emergence of SARS-CoV-2 variants-of-concern from last semester of 2021, accounted for vast majority of reported worldwide COVID-19 positivity. Such variants represent a public health challenge during the COVID-19 pandemic due to their ability to increase viral transmission and disease severity. Several mechanisms might account for increased variant transmissibility, especially mutations involved in enhanced spike protein binding affinity for the ACE2 receptor (Ramanathan et al., 2021). Therefore, coding variants within ACE2 could have the potential to alter SARSCoV-2 binding and possible infection responses in different individuals based on host genetics (Novelli et al., 2020; Benetti et al., 2020; Yildirim et al., 2021; Vadgama et al., 2022).
Based in all the above, the aims of this study were: i) to analyze whether GDF15 and ACE2 levels correlate with a worse COVID-19 prognosis as well as with other inflammatory and cellular markers of damage and senescence, and ii) to determine if different SNPs variants within ACE2 were associated to disease severity.
For this, circulating levels of both proteins, as well as RNA and DNA, were analyzed from plasma and buffy coats samples obtained from COVID-19 patients and in a uninfected control group matched by age and sex.
Methods
Patient population
This study included blood samples from 72 subjects: 47 COVID-19 samples were obtained from the Biobank Unit located in the Hospital Universitario Son Espases (HUSE), in Palma de Mallorca and 25 uninfected patients (control group), matched by age and sex, obtained from the Blood and Tissue Bank of the Balearic Islands. COVID-19 patients were classified based on disease severity into two groups: those requiring intensive care unit (ICU) admission for more than 24 h and died (n=21), and those requiring only low care intensity hospitalization and recovered (n=26) (non-ICU). The SARS-CoV-2 infection was confirmed by a positive result of a real time RT-PCR from nasal or pharyngeal swabs. Blood and buffy coat samples were obtained from the patients and stored at -80°C at the Biobank Unit. Clinical data of the individuals included in this study include age, sex, smoking habit, comorbidities, and inflammatory and coagulation markers (PCR, ferritin, and D dimer). Not all the subjects had complete clinical data available.
Determination of ACE2 and GDF15 circulating levels
Circulating levels of ACE2 from plasma samples were quantified using the Human ACE2 SimpleStep ELISA® Kit (#ab235649, Abcam) following the manufacturer’s instructions. Briefly, plasma samples were diluted 1:2 with the Sample Diluent NS and plated with the Antibody cocktail. Plates were incubated overnight at 4°C with gentle rocking. The following day, plates were washed, the TMB Development Solution was incubated for 10 min and the Stop Solution was added. An endpoint reading was performed at 450 nm in the Biotek Synergy H1 microplate reader. All samples were assayed in duplicate.
GDF15 circulating levels were measured using the Human GDF15 Quantikine® ELISA Kit (#DGD150, R&D Systems). Plasma samples were diluted 1:4 with the Calibrator Diluent and plated and incubated overnight at 4°C with gentle rocking. The next day, after washing the plates, Human GDF15 Conjugate was incubated by shaking for 1 h at room temperature. Then, the Substrate Solution was incubated for 30 min at room temperature in the dark and the Stop Solution was added. An endpoint reading was performed at 450 nm with a wavelength correction set at 540 nm in the Biotek Synergy H1 microplate reader. All samples were assayed in duplicate.
RNA and DNA isolation
RNA and DNA from plasma samples and buffy coats were extracted using TRI Reagent® BD (#T3809, Sigma-Aldrich) following the manufacturer’s protocol. RNA and DNA quantity and quality were evaluated using a Nanodrop 1000 spectrophotometer (Thermo Scientific) set at 260 and 280 nm. Samples were stored at -80°C until further use.
RT-qPCR
For each sample, 200 ng of the total RNA isolated from plasma, or 1 µg of the total RNA extracted from the buffy coats were reversed transcribed to cDNA at 37°C for 50 min. The reaction mixture contained 250 mM Tris-HCl (pH 8.3), 375 mM KCl, 15 mM MgCl2, 2.5 µM random hexamers, 500 µM of each dNTP, 20 U RNase inhibitor, 10 mM DTT, and 200 U M-Mlv reverse transcriptase. Each cDNA was diluted 1/10 with free RNAse water and frozen at -20°C until further use. PCR reactions were performed on a LightCycler® 480 System. Genes, primers, and annealing temperatures are specified in Supplementary Table 1. Reaction mix contained 7.5 µL SYBR TB Green® Premix Ex Taq™ (RR420A, Takara) with 0.5 µM forward and reverse primers and 2.5 µL of each cDNA sample. The amplification program consisted of a denaturation step at 95°C for 5 min, followed by 45 cycles with a denaturation step (10 s, 95°C), an annealing step (10 s, temperature depending on primers), and an elongation step (12 s, 72°C). A negative control was run in each assay. The relative expression levels of each gene were calculated using the ΔΔCt method and normalized to GAPDH expression.
Circulating mtDNA levels determination
Circulating levels of mtDNA were quantified using 5 ng of the isolated DNA from plasma samples. A mitochondrial gene (cytochrome C oxidase subunit III, COX3) and a nuclear gene (GAPDH) were amplified in a qPCR reaction. The reaction program for COX3 amplification consisted of a denaturation step of 95°C for 3 min, and 45 cycles of 95°C for 10 s and 55°C for 30 s. The levels of mtDNA were estimated using the ΔΔCt method and normalized to 18S expression. All primers are specified in Supplementary Table 1.
Analysis of mtDNA oxidation
Oxidation of mtDNA was performed as described previously in (Cordani et al., 2018) using the DNA extracted from buffy coats. Briefly, 5 ng of total DNA were used to amplify two different regions of mtDNA which are sensitive to oxidative damage. Oxidation of the G nucleotide diminishes the efficiency of the PCR reaction. Oxidation levels were estimated with the Ct ratio of these two regions and normalized by mtDNA levels determined as reported before. All primers are specified in Supplementary Table 2.
Telomere length
Telomere length was analyzed as described by Joglekar et al (Joglekar et al., 2020) using the DNA isolated from buffy coats. Briefly, two PCR reaction were performed using 25 ng of total DNA, amplifying a telomere region and a single-copy gene (human beta globin, HBG). All primers are specified in Supplementary Table 1.
Generation of SARS-CoV-2 pseudovirus
pcDNA3.1 plasmids encoding for Spike SARS-CoV-2 variants Alpha (B.1.1.7), Beta (B.1.351), Delta (B.1.617.2) and Epsilon (B.1.427/B.1.429) variants-of-concern (VOCs) were obtained from Dr. Thomas Peacock (Barclay lab, Imperial College London, UK). psPAX2 was a gift from Dr Didier Trono (Addgene plasmid # 12260); pLV-mCherry was a gift from Dr Pantelis Tsoulfas (Addgene plasmid # 36084); pcDNA3 mCherry was a gift from Dr Scott Gradia (Addgene plasmid # 30125); pcDNA3.1(+)eGFP was a gift from Dr Jeremy Wilusz (Addgene plasmid # 129020); pcDNA3.1-SARS2-Spike was a gift from Dr Fang Li (Addgene plasmid # 145032); pcDNA3.1-ACE2-GFP was a gift from Dr Utpal Pajvani (Addgene plasmid # 154962). pcDNA3.1-GFP-ACE2 expressing ACE2 SNPs were synthesized by GenScript. To generate SARS-Cov-2 pseudovirus, Human embryonic kidney 293 (HEK 293, ATCC® CRL-1573™) cells were seeded in a 10 cm2-plate at 4.5×10⁶ cells/plate, in DMEM (ThermoFisher Scientific, #11995073) supplemented with 10% FBS and 1x Normocin (In vivo gen, #ant-nr-1) and grown overnight at 37°C, 85% rel humidiy, 5% CO2. Next day, HEK 293 cells were then cotransfected with 15 μg of psPAX2 : pcDNA3.1SpikeVOCs : pLV-mCherry at ratio 1:1:1 (i.e. 5:5:5 μg) using Lipofectamin™ 3000 transfection reagent (Thermo-Fisher Scientific, #L3000015). Pseudoviruses harvested from the supernatant at 48 h 72h post-transfection were filtered (0.44 μm, Millipore Sigma, #SLHA033SS) concentrated with 50kDa-PES (ThermoFisher Scientific, #88540) at 20 min a 14,000g RT and stored at -80°C.
Pseudovirus entry assay
A549 cells (ATCC® CCL-185) seeded in 6-multiwell plates at 0.23 × 10⁶ cells/well in DMEM (10% FBS and 1x Normocin), and grown overnight at 37°C, 85% rel humidity 5% CO2. Next day, cells were transfected with either pcDNA3.1(+)eGFP (control) or pcDNA3.1-GFP-ACE2 expressing the ACE2 SNPs. To test the effect of ACE2 SNPs on pseudovirus entry, at 24h posttrasfetion cells were infected with 0.25 mL concentrated pseudoviruses + 0.25 mL DMEM (10% FBS and 1x Normocin) overnight at 37°C, 85% rel humidiy, 5% CO2. Next day, 1 ml of fresh DMEM was added (10% FBS and 1x Normocin). To measure the mCherry signal (a proxy for virus uptake), at 48h postinfection, medium was removed and cells were detached using TrypLE (ThermoFisher, #12605036) washed in DPBS (ThermoFisher, #14190250) and incubated for 5 min RT with 4′,6-diamidino-2-phenylindole (DAPI) at a final concentration of 0.1 µg/mL. Viable (DAPI negative) double positive eGFP/mCherry cells were measured using a BD FACSAria Fusion cell Sorter (BD Bioscience). 10,000 total events were recorded for every sample. Samples with less than 5,000 total events were discarded. Flow cytometer data was analyzed using BD Bioscience Flow cytometry analysis software. Briefly, cell population was defined using FSH/SCC gating and the percentage of positive cells was calculated using a manually defined cutoff based on log10 fluorescence intensity histograms of the corresponding channel on a non-infected population.
Microscope imaging
In order to assess overall protein localization of ACE2 variants, A549 cells grown at 40000 cells/well in 8-well cell culture chamber (Sarstedt, #94.6170.802) were transfected with 1,5 μL Lipofectamine 3000® (Thermo Scientific, #L3000015) following the manufacturer’s protocol. At 48h post transfection, cells were fixed with 4% paraformaldehyde in PBS for 10 minutes at room temperature (RT) and washed twice with PBS. Then, they were permeabilized with 0.1% Triton X-100- PBS for 15 min and incubated with 2% BSA in PBST (PBS+ 0.1% Tween 20) for 1 h at RT to block nonspecific binding. Chambers were incubated with either anti-ACE2 (1:100; MA5-32307; Thermo Scientific) or anti-ACE2 (1:50; MAB933; R&D Systems) in PBST containing 0,1% BSA ON at 4°C, washed twice in PBS and incubated with Alexa-Fluor647-labeled anti-rabbit (1:2000; ab150079; Abcam) or anti-mouse (1:2000; ab150115, Abcam) for 1h at RT. Images were acquired with Cell Observer-Zeiss.
Identification and selection of ACE2 polymorphisms
We queried multiple genomic databases including gnomAD (Karczewski et al., 2020), RotterdamStudy (Ikram et al., 2017), UK’s 100k Genomes Project (100KGP) (Consortium GER, 2019) as the main sources of aggregated data for ACE2 protein altering variations in populations groups across the world. These databases display summary statistics and aggregate variant data from the identified exome and genome data. Aggregation of data from disparate sources and platforms has been made possible by uniform joint variant calling using a standardized BWA-Picard-GATK pipeline (Van der Auwera et al., 2013). We only considered non-synonymous allele variants with high allelic frequency (>1.00.e-4) and allele count >20. Then we selected variants within the human ACE2-claw S-protein RBD-binding interface as described in previous studies that could potentially increase or decrease the binding affinity of ACE2 to the S-protein and thereby alter the ability of the virus to infect the host cell. Finally, we aimed to investigate which ACE2 variants were associated with clinical outcome to shortlist the candidates to study in detail. Two different studies identified 5 ACE2 variants as potentially predisposing genetic background to the observed interindividual clinical variability (Benetti et al., 2020; Vadgama et al., 2022). We finally shortlisted the 5 variants fulfilling this triple requirement of being abundant, involving critical residues in RBD interface and being potentially clinically relevant.
ACE2 polymorphism genotyping
cDNA obtained from circulating mRNA was analyzed to detect selected ACE2 SNPs. Three different PCR reactions were designed to cover the regions comprising the studied ACE2 SNPs. Primers were designed to obtain amplicons of 0.2-0.8 kb and specificity was confirmed by PrimerBLAST (Ye et al., 2012). PCRs were performed with GoTaq® G2 Flexi DNA Polymerase (Promega; M7805). PCR conditions were optimized by the Promega PCR design software (https://www.promega.es/resources/tools/biomath/tm-calculator/).
PCR1 amplified the region corresponding to residues Ser3 to Met249 (743 bp). Primers Forward 5`AAGCTCTTCCTGGCTCCTTC3’, Reverse 5`TCATCAACTTTGCCCTCACA3’. Cycling conditions were as follows: 95°C for 5 minutes, followed by 40 cycles (94°C for 30s, 67°C for 30s, 72°C for 1 min) with a final extension at 72°C during 10 min.
PCR2 amplified the region corresponding to residues Phe308 to Arg621 (944 bp). Primers Forward 5` ATTCAAGGAGGCCGAGAAGT3’, Reverse 5`TCCTCACTTTGATGCTTTGG3’. Cycling conditions were as follows: 95°C for 5 minutes, followed by 40 cycles (94°C for 30s, 63°C for 30s, 72°C for 1 min) with a final extension at 72°C during 10 min.
PCR3 amplified the region corresponding to residues Val670 to Val752 (250 bp). Primers Forward 5` TGTGCGAGTGGCTAATTTGA3’, Reverse 5` CACTCCCATCACAACTCCAA3’. Cycling conditions were as follows: 95°C for 5 minutes, followed by 40 cycles (94°C for 30s, 65°C for 30s, 72°C for 30s) with a final extension at 72°C during 10 min.
Agarose gel electrophoresis was performed in order to confirm specificity. PCR product was purified by clean-up (FAGCK001, Favorgen) and further sequenced by Macrogen. Alignment of sequencing reads against reference ACE2 (NM_021804) and SNP genotyping was attained by the SnapGene® Software (snapgene.com). Supplementary Figure 2
Statistical analysis
Descriptive characteristics were summarized as means and standard deviations (SDs) or as numbers and percentages (%). One-way analysis of variance (ANOVA), Chi-square tests (χ2), and Fisher’s exact test were used to assess differences across 3 groups of participants: ICU; non-ICU and controls, for continuous and categorical variables respectively. Non-normally distributed continuous data were compared using the Mann-Whitney-Wilcoxon test or the Kruskal-Wallis H-test. The relationships between variables were studied using Spearman or Pearson correlations Linear regression modeling was used to quantify the associations of ACE2 genotypes on GDF15 and ACE2. Analyses were adjusted for: age, sex, and group. Correlation coefficients were performed to determine correlations between GDF15 and changes on biochemical parameters among COVID-19 infected patients. To test potential associations between the studied parameters, a Principal Component Analysis (PCA) was computed. Statistical analyses were performed using R Studio version 3.5.2 of the R programming language (R Project for Statistical Computing; R Foundation, Vienna, Austria). and Stata v17.0 program. P-values <0.05 were deemed as statistically significant.
Study approval
This study was conducted in agreement with the Good Clinical Practice principles and the Declaration of Helsinki for ethical research. Ethical approval for this project (IB 4165/20 PI, 6 April 2020) was obtained from the ethics committee of the Balearic Islands and waived the requirement for informed consent, due to the emergency situation.
Results
Demographic and clinical characteristics.
Demographic data, comorbidities, and inflammation markers of the individuals included in this study are shown in Table 1. A total of 72 subjects were included in the study, 46% males, with an average age of 69 years (rank 28-88 years). SARS-CoV-2 infection was diagnosed by a real-time RT-PCR. There were no differences in age or sex among the three groups (p>0.05). All the ICU patients died. The most frequent comorbidities were hypertension (51%), type 2 diabetes mellitus (38%), smokers (38%), or others (59%). Inflammatory markers such as ferritin, CRP, and D-dimer were significantly higher in the ICU group that died, compared to the non-ICU and control group.
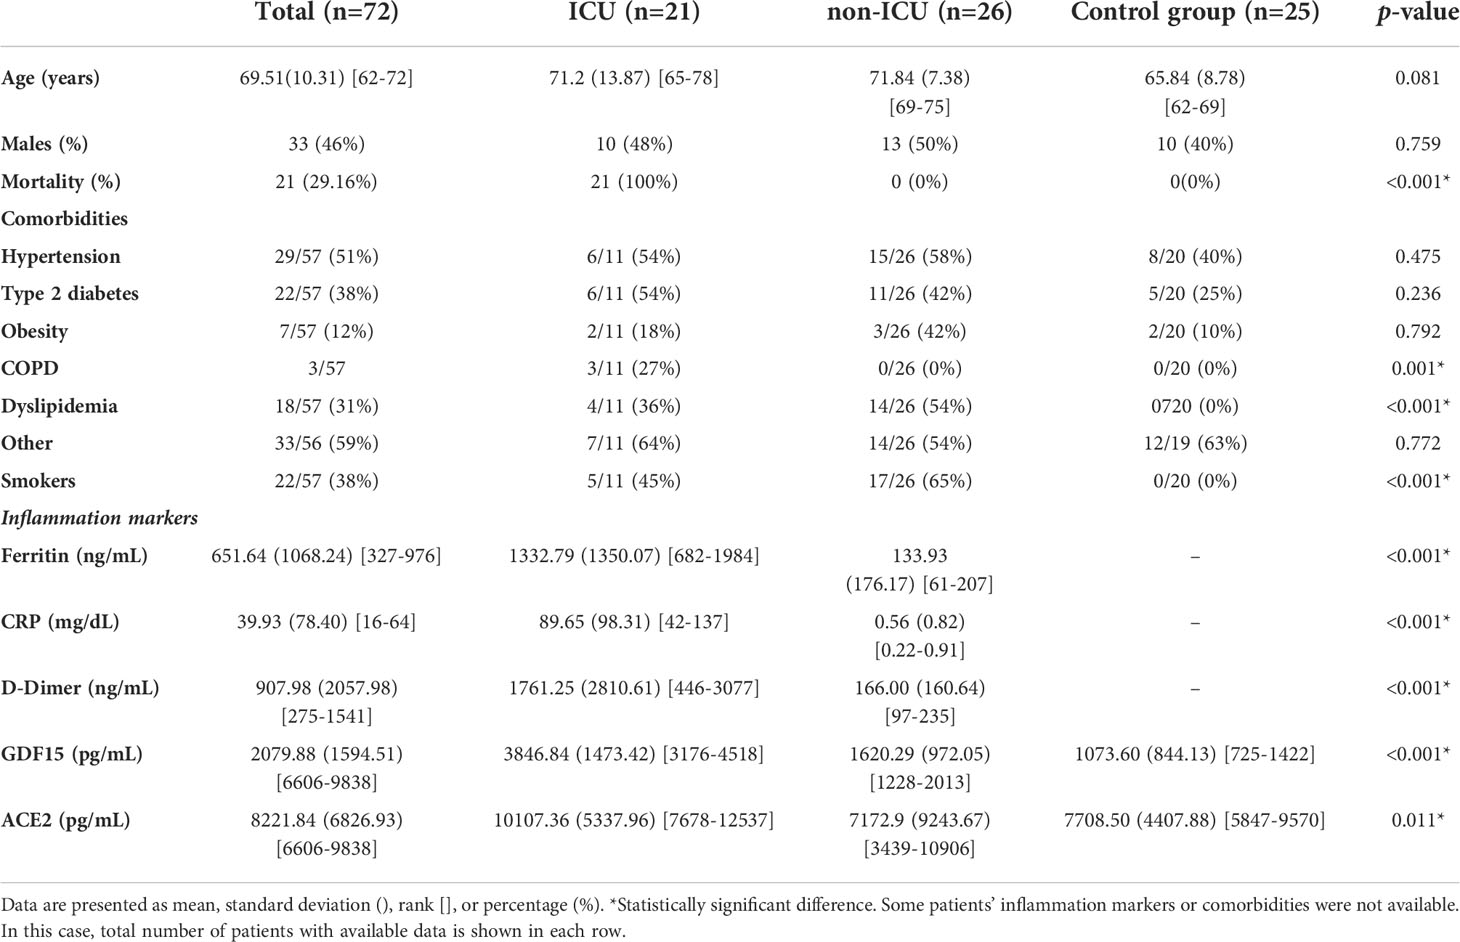
Table 1 Baseline characteristics of the sample population.
Circulating levels of GDF15 and ACE2
Plasma levels of both GDF15 and ACE2 were measured using ELISA (Figures 1A, B). ICU patients showed higher levels of GDF15 when compared to non-ICU patients and control group (3846.84 pg/mL vs 1620.29 pg/mL and 1073.6 pg/mL, respectively; P<0.001; Figure 1A). However, there was no difference between the non-ICU and the uninfected control group (P>0.05). ACE2 circulating levels (Figure 1B) were increased in the ICU group compared with the non-ICU and control groups (10107.36 pg/mL vs 7172.9 pg/mL and 7708.5 pg/mL, respectively). ICU patients showed significantly higher levels than the non-ICU patients (P=0.02). Interestingly, the ratio between the levels of GDF15 and the levels of ACE2 (Figure 1C) was also significantly higher in the ICU patients compared to the non-ICU and control groups (P=0.010 and P<0.001, respectively). This ratio was also increased in non-ICU patients compared to the control group (P=0.006). Finally, we found a positive correlation, although not statistically significant, between the levels of GDF15 and ACE2 (Figure 2), (r=0.204, P=0.087).
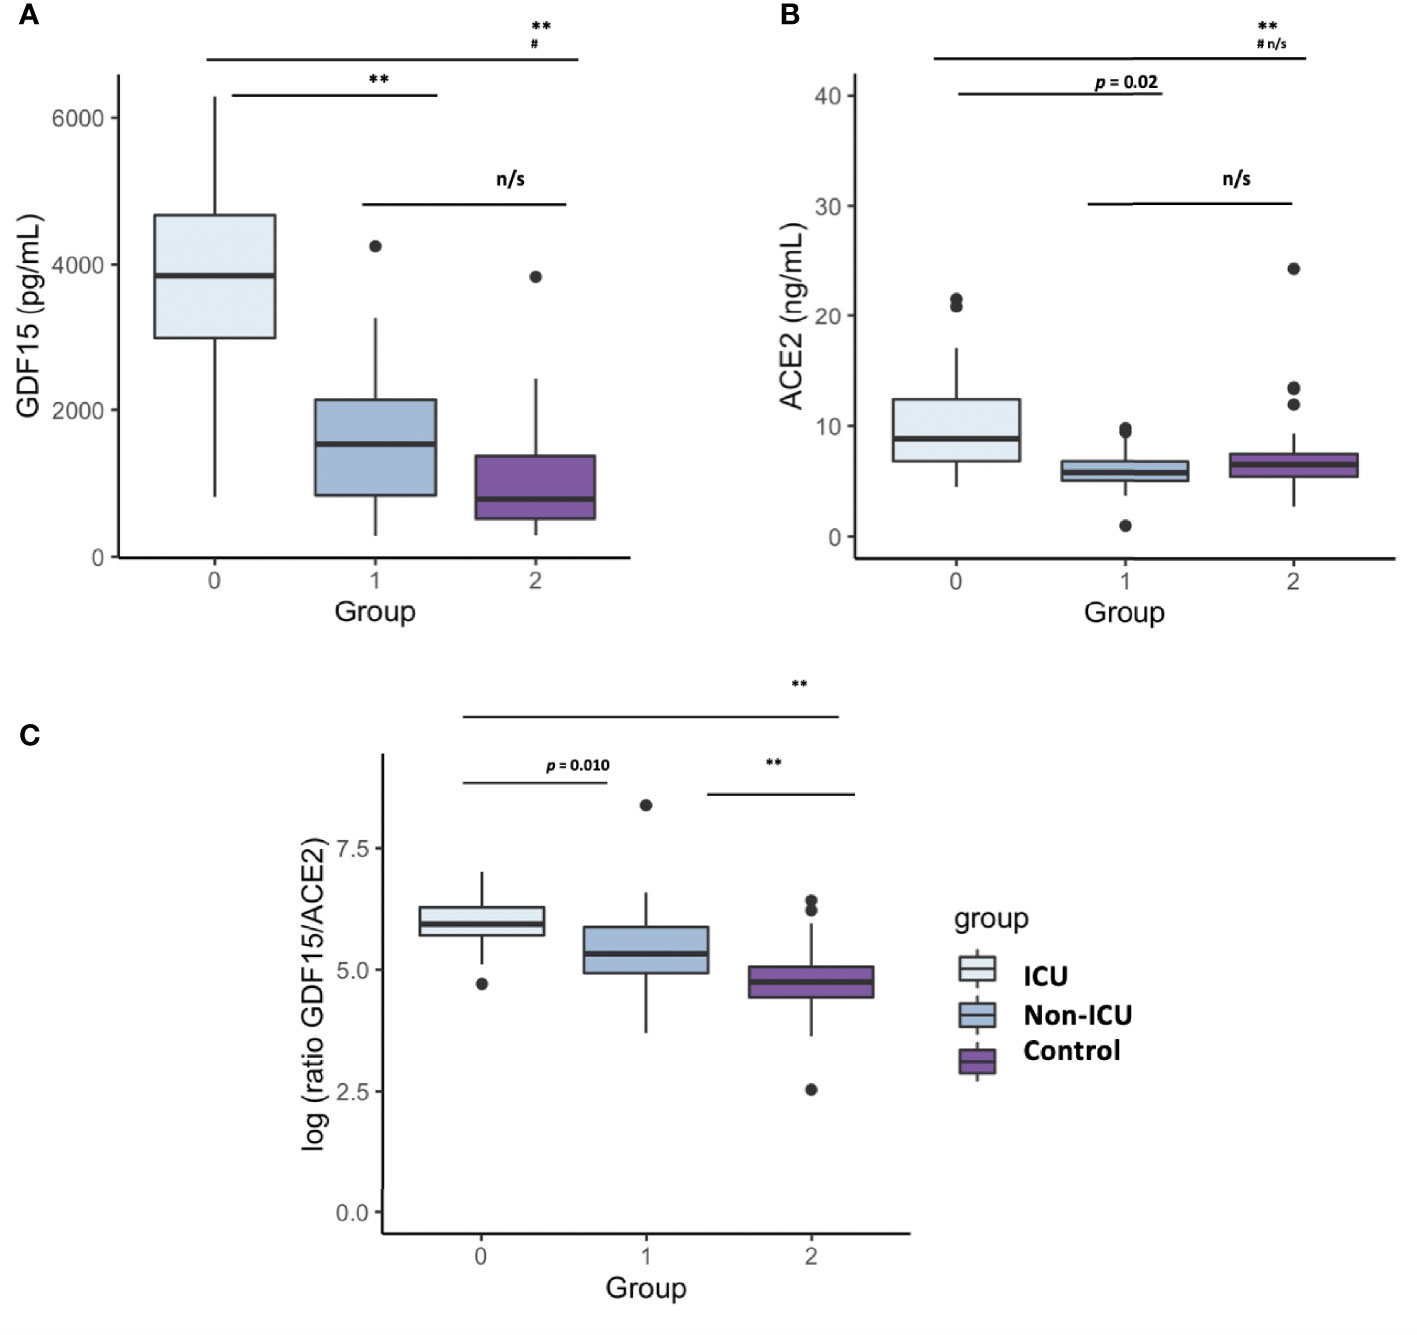
Figure 1 Differences in circulating GDF15 and ACE2 levels in COVID-19 patients and a uninfected control group. (A) GDF15 levels; (B) ACE2 levels; (C) ratio GDf15/ACE2; The box plots represent the maximum and minimum levels (whiskers), the upper and lower quartiles, and the median. The length of each box represents the interquartile range. Dots represent outliers. Statistical significance between groups was determined using the ANOVA test. **p <0.001, #p <0.001 UCI vs Control, n/s (non significant); GDF15 (Growth differentiation factor 15); ACE2 (angiotensin-converting enzyme 2).
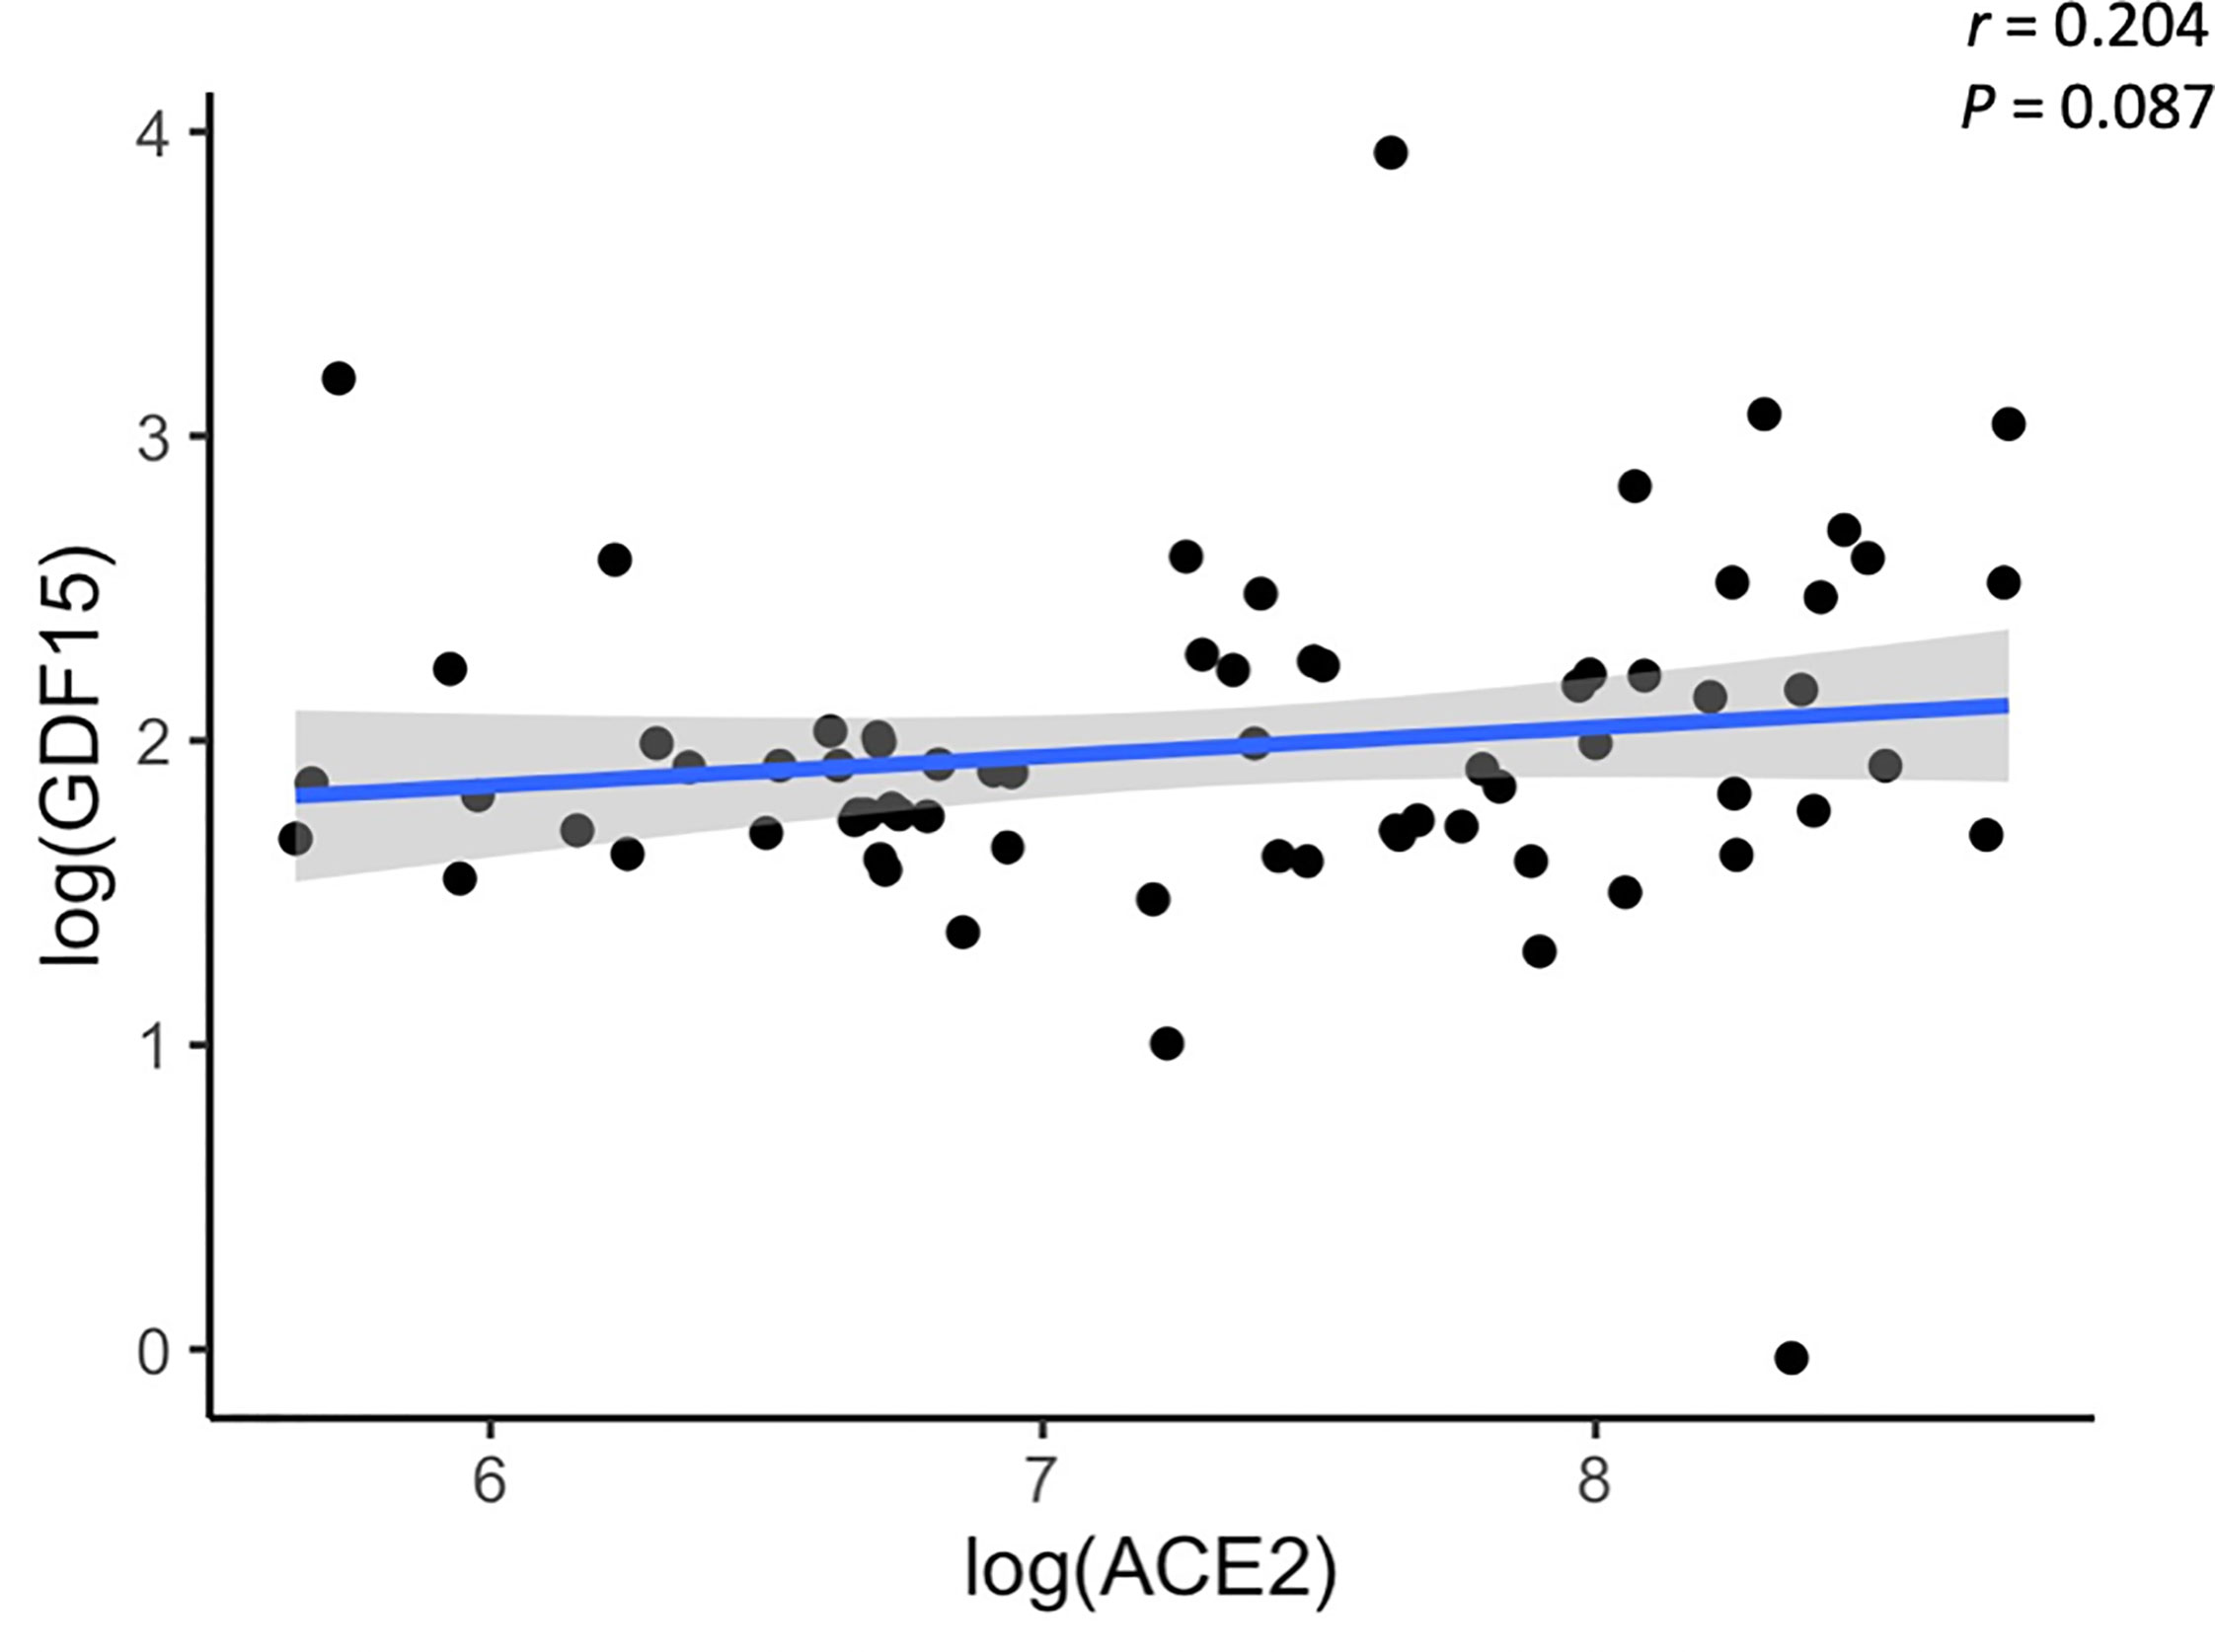
Figure 2 Representative scatterplot showing the association between GDF15 and ACE2 levels. Results of the 72 subjects are shown. Each dot represents an individual value. The solid blue line represents the regression line. The grey shade represents the confidence interval.
Association between the levels of GDF15 and ACE2, with age, sex, and inflammatory markers
As expected, circulating GDF15 was positively associated with age (r=0.482, P<0.001, Figure 3A). However, ACE2 levels were not associated with age (r=-0.003, P=0.982, Figure 3B). No differences were found in the circulating levels of GDF15 (Figure 4A) and ACE2 (Figure 4B) with sex (P >0.05). Since ACE2 is the functional receptor of SARS-CoV-2, we checked whether there were differences in the ACE2 mRNA by RT-qPCR (Figure 5). ICU patients showed higher levels of ACE2 expression compared to non-ICU and control groups (P=0.006 and P=0.003, respectively). Interestingly, ACE2 expression levels did not correlate with ACE2 protein levels measured by ELISA (data not shown).
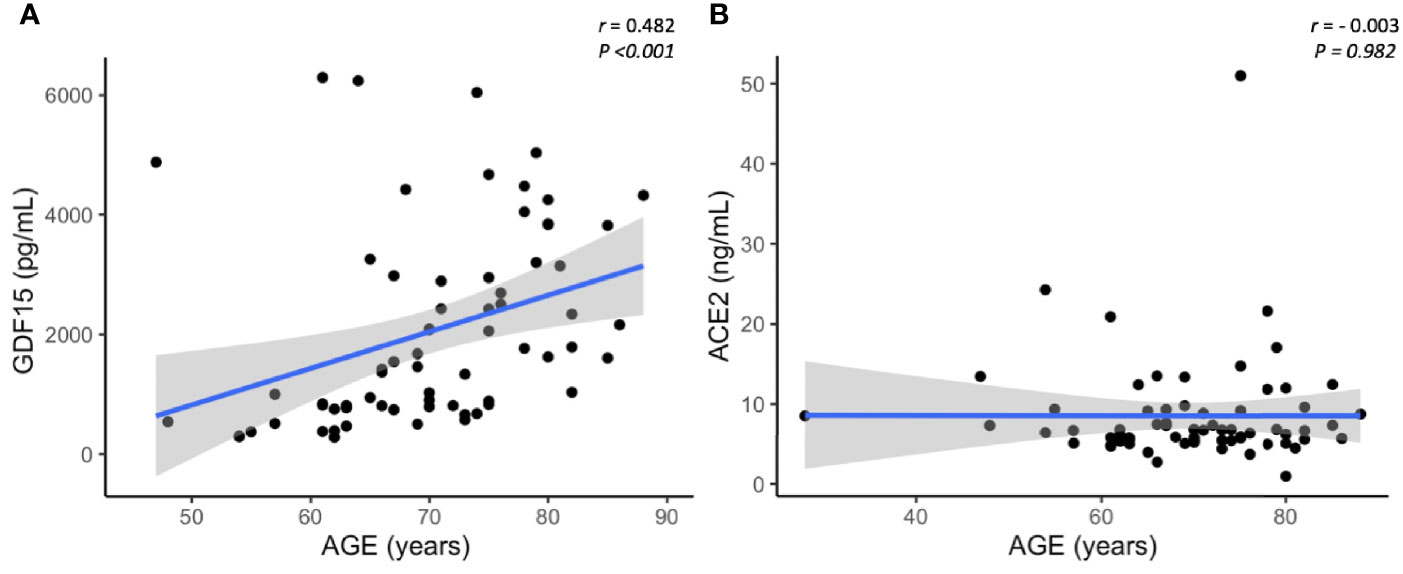
Figure 3 Representative scatterplots showing the association between GDF15 and ACE2 levels with age. GDF15 is positive associated with age (A), while ACE2 is not correlated with age (B). Each dot represents an individual value. The solid blue line represents the regression line. The grey shade represents the confidence interval.
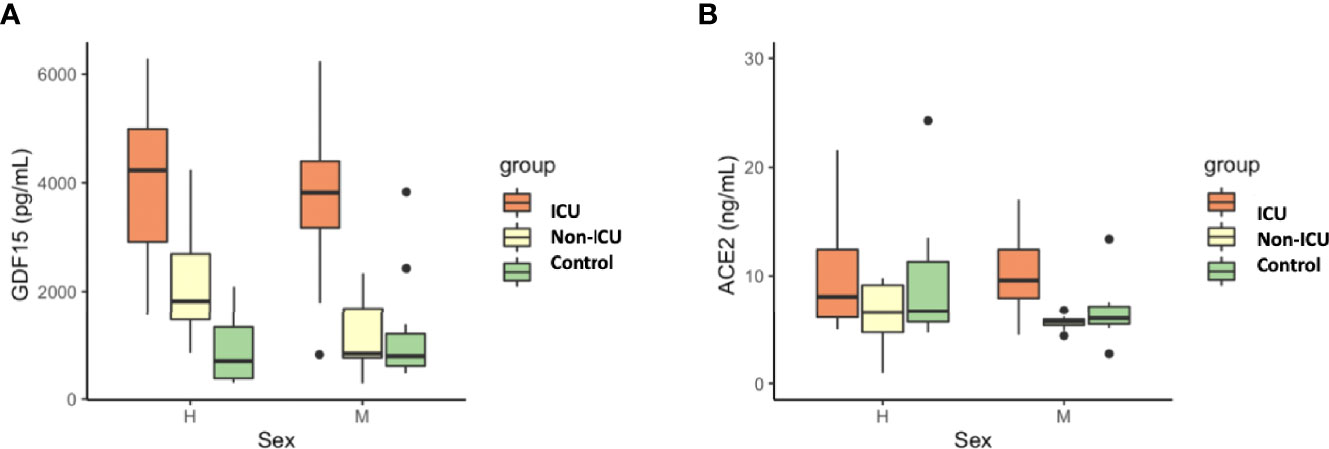
Figure 4 Differences in circulating GDF15 (A) and ACE2 levels (B) by sex in COVID-19 patients and the uninfected control group. No differences were found by sex in GDF15 and ACE levels. The box plots represent the maximum and minimum levels (whiskers), the upper and lower quartiles, and the median. The length of each box represents the interquartile range. Dots represent outliers. Statistical significance between groups was determined using the ANOVA test.
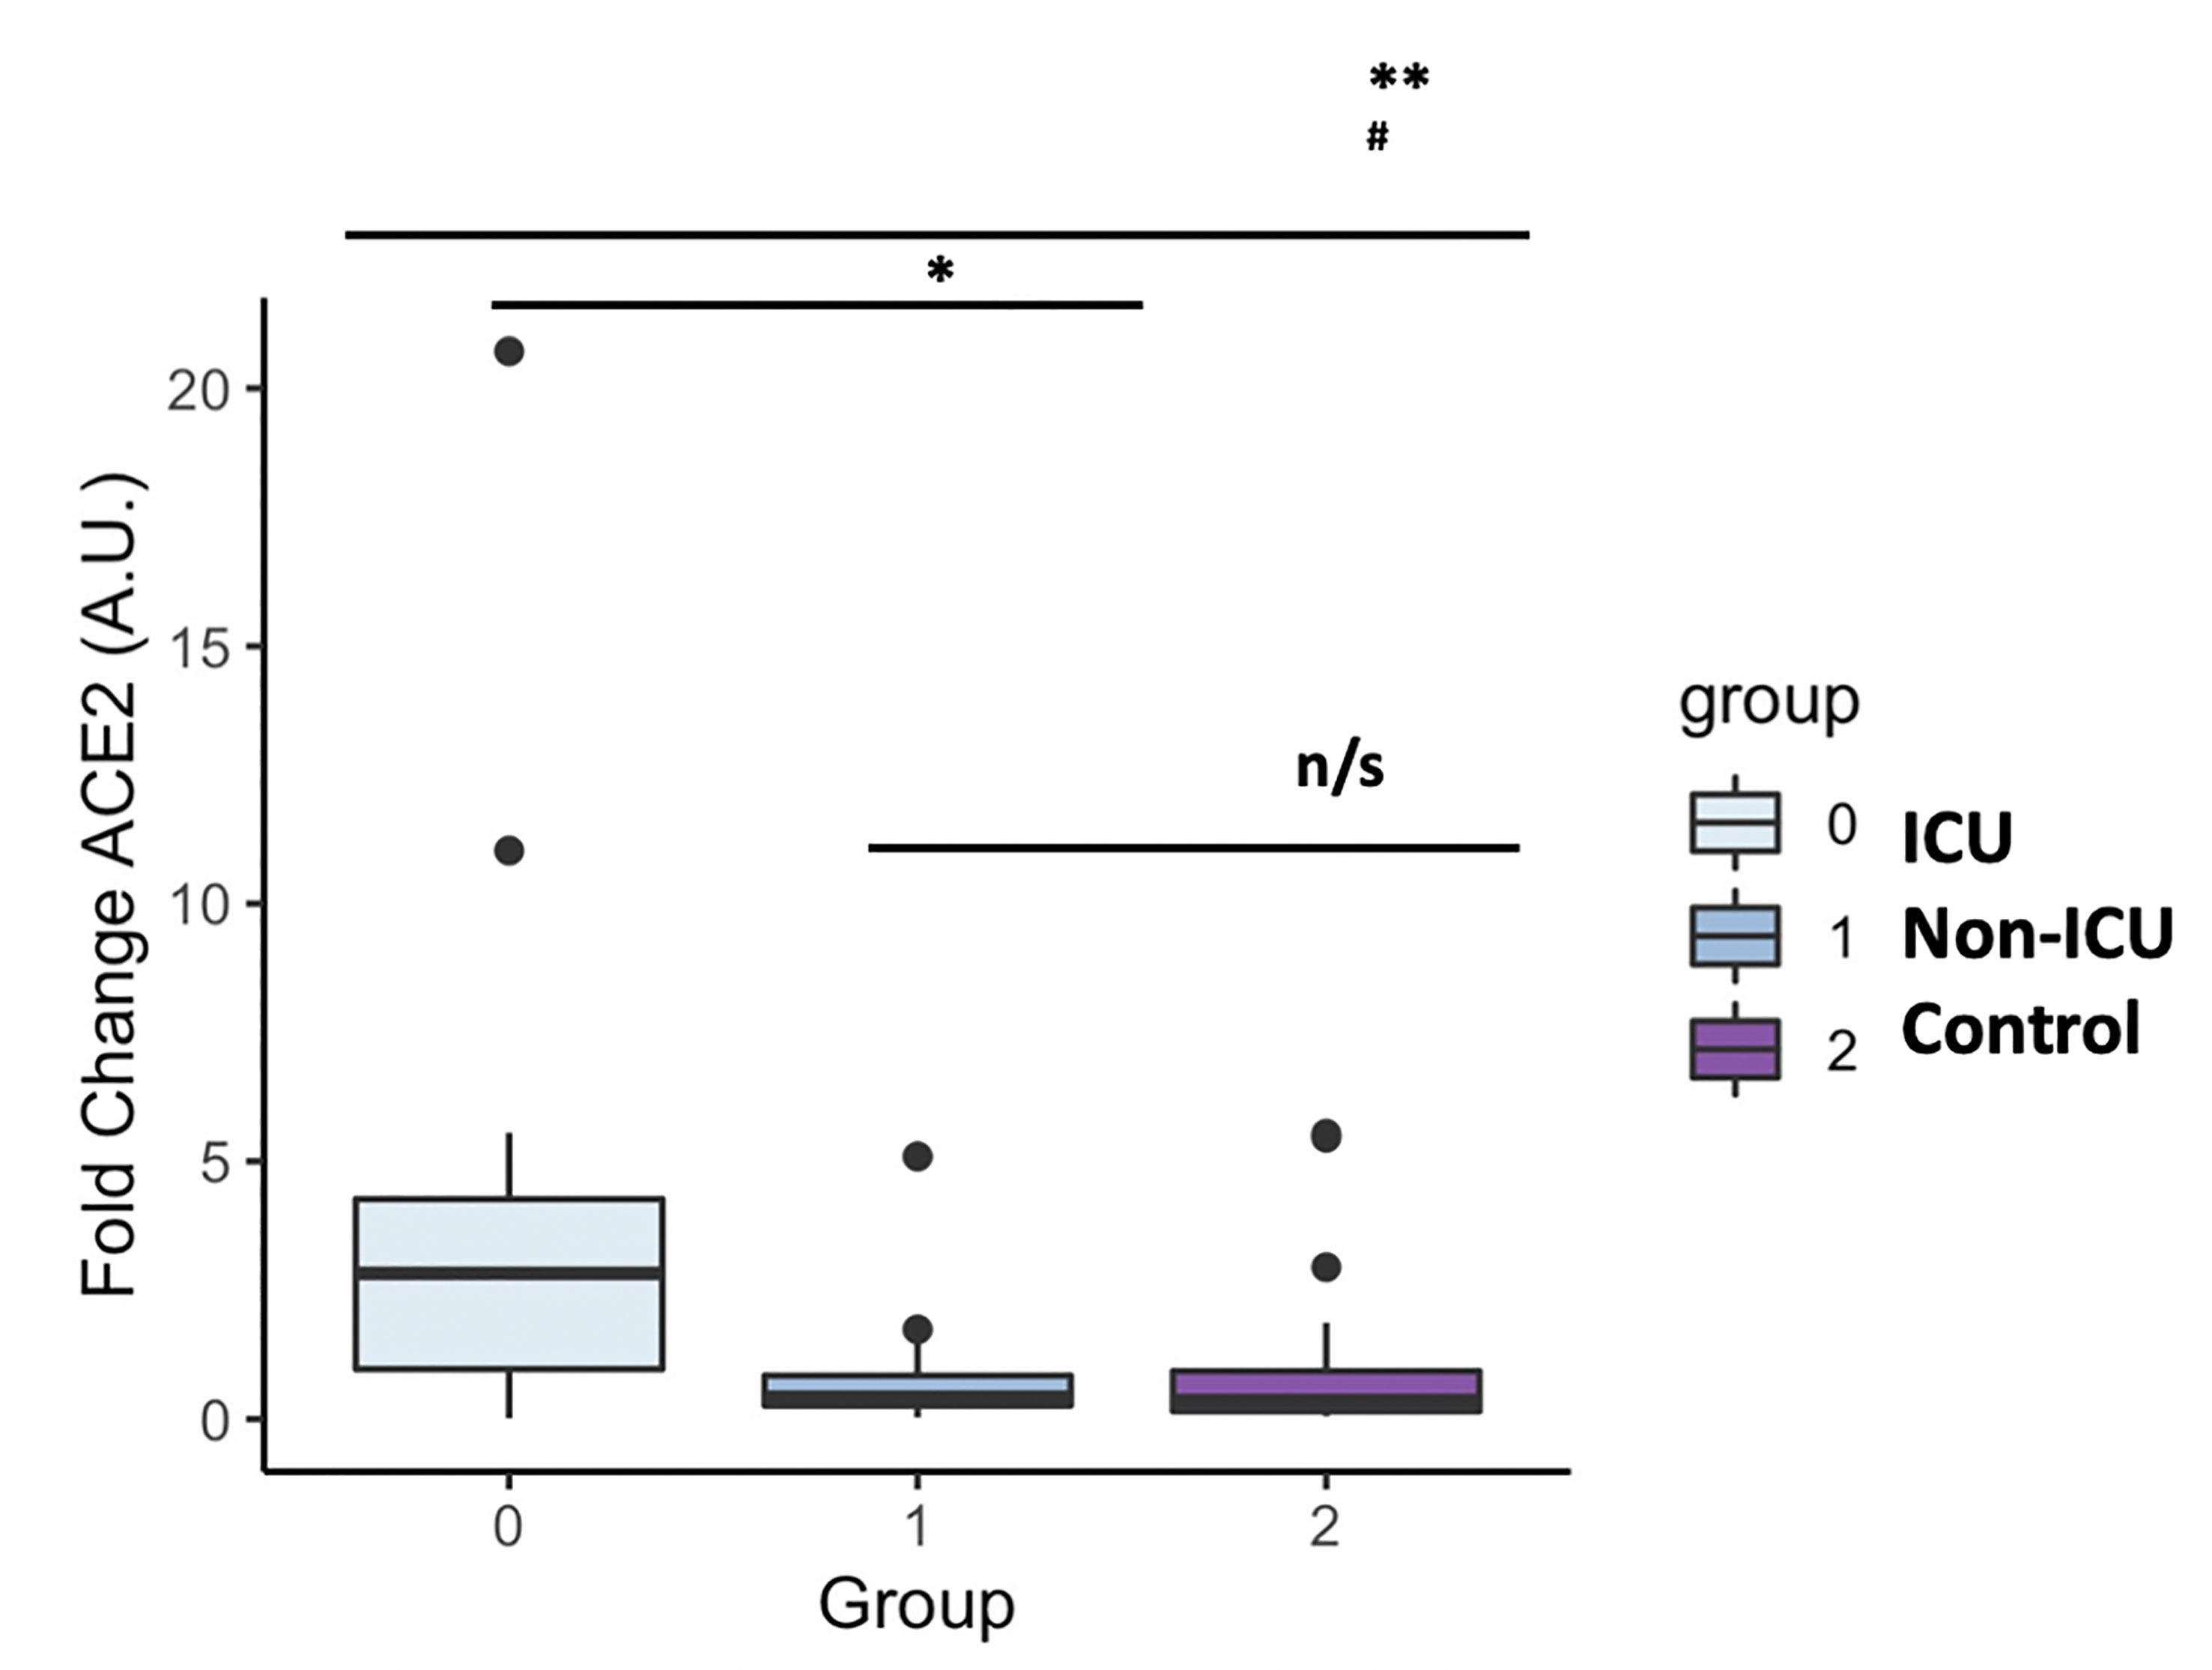
Figure 5 ACE2 mRNA levels in COVID-19 patients and the uninfected control group. The box plots represent the maximum and minimum levels (whiskers), the upper and lower quartiles, and the median. The length of each box represents the interquartile range. Dots represent outliers. Statistical significance between groups was determined using the ANOVA test. **p <0.001, #p <0.001 UCI vs Control, n/s (non significant); ACE2 (angiotensin-converting enzyme 2).
We next analyzed the association between the levels of GDF15 and ACE2 with ferritin, D-dimer and CRP, classical markers of inflammation. Only COVID-19 patients had data on inflammatory markers. As expected, the levels of both GDF15 (Figure 6A) and ACE2 (Figure 6B) were positively correlated with the levels of ferritin, D-dimer, and CRP (GDF15: r=0.561, r=0.688, r=0.497, respectively, P<0.001; ACE2: r= 0.386 and P=0.009, r=0.350 and P=0.021, r=0.381 and P=0.012, respectively).
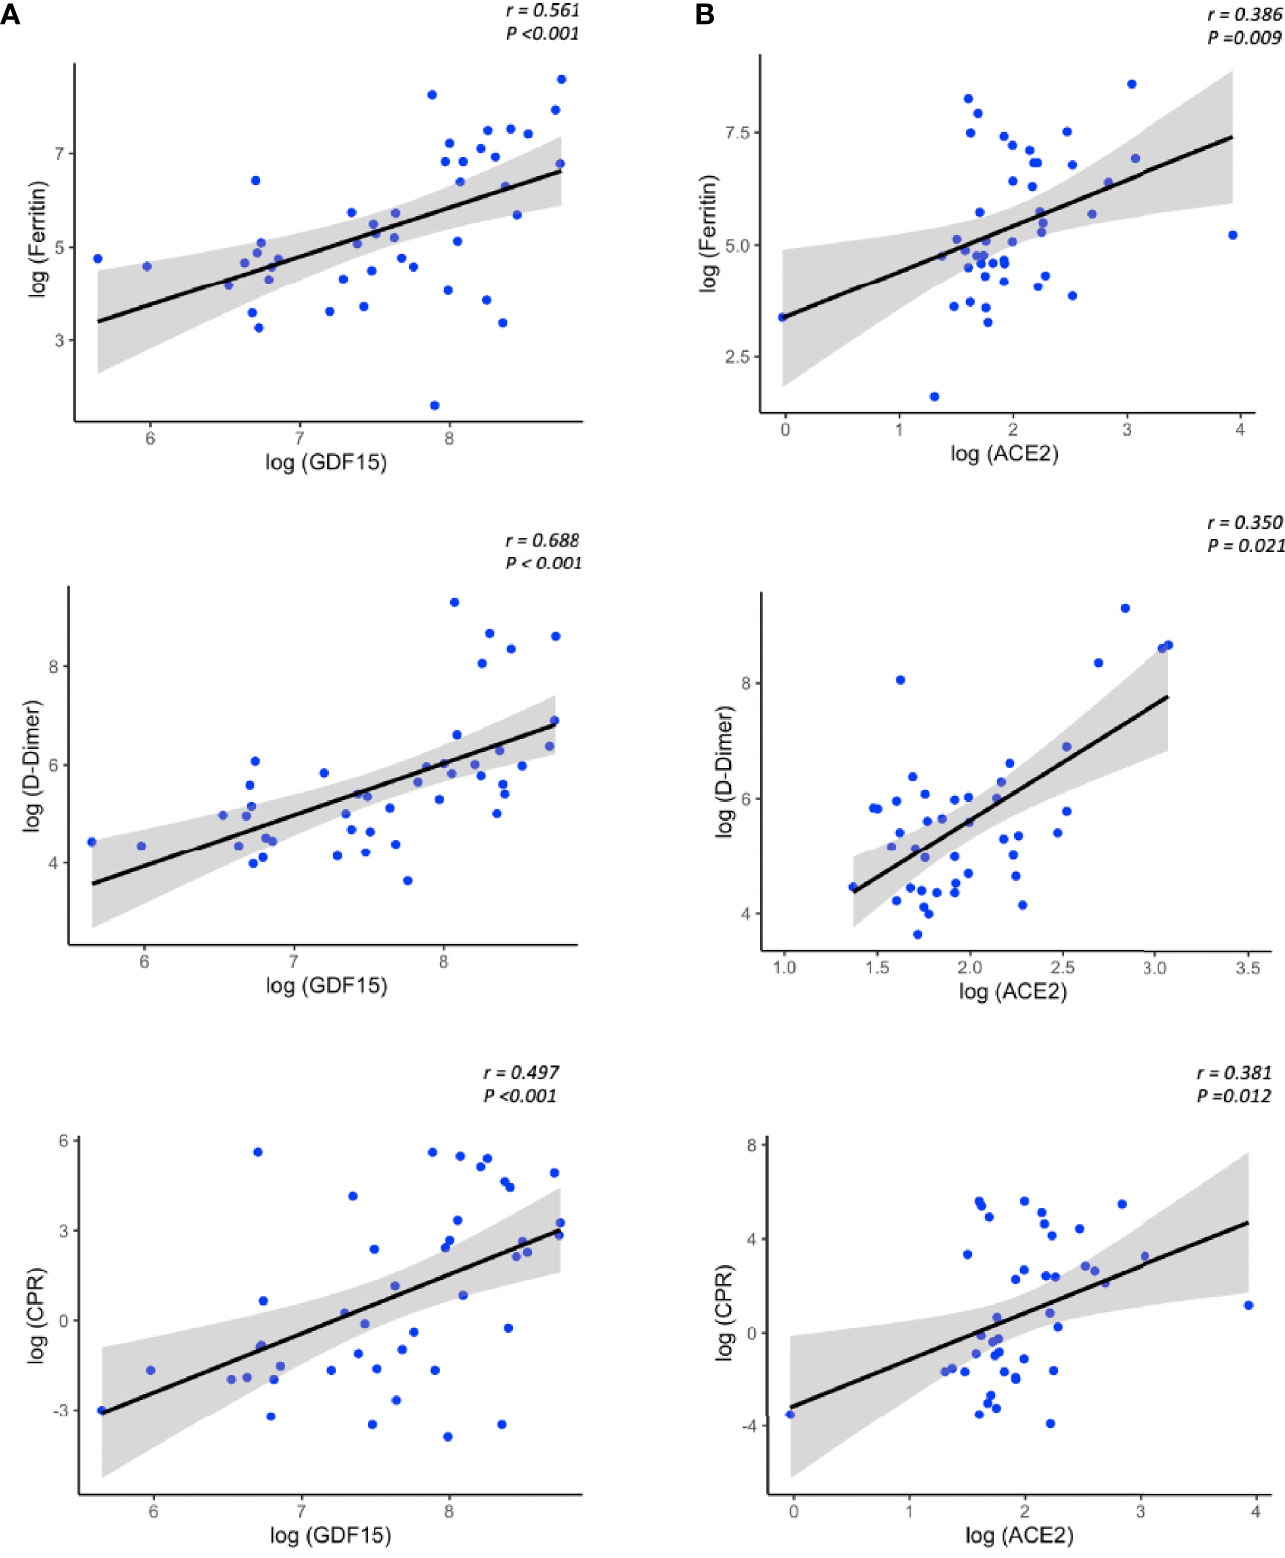
Figure 6 Representative scatterplots (spearman correlations) showing the association between GDF15 (A) and ACE2 levels (B) with classical inflammatory markers.The solid line represents the regression line. The grey shade represents the confidence interval.
Since hypoxia is one of the main pathophysiological causes of mortality in patients with COVID-19 and the release of damaged mitochondrial DNA (mtDNA) is related to the increase of the systemic inflammatory response, we sought to determine the circulating levels of hypoxia inducible factor 1 A (HIF1A) mRNA, a transcription factor that normally is upregulated during hypoxic and inflammatory conditions, and circulating levels of mtDNA, measured as the ratio between nuclear to mitochondrial DNA. Unexpectedly, we did not find differences neither in the expression levels of mtDNA or HIF1A (Figures 7A, B respectively).
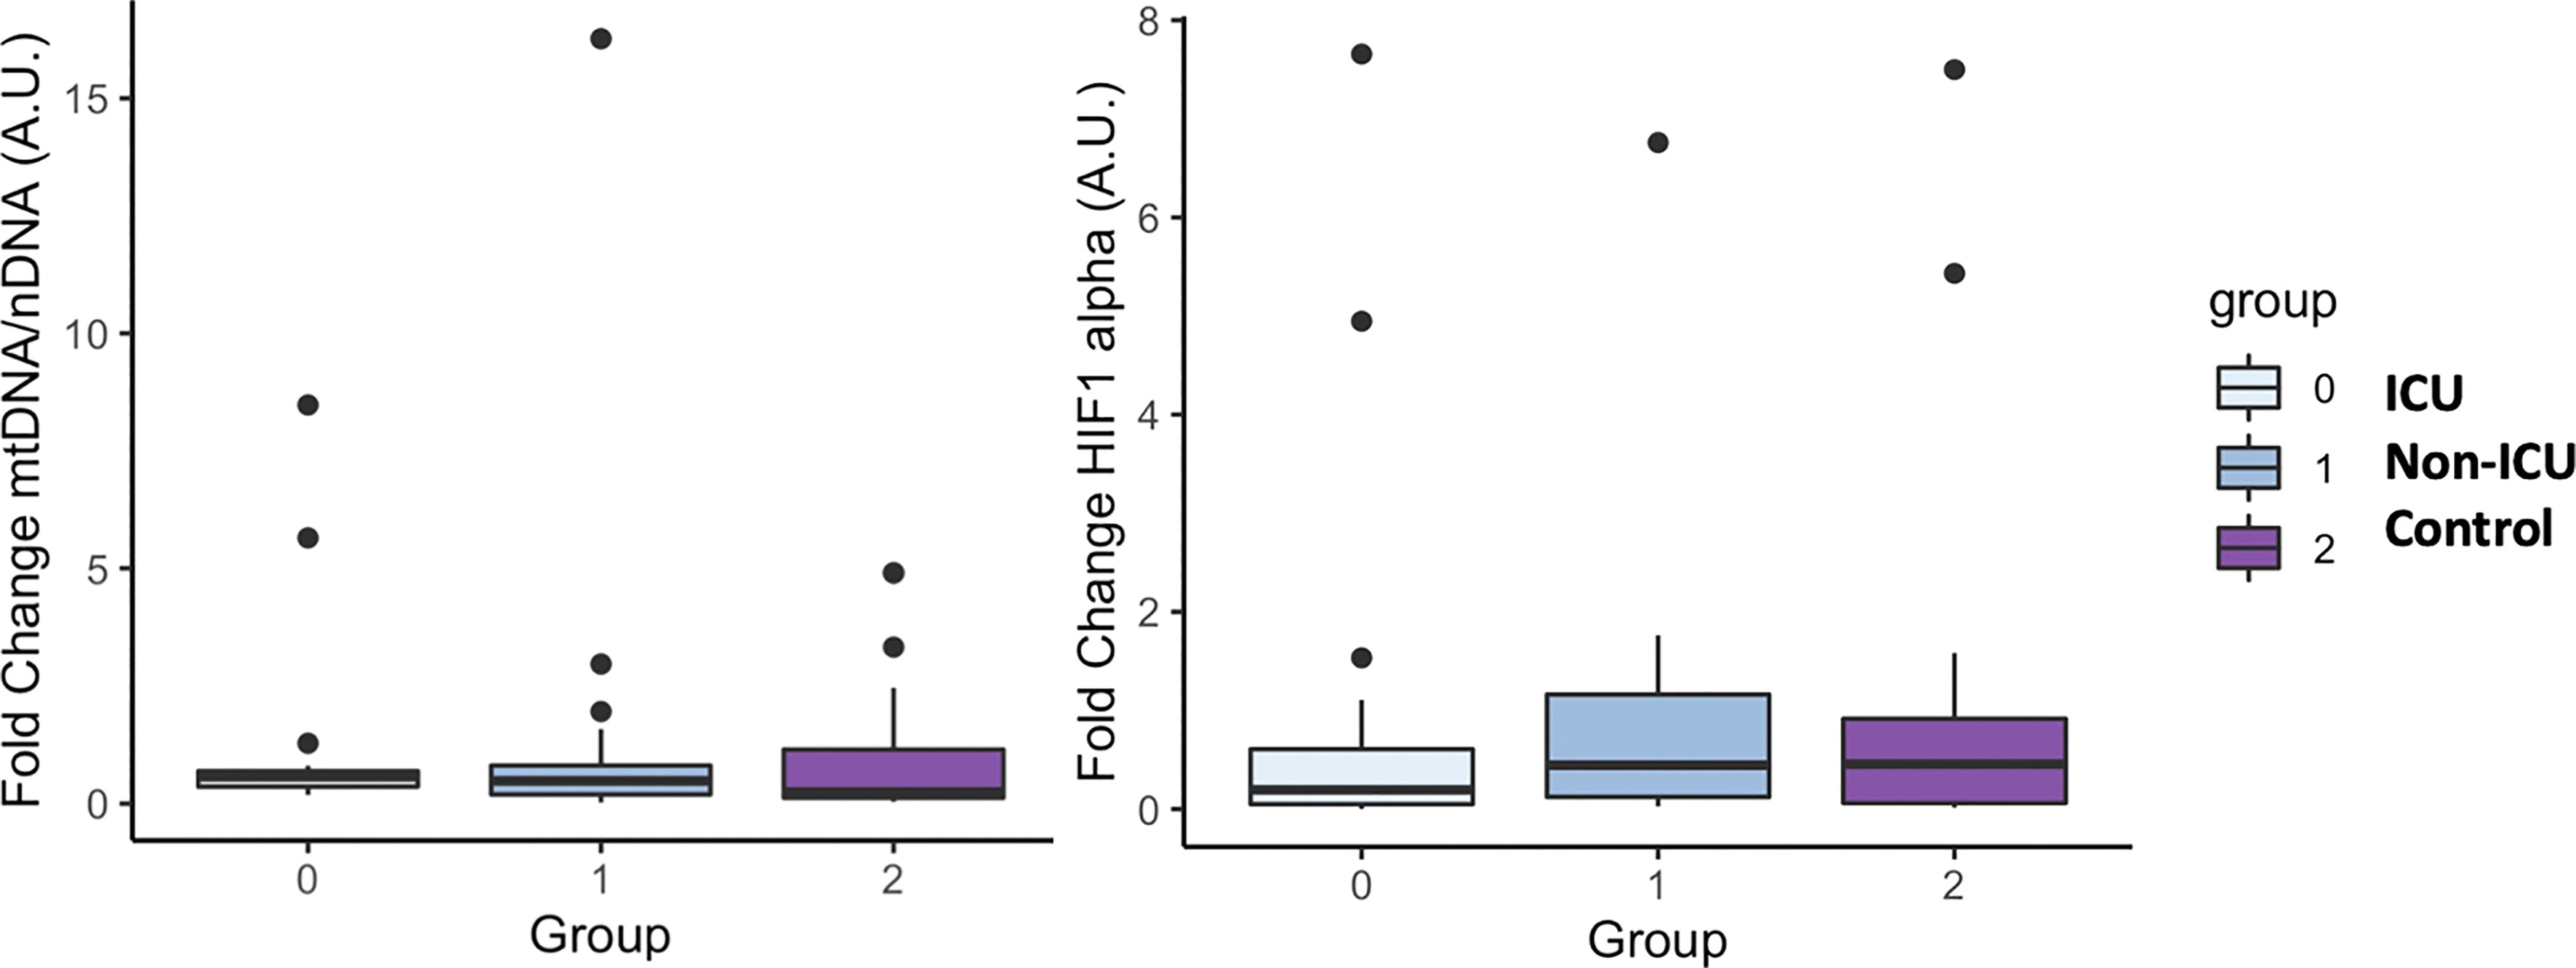
Figure 7 mtDNA and HIF1 alpha mRNA levels in COVID-19 patients and the uninfected control group. The box plots represent the maximum and minimum levels (whiskers), the upper and lower quartiles, and the median. The length of each box represents the interquartile range. Dots represent outliers. Statistical significance between groups was determined using the ANOVA test. No difference were found in mtDNA and HIF1 alpha mRNA levels among groups.
We performed principal component analysis (PCA) with all the markers above plus GDF15, ACE2, age, and sex (Figure 8). These analyses showed a clear distinction between ICU, non-ICU patients and the control group, revealing a clear effect of SARS-CoV-2 infected patients compared to uninfected subjects.
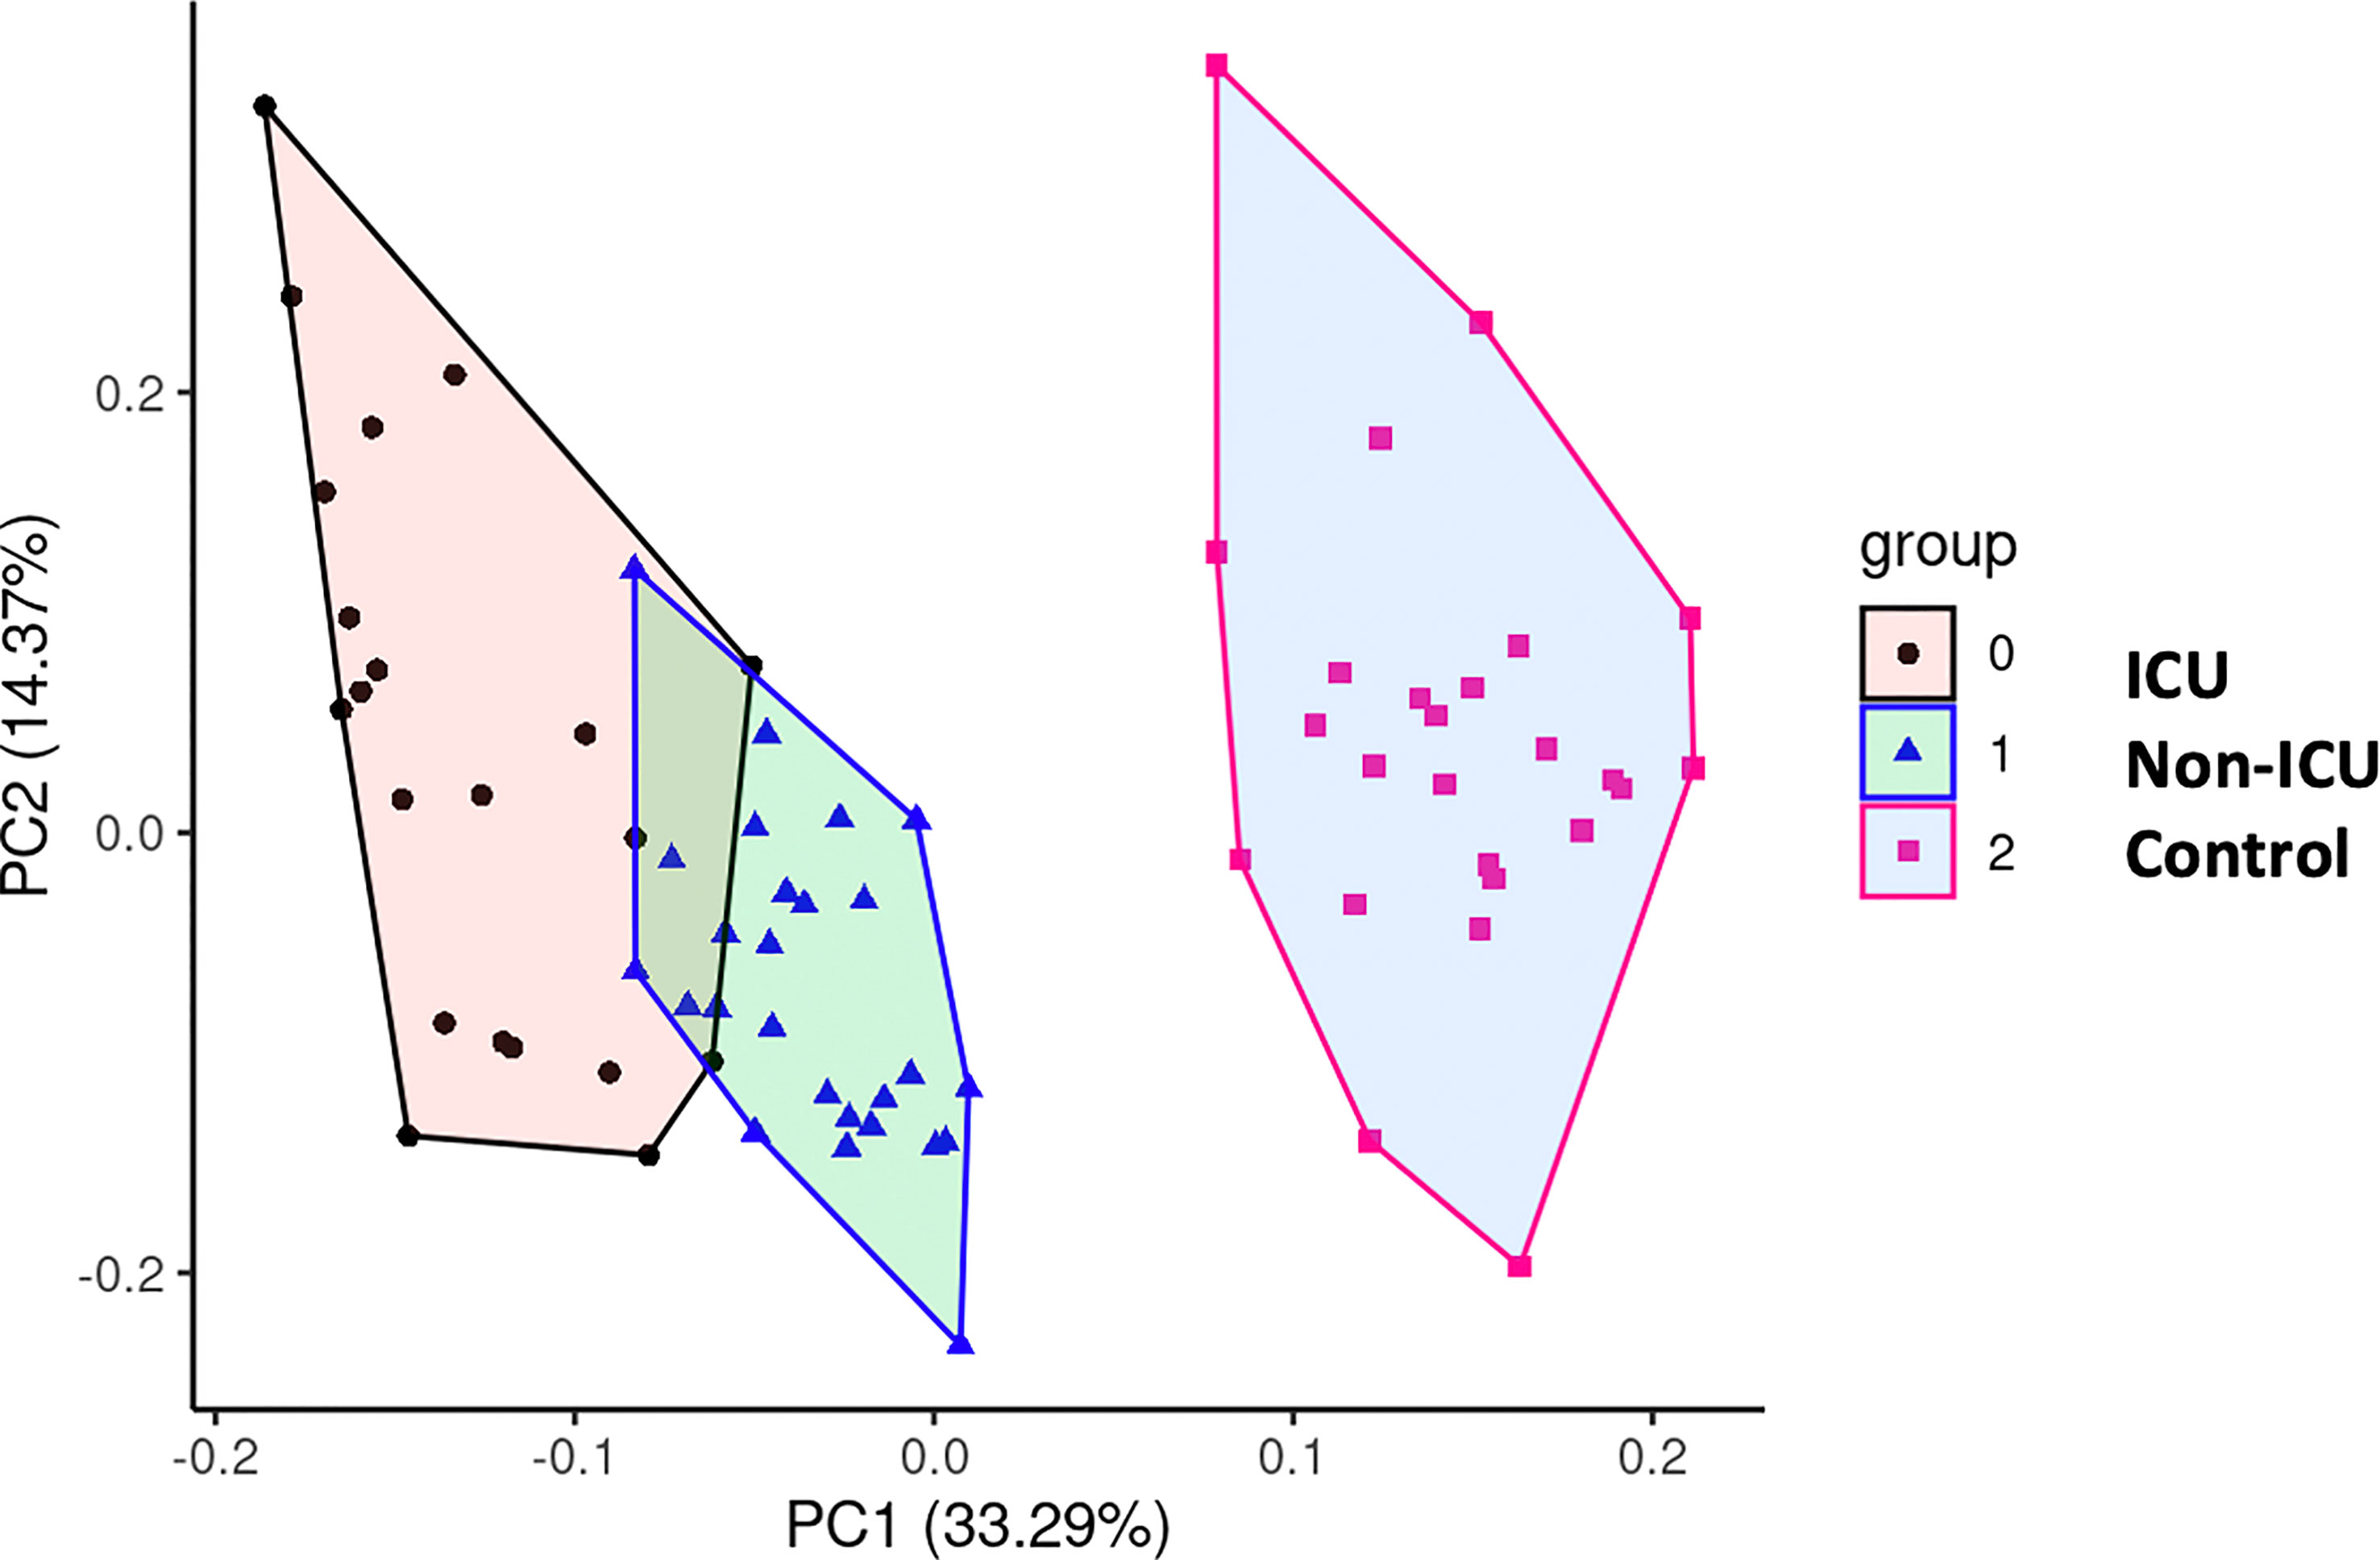
Figure 8 Principal Component Analysis (PCA). To test potential associations between the studied parameters,a PCA was computed, showing a clear distinction between COVID-19 patients and uninfected control subjects.
We had complete clinical data from blood routine analysis (Supplementary Table 3) as well as buffy coats from the non-UCI group, we decided to test if the levels of GDF15 and ACE2 were correlated with those parameters. We also extracted RNA and DNA from buffy coats and measured known markers of senescence and oxidative damage, such as p16, p21, telomere length, mtDNA/nDNA ratio and mtDNA oxidation. In the Supplemental Table 4 we show the correlation coefficient between all the variables described above, GDF15 and ACE2. Interestingly, both circulating GDF15 and ACE2 were positively correlated with glucose, urea, creatinine, and N-terminal (NT)-pro hormone BNP (NT-proBNP) (P<0.01). Circulating GDF15 was negatively correlated to the platelets levels (r= -0.557, P <0.05) and the levels of mtDNA oxidation (r= -0.495, P <0.05). With regards to mRNA expression data, the expression levels of ACE2 in plasma were also correlated with the neutrophil and the ratio lymphocyte to neutrophils (r= 0.478, p <0.05; r= 0.629, P<0.01 respectively), while the expression levels of ACE2 in buffy coats were only associated with the eosinophils levels (r= 0.542, P <0.05). Finally, the protein and mRNA expression levels of ACE2 in plasma were highly positive correlated with the expression of HIF1A in buffy coats (r= 0.637, P <0.05), while the levels of ACE2 in buffy coats were correlated with the expression of HIF1A in plasma (r= 0.704, P <0.01).
Differential SARS-CoV-2 infection dependent on COVID-19 variant-of-concern and ACE2 expression
Since ACE2 circulating levels were increased in the ICU group compared to the non-ICU and control group, both at mRNA and protein levels (Figures 5, 1B), we then tested the effect of full length ACE2 expression on the infection capacity of SARS-CoV-2. To this end, we developed an infection model based on SARS-CoV-2 pseudotyped lentivirus (pseudovirus) expressing Spike protein and encapsulating a mCherry reporter. We tested infection with this approach in human alveolar lung A549 cells, as a COVID-19 human infection model to recapitulate airway infection (Figure 9A). We found untransfected A549 to be non-permissive to SARS-CoV-2 pseudoinfection (Figure 9B) due to the low expression of the endogenous viral receptor ACE2 (Supplementary Figure 1). This eliminates the interference of endogenous ACE2 when overexpressing ACE2 variants and facilitates the interpretation of results when performing pseudovirus entry studies. Exogenous expression of GFP-ACE2 enabled SARS-CoV-2 pseudovirus to effectively infect the cells with mCherry reporter as determined by Fluorescent Activated Cell Sorter (FACS) (Figure 9B).
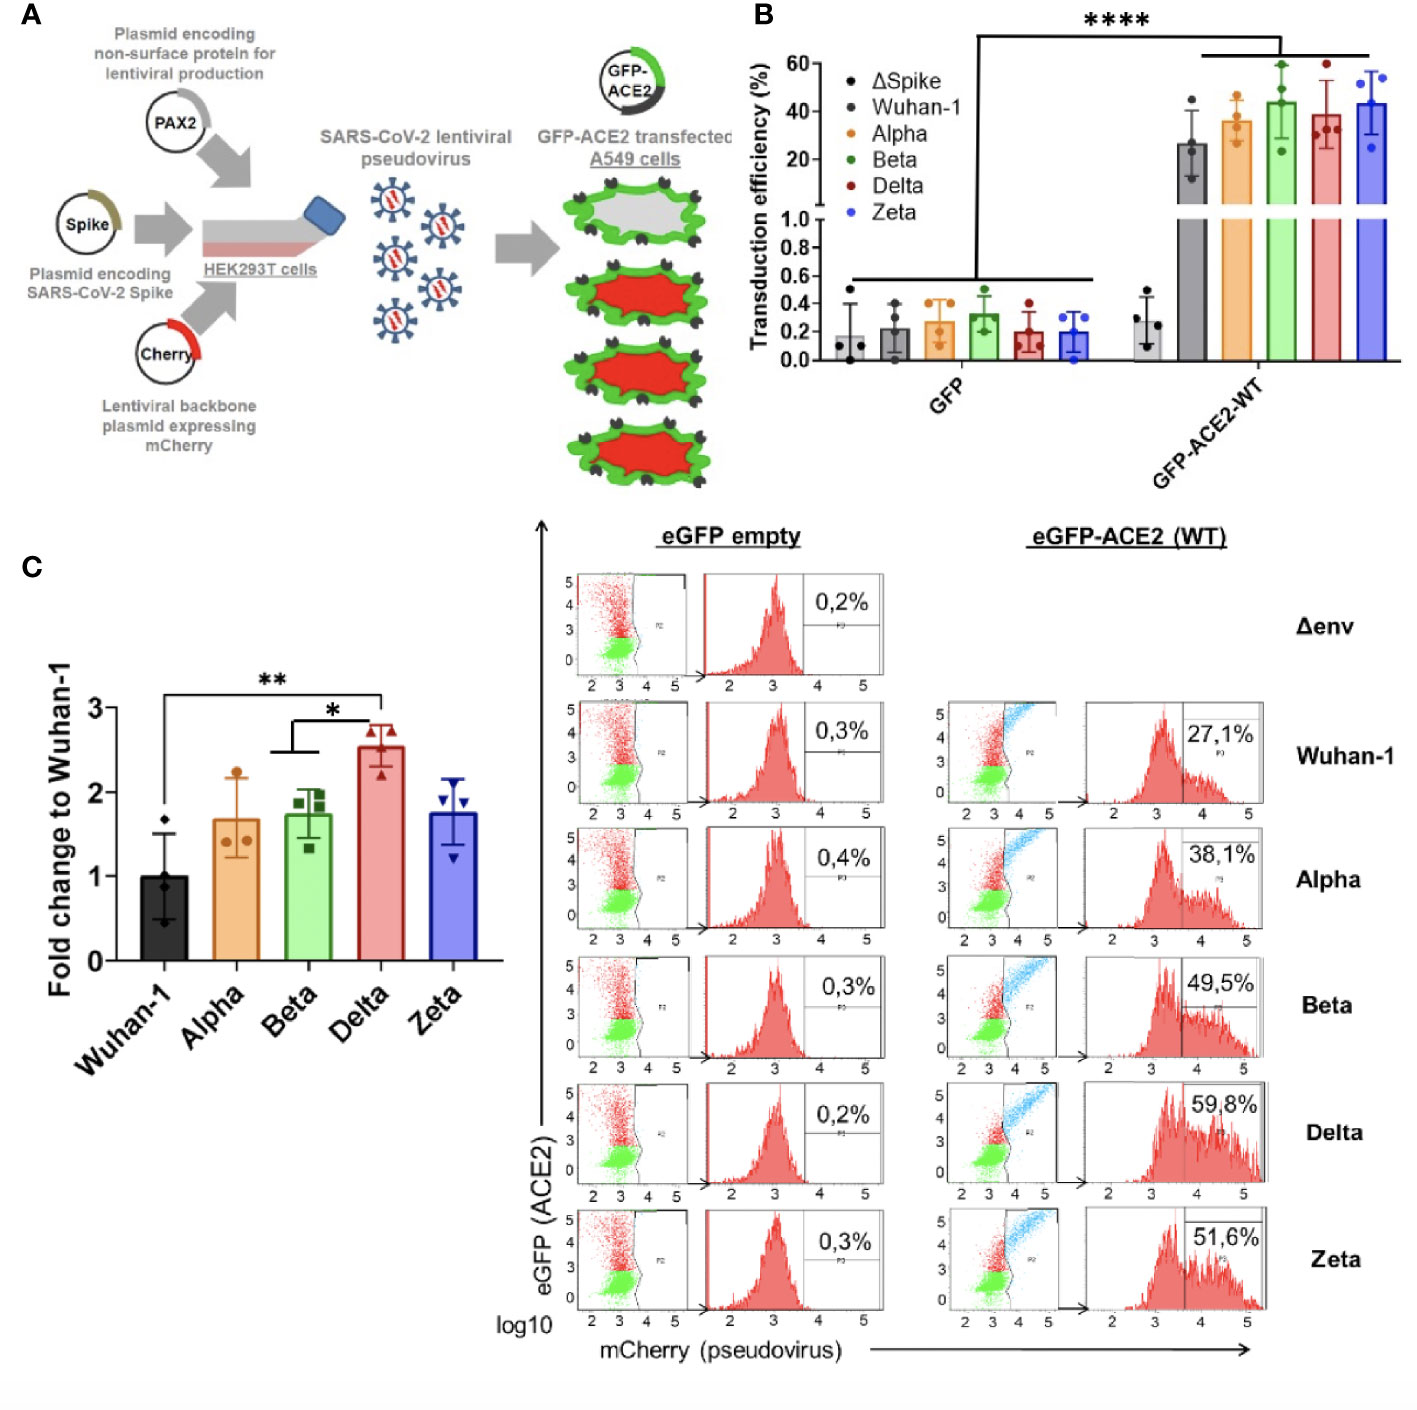
Figure 9 Differential SARS-CoV-2 infection is dependent on COVID19 variant-of-concern and ACE2 expression. (A) SARS-CoV-2 cell entry assay strategy: Lentiviral-based replication-defective pseudovirus were generated in HEK293T cells from lentiviral parental genes, SARS-CoV-2 Spike and encapsulating a mCherry reporter. Since the entry steps of the SARS-CoV-2 pseudovirions are governed by the coronavirus Spike protein at their surface, they enter cells in a similar fashion to native counterparts. A549 airway cells were transfected with exogenous GFP-hACE2 enabling SARS-CoV-2 pseudovirus to effectively infect the cells with mCherry reporter. Double-positive GFP/mCherry cells were quantified by flow cytometry to assess viral infection capacity. (B,C) Following the strategy described in A, A549 cells expressing GFP-hACE2 were assayed for cell entry by SARS-CoV-2 pseudovirus expressing either empty vector (Δ Spike) or Spike protein corresponding to origin variant (Wuhan-1) or variants-of-concern Alpha, Beta, Delta or Zeta. A representative flow cytometry experiment is shown. Bars demonstrate mean and Standard Error of Mean while each data point represents a unique experiment; ****P < 0.0001; **P < 0.01; *P < 0.1 by two-tailed t-test.
Finally, in order to test whether the main variants of concern (VOC) circulating the last semester of 2021 [B.1.1.7 (Alpha), B.1.351 (Beta), P.2 (Zeta) and B.1.617.2 (Delta)] infected ACE2-expressing cells with differential efficiency, we expressed the different full-length Spike protein corresponding to the VOCs (Wuhan-1, Alpha, Beta, Delta and Zeta) in the lentiviral pseudovirus model described above and infected the A549 transiently expressing full length ACE2 described above.
We found significant increased infectivity in the Delta variant as compared to the origin variant Wuhan-1 (P<0.016). Alpha, Beta and Zeta showed a modest non-significant increased infectivity as compared to Wuhan-1 (Figure 9C).
ACE2 polymorphisms K26R, P389 and N720D promote SARS-CoV-2 infection in all VOCs
Given that host genetics and ethnicity predisposition to COVID-19 is now recognized to be relevant to COVID-19 susceptibility and severity, we reasoned that it is very likely that there exists ACE2 variants in human populations that may modulate its affinity to SARS-CoV-2 S-protein and thereby render individuals more resistant or susceptible to the virus. To investigate this, we shortlisted the ACE2 non-synonymous variants fulfilling the triple requirement of 1) high allelic frequency [>10e-4 (gnomAD)], 2) involved critical residues in the ACE2-claw S-protein RBD-binding interface (Hussain et al., 2020; Suryamohan et al., 2021) and 3) being potentially clinically relevant especially in Mediterranean populations (Benetti et al., 2020; Vadgama et al., 2022) (Figure 10A). Therefore we 5 shortlisted three common c.2158A>G p.(N720D), c.77A>G p.(K26R), and c.631G>A p.(G211R) SNPs and two rare variants, namely, c.1051C>G p.(L351V) and c.1166C>A p.(P389H) (Figure 10A). Intriguingly, these variants are overrepresented in the Mediterranean and European populations (P <0.001) but are extremely rare in the Asian population (Consortium GER, 2019; Benetti et al., 2020; Vadgama et al., 2022). We analyzed the impact of the shortlisted ACE2 non-synonymous variants on SARS-CoV-2 infection using the Pseudovirus infection model described above. We found that upon similar expression of the ACE2 variants (Supplementary Figure 1A), SARS-CoV-2 pseudovirus containing Wuhan-1 Spike was able to infect A549 cells more efficiently in K26R (P=0.0008), P389H (P=0.0012) and N720D (P=0.0059) as compared to the wild-type (WT) ACE2 (Figure 10B). Conversely, we found that the variant G112R exhibited a moderate protective effect on infection (P=0.027). No significant differences were observed in L351V variant (P=0.768) compared to WT, therefore this variant was not further studied (Figure 10B). We obtained similar results when pseudotyping with Alpha, Beta, Delta or Zeta VOC (Figure 10C). This increased infectivity strongly suggests that bearing K26R, P389H or N720D ACE2 variants could constitute a predisposing genetic background for severe COVID-19.
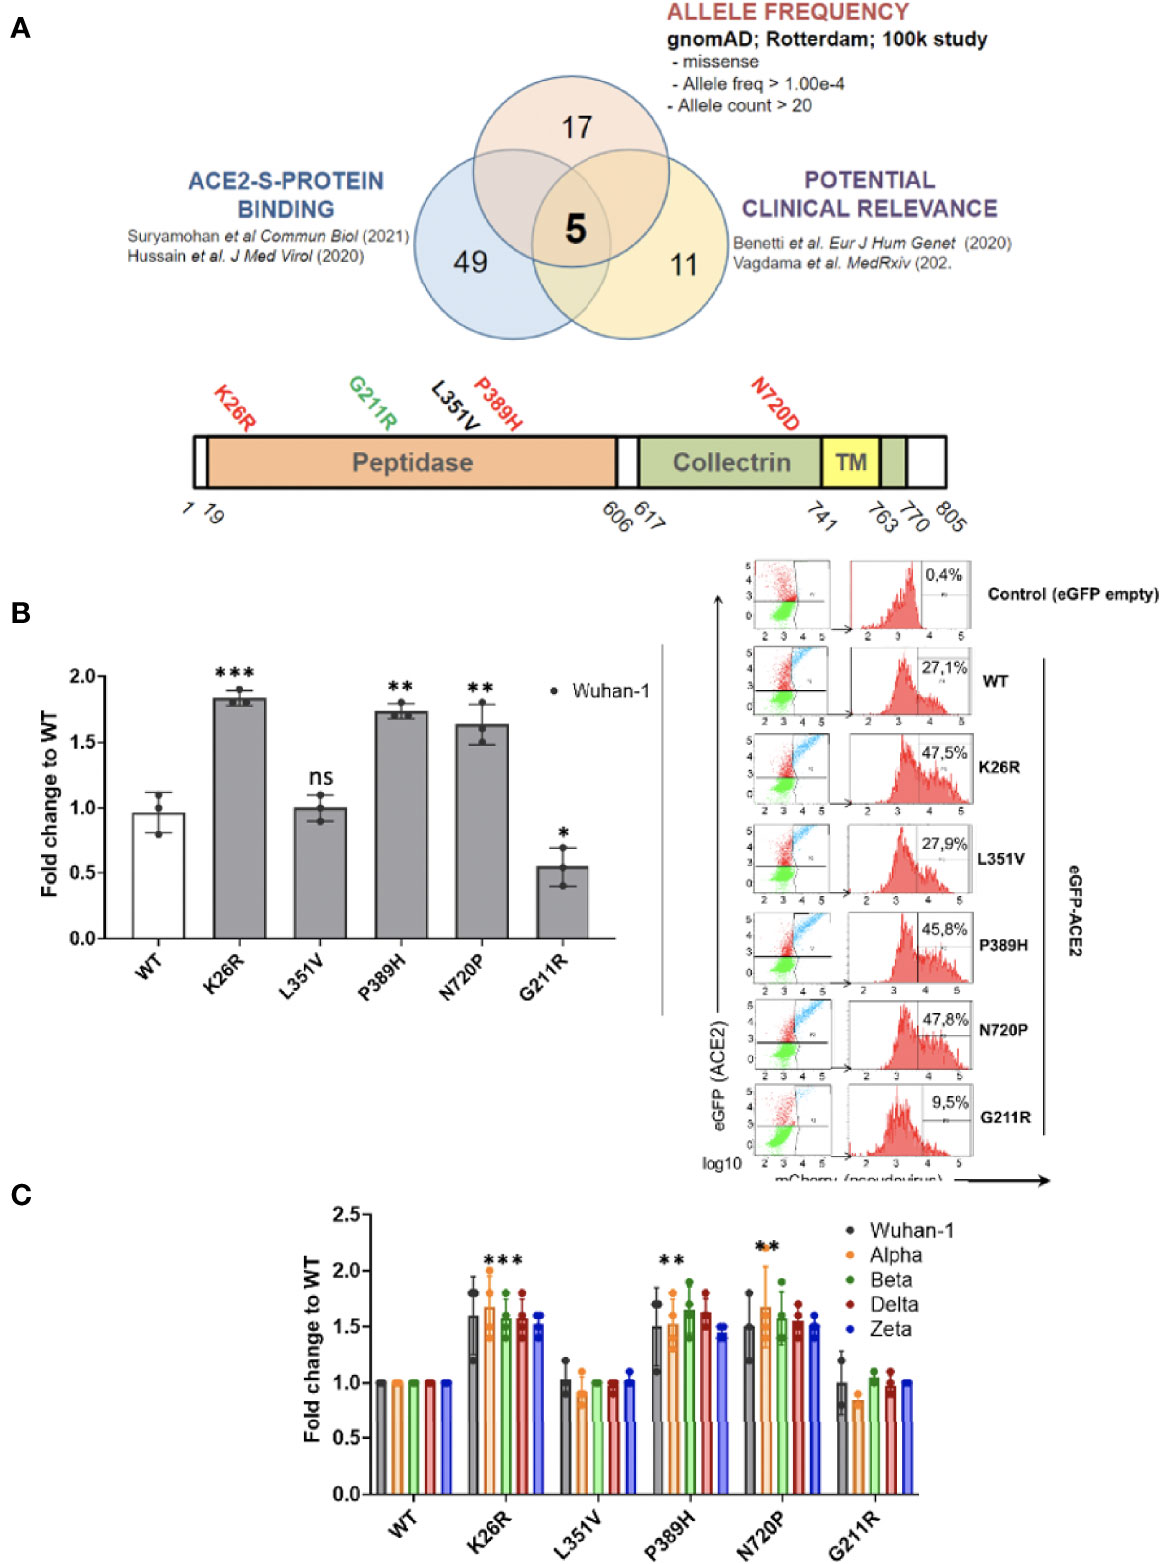
Figure 10 ACE2 polymorphisms K26R, P389 and N720D promote SARS-CoV-2 infection in all VOCs. (A) Studying the effect of ACE2 SNPs. Non-synonymous ACE2 single nucleotide polymorphism were selected among those fulfilling the triple criteria of high allelic frequency (Allele freq > 1.00e-4; Allele count > 20); involved in ACE2-claw S-protein RBD-binding interface and previously associated to clinical outcome. (B, C) Following the strategy described in Fig 9A, A549 cells expressing either GFP-ACE2 either WT or polymorphisms were assayed for cell entry by SARS-CoV-2 pseudovirus expressing either empty vector (Δ Spike) or Spike protein corresponding to origin variant (Wuhan-1) or variants-of-concern Alpha, Beta, Delta or Zeta. A representative flow cytometry experiment is shown. Bars demonstrate mean and Standard Error of Mean while each data point represents a unique experiment; ***P < 0.001, **P < 0.01, *P < 0.1, ns P >0.1 to WT by two-tailed t-test.
ACE2 polymorphisms K26R, P389H and N720D are risk factor for severe COVID-19
Given the potential impact of shortlisted ACE2 variants in SARS-CoV-2 infection and its overrepresentation in Mediterranean populations (Benetti et al., 2020; Vadgama et al., 2022), we analyzed the presence of these variants in severity-stratified groups from our cohort in order to get an insight on the role of ACE2 variants on interindividual severity and susceptibility to COVID-19. We found a differential distribution among groups (Figure 11 and Table 2). Notably, and in line with our in vitro observations, we found that the “infection-promoting” variants K26R, P389H and N720D were enriched in COVID-positive (non-ICU and ICU groups) as compared to matched uninfected controls (Fisher’s exact test P = 0.001; OR= 5.097; RR=3.439 at 95% CI) (Figure 11B and Table 3), suggesting that they constitute a risk factor for COVID-19 patients. Conversely, “infection-protective” G211R variant had a modest protective effect (Fisher’s exact test P <0.001; OR=0.01327; RR= 0.2295 at 95% CI) (Table 3). While these associations need to be confirmed in larger sample sizes, they strongly suggest that these variants could play a central role in COVID-19 susceptibility.
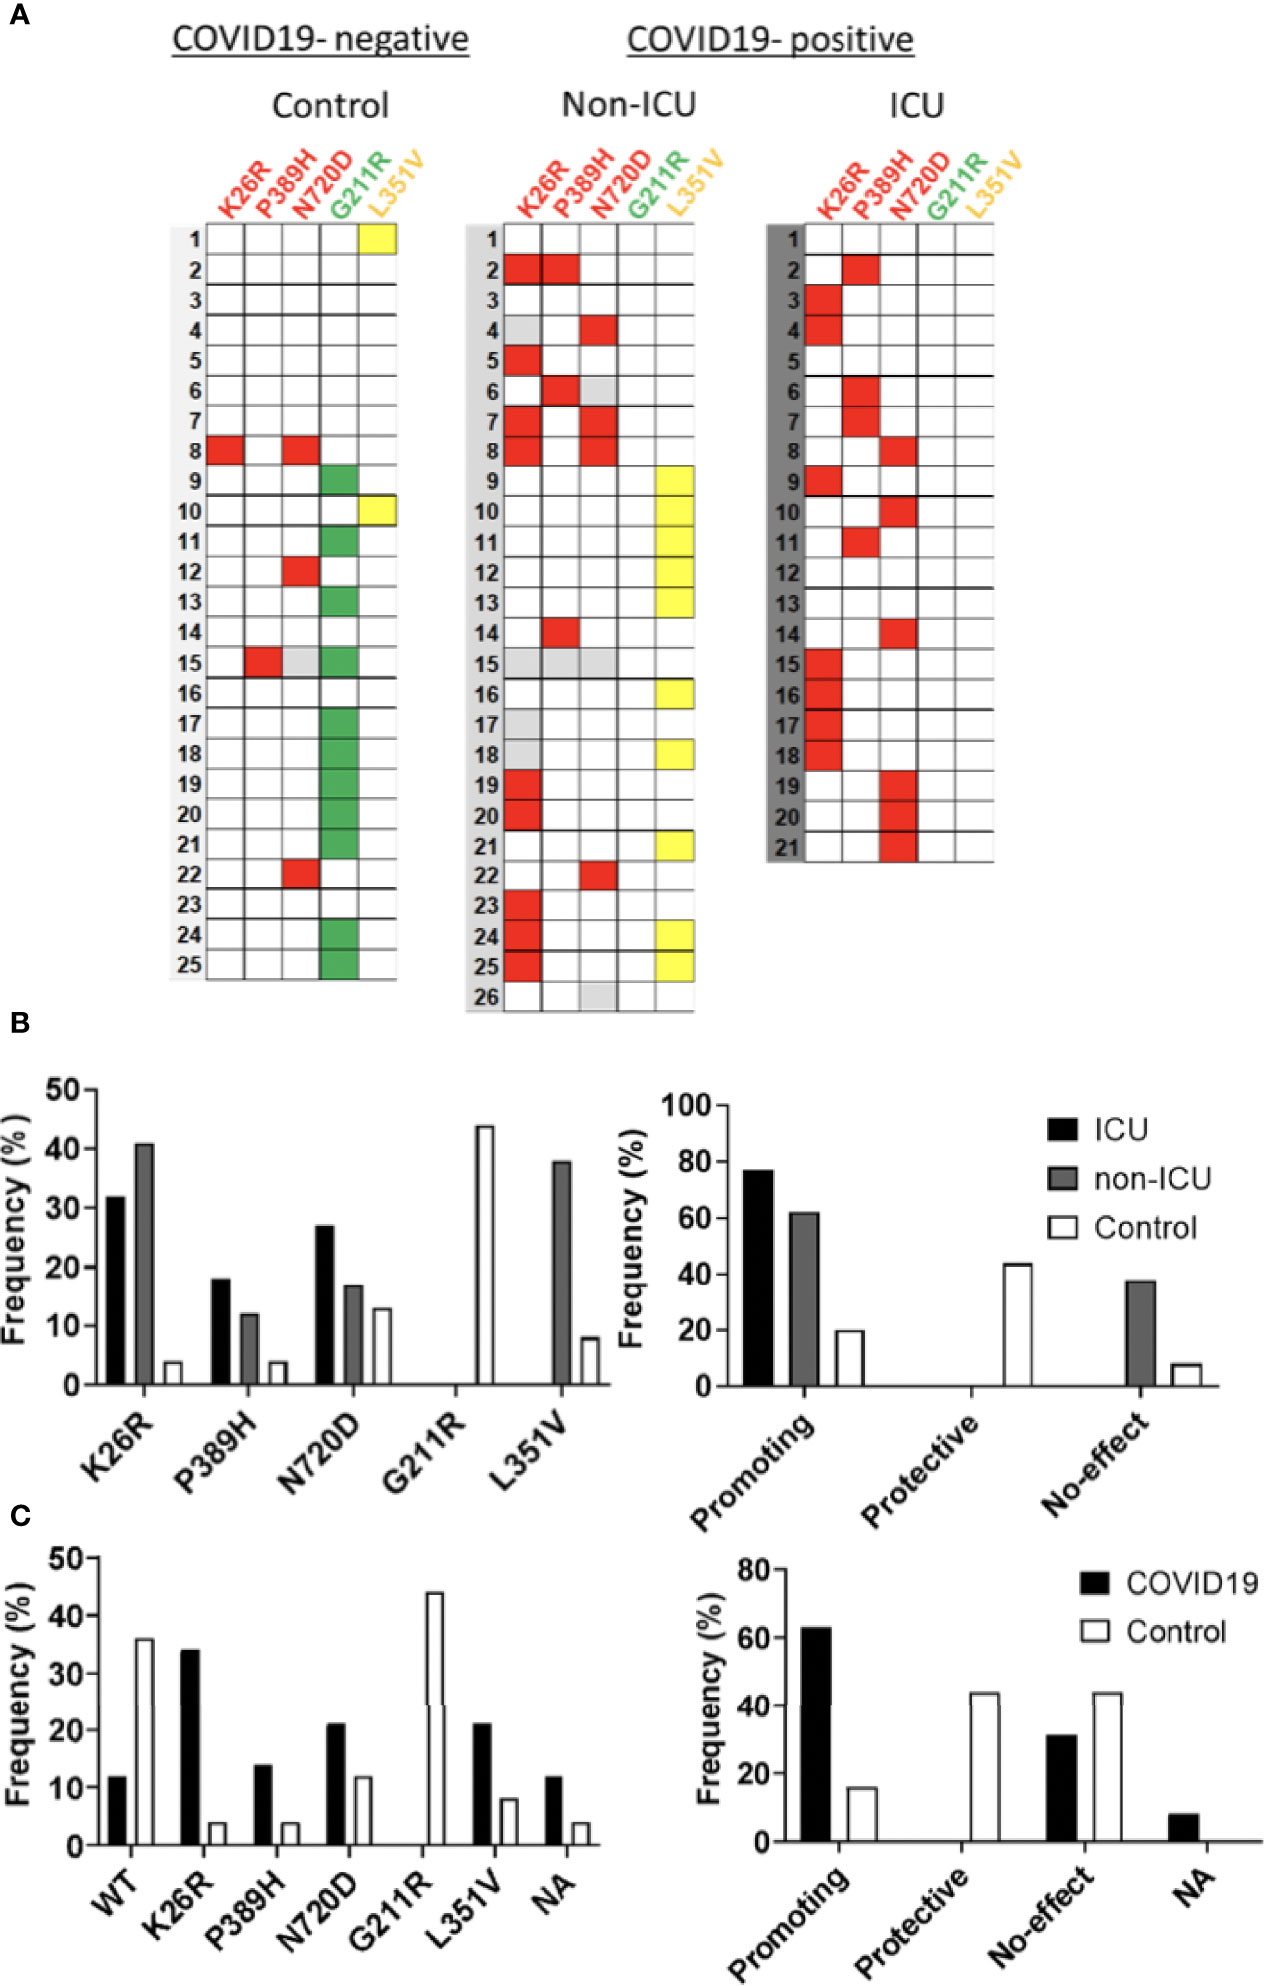
Figure 11 Infection-promoting ACE2 SNPs are a risk factor for COVID19 susceptibility. (A) Heatmap showing the distribution of ACE2 variants in the hospitalization severity groups. Coloured squares indicate de presence of the ACE2 variants. Red: Promoting; Green: Protective; Yellow: No-effect. (B) Frequencies of ACE2 SNPs among hospitalization severity groups. Bars represent frequencies of the SNP in each group (C) Frequencies of ACE2 SNPS among susceptibility groups.
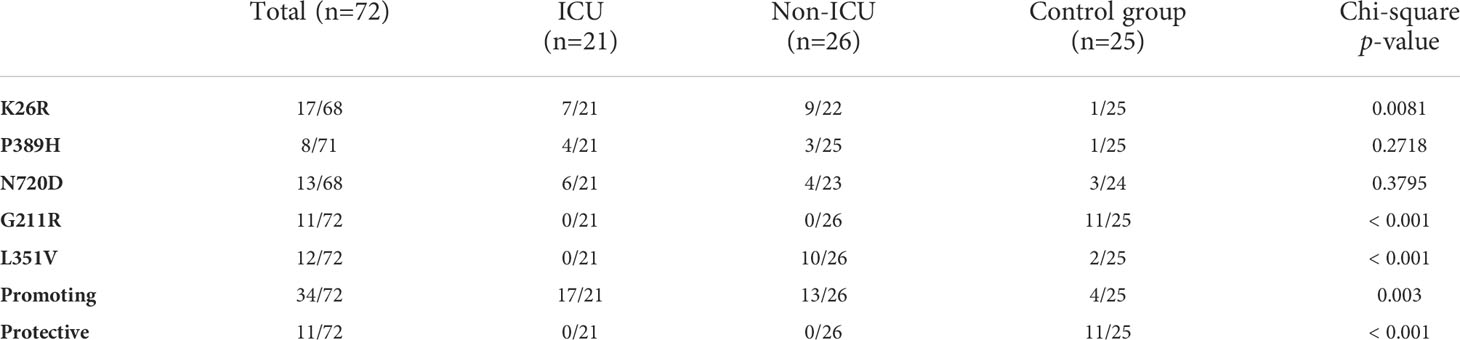
Table 2 ACE2 SNP distribution of the sample population.
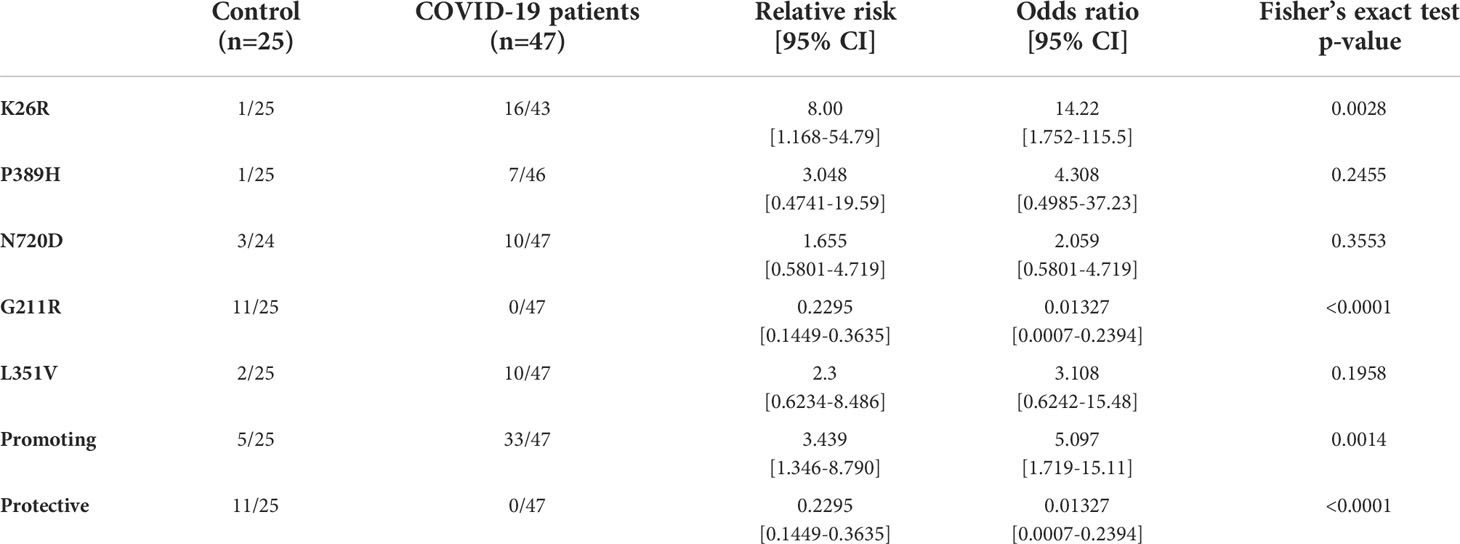
Table 3 Infection-promoting ACE2 polymorphisms are risk factor for COVID19 susceptibility in a 72-patient cohort.
Influence of ACE2 polymorphisms on inflammation markers
We then analyzed whether the different ACE2 polymorphisms may influence the levels of inflammation markers. First, we tested if the presence or absence of the different variants could affect the levels of GDF15 or ACE2. Interestingly, we did not find differences in the circulating protein levels of GDF15 and ACE2 when taken the 72 samples as a whole (Supplementary Figure 3). However, the P389H, G211R, and L351V variants were associated with a decrease in the levels of circulating ACE2 mRNA, while the individuals bearing the N720D variant showed increased levels of circulating ACE2 mRNA (Supplementary Figure 4). Second, we repeated the analysis comparing ICU vs non-ICU group, and we found that the levels of GDF15 and ACE2 were similar in the ICU patients carrying the different mutations compared to the non-ICU group (Figure 12). Then, we decided to repeat the same analysis, but classifying our sample population in 4 genotypes based on the presence or absence of the different variants. Genotype 0 corresponding to subjects that did not carry any variant; Genotype 1, subjects that carry at least one promoting variant; Genotype 2, subjects that carry at least one protective variant; Genotype 3, subjects that carry at least one promoting and one protective variant (Supplementary Table 5; Figure 13). We only found differences in the levels of the ACE2 mRNA (P<0.05).
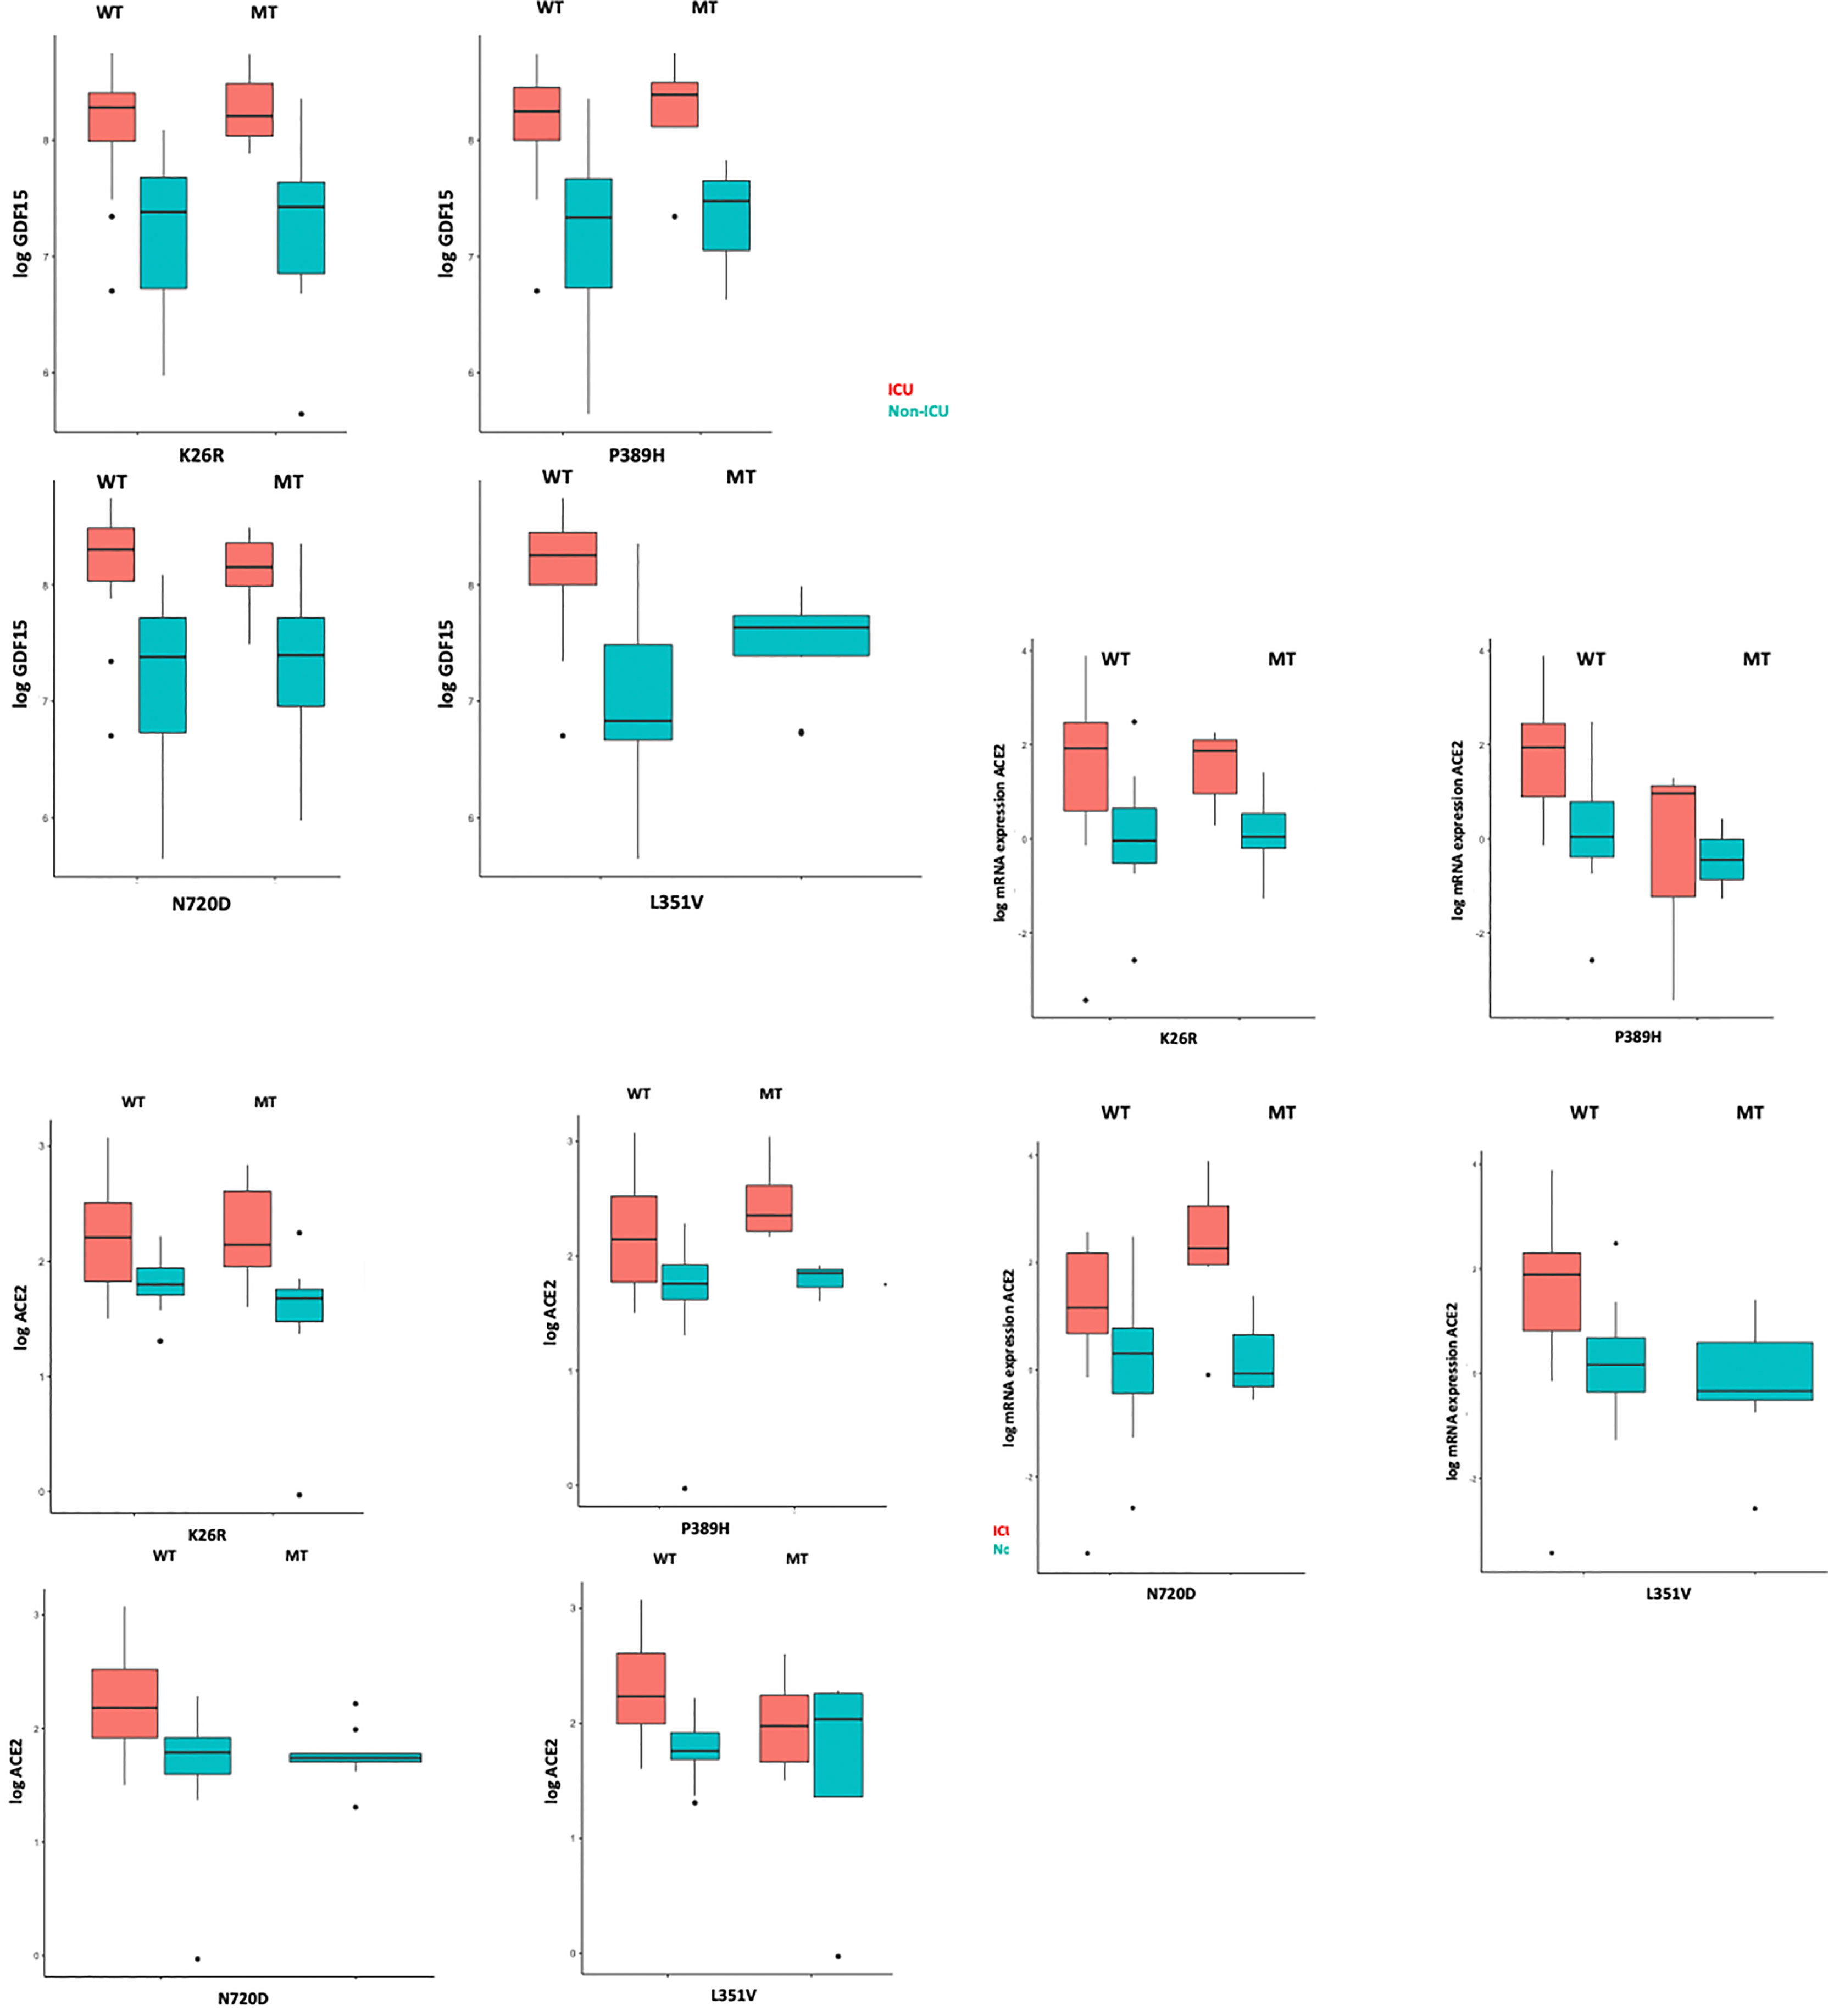
Figure 12 GDF15 and ACE2 levels among ICU and non-ICU COVID-19 patients and ACE2 genotypes.
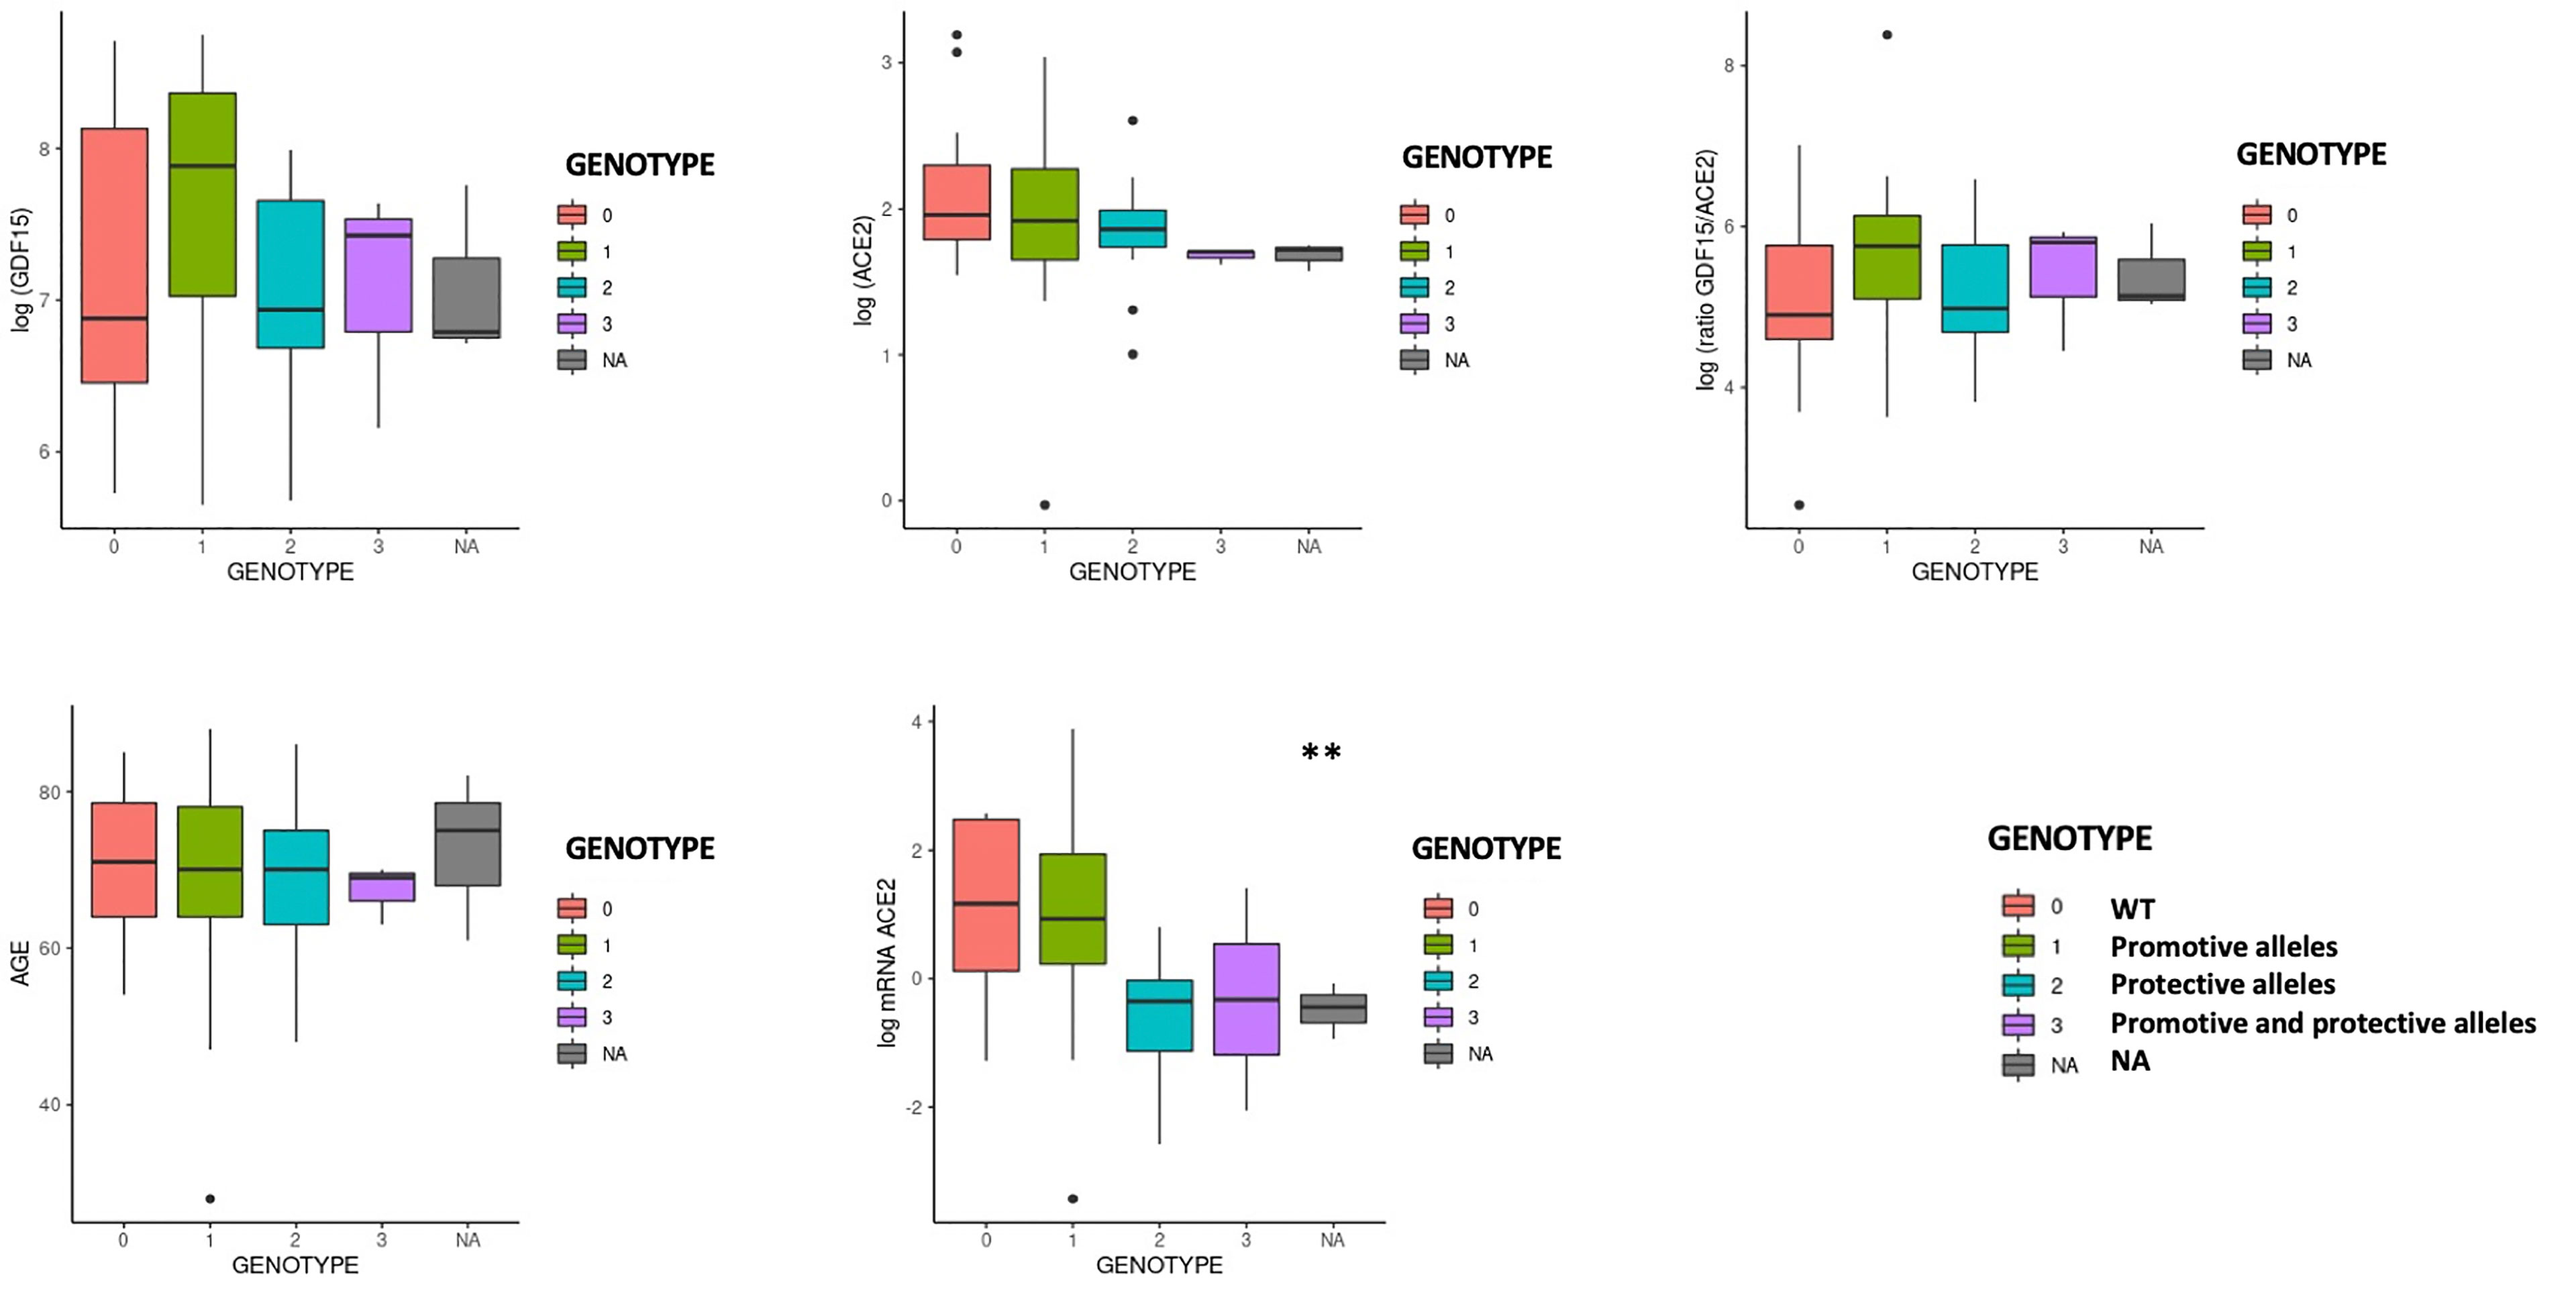
Figure 13 GDF15 and ACE2 levels by protective or promotive genotypes. Genotype 0 corresponding to subjects that did not carry any variant; Genotype 1, subjects that carry at least one promoting variant; Genotype 2, subjects that carry at least one protective variant; Genotype 3, subjects that carry at least one promoting and one protective variant (Supplementary Table 5; Figure 13). We only found differences in the levels of the ACE2 mRNA (P<0.05).
Finally, in linear regression models, adjusting for age, sex, and group (ICU, non-ICU, and Control group) we did not find any association between the ACE2 genotypes with GDF15 and ACE2 levels (Supplementary Table 6) suggesting a separate role of these markers in COVID-19 susceptibility and severity.
Discussion
Despite the fact that the majority of the population is already vaccinated against SARS-CoV-2 and the rate of mortality has been reduced, vaccination is not enough to defeat the virus. COVID-19 infection rate remains high, and treatment of severe cases has become a great challenge. Therefore, early recognition of the sensitivity and severity of COVID-19 is essential for the development of new treatments. In the present study, we measured the levels of circulating GDF15 and ACE2 in plasma of patients with COVID-19 who were admitted to the ICU and died and admitted to the ICU who recovered, as well as in an uninfected matched control group. We also characterized the in vitro effects and frequency of 5 ACE2 SNPs overrepresented in Southern European populations and associated with COVID-19 disease (Benetti et al., 2020; Vadgama et al., 2022).
We found that both circulating GDF15 and ACE2 levels were higher in patients admitted to the ICU who died, compared to those who recovered from the disease and the control group. Our results are consistent with recent studies that have found that increased circulating levels of GDF15 and ACE2 are associated with a poor prognosis in patients with COVID-19 (Notz et al., 2020; Myhre et al., 2020; Luis García de Guadiana et al., 2021; Lundström et al., 2021; van Lier et al., 2021). On the other hand, we also found significant changes in ACE2 gene expression levels in COVID-19 patients compared to uninfected controls, as well as among COVID-19 patients. Previous studies have shown that ACE2 is highly expressed in infected tissues with SARS-CoV-2 compared to normal tissues (Li et al., 2020; Gheware et al., 2022).
It is well established that both the occurrence and severity of COVID-19 increase with age, and the presence of comorbidities such as hypertension, diabetes, obesity, and cardiovascular disease conditions also largely related to the production of GDF15 (Doerstling et al., 2018; Wischhusen et al., 2020). In the present study, and as we expected, we found an association between the GDF15 levels and age while we did not find differences in ACE2 levels with age. Recently, Tanaka et al. characterized the plasma proteomic signature in humans in different age ranges and found that GDF15 had the strongest positive association with age (Tanaka et al., 2018). In addition, GDF15 was found to be one of the proteins in the secretory senescence-associated phenotype (SASP) protein repertoire, indicating the possibility that GDF15 modulates and/or predicts cellular senescence (Ha et al., 2019; Schafer et al., 2020).
Regarding gender, there were no differences in circulating GDF15 nor ACE2 levels in our studied population, although slightly higher levels were observed in men, but not statistically significant. Other studies have shown that ACE2 levels were higher in men than in women (Sama et al., 2020). Regarding the association of ACE2 levels and age, the data available in the literature are limited. AlGhatrif et al. found that ACE2 levels show a curvilinear association with age in healthy people, with a positive association among participants younger than 55 years and a negative association in participants older than 55 (AlGhatrif et al., 2021). A recent study found that ACE2 levels increase with age in patients with acute respiratory failure who required mechanical ventilation (Baker et al., 2021).
Elevated levels of classic inflammatory markers, such as CRP, ferritin, and D-dimer, are associated with a worse prognosis in patients with COVID-19 (Huang I et al., 2020). We found that both, GDF15 and ACE2 levels, were positively correlated with those markers. In COVID-19, possible mechanisms behind systemic clinical findings include dysregulated iron homeostasis, resulting in oxidative stress and an inflammatory response. Dysregulation of iron homeostasis and higher iron levels may support the progression of viral infections (Schmidt, 2020). Also, it seems that GDF15 has a fundamental role in the regulation of iron metabolism through the modulation of hepcidin so that the deregulation of plasma levels of GDF15 could directly affect iron homeostasis (Wang et al., 2017). Our data are consistent with previous studies (van Lier et al., 2021; Teng et al., 2021). Interestingly, both circulating GDF15 and ACE2 were positively correlated with glucose, urea, creatinine, and NT-proBNP. GDF15 has been recently recognized as a metabolic regulator, due to its role in regulating appetite and metabolism and obesity through its receptor (Miyake et al., 2021).
GDF15 is closely related to inflammation. GDF15 is a known marker of mitochondrial dysfunction, and due to its function as hormone-cytokine may play an important role in the regulation of cellular oxygenation and the inflammatory response, all of which are key mechanisms in the pathophysiology of COVID-19. Recently, circulating mtDNA has been proposed as a marker of disease severity and inflammation in COVID-19 (Scozzi et al., 2021). Changes in circulating mtDNA quantity and quality are associated with inflammation, and poorer outcomes in age related diseases, such as insulin resistance, cancer, neurodegenerative conditions, and cardiovascular disease (Gonzalez-Freire et al., 2020; Valdés-Aguayo et al., 2021). Unfortunately, we did not find differences in circulating mtDNA in our population, although COVID-19 patients presented higher levels compared to the uninfected control patients.
GDF15 is upregulated in situations of hypoxia and tissue damage (Ahmed et al., 2022). However, knowledge of its pathophysiological function at the molecular level is still limited and more studies are needed. It has recently been discovered that the α-type glial cell-derived neurotrophic factor family receptor (GFRAL), expressed exclusively in the brain, could be key to the molecular mechanism of GDF15 and its relationship with pathological states (Rochette et al., 2020). A recent study has shown that GDF15 can promote human rhinovirus-associated lung inflammation in mice, leading to severe respiratory viral infections (Wu et al., 2018). In contrast, GDF15 has also been proposed as a central mediator of tissue tolerance induced by inflammation, by protecting against bacterial and viral infections, as well as sepsis, in mouse models (Luan et al., 2019).
ACE2 is a membrane-bound enzyme and therefore measurement of circulating levels of ACE2 is complex. ACE2 is cleaved from the plasma membrane through ADAM17-mediated regulated removal (Bartolomé et al., 2021). Therefore, elevated plasma ACE2 levels could also result from increased lysis of ACE2-expressing cells as a consequence of more severe COVID-19 infection (Kragstrup et al., 2021). Contrary to what we expected, we found no association between the levels of GDF15 and the levels of ACE2 in plasma. However, a previous study GDF15 levels were positively associated with ACE2 levels in patients with atrial fibrillation (Wallentin et al., 2020).
Based on the all the above, we believe that both GDF15 and ACE2 could provide valuable information on the pathophysiology of COVID-19. More studies are needed to elucidate the role that these biomarkers play in the progression of SARS-CoV-2 infection.
Host genetics is known to play an important role in susceptibility to other viral infectious diseases, including SARS-CoV, HIV and influenza (Wang et al., 2019). Previous studies like the one leaded by “The COVID19 Host Genetics Initiative” (Niemi et al., 2021) support the notion that some genetic variants, most notably at the ABO and PPP1R15A loci, in addition to SLC6A20 have a direct effect on susceptibility to infection rather than COVID19 severity. In contrast, variants at DPP9, FOXP4 or TYK2 loci with reported effects on several autoimmune-related diseases (Kichaev et al., 2019) or inflammatory-related loci (e.g. CXCR6, LZTFL1, IFNAR2 and OAS1/OAS2/OAS3 loci) and specially the 3p21.31 locus have been described to have an huge impact on COVID19 severity (Niemi et al., 2021).
The most well-known and evaluated mechanism of SARS-CoV-2 infection is the binding and uptake of viral particles through ACE2 receptor, a type 1 integral membrane glycoprotein (Zamorano Cuervo and Grandvaux, 2020). Based on the premise that a predisposing genetic background may contribute to the wide clinical variability of COVID-19, we set out to investigate whether variations in ACE2 might modulate susceptibility to SARS-CoV-2 and influence severity. We queried multiple genomic databases comprising the main sources of aggregated data for ACE2 protein altering variations in populations groups across the world to considered non-synonymous allele variants with high allelic frequency (>1.00.e-4) and allele count >20. Then we selected variants within the human ACE2-claw S-protein RBD-binding interface as described in previous studies (Hussain et al., 2020; Suryamohan et al., 2021) that could potentially increase or decrease the binding affinity of ACE2 to the S-protein and thereby alter the ability of the virus to infect the host cell. Then, we considered the ACE2 variants previously described potentially predisposing genetic background to the observed individual clinical variability (Benetti et al., 2020; Vadgama et al., 2022). Finally, five ACE2 variants fulfilled this triple requirement. Notably, these variants have not been reported in the Asian population and are rare in non-South European populations (Benetti et al., 2020; Vadgama et al., 2022). Given their rarity in other populations, we cannot exclude that these variants can partially account for the clinical outcome observed in the Spanish population (Benetti et al., 2020). Using a pseudovirus infection approach similar to the previously reported (Letko et al., 2020; Ou et al., 2020) we recapitulated airway infection in human alveolar lung A549 cells. This cell line does not express detectable levels of ACE2, thus being an excellent model to test the effects of ectopic ACE2 containing particular SNPs. With this approach, we found that variants K26R, P389H and N720D promoted a significant increase in infection while G211R diminished the infection being potentially protective. Variant N720D lies in a residue located close to the cleavage sequence of TMPRSS2, likely affecting the cleavage dependent virion intake (Suryamohan et al., 2021). Variant K26R was previously reported to increase affinity for S-protein by biochemical assays (Suryamohan et al., 2021) while G211R was predicted in silico to affect S-protein and ACE2 interaction (Benetti et al., 2020). In our model, variant L351V showed no significant difference in infection in contrast to the previous results by crystal structure (Benetti et al., 2020).
We also studied the presence of the 5 specific SNPs in ACE2 coding regions using human plasma circulating mRNA. Transcription of ACE2 produces different mRNA transcript variants responsible for translation into different protein isoforms (Harmer et al., 2002; Nikiforuk et al., 2021) that could be regulated by COVID-19 infection in a cytokine-specific manner (Albini et al., 2021). Therefore, we reasoned that patient genotyping from mRNA could better reflect the ACE2 variants expressed in those patients. In fact, previous studies have shown that SNPs could be detected with high precision in transcriptome sequencing approaches as compared to DNA-seq procedures (Deelen et al., 2015; Jehl et al., 2021). This has led to the emergence of transcriptome or RNA sequencing as a potential alternative approach to variant detection within protein coding regions, since the transcriptome of a given tissue represents a quasi-complete set of transcribed genes (mRNAs) and other noncoding RNAs which also bypasses the need for exome enrichment (Ku et al., 2012; Lopera Maya et al., 2020). Using this approach, we identified the presence of the 5 shortlisted SNPs involved in vitro in a differential susceptibility in the 72-patient cohort. Notably, infection-promoting variants K26R, P389H and N720D were a risk factor for Severe COVID-19 Hospitalized groups as compared to wild-type ACE2. Conversely, infection inhibiting variant G211R showed a protective effect as compared to wild-type ACE2. Interestingly G211R exhibited a gender bias, being significantly enriched in women. This is in agreement with the gender effect in COVID-19 susceptibility showed by others (Yildirim et al., 2021; Vadgama et al., 2022).
Our data suggest that ACE2 SNPs could stratify patients according to infection susceptibility in complete agreement with our pseudoviral infection model. Therefore, it is plausible to think that the effect of allelic variability on ACE2 conformation would at least partially account for the interindividual clinical differences and likely modulate clinical susceptibility. This finding reinforces the hypothesis that at least some of the identified variants or the cumulative effect of few of them could confer a different susceptibility to virus cell entry and consequently to disease onset. This fundamental knowledge paves the way to perform a precision medicine screening -e.g. by blood sample genotyping of ACE2 variants- in order to identify COVID19 infection susceptibility groups. Host genomic information like this may facilitate stratification and targeting of care and vaccination, and enable the identification of people who may be at higher risk of harm. Genetic information might also enable targeting therapeutic interventions to those more likely to develop severe illness or protecting them from adverse reactions. Information from those less susceptible to infection with SARS-CoV-2 may be valuable in identifying potential therapies (Milne, 2020).
Our study has limitations. First the study population is small, including patients from Hospital Son Llatzer and Hospital Son Espases, two of the main hospitals in the Balearic Health System. There might be a selection bias when identifying factors that differ between patients with COVID-19, although COVID-19 patients were matched for age and sex as well with the control group. Second, we did not include a control uninfected ICU group which could have strengthen our findings. Third, it is a retrospective study conducted in an emergency situation, and in which not all the clinical characteristics of the patients were recorded. Third, some patients had elevated biomarker data in some laboratory measurements, as well as in GDF15 and ACE2 levels, and we did not exclude them from the analysis due to small sample size and because those numbers were physiological and not due to technical errors. Finally, the study is cross-sectional and no causal inferences can be made. Despite the limitations, our study provides convincing evidence that in patients with COVID-19, the levels of GDF15 and ACE2 could be associated with increased inflammation and disease severity while ACE2 missense SNPs might be linked to infection susceptibility.
In conclusion, critically ill patients with COVID-19 present higher levels of GDF15 and ACE2, as well as acute inflammation. These two proteins might be of importance because of its association with disease severity in patients infected with SARS-CoV-2. Our results suggest that certain genetic variations in ACE2 might modulate susceptibility to SARS-CoV-2 infection and influence severity. More studies are needed to elucidate the role of GDF15 and ACE2 in COVID-19.
Data Availability Statement
The original contributions presented in the study are included in the article/supplementary material, further inquiries can be directed to the corresponding author/s.
Ethics Statement
The studies involving human participants were reviewed and approved by ethics committee of the Balearic Islands. The ethics committee waived the requirement of written informed consent for participation.
Author Contributions
Conceptualization and methodology, MG-F and CB; MT-M, CP-R, NT-F, LI-G, AG-P, CNE, and CB performed experiments, analyzed the data and wrote—original draft preparation; LS, AS-P, JP-L, CC, and LM collected and contributed data. Writing—review and editing, MG-F, CB, MT-M, CMPR, ASP, and LM; supervision, MGF and CB; Project administration and funding acquisition, MG-F and CB. All authors have read and agreed to the published version of the manuscript. MT-M and CMPR share co-first authorship; MG-F and CB are the co-corresponding authors. All authors contributed to the article and approved the submitted version.
Funding
This research was supported by the Miguel Servet program (MS19/00201 and MS19/00100) (MG-F and CB), Instituto de Salud Carlos III (ISCIII), Madrid; Fondo extraordinario COVID —ISCIII (COV20/00571) (CB); Fundació LaMaratóTV3 (167-C-2021 51); the Margalida Comas Program (PD/050/2020), Comunidad Autonoma de las Islas Baleares (MT-M); the FOLIUM fellowship program (FOLIUM 19/01), Impost turisme sostenible/Govern de les Illes Balears (AP-G and CPR); the TECH fellowship program, Impost turisme sostenible/Govern de les Illes Balears (TECH19/03) (LI-G). And the LIBERI 2022 program.
Conflict of Interest
The authors declare that the research was conducted in the absence of any commercial or financial relationships that could be construed as a potential conflict of interest.
Publisher’s Note
All claims expressed in this article are solely those of the authors and do not necessarily represent those of their affiliated organizations, or those of the publisher, the editors and the reviewers. Any product that may be evaluated in this article, or claim that may be made by its manufacturer, is not guaranteed or endorsed by the publisher.
Acknowledgments
We would like to thank Dr Gabriel Bretones and Prof Carlos López-Otín (Universidad de Oviedo, Spain) for kindly providing psPAX2 pLV-mCherry vectors and protocol for pseudovirus production. We thank Dr Thomas Peacock and Prof Wendy Barclay (Imperial College London, UK) for kindly providing SARS-CoV-2 VOC vectors. We thank Victoria Elizabeth Cano Garcia, from the HUSE Biobank, for providing the patient samples and demographic characteristics.
Supplementary Material
The Supplementary Material for this article can be found online at: https://www.frontiersin.org/articles/10.3389/fcimb.2022.942951/full#supplementary-material
Supplementary Table 1 | Primer sequences and annealing temperatures.
Supplementary Table 2 | Primer sequences and annealing temperatures for assessment of mtDNA oxidation.
Supplementary Table 3 | Clinical and Biochemical Characteristics of non-ICU group
Supplementary Table 4 | Correlation coefficient between GDF15, ACE2 and changes on biochemical parameters among non-ICU COVID19 patients.
Supplementary Table 5 | ACE2 genotypes frequency among the study population.
Supplementary Table 6 | Association between ACE2 genotypes with circulating levels of GDF15 and ACE2
Supplementary Figure 1 | ACE2 polymorphisms exhibit similar fashion when expressed in A549 cells. A549 cells were transfected with either GFP-ACE2 WT, GFP-ACE2 polymorphisms or GFP alone. Then, ACE2 protein expression was analyzed by A) Western Blot with MA5-32307 antibody B) Immunocytochemistry (red) with either MA5-32307 antibody (left panel) or MAB933 antibody (right panel). Nuclei was stained with DAPI (blue). Transfected cells contain GFP (green). CT: secondary antibody control to detect unspecific binding. Images were acquired with Cell Observer-Zeiss. Scale bar: 50 μm
Supplementary Figure 2 | ACE2 missense SNPs genotyping. cDNA was obtained by RT-PCR from circulating mRNA of the patients. Then, PCR1, PCR2 and PCR3 were performed in order to amplify the regions comprising the studied SNPs. PCR products were sequenced and aligned against reference ACE2 (NM_021804). PCR1: residues from Ser3 to Met249 (743 bp), PCR2: residues Phe308 to Arg621 (944 bp), PCR3: residues from Val670 to Val752 (250 bp) A) Agarose gel electrophoresis with the PCR products of several patients was performed to confirm specificity. B) Representative image of the alignment of the sequenced (forward and reverse) PCR products against reference ACE2 using SnapGene® Software. In particular, the image corresponds to the PCR2 of the non-ICU patient 10 that presents the L351V variant.
Supplementary Figure 3 | Frequency distribution of ACE2 genotypes by sex. (A) ‘promoting’ alleles; (B) ‘Protective’ alleles: (C) ‘WT’ alleles.
Supplementary Figure 4 | GDF15 and ACE2 levels across ACE2 variants.
References
Adela, R., Banerjee, S. K. (2015). GDF-15 as a target and biomarker for diabetes and cardiovascular diseases: a translational prospective. J. Diabetes Res. 2015, 490842. doi: 10.1155/2015/490842
Ahmed, D. S., Isnard, S., Berini, C., Lin, J., Routy, J. P., Royston, L.. (2022). Coping with stress: the mitokine GDF-15 as a biomarker of COVID-19 severity. Front. Immunol. 13, 820350. doi: 10.3389/fimmu.2022.820350
Albini, A., Calabrone, L., Carlini, V., Benedetto, N., Lombardo, M., Bruno, A., et al. (2021). Preliminary evidence for IL-10-Induced ACE2 mRNA expression in lung-derived and endothelial cells: implications for SARS-Cov-2 ARDS pathogenesis. Front. Immunol. 12, 718136. doi: 10.3389/fimmu.2021.718136
AlGhatrif, M., Tanaka, T., Moore, A. Z., Bandinelli, S., Lakatta, E. G., Ferrucci, L.. (2021). Age-associated difference in circulating ACE2, the gateway for SARS-COV-2, in humans: results from the InCHIANTI study. GeroScience 43 (2), 619–627. doi: 10.1007/s11357-020-00314-w
Baker, S. A., Kwok, S., Berry, G. J., Montine, TJ. (2021). Angiotensin-converting enzyme 2 (ACE2) expression increases with age in patients requiring mechanical ventilation. PLoS One 16 (2), e0247060. doi: 10.1371/journal.pone.0247060
Bartolomé, A., Liang, J., Wang, P., Ho, D. D., Pajvani, U. B. (2021). Angiotensin converting enzyme 2 is a novel target of the γ-secretase complex. Sci. Rep. 11 (1), 9803. doi: 10.1038/s41598-021-89379-x
Benetti, E., Tita, R., Spiga, O., Ciolfi, A., Birolo, G., Bruselles, A., et al. (2020). ACE2 gene variants may underlie interindividual variability and susceptibility to COVID-19 in the Italian population. Eur. J. Hum. Genet. 28 (11), 1602–1614. doi: 10.1038/s41431-020-0691-z
Chen, N., Zhou, M., Dong, X., Qu, J., Gong, F., Han, Y., et al. (2020). Epidemiological and clinical characteristics of 99 cases of 2019 novel coronavirus pneumonia in wuhan, China: a descriptive study. Lancet 395 (10223), 507–513. doi: 10.1016/S0140-6736(20)30211-7
Consortium GER (2019). 100,000 Genomes project the national genomics research and healthcare knowledgebase amendment to the 100,000 genomes project protocol v4. Available at:genomicsengland.co.uk (Accessed May 4, 2022).
Cordani, M., Butera, G., Dando, I., Torrens-Mas, M., Butturini, E., Pacchiana, R., et al. (2018). Mutant p53 blocks SESN1/AMPK/PGC-1α/UCP2 axis increasing mitochondrial O2-· production in cancer cells. Br. J. Cancer, 1–15. doi: 10.1038/s41416-018-0288-2
Coronaviridae Study Group of the International Committee on Taxonomy of Viruses (2020). The species severe acute respiratory syndrome-related coronavirus: classifying 2019-nCoV and naming it SARS-CoV-2. Nat. Microbiol. 5 (4), 536–544. doi: 10.1038/s41564-020-0695-z
Deelen, P., Zhernakova, D. V., de Haan, M., van der Sijde, M., Bonder, M. J., Karjalainen, J, et al. (2015). Calling genotypes from public RNA-sequencing data enables identification of genetic variants that affect gene-expression levels. Genome Med. 7 (1):30. doi: 10.1186/S13073-015-0152-4
de la Rica, R., Borges, M., Gonzalez-Freire, M. (2020). COVID-19: in the eye of the cytokine storm. Front. Immunol. 11, 2313.
de la Rica, R., Borges, M., Aranda, M., Del Castillo, A., Socias, A., Payeras, A., et al. (2020). Low albumin levels are associated with poorer outcomes in a case series of COVID-19 patients in spain: a retrospective cohort study. Microorganisms 8 (8), 1106. doi: 10.3390/microorganisms8081106
Doerstling, S., Hedberg, P., Öhrvik, J., Leppert, J, Henriksen, E. (2018). Growth differentiation factor 15 in a community-based sample: age-dependent reference limits and prognostic impact. Ups J. Med. Sci. 123 (2), 86. doi: 10.1080/03009734.2018.1460427
Gheware, A., Ray, A., Rana, D., Bajpai, P, Nambirajan, A, Arulselvi, S., et al. (2022). ACE2 protein expression in lung tissues of severe COVID-19 infection. Sci. Rep. 12 (1), 4058. doi: 10.1038/s41598-022-07918-6
Gonzalez-Freire, M., Moore, A. Z, Peterson, C. A, Kosmac, K., McDermott, M. M., Sufit, RL, et al. (2020). Associations of peripheral artery disease with calf skeletal muscle mitochondrial dna heteroplasmy. J. Am. Heart Assoc. 9 (7), e015197. doi: 10.1161/JAHA.119.015197
Guan, W. J., Ni, Z. Y, Hu, Y., Liang, W. H., Ou, C. Q., He, JX, et al. (2020). Clinical characteristics of coronavirus disease 2019 in China. N. Engl. J. Med. 382 (18), 1708–1720. doi: 10.1056/NEJMoa2002032
Ha, G., De Torres, F., Arouche, N., Benzoubir, N., Ferratge, S., Hatem, E., et al. (2019). GDF15 secreted by senescent endothelial cells improves vascular progenitor cell functions. PLoS One 14 (5), e0216602. doi: 10.1371/journal.pone.0216602
Harmer, D., Gilbert, M., Borman, R., Clark, K. L. (2002). Quantitative mRNA expression profiling of ACE 2, a novel homologue of angiotensin converting enzyme. FEBS Lett. 532 (1–2), 107–110. doi: 10.1016/S0014-5793(02)03640-2
Huang, C., Wang, Y., Li, X., Ren, L., Zhao, J, Hu, Y., et al. (2020). Clinical features of patients infected with 2019 novel coronavirus in wuhan, China. Lancet 395 (10223), 497–506. doi: 10.1016/S0140-6736(20)30183-5
Huang, I., Pranata, R., Lim, M. A., Oehadian, A, Alisjahbana, B. (2020). C-reactive protein, procalcitonin, d-dimer, and ferritin in severe coronavirus disease-2019: a meta-analysis. Ther. Adv. Respir. Dis. 14, 1753466620937175. doi: 10.1177/1753466620937175
Hussain, M., Jabeen, N., Raza, F., Shabbir, S, Baig, A. A., Amanullah, A., et al. (2020). Structural variations in human ACE2 may influence its binding with SARS-CoV-2 spike protein. J. Med. Virol. 92 (9), 1580–1586. doi: 10.1002/jmv.25832
Ikram, M. A., Jabeen, N., Raza, F., Shabbir, S., Baig, A. A., Amanullah, A, et al. (2017). The Rotterdam study: 2018 update on objectives, design and main results. Eur. J. Epidemiol 32 (9), 807–850. doi: 10.1007/s10654-017-0321-4
Inde, Z., Croker, B. A., Yapp, C., Joshi, G. N., Spetz, J., Fraser, C., et al. (2021). Age-dependent regulation of SARS-CoV-2 cell entry genes and cell death programs correlates with COVID-19 severity. Sci. Adv. 7 (34):eabf8609. doi: 10.1126/SCIADV.ABF8609
Jehl, F., Degalez, F., Bernard, M., Lecerf, F., Lagoutte, L., Désert, C., et al. (2021). RNA-Seq data for reliable SNP detection and genotype calling: interest for coding variant characterization and cis-regulation analysis by allele-specific expression in livestock species. Front. Genet. 12, 655707. doi: 10.3389/fgene.2021.655707
Joglekar, M. V., Satoor, S. N., Wong, W. K. M., Cheng, F, Ma, RCW, Hardikar, AA. (2020). An optimised step-by-step protocol for measuring relative telomere length. Methods Protoc. 3 (2), 27. doi: 10.3390/mps3020027
Karczewski, K. J., Francioli, L. C., Tiao, G., Cummings, B. B., Alföldi, J., Wang, Q., et al. (2020). The mutational constraint spectrum quantified from variation in 141,456 humans. Nature 581 (7809), 434–443. doi: 10.1038/s41586-020-2308-7
Kichaev, G., Bhatia, G., Loh, P. R., Gazal, S., Burch, K., Freund, M. K., et al. (2019). Leveraging polygenic functional enrichment to improve GWAS power. Am. J. Hum. Genet. 104 (1), 65–75. doi: 10.1016/j.ajhg.2018.11.008
Kragstrup, T. W., Singh, H. S., Grundberg, I., Nielsen, A. L., Rivellese, F., Mehta, A, et al. (2021). Plasma ACE2 predicts outcome of COVID-19 in hospitalized patients. PLoS One 16 (6), e0252799. doi: 10.1371/journal.pone.0252799
Ku, C. S., Wu, M., Cooper, D. N , Naidoo, N., Pawitan, Y., Pang, B., et al. (2012). Exome versus transcriptome sequencing in identifying coding region variants. Expert Rev. Mol. Diagn. 12 (3), 241–251. doi: 10.1586/erm.12.10
Letko, M., Marzi, A., Munster, V. (2020). Functional assessment of cell entry and receptor usage for SARS-CoV-2 and other lineage b betacoronaviruses. Nat. Microbiol. 5 (4), 562–569. doi: 10.1038/s41564-020-0688-y
Li, M. Y., Li, L, Zhang, Y, Wang, X. S. (2020). Expression of the SARS-CoV-2 cell receptor gene ACE2 in a wide variety of human tissues. Infect. Dis. Poverty 9 (1), 45. doi: 10.1186/s40249-020-00662-x
Lopera Maya, E. A., an der Graaf, A., Lanting, P., van der Geest, M., Fu, J, Swertz, M, et al. (2020). Lack of association between genetic variants at ACE2 and TMPRSS2 genes involved in SARS-CoV-2 infection and human quantitative phenotypes. Front. Genet. 11, 613. doi: 10.3389/fgene.2020.00613
Luan, H. H., Wang, A., Hilliard, B. K., Carvalho, F., Rosen, C. E., Ahasic, A. M, et al. (2019). GDF15 is an inflammation-induced central mediator of tissue tolerance. Cell 178 (5), 1231–1244.e11. doi: 10.1016/j.cell.2019.07.033
García de Guadiana Romualdo, L., Mulero, M. D. R., Olivo, M. H., Rojas, C. R., Arenas, V. R., Morales, M. G., et al. (2021). Circulating levels of GDF-15 and calprotectin for prediction of in-hospital mortality in COVID-19 patients: a case series. J. Infect. 82 (2), e40–e42. doi: 10.1016/j.jinf.2020.08.010
Lundström, A., Ziegler, L., Havervall, S., Rudberg, A. S., von Meijenfeldt, F., Lisman, T., et al. (2021). Soluble angiotensin-converting enzyme 2 is transiently elevated in COVID-19 and correlates with specific inflammatory and endothelial markers. J. Med. Virol. 93 (10), 5908–5916. doi: 10.1002/jmv.27144
Malik, P., Patel, U., Mehta, D., Patel, N., Kelkar, R., Akrmah, M., et al. (2021). Biomarkers and outcomes of COVID-19 hospitalisations: systematic review and meta-analysis. BMJ Evidence-Based Med. 26 (3), 107–108. doi: 10.1136/bmjebm-2020-111536
Milne, R. (2020). Societal considerations in host genome testing for COVID-19. Genet. Med. 22 (9), 1464–1466. doi: 10.1038/s41436-020-0861-y
Miyake, M., Zhang, J., Yasue, A., Hisanaga, S., Tsugawa, K, Sakaue, H. , et al. (2021). Integrated stress response regulates GDF15 secretion from adipocytes, preferentially suppresses appetite for a high-fat diet and improves obesity. iScience 24 (12), 103448. doi: 10.1016/j.isci.2021.103448
Myhre, P. L., Prebensen, C., Strand, H., Røysland, R., Jonassen, CM, Rangberg, A., et al. (2020). Growth differentiation factor 15 provides prognostic information superior to established cardiovascular and inflammatory biomarkers in unselected patients hospitalized with COVID-19. Circulation 142 (22), 2128–2137. doi: 10.1161/CIRCULATIONAHA.120.050360
Narula, S., Yusuf, S., Chong, M., Ramasundarahettige, C., Rangarajan, S., Bangdiwala, SI, et al. (2020). Plasma ACE2 and risk of death or cardiometabolic diseases: a case-cohort analysis. Lancet (London England) 396 (10256), 968–976. doi: 10.1016/S0140-6736(20)31964-4
Niemi, M. E. K., Karjalainen, J., Liao, R. G., Neale, B., Daly, M., Ganna, A., et al. (2021). Mapping the human genetic architecture of COVID-19. Nature 600 (7889), 472–477 doi: 10.1038/s41586-021-03767-x.
Nikiforuk, A. M., Kuchinski, K. S., Twa, D. D. W., Lukac, C. D., Sbihi, H, Basham, C. A., et al. (2021). The contrasting role of nasopharyngeal angiotensin converting enzyme 2 (ACE2) transcription in SARS-CoV-2 infection: A Cross-Sectional Study of People Tested for COVID-19 in British Columbia, Canada. EBioMedicine 66, 103316. doi: 10.1016/j.ebiom.2021.103316
Notz, Q., Schmalzing, M., Wedekink, F., Schlesinger, T., Gernert, M, Herrmann, J., et al. (2020). Pro- and anti-inflammatory responses in severe COVID-19-induced acute respiratory distress syndrome–an observational pilot study. Front. Immunol. 11, 581338. doi: 10.3389/fimmu.2020.581338
Novelli, A., Biancolella, M., Borgiani, P., Cocciadiferro, D., Colona, V. L., D'Apice, M. R., et al. (2020). Analysis of ACE2 genetic variants in 131 Italian SARS-CoV-2-positive patients. Hum. Genomics 14 (1), 29. doi: 10.1186/s40246-020-00279-z.
Ou, X., Liu, Y., Lei, X., Li, P., Mi, D., Ren, L., et al. (2020). Characterization of spike glycoprotein of SARS-CoV-2 on virus entry and its immune cross-reactivity with SARS-CoV. Nat. Commun. 11 (1), 620. doi: 10.1038/s41467-020-15562-9
Pinto, B. G. G., Oliveira, A. E. R., Singh, Y., Jimenez, L., Gonçalves, A. N. A, Ogava, R. L. T., et al. (2020). ACE2 expression is increased in the lungs of patients with comorbidities associated with severe COVID-19. J. Infect. Dis. 222 (4), 556–563. doi: 10.1093/infdis/jiaa332
Ramanathan, M., Ferguson, I. D., Miao, W., Khavari, P. A. (2021). SARS-CoV-2 B.1.1.7 and B.1.351 spike variants bind human ACE2 with increased affinity. Lancet Infect. Dis. 21 (8), 1070. doi: 10.1101/2021.02.22.432359
Rochette, L., Zeller, M., Cottin, Y., Vergely, C. (2020). Insights into mechanisms of GDF15 and receptor GFRAL: therapeutic targets. Trends Endocrinol. Metab. 31 (12), 939–951. doi: 10.1016/j.tem.2020.10.004
Sama, I. E., Ravera, A., Santema, B. T., van Goor, H, Ter Maaten, JM, Cleland, J. G. F., et al. (2020). Circulating plasma concentrations of angiotensin-converting enzyme 2 in men and women with heart failure and effects of renin–angiotensin–aldosterone inhibitors. Eur. Heart J. 41 (19), 1810–1817. doi: 10.1093/eurheartj/ehaa373
Sanyaolu, A., Okorie, C., Marinkovic, A., Patidar, R., Younis, K., Desai, P., et al. (2020). Comorbidity and its impact on patients with COVID-19. SN Compr. Clin. Med. 2 (8), 1069–1076. doi: 10.1007/s42399-020-00363-4
Schafer, M. J., Zhang, X., Kumar, A., Atkinson, E. J., Zhu, Y., Jachim, S., et al. (2020). The senescence-associated secretome as an indicator of age and medical risk. JCI Insight 5 (12), e133668. doi: 10.1172/jci.insight.133668
Schmidt, S. M. (2020). The role of iron in viral infections. Front. Biosci. - Landmark 25 (5), 893–911. doi: 10.2741/4839
Scozzi, D., Cano, M., Ma, L., Zhou, D., Zhu, J. H., O'Halloran, J. A., et al. (2021). Circulating mitochondrial DNA is an early indicator of severe illness and mortality from COVID-19. JCI Insight 6 (4):e143299. doi: 10.1172/jci.insight.143299
Sungnak, W., Huang, N., Bécavin, C, Berg, M., Queen, R., Litvinukova, M., Talavera-López, C., et al. (2020). SARS-CoV-2 entry factors are highly expressed in nasal epithelial cells together with innate immune genes. Nat. Med. 26 (5), 681–687. doi: 10.1038/s41591-020-0868-6
Suryamohan, K., Diwanji, D., Stawiski, E. W., Gupta, R., Miersch, S., Liu, J., Chen, C., et al. (2021). Human ACE2 receptor polymorphisms and altered susceptibility to SARS-CoV-2. Commun. Biol. 4 (1), 475. doi: 10.1038/s42003-021-02030-3
Tanaka, T., Biancotto, A., Moaddel, R., Moore, A. Z., Gonzalez-Freire, M., Aon, M. A., et al. (2018). Plasma proteomic signature of age in healthy humans. Aging Cell 17 (5), 1–13. doi: 10.1111/acel.12799
Teng, X., Zhang, J., Shi, Y., Liu, Y., Yang, Y., He, J., et al. (2021). Comprehensive profiling of inflammatory factors revealed that growth differentiation factor-15 is an indicator of disease severity in COVID-19 patients. Front. Immunol. 12, 662465. doi: 10.3389/fimmu.2021.662465
Vadgama, N., Kreymerman, A., Campbell, J., Shamardina, O., Brugger, C., Research Consortium, G. E., et al. (2022). SARS-CoV-2 susceptibility and ACE2 gene variations within diverse ethnic backgrounds. Front. Genet. 13. doi: 10.3389/FGENE.2022.888025
Valdés-Aguayo, J. J., Garza-Veloz, I., Vargas-Rodríguez, J. R., Martinez-Vazquez, M. C., Avila-Carrasco, L., Bernal-Silva, S., et al. (2021). Peripheral blood mitochondrial DNA levels were modulated by SARS-CoV-2 infection severity and its lessening was associated with mortality among hospitalized patients with COVID-19. Front. Cell. Infect. Microbiol. 11, 754708. doi: 10.3389/fcimb.2021.754708
Van der Auwera, G. A., Carneiro, M. O., Hartl, C., Poplin, R., Del Angel, G., Levy-Moonshine, A., et al. (2013). From FastQ data to high-confidence variant calls: the genome analysis toolkit best practices pipeline. Curr. Protoc. Bioinforma 43 (1110), 11.10.1–11.10.33. doi: 10.1002/0471250953.bi1110s43
van Lier, D., Kox, M., Santos, K., van der Hoeven, H., Pillay, J., Pickkers, P.. (2021). Increased blood angiotensin converting enzyme 2 activity in critically ill COVID-19 patients. ERJ Open Res. 7 (1), 00848–02020. doi: 10.1183/23120541.00848-2020
Wallentin, L., Lindbäck, J., Eriksson, N., Hijazi, Z., Eikelboom, J. W., Ezekowitz, MD, et al. (2020). Angiotensin-converting enzyme 2 (ACE2) levels in relation to risk factors for COVID-19 in two large cohorts of patients with atrial fibrillation. Eur. Heart J. 41 (41), 4037–4046. doi: 10.1093/eurheartj/ehaa697
Wang, C., Fang, Z., Zhu, Z., Liu, J., Chen, H.. (2017). Reciprocal regulation between hepcidin and erythropoiesis and its therapeutic application in erythroid disorders. Exp. Hematol. 52, 24–31. doi: 10.1016/j.exphem.2017.05.002
Wang, D., Eraslan, B., Wieland, T., Hallström, B., Hopf, T., Zolg, D. P, et al. (2019). A deep proteome and transcriptome abundance atlas of 29 healthy human tissues. Mol. Syst. Biol. 15 (2), e8503. doi: 10.15252/msb.20188503
Wischhusen, J., Melero, I., Fridman, W. H. (2020). Growth/differentiation factor-15 (GDF-15): from biomarker to novel targetable immune checkpoint. Front. Immunol. 11, 951. doi: 10.3389/fimmu.2020.00951
Wu, Q., Jiang, D., Schaefer, N. R., Harmacek, L., O'Connor, B. P., Eling, T. E., et al. (2018). Overproduction of growth differentiation factor 15 promotes human rhinovirus infection and virus-induced inflammation in the lung. Am. J. Physiol. Lung Cell. Mol. Physiol. 314 (3), L514–L527. doi: 10.1152/ajplung.00324.2017
Ye, J., Coulouris, G., Zaretskaya, I., Cutcutache, I., Rozen, S., Madden, T. L., et al. (2012). Primer-BLAST: A tool to design target-specific primers for polymerase chain reaction. BMC Bioinf. 13, 134. doi: 10.1186/1471-2105-13-134
Yildirim, Z., Sahin, O. S., Yazar, S., Bozok Cetintas, V.. (2021). Genetic and epigenetic factors associated with increased severity of covid-19. Cell Biol. Int. 45 (6), 1158–1174. doi: 10.1002/cbin.11572
Zamorano Cuervo, N., Grandvaux, N. (2020). ACE2: evidence of role as entry receptor for sars-cov-2 and implications in comorbidities. Elife 9, e61390.
Zhou, F., Yu, T., Du, R., Fan, G., Liu, Y., Liu, Z., et al. (2020). Clinical course and risk factors for mortality of adult inpatients with COVID-19 in wuhan, china: a retrospective cohort study. Lancet 395 (10229), 1054–1062. doi: 10.1016/S0140-6736(20)30566-3
Keywords: GDF5, ACE2, inflammation, mutations, COVID-19
Citation: Torrens-Mas M, Perelló-Reus CM, Trias-Ferrer N, Ibargüen-González L, Crespí C, Galmes-Panades AM, Navas-Enamorado C, Sanchez-Polo A, Piérola-Lopetegui J, Masmiquel L, Crespi LS, Barcelo C and Gonzalez-Freire M (2022) GDF15 and ACE2 stratify COVID-19 patients according to severity while ACE2 mutations increase infection susceptibility. Front. Cell. Infect. Microbiol. 12:942951. doi: 10.3389/fcimb.2022.942951
Received: 13 May 2022; Accepted: 27 June 2022;
Published: 22 July 2022.
Edited by:
Vikas Sood, Jamia Hamdard University, IndiaReviewed by:
Grégory Dubourg, IHU Mediterranee Infection, FranceDevin Wahl, Colorado State University, United States
Copyright © 2022 Torrens-Mas, Perelló-Reus, Trias-Ferrer, Ibargüen-González, Crespí, Galmes-Panades, Navas-Enamorado, Sanchez-Polo, Piérola-Lopetegui, Masmiquel, Crespi, Barcelo and Gonzalez-Freire. This is an open-access article distributed under the terms of the Creative Commons Attribution License (CC BY). The use, distribution or reproduction in other forums is permitted, provided the original author(s) and the copyright owner(s) are credited and that the original publication in this journal is cited, in accordance with accepted academic practice. No use, distribution or reproduction is permitted which does not comply with these terms.
*Correspondence: Marta Gonzalez-Freire, marta.gonzalezfreire@ssib.es; Carles Barcelo, carles.barcelo@ssib.es
†These authors have contributed equally to this work and share first authorship
‡These authors have contributed equally to this work and share last authorship