Article

COVID-19 Lockdown and the Impact on Mobility, Air Quality, and Utility Consumption: A Case Study from Sharjah, United Arab Emirates

by
Abdallah Shanableh
1,2,
Rami Al-Ruzouq
1,2,
Mohamad Ali Khalil
1,*,
Mohamed Barakat A. Gibril
2,3,
Khaled Hamad
1,
Mohamad Alhosani
4,
Mohammed Hashem Stietiya
4,
Mayyada Al Bardan
5,
Saeed Al Mansoori
6 and
Nezar Atalla Hammouri
7,8
1
Civil and Environmental Engineering Department, University of Sharjah, Sharjah 27272, United Arab Emirates
2
GIS and Remote Sensing Center, Research Institute of Sciences and Engineering, University of Sharjah, Shajah 27272, United Arab Emirates
3
Department of Civil Engineering and Geospatial Information Science Research Centre (GISRC), Faculty of Engineering, Universiti Putra Malaysia (UPM), Serdang 43400, Selangor, Malaysia
4
Division of Consultancy, Research and Innovation (CRI), Sharjah Environment Company—Bee’ah, Sharjah 20248, United Arab Emirates
5
Sharjah Electricity, Water, and Gas Authority, Sharjah 135, United Arab Emirates
6
Applications Development and Analysis Section (ADAS), Mohammed Bin Rashid Space Centre (MBRSC), Dubai 211833, United Arab Emirates
7
Department of Applied Physics and Astronomy, University of Sharjah, Sharjah 27272, United Arab Emirates
8
Department of Earth and Environmental Sciences, The Hashemite University, Zarqa 13133, Jordan
*
Author to whom correspondence should be addressed.
Sustainability 2022, 14(3), 1767; https://doi.org/10.3390/su14031767
Submission received: 1 November 2021 / Revised: 21 January 2022 / Accepted: 27 January 2022 / Published: 3 February 2022

Abstract

:
This study presents an analysis of the impact of COVID-19 lockdown on people’s mobility trends, air quality, and utility consumption in Sharjah, United Arab Emirates (UAE). Records of lockdown and subsequent easing measures, infection and vaccination rates, community mobility reports, remotely sensed and ground-based air quality data, and utility (electricity, water, and gas) consumption data were collected and analyzed in the study. The mobility trends reflected the stringency of the lockdown measures, increasing in the residential sector but decreasing in all other sectors. The data showed significant improvement in air quality corresponding to the lockdown measures in 2020 followed by gradual deterioration as the lockdown measures were eased. Electricity and water consumption increased in the residential sector during the lockdown; however, overall utility consumption did not show significant changes. The changes in mobility were correlated with the relevant air quality parameters, such as NO2, which in turn was highly correlated to O3. The study provides data and analysis to support future planning and response efforts in Sharjah. Furthermore, the methodology used in the study can be applied to assess the impacts of COVID-19 or similar events on people’s mobility, air quality and utility consumption at other geographical locations.

1. Introduction

On 11 March 2020, the World Health Organization (WHO) declared the COVID-19 outbreak as a global pandemic and encouraged countries to take appropriate measures to mitigate its spread [1]. This outbreak and escalation of confirmed infection cases forced governments to apply stringent safety protocols and precautionary measures during the early stages of the pandemic, and many establishments were temporarily closed [2,3,4,5]. The implemented measures influenced people mentally, socially, and economically and disrupted vital sectors of the economy. In particular, people’s mobility was severely affected, with the associated reduction in transportation and industrial activities contributing to improvements in air quality. Various studies have highlighted the impacts of COVID-19 lockdown on air pollution and mobility [6,7,8,9,10,11,12,13,14,15,16]. Other studies have attempted to link people’s mobility to the spread of the virus. For instance, Wang et al. [17] investigated how restricting people’s mobility affected the spread of COVID-19 in Australia. The authors [17] used Google’s COVID-19 Community Mobility Reports (GCMR) and reported inconsistency between the mobility patterns in various sectors (i.e., public transit, workspaces, and retail/recreational) and COVID-19 spread during the first two waves of COVID-19 in Australia. The observed inconsistencies were attributed to the variation of individuals’ preventative behaviors and perceptions over the different waves of the COVID-19 virus.
Orak and Ozdemir [18] investigated the impact of the COVID-19 lockdown on air quality and its correlation with mobility in more than 80 cities in Turkey using GCMR in addition to in situ measurements of PM10 and SO2. The levels of PM10 and SO2 were found to be lower by 67% and 59%, respectively, in 2020 compared to the previous five years. Further, the authors [18] observed that the mobility patterns in restaurants, transit, and workplaces were significantly correlated with PM10 and SO2 levels. Berman and Ebisu [19] assessed the changes in PM2.5 and NO2 in the United States from 8 January until 21 April for the years 2017 to 2020. The authors defined the pre-COVID-19 period from 8 January until 12 March and the COVID-19 lockdown period from 13 March to 21 April. The authors observed that the decline in NO2 and PM2.5 levels were statistically significant during the COVID-19 period compared to the same period of the previous years. Another study by Skirienė and Stasiškienė [20] utilized data from the European Environment Agency (EEA) to investigate the impact of implemented COVID-19 lockdown measures in five European countries, including the United Kingdom, Spain, Northern Italy, Sweden, and France. The authors studied the air quality changes in the periods before and during the COVID-19 lockdown for the years 2018 to 2020 and correlated the air quality data with the Index of Production, which is a monthly economic indicator that measures the output of industries such as mining, electricity and gas, and manufacturing. The researchers reported that the decline in mobility and industrial activity during the lockdown was accompanied by a decline in the levels of NO2, PM2.5, and PM10 by about 20–40% in 2020 compared to the previous years.
While the extent and impact of the COVID-19 outbreak varied from one region to another [21,22,23], the governments’ response and the population’s actions did not always align [24,25,26,27]. Therefore, analysis of the environmental [28,29,30,31] and psychological [32,33,34,35] impacts during and after the initial outbreak of COVID-19 should be conducted separately for different geographical locations. Local documentation of the impacts of COVID-19 is essential for enhancing preparedness, informing policy and decision making, and devising effective mitigation strategies to deal with future events. Most available studies on the impacts of COVID-19 lockdown have focused on air quality and mobility; however, limited studies have considered impacts on utility consumption. Furthermore, no studies have previously addressed the impacts of the lockdown in Sharjah or the United Arab Emirates (UAE) on utility consumption. The study combines analyses of the impact of COVID-19 lockdown on people’s mobility trends, air quality (using satellite images and ground-based stations), and utility consumption (electricity, water, and gas). The specific objectives of this study are to: (1) document how Sharjah was affected by COVID-19 in terms of authorities’ and community responses; (2) assess the impact of COVID-19 lockdown on people’s mobility, air quality, and utility consumption; and (3) correlate the time series of the safety precautions measures with the mobility, air quality, and utility consumption.

2. Materials and Methods
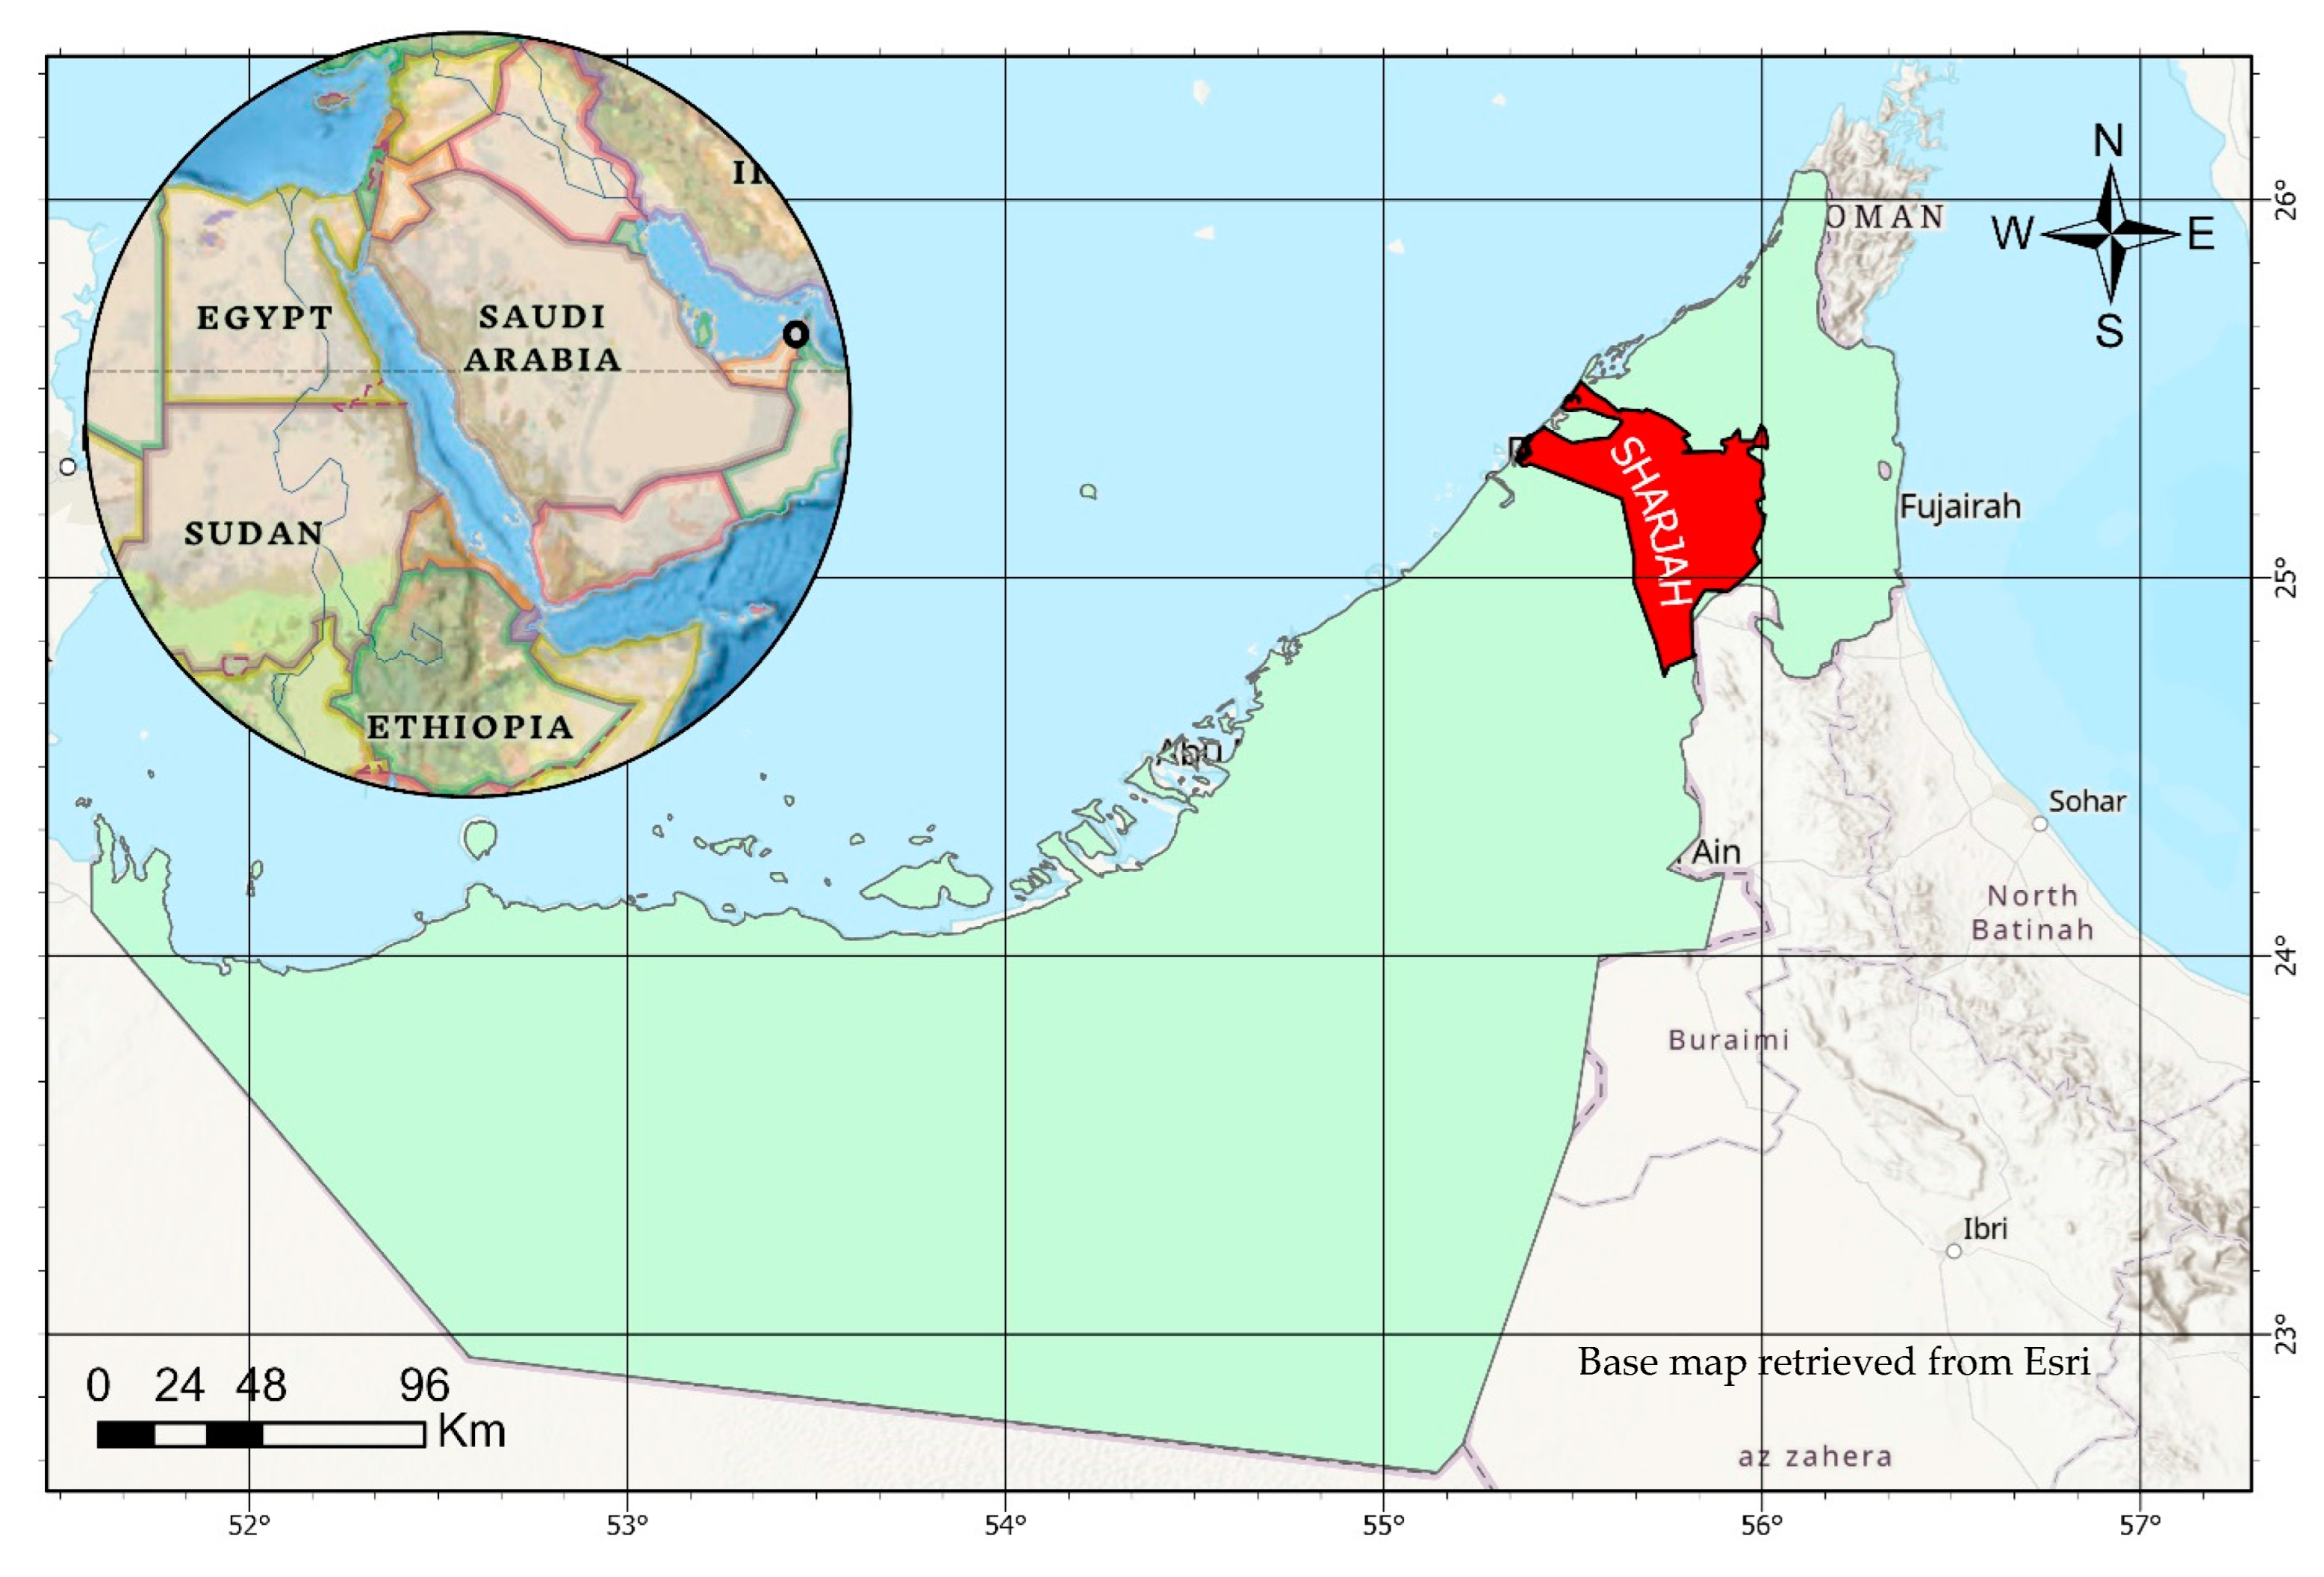
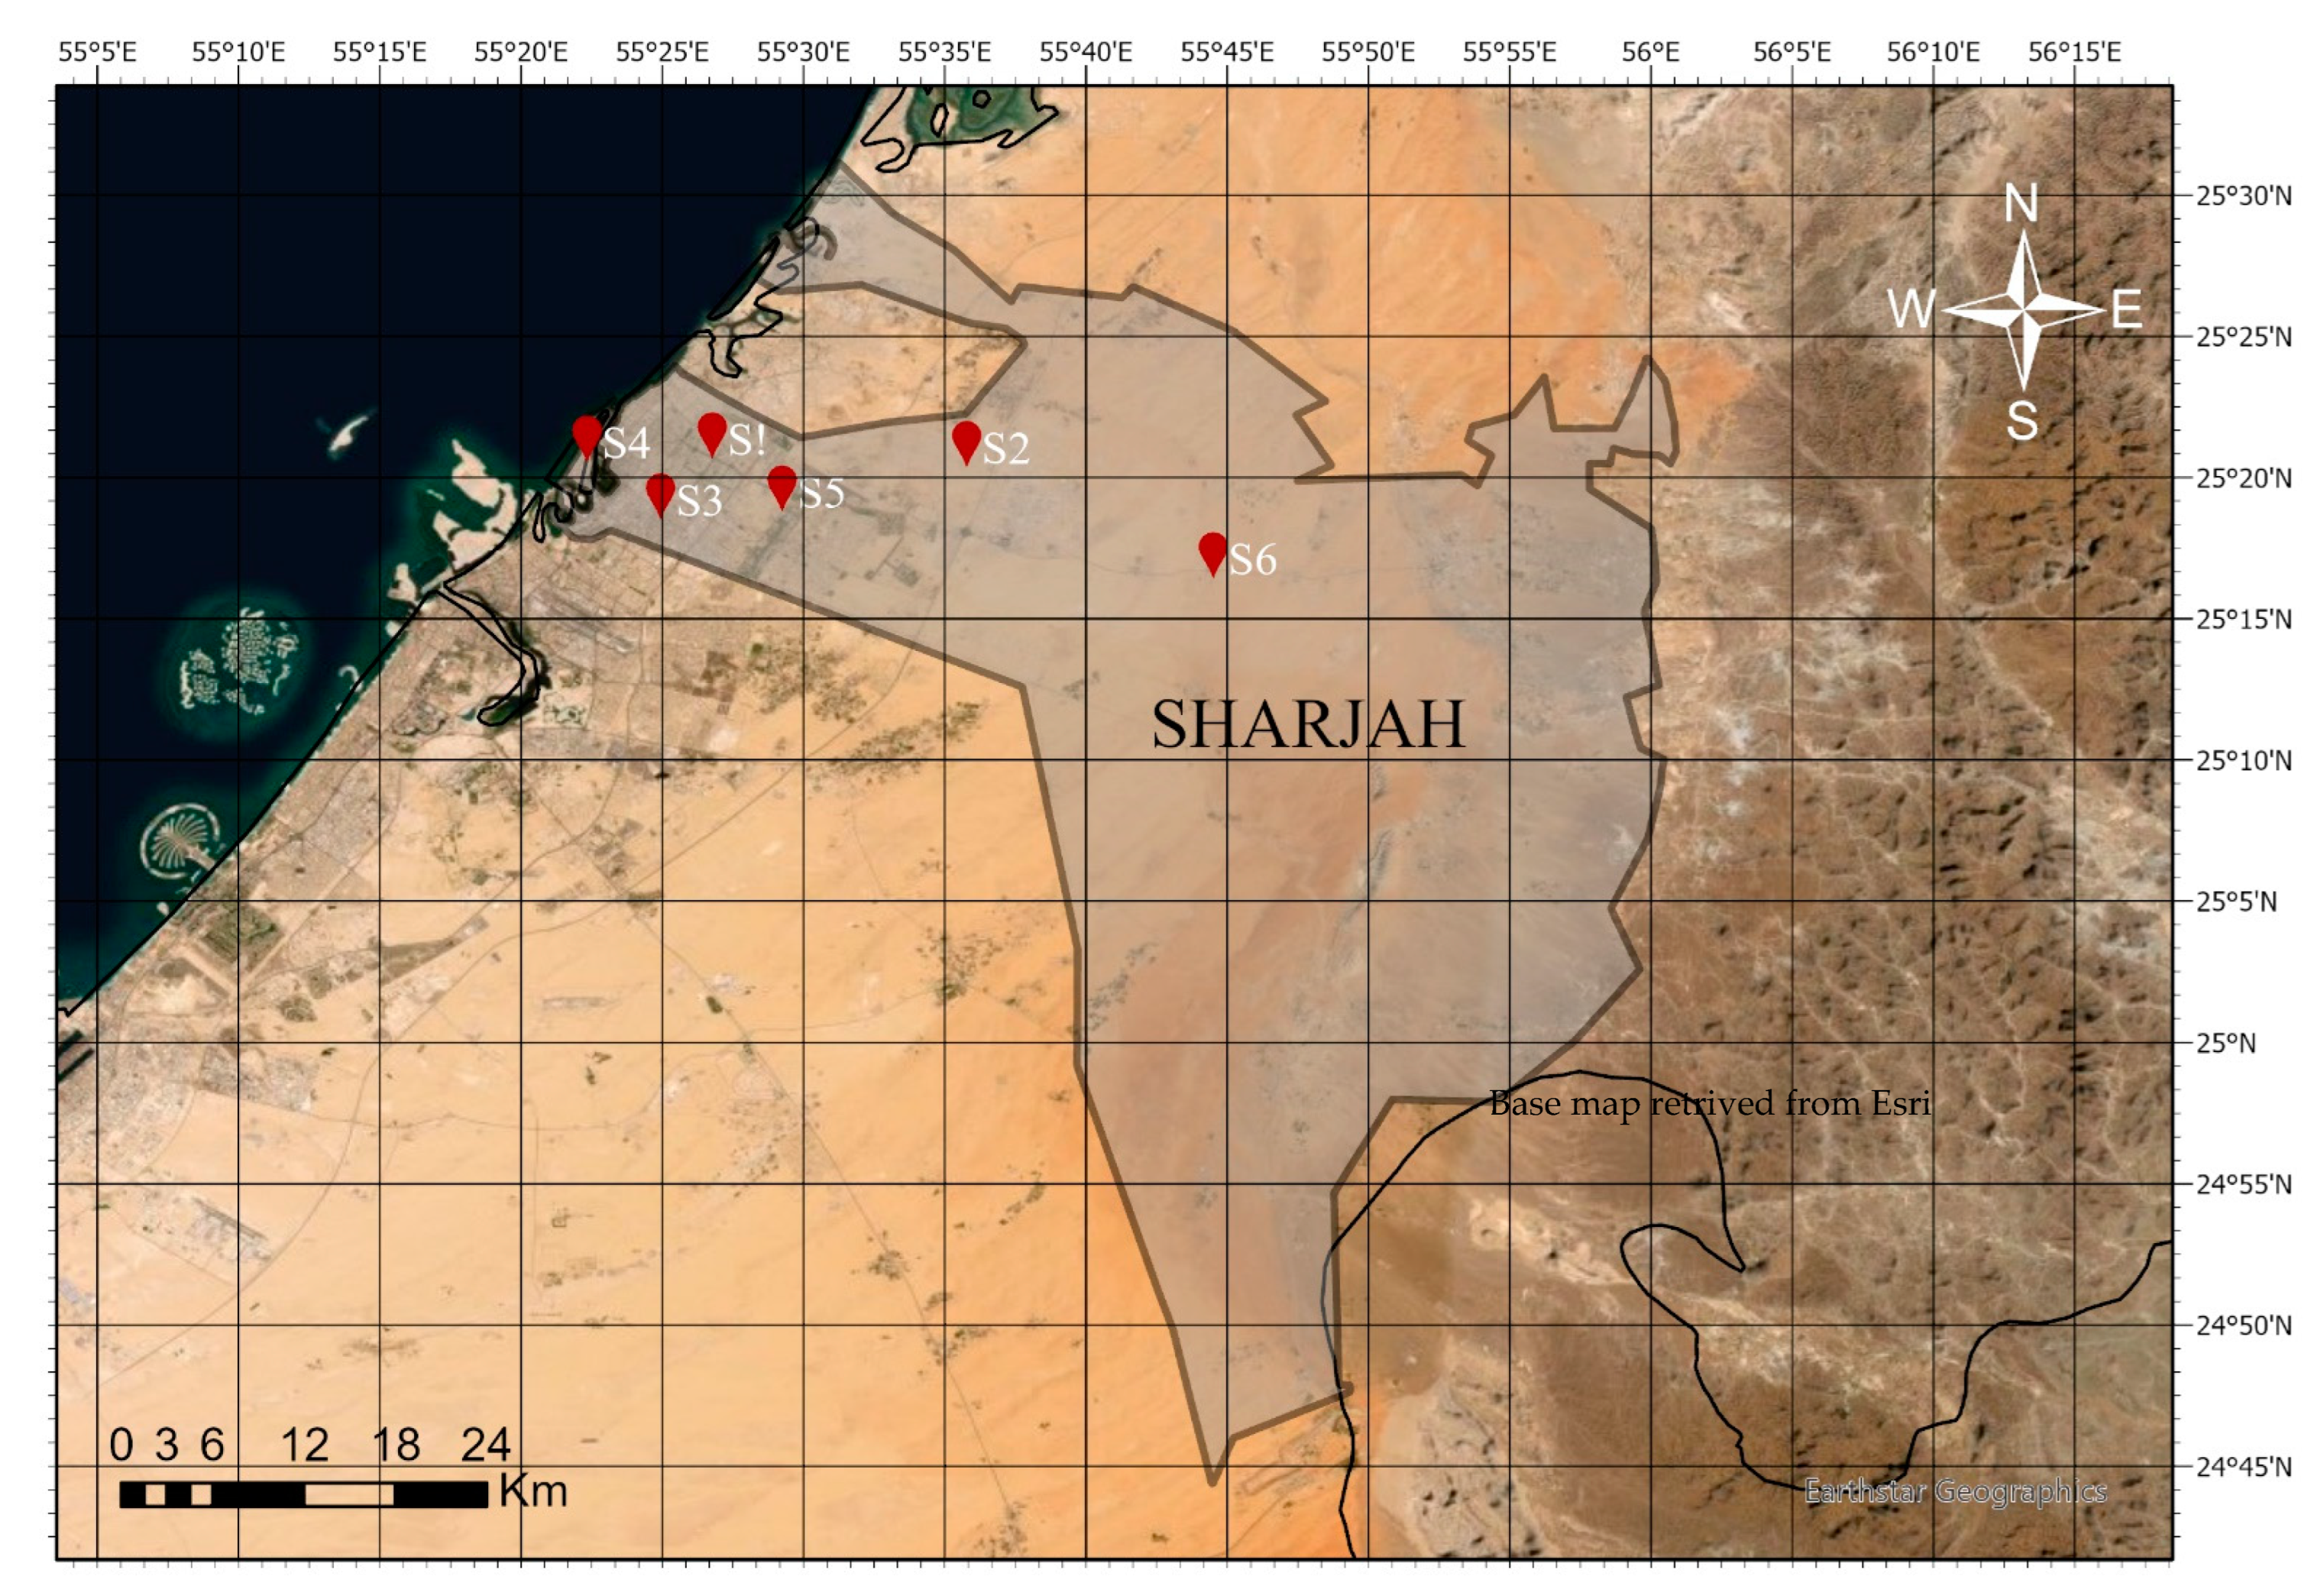
2.1. Study Area

This study focused on Sharjah, one of the seven emirates of the UAE. Sharjah has a total population of about 1.28 million and has an area of about 254 km2 (Figure 1). The use of mass transport in Sharjah remains limited despite the availability of a public bus system, with most Sharjah residents using personal vehicles or private taxis. Sharjah city is connected to the adjacent city of Dubai, with a large portion of Sharjah residents commuting to Dubai for work and entertainment. As a result, the Sharjah–Dubai transportation links are typically highly congested during rush hours.
Given the COVID-19 outbreak, students and nonessential workers were asked to study and work remotely during the early stages of the pandemic. Many industrial activities were affected and had to temporarily shut down during the lockdown. The unprecedented lockdown affected people’s mobility, utilities, and air pollution in Sharjah. In the coming sections, we summarize the response to the spread of COVID-19, including the implemented safety measures, daily infection records, and vaccination rates.

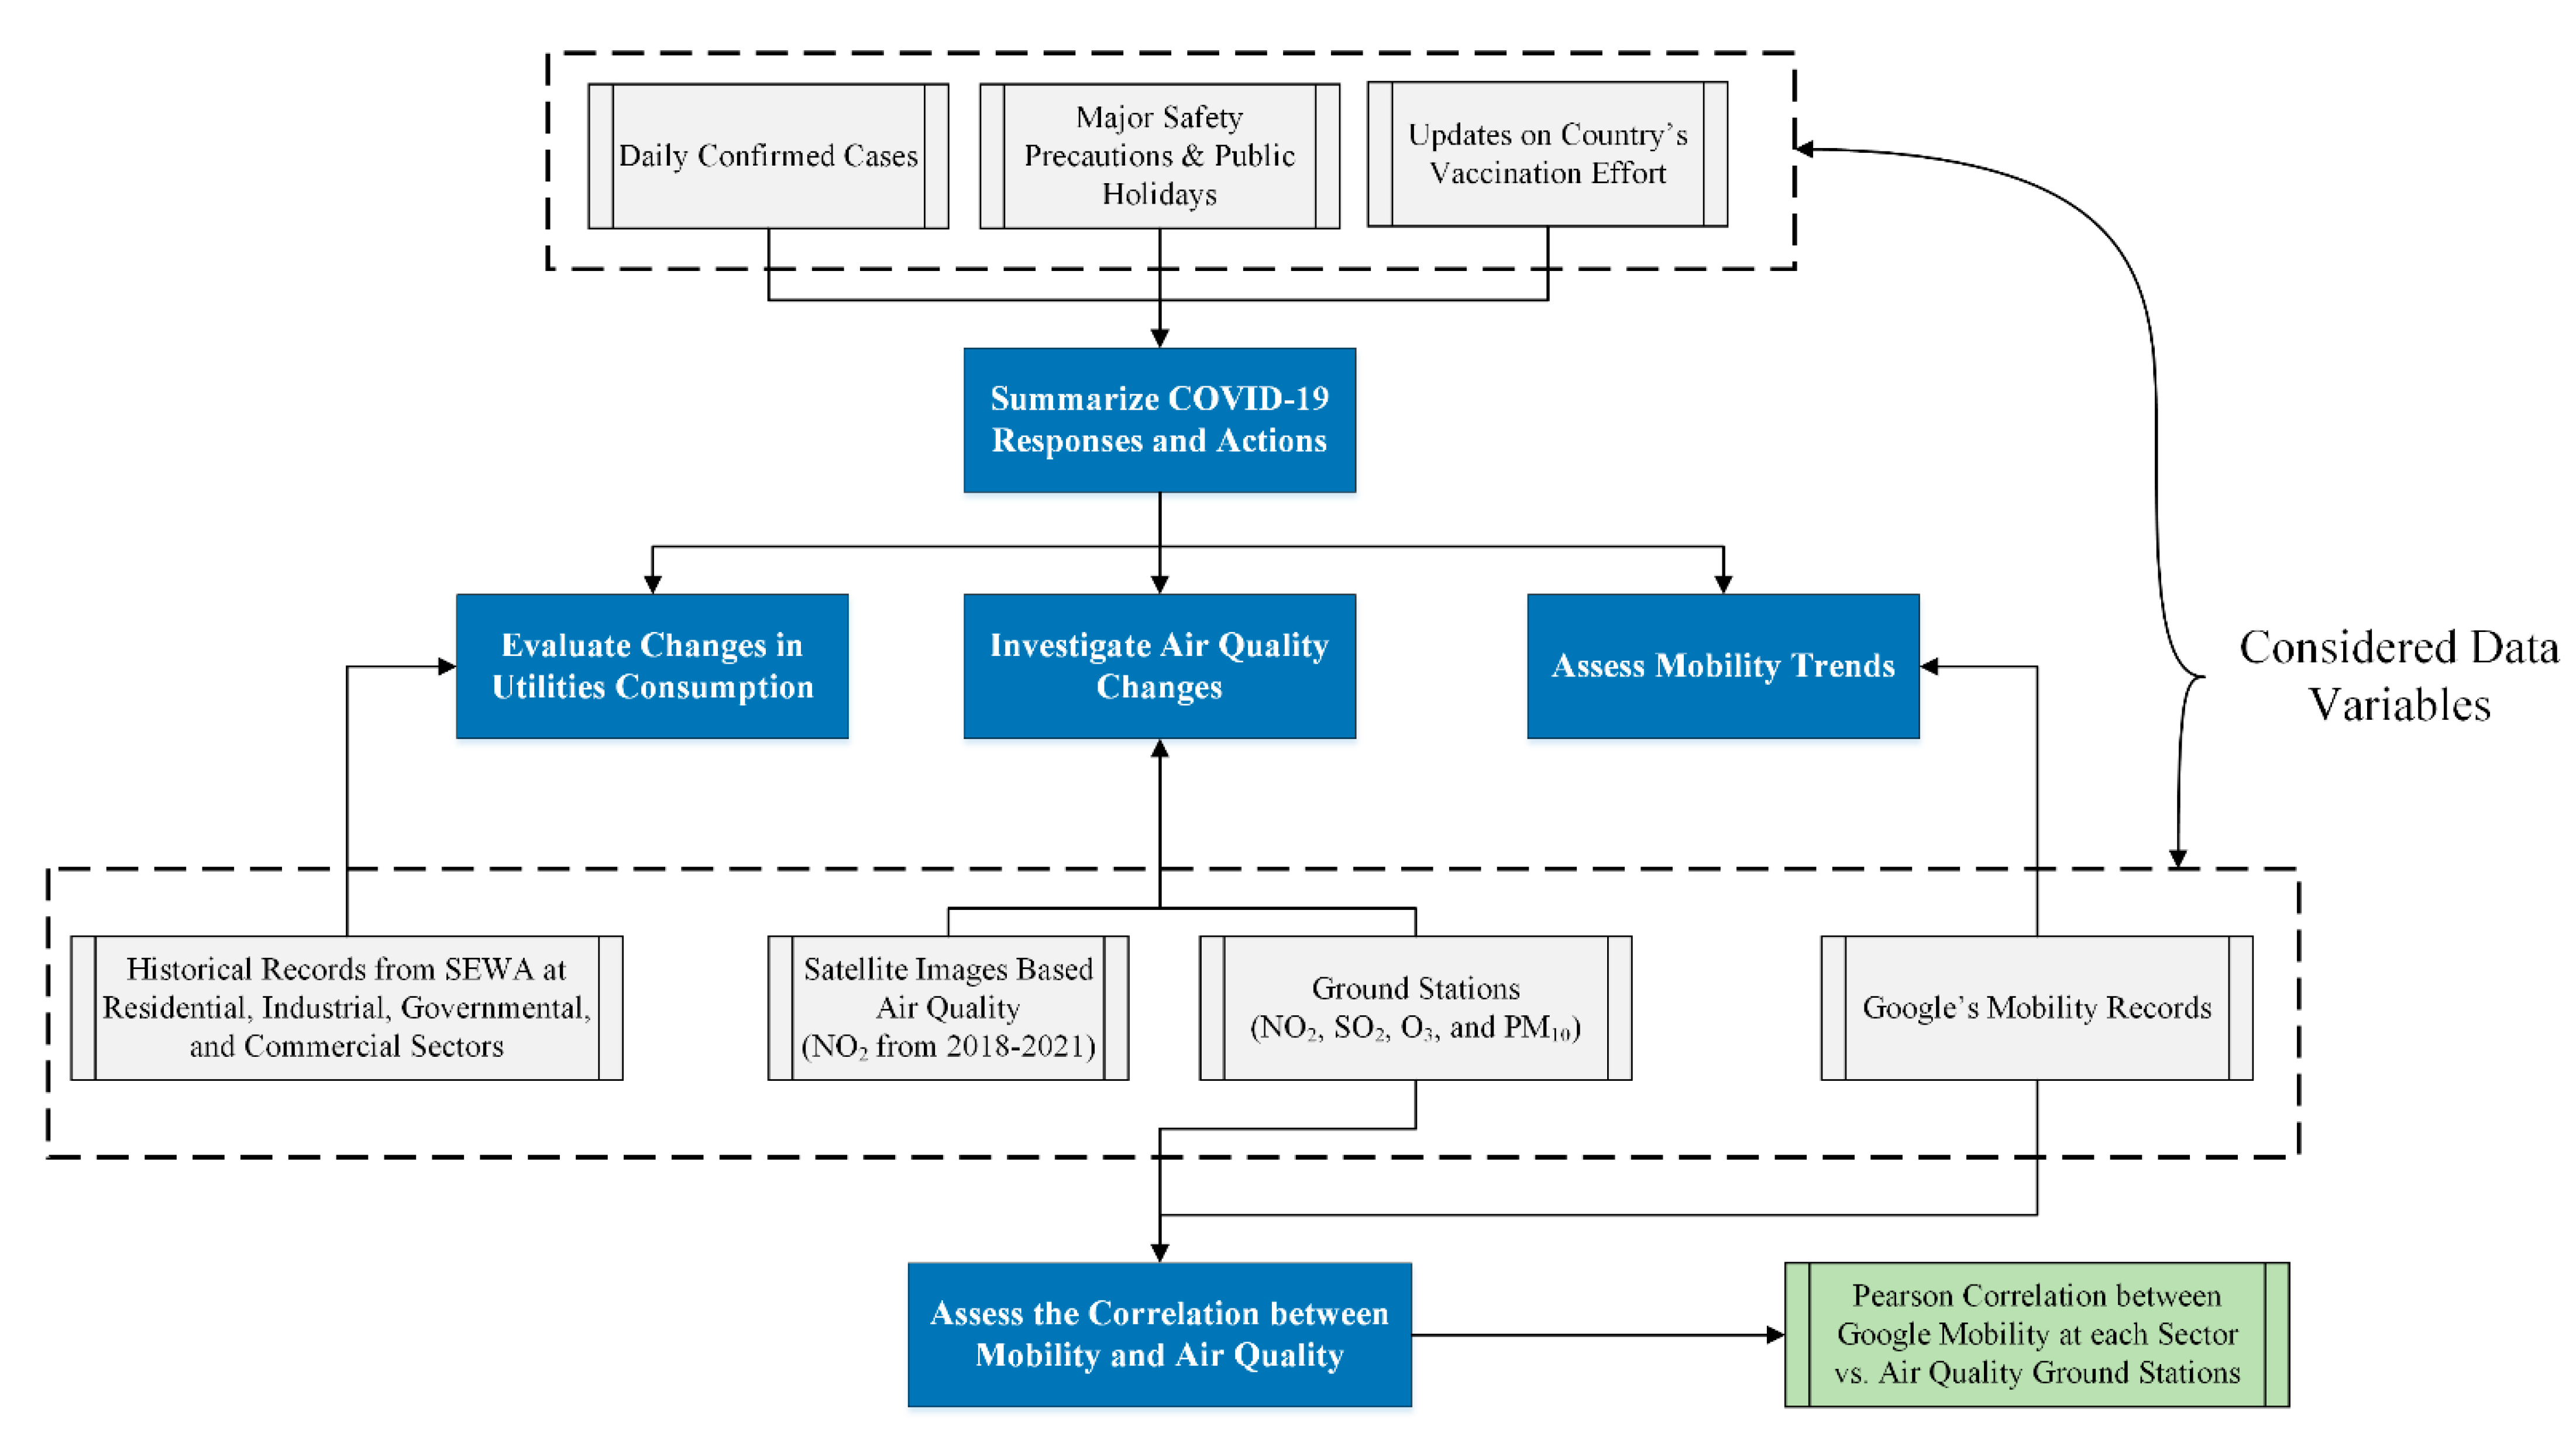
2.2. Methodology Framework

The methodological framework of this study consisted of five phases (Figure 2). First, we explored how Sharjah, and the UAE in general, reacted to the COVID-19 pandemic. The work included generating a timeline of the confirmed infection cases, the major safety precautions (SP) and public holidays (PH), and the country’s effort in vaccinating the population. The gathered information was used to document how Sharjah reacted to the COVID-19 pandemic but also to shed light on a successful effort concerning COVID-19 monitoring and mitigation.
Second, we assessed the changes in people’s mobility trends before and during the pandemic. The mobility trends were retrieved from Google’s public COVID-19 Community Mobility Reports (GCMR). Mobility herein indicates where people are rather than traffic rates and volumes. For example, increased mobility in the residential sector indicates that more people stayed in their homes. The mobility data were assessed for six main sectors in Sharjah, namely: retail and recreation; grocery and pharmacy; parks; transit stations; workplace; and residential. In the presented analysis, we conducted a detailed time series analysis for each of these sectors while mapping the SPs and PHs at the same time.
Third, we performed a quantitative investigation of the air quality changes over multiple years at several locations in Sharjah. Air quality data (i.e., PM10, O3, SO2, NO2, CO), and metrological parameters (i.e., wind speed and wind direction) were acquired from six stations distributed in Sharjah city. To better understand the effect of SPs on the air quality in Sharjah, three levels of analysis were conducted, i.e., hourly, daily, and monthly. For each of these levels, we compared the trends of 2020 versus 2019 and 2018. Furthermore, we obtained satellite air quality data (Sentinel-5P satellite images) covering the northern parts of the UAE, where Sharjah is located, and used them to indicate the impact of the lockdown on NO2 levels over Sharjah.
In the fourth phase, we evaluated the consumption of utilities (electricity, water, and gas) in Sharjah before and during the pandemic across four consumption categories: residential, industrial, governmental, and commercial. The data were provided by the Sharjah Electricity and Water Authority (SEWA) monthly for the years 2016 to 2020.
Ultimately, we statistically assessed the correlation between mobility and air quality using Pearson correlation for various mobility sectors using the air quality data obtained from the various ground monitoring stations in Sharjah. The statistical analyses were conducted to reveal expected potential causation relationships.

2.3. Data Acquisition

The mobility, air quality, and utility consumption data used in this study were obtained from various sources. The Google Community Mobility Reports (GCMR) data were obtained from Google [36], which shares the mobility data with the community to facilitate research and studies related to the pandemic. The available data covered a period starting 2020 onward across four different sectors: retail and recreation, grocery and pharmacy, parks, transit stations, workplace, and residential. The mobility data show changes in mobility on any day during the pandemic relative to the average mobility of the same day during the five weeks before the pandemic (3 January to 6 February 2020) [37]. For example, the mobility of Tuesday, 6 July 2020 was compared with the average mobility value of all Tuesdays from 3 January to 6 February 2020.
For air quality analysis, the Sentinel-5P satellite data [38] provided a measure of NO2 levels over the northern parts of the UAE, where Sharjah is located, from 2019 to 2021. The data allowed a spatial visualization of NO2 levels and level changes during the pandemic. In addition, air quality measurements at various ground monitoring stations in Sharjah were provided by Bee’ah, a leading environmental company in Sharjah. The monitoring stations are located in residential, educational, industrial, and rural areas. The timespan of the received data was from 2018 until the end of 2020. The data included the following parameters: SO2, PM10, O3, NO2, wind speed, and wind direction with a data resolution of one hour. Table 1 shows a sample of the utilized dataset.
Finally, monthly utility consumption data (i.e., electricity, water, and gas consumption) were obtained from Sharjah Electricity, Water, and Gas Authority (SEWA). The data were provided from 2016 until the end of 2020, covering five consumption sectors: residential; industrial; governmental; commercial; and agricultural. Additionally, the numbers of consuming units (metered connections that represent apartments, villas, or buildings) were provided (Table 2 illustrates a sample of the data).

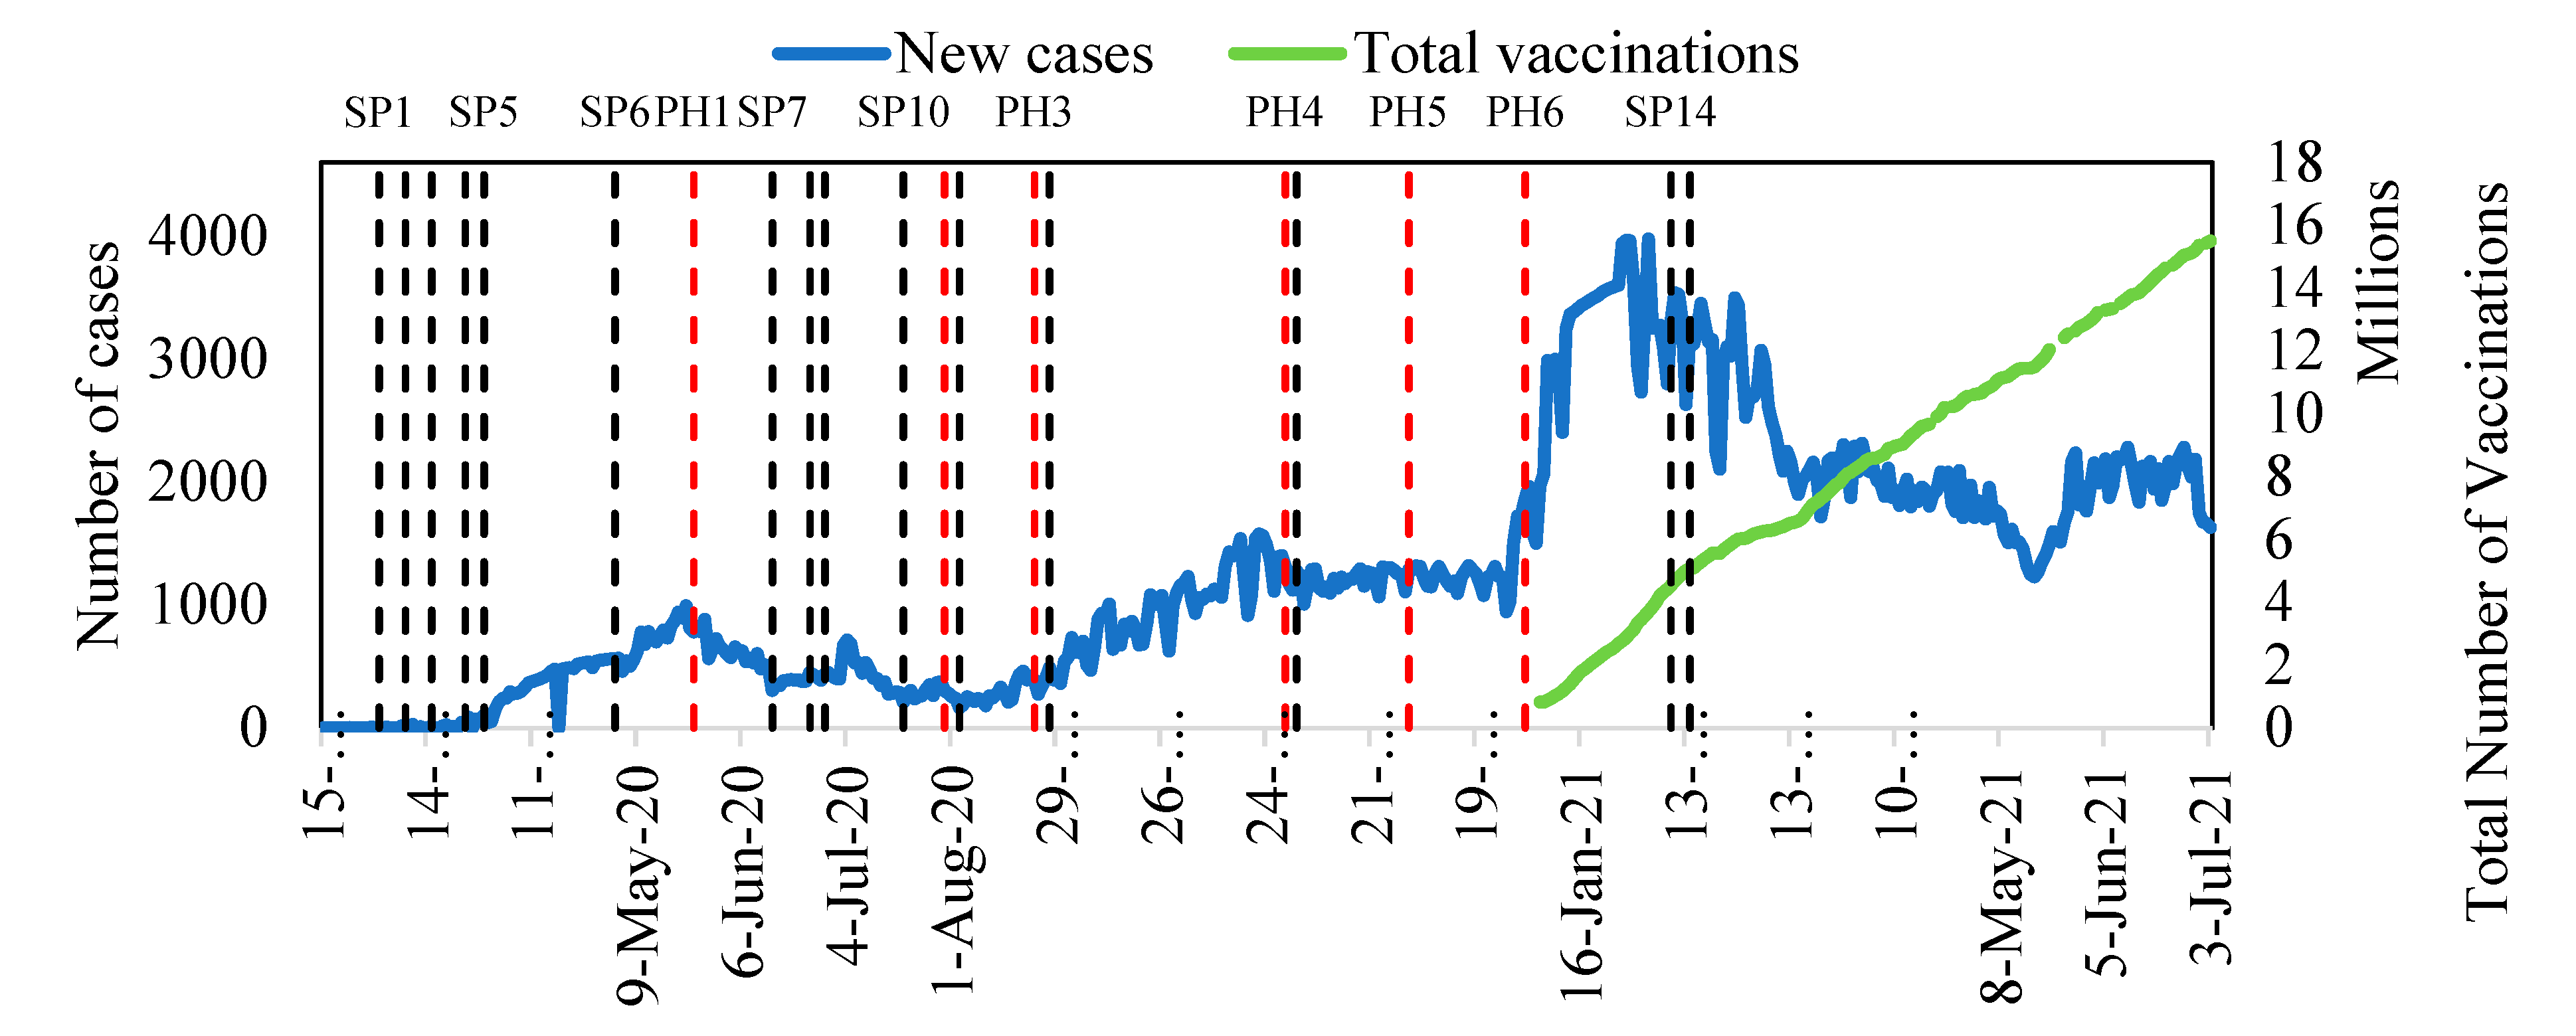
3. Local COVID-19 Safety Precautions

The first confirmed COVID-19 case in the UAE was recorded on 29 January 2020. As the number of cases gradually increased, the government started implementing SP to contain the spread of the virus among the population. Table 3 provides a detailed overview of the implemented SPs since the pandemic’s beginning [39,40,41,42,43,44,45,46,47,48,49,50,51,52,53,54,55,56,57,58]. In addition to the SPs, the PHs are also included as they affect mobility and air quality and utility consumption. Figure 3 shows the daily trend of confirmed COVID-19 cases in the UAE, with the vertical lines corresponding to the SPs and PHs indicated in Table 3.

4. Results and Discussions

This section is divided into four subsections in which the results are presented and discussed. The first subsection presents and discusses the changes in people’s mobility trends before, during, and after the initial COVID-19 lockdown. The analyzed mobility trends cover various sectors, including retail and recreation, grocery and pharmacy, parks, transit stations, workplace, and residential. In the second subsection, the impact of the lockdown on air quality, expressed in terms of NO2, O3, and PM10, is assessed using data obtained from temporal satellite images and ground monitoring stations. In the third subsection, the utility consumption patterns, including electricity, water, and gas, are analyzed before and during the lockdown. Finally, an analysis of the bivariate correlation between mobility and air quality is presented in the fourth subsection.

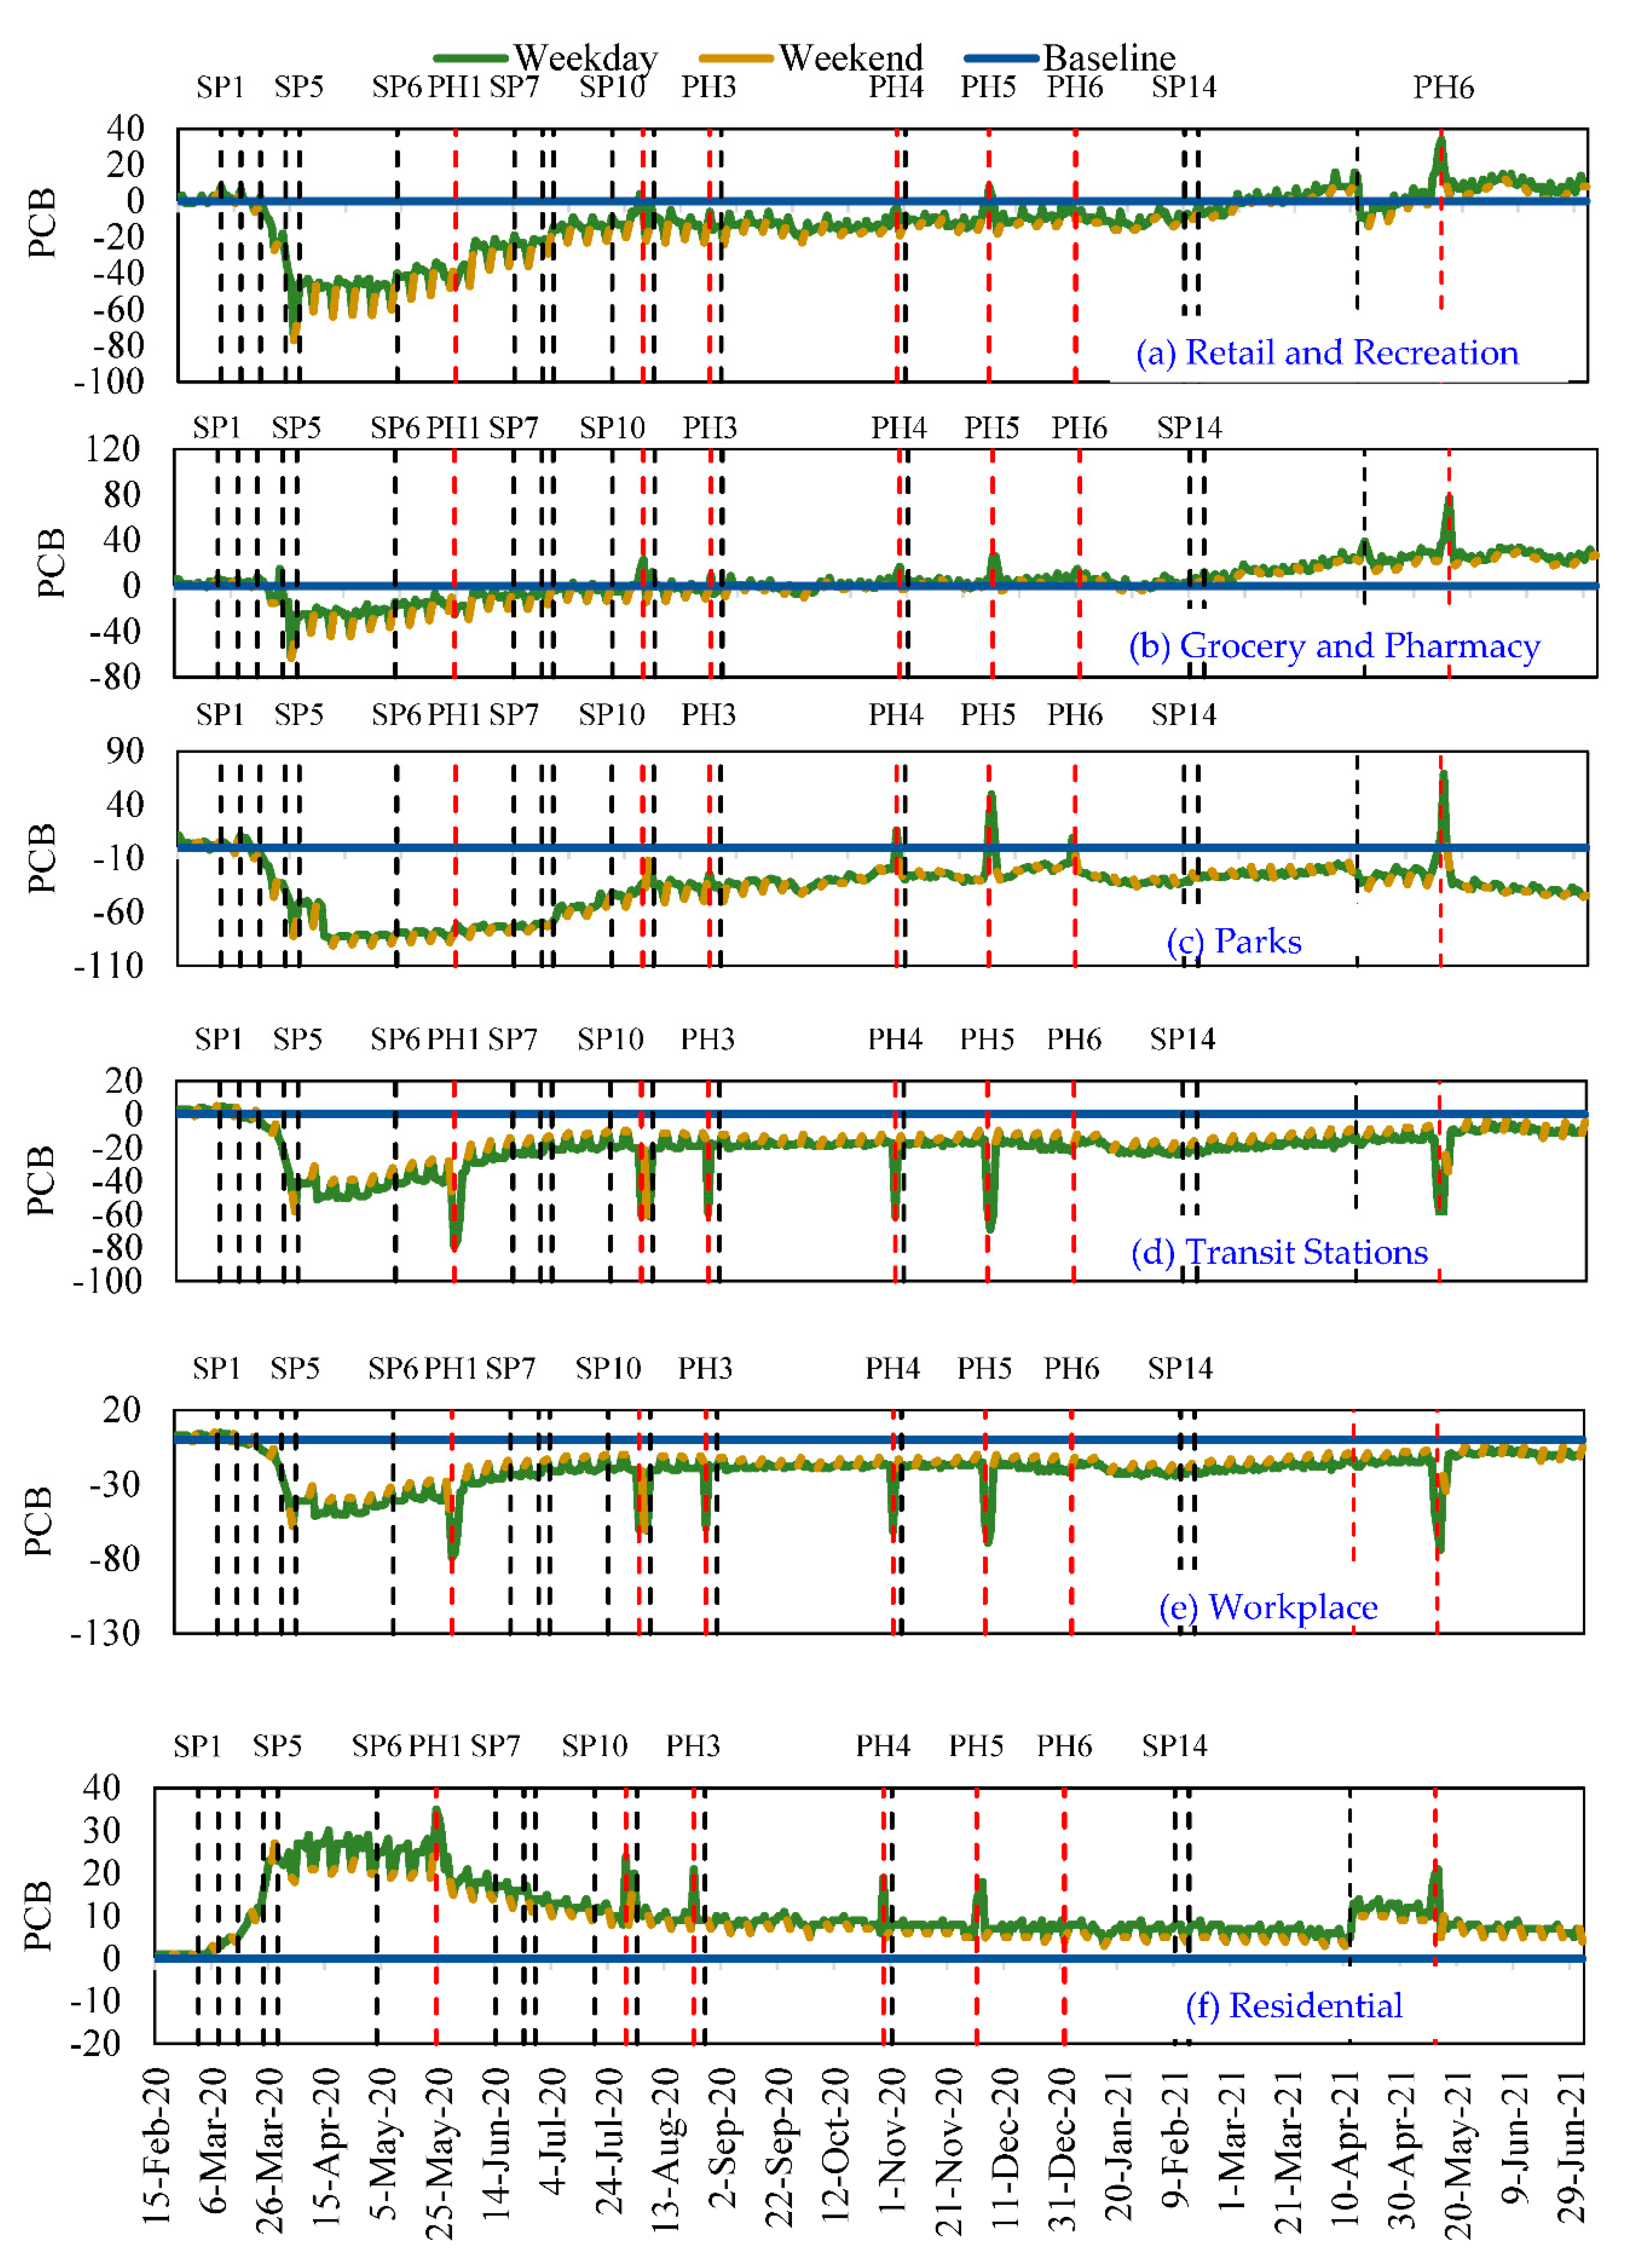
4.1. Impacts on Mobility Trends in Sharjah

This section discusses the changes in the mobility trends observed just before, during, and after the 2020 lockdown in six main mobility sectors in Sharjah. It should be noted that the presented mobility trends reflect people’s locations rather than traffic volumes. The presented data trends cover the period from 15 February 2020 to 2 July 2021.
Figure 4a shows the changes in mobility trends in the retail and recreation sector in response to the implementation of various safety policies (SP) and public holidays (PH). The dashed vertical lines in Figure 4 correspond to the SP and PH stated in Table 3. The data show that the mobility in the sector declined dramatically after the implementation of SP3 (remote work), which came after the closure of schools and nurseries (SP1 and SP2). The decline in mobility early in the lockdown dipped by −77% compared to its levels before the implementation of the lockdown policies in February and early March 2020. The decline continued until the beginning of May 2020, when malls and shopping centers (SP6) were reopened. The gradual increase in mobility continued with the easing of restrictions until the beginning of August 2020, then remained fairly steady but slightly below the level observed before the lockdown. From March 2021, the mobility in the sector slightly exceeded the level observed before the lockdown as all mobility restrictions were effectively lifted after achieving a high level of vaccination. It should be noted that the spikes in the curve represent the variation during the days of the week, with the retail and recreation sector being busier during weekends than on workdays. Mobility in the grocery and pharmacy sector also declined significantly during the lockdown then gradually recovered as restrictions were eased (Figure 4b). The data show a spike reduction in mobility up to about −63% in March 2020 as people rushed to stock up on groceries and essential items out of health concerns and fear of drastic lockdown measures. Mobility then started to recover gradually as groceries and pharmacies remained open [56], with mobility in the sector recovering to its pre-lockdown level between July 2020 and January 2021. In 2021, the mobility in the sector gradually increased, indicating full recovery and expansion. The mobility in the parks sector (Figure 4c) declined up to −91% in April 2020 then gradually recovered after the parks were reopened by the end of June 2020 (SP8). The mobility spikes in the sector typically correspond to public holidays, especially in fall and winter when the weather is moderate. The mobility in the transit stations (Figure 4d) plummeted at the beginning of March 2020 after SP2 by up to −85% from the baseline. From April 2020 (after SP5), the mobility remained constant for about five weeks then gradually increased. After June 2020 (following SP9), the mobility declined again for about a week then gradually recovered as restrictions eased. During the pandemic (Figure 4e), work from home dramatically reduced mobility in the workplace sector, which dipped by about −60% by the end of March 2020. The mobility started to recover in April 2020 but did not reach the baseline levels recorded in February 2020 before the pandemic. It should be noted that the downward spikes during recovery correspond to the public holidays in Sharjah. All sectors except for the residential sector experienced significant mobility reductions during the pandemic lockdown period. Mobility in the residential sector (Figure 4f) exhibited a dramatic increase as people stayed home during the early stages of the pandemic. Mobility in the sector increased by about 25% following the introduction of the various lockdown measures starting March 2020 (Table 3). The increased mobility in the sector persisted until late May 2020 then started to gradually decline over four months as the lockdown measures were eased and high vaccination rates were achieved.
Overall, the GCMR data adequately reflected the safety measures (SP) and public holidays (PH) identified in Table 3. The data reflected the dramatic changes in mobility in the various sectors during the early stage of the pandemic from March 2020 and the gradual recovery afterward. The decline in mobility in five of the six assessed sectors was accompanied by an equivalent increase in the residential sector.
In summary, the analysis revealed that: (i) the changes in the mobility data reflected the safety measures and public holidays that occurred in Sharjah; (ii) mobility in the parks sector was the most affected while the grocery and pharmacy sector was the least affected; (iii) by March 2021, most of the officially imposed restrictions were lifted, but the mobility remained below the baseline values before the lockdown in February 2020, except for in the retail and recreation and grocery and pharmacy sectors; (iv) the nighttime travel restriction program starting 26 March 2020 (i.e., SP4) led to a significant decrease in mobility across all sectors, except for the residential sector, which recorded the highest increase in its mobility during the program.
The time series analysis presented in Figure 4 above revealed the changes in the mobility trends in Sharjah before, during, and after the initial lockdown. Additionally, we conducted t-tests to assess the significance of the statistical differences in mobility in the various sectors before (15 February to 27 March 2020), during (end of March to end of July 2020), and after (August 2020 to July 2021) COVID-19. The t-test results presented in Table 4 indicate that the mobility trends across all sectors changed significantly between the COVID-19 lockdown period and the period before the lockdown (t-test < 0.05 at 95% confidence interval) but that the mobility did not reach comparable levels to those before the lockdown, except for the groceries and pharmacies sector. On the other hand, the mobility trends showed significant recovery (t-test < 0.05 at 95% confidence interval) following the lockdown.

4.2. Impacts on Air Quality in Sharjah

In this study, the impact of the lockdown on NO2 levels over the northern parts of the UAE, where Sharjah is located, was first analyzed using temporal Sentinel-5P satellite images. Furthermore, the impact of the lockdown on air quality was analyzed based on the historical records from the six ground monitoring stations.

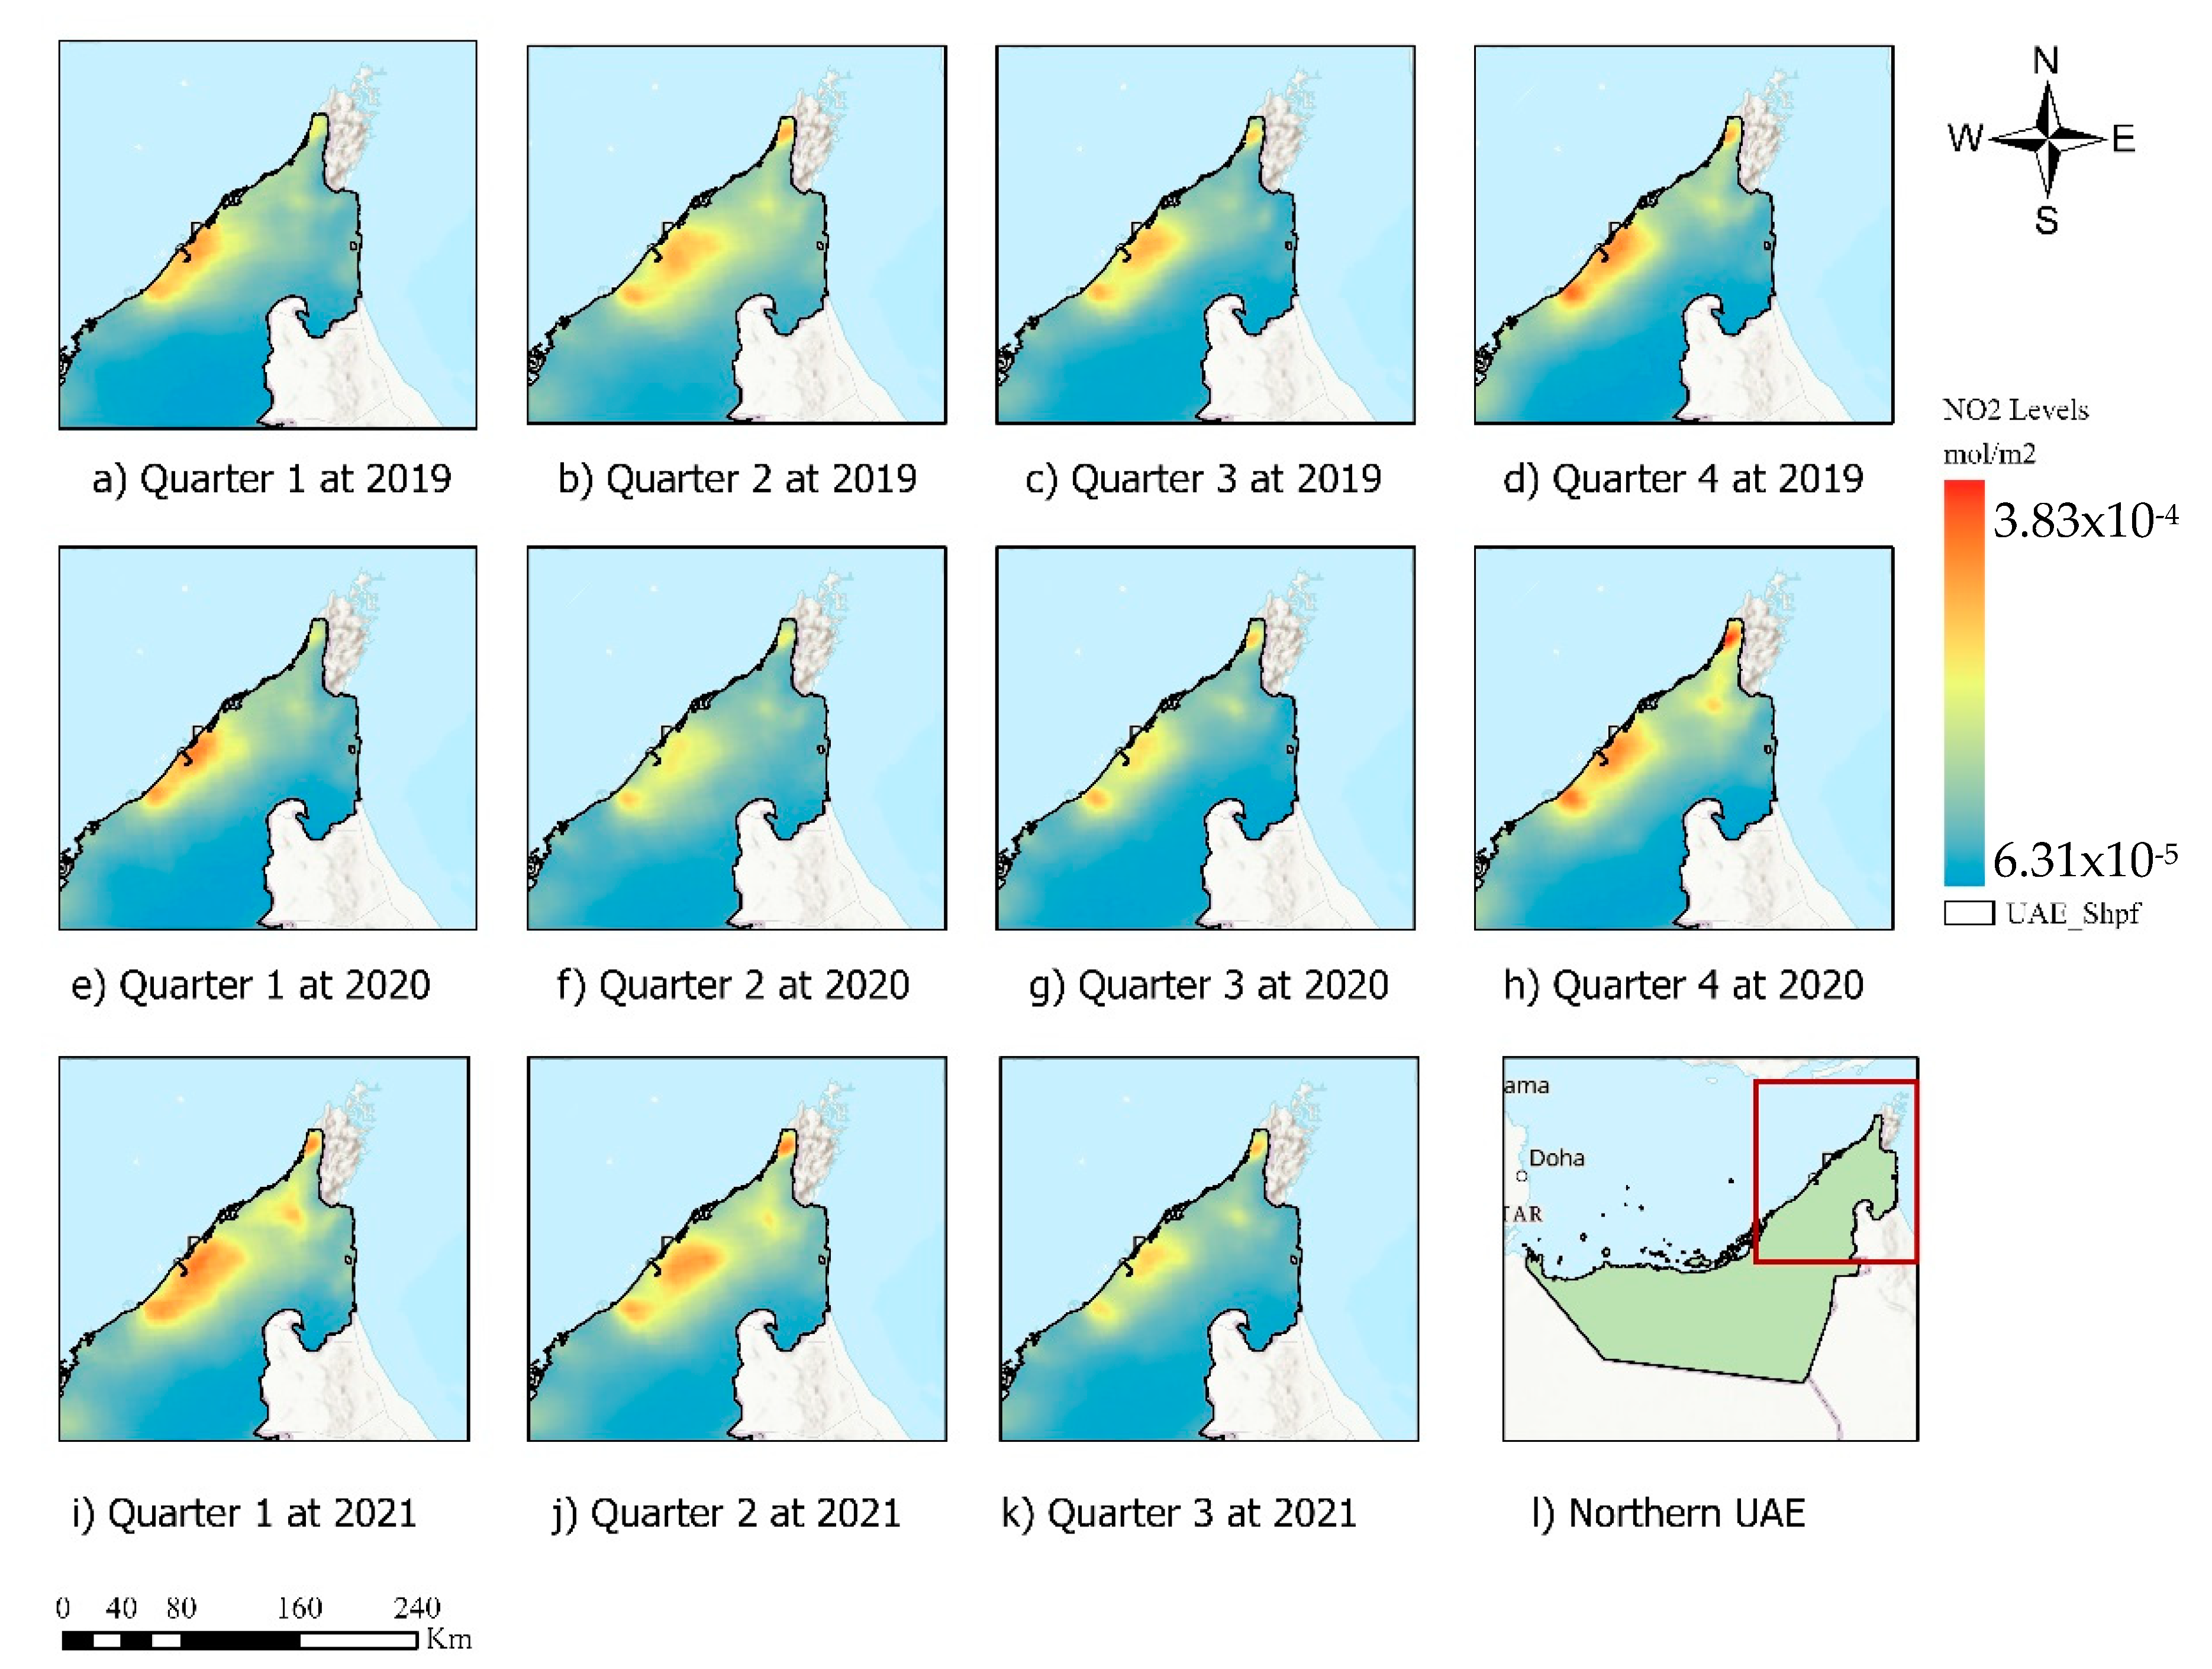
4.2.1. Satellite Image-Based Air Quality

Figure 5 shows the Sentinel-5P satellite images for NO2 levels over the UAE for the years 2019 and 2020, and from January to August 2021. Each year was divided into four quarters, and the average NO2 for each quarter is presented. Compared to 2019, Figure 5f,g shows that the second and third quarters (April to September) of 2020 were the most affected, showing significant visual reductions in NO2 levels. In 2021, the first and second quarters showed an increase in NO2 levels compared to 2020 and also to 2019 (Figure 5i,j). In the third quarter of 2021, however, the NO2 levels were slightly lower than the 2019 levels. Generally, the high levels of NO2 shown in Figure 5 correspond to the two neighboring cities of Dubai and Sharjah, which, combined, account for a large portion of the population, industrial activity, and traffic in the UAE. The transportation sector is the main source of NO2 in these cities as the industrial sector is relatively small and limited mostly to light industries. Furthermore, the total power consumption in Sharjah remained relatively unchanged during the pandemic, as demonstrated in the following section. The images show a clear drop in the NO2 levels during the COVID-19 lockdown compared to the previous year. The observed trends compel further investigation and comparison with measured air quality records at the ground monitoring station in the study area, as presented and discussed in the following section.

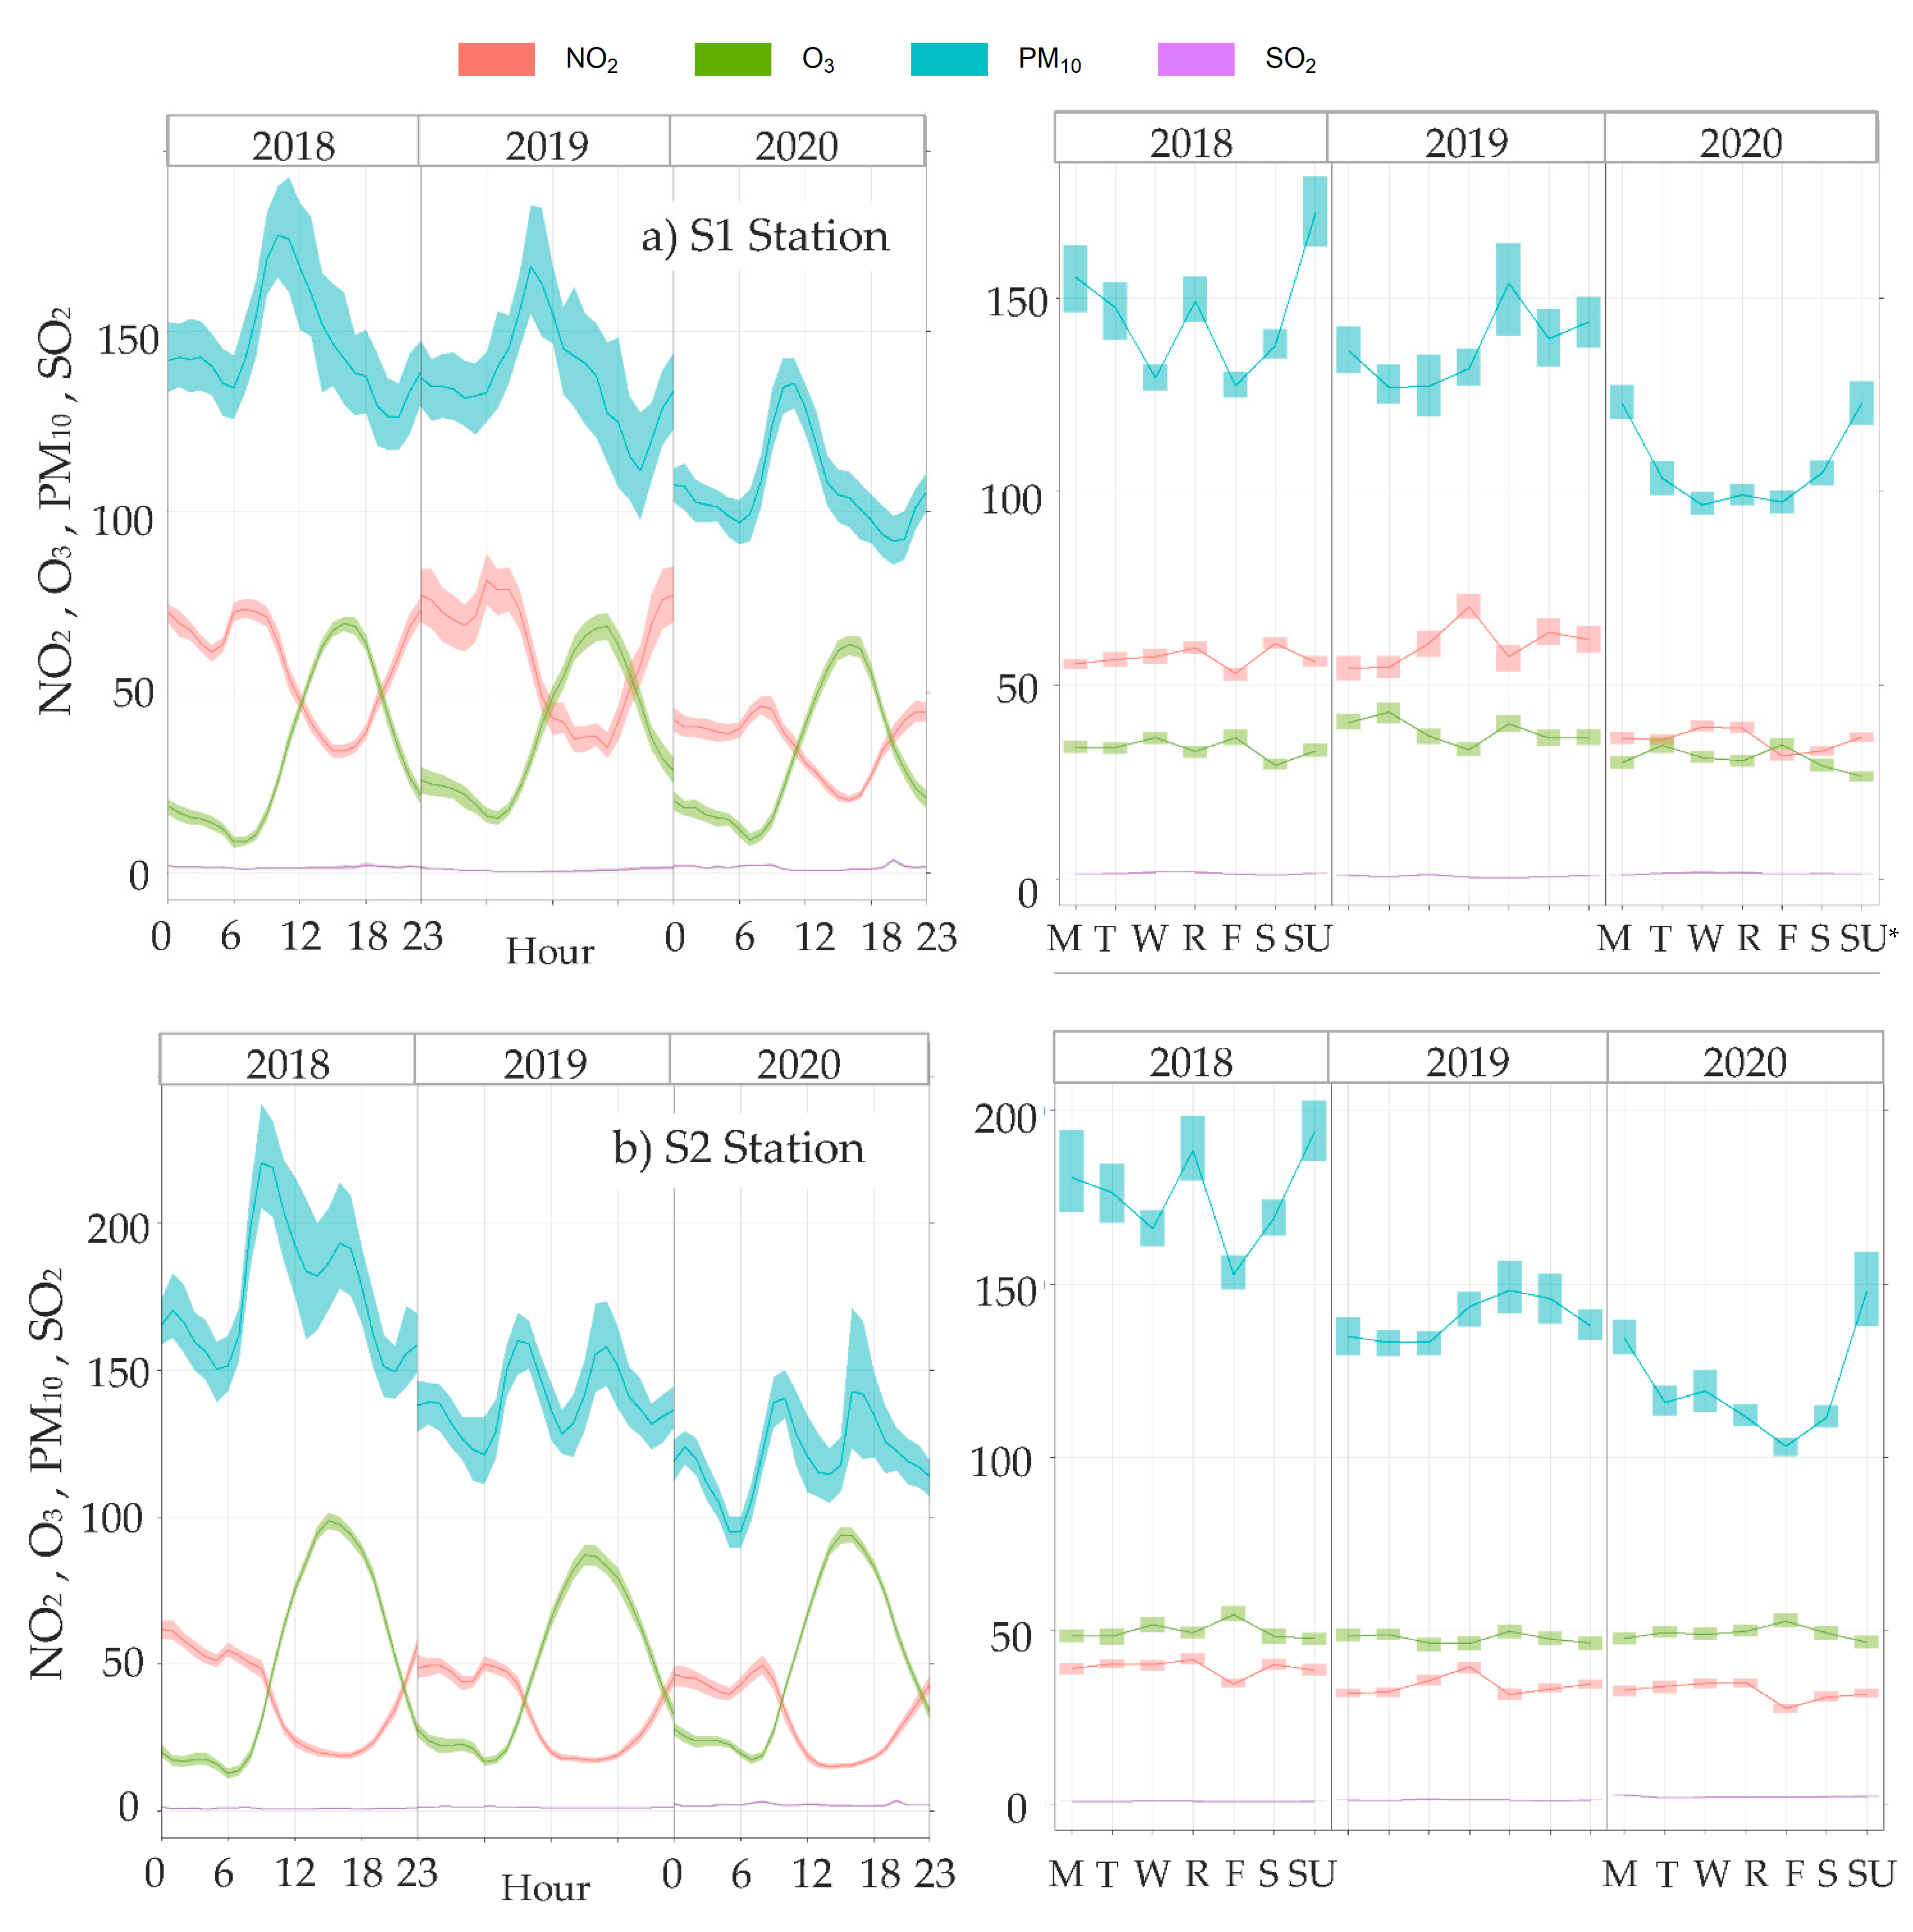
4.2.2. Ground-Based Air Quality

Figure 6 shows the spatial distribution of the six air quality monitoring stations operated by the Bee’ah company in Sharjah. Five of the six stations are within the built residential and industrial areas of the city and the sixth station is located outside the built area. The station S1 is in an urban area close to a road, S2 is in a suburban area, S3 is in an area zoned as industrial, S4 is in an urban area with mostly single detached buildings, S5 is located within a university campus, and S6 is located far from the city in a newly established neighborhood and is surrounded by detached villas and some construction sites. It should be noted that station S4 gave inconsistent data and therefore was discounted from the analysis.
Ground-based measurements can be significantly affected by meteorological conditions such as wind speed and direction. Therefore, we conducted a statistical analysis using the Spearman test (Table 5) to assess whether the wind speed and direction during the lockdown year (January to July of 2020) differed significantly from those of the same periods in the years 2018–2019 before the lockdown. The statistical analysis provides perspective on the influence of changes in wind speed and direction on the measured pollutant levels. As shown in Table 5, four of the six stations exhibited no statistical differences between the average wind speeds in 2020 compared to 2018–2019. Similarly, no statistical difference was observed in the wind direction. The results indicate that the general wind speed and direction were comparable during the COVID-19 lockdown period of 2020 and the years 2018–2019.
Figure 7 presents temporal time series analysis of the NO2, O3, PM10, and SO2 air pollutants measured in ug/m3 on an hourly basis at each of the stations between 2018 until the end of 2020. To more closely examine each station, we present at Table 6 a description of the site location of each station, a summary of the main changes in air quality during the COVID-19 lockdown, and a satellite image of the station’s location. The following paragraphs provide a brief discussion of our observations.
Figure 7a shows the hourly and weekly (left) air pollutants levels at the S1 station. The hourly data showed clear trends for the various gases during the study period: the O3 levels peaked in the afternoons and declined at night, reaching the lowest values before sunrise; the NO2 showed opposite trends to O3, reaching its lowest levels in the afternoon and the highest levels before sunrise; the PM10 levels peaked in the mornings then declined to reach their lowest levels before midnight; and the SO2 levels did not show noticeable hourly, monthly, or weekly variations. The average daily variations were less prominent compared to the hourly trends, with the PM10 and SO2 showing no definite trends. The average monthly trends showed a lack of data for the period from July 2019 to January 2020. The monthly PM10 levels peaked in July and were generally higher in summer than winter, which corresponds to the strong summer winds and strong atmospheric inversion that affect the UAE regularly during summer.
Another set of air pollution trends is shown in Figure 7b for station S2. Station S2 is in a suburban area that is mostly away from industrial and recreational activities. The NO2, O3, and SO2 measurements at S2 exhibited similar trends and comparable levels before, during, and after the pandemic Figure 7b). However, the PM10 showed a slight decrease in 2020 (on hourly, monthly, and weekly levels) compared to the other measurement periods. Figure 7c shows the air pollution measurement at the S3 station in an industrial area. As a result of its location, the air pollution level in this area was higher than its levels in the other areas. In 2020, and despite the implemented lockdown measures, the air quality as measured at the S3 station did not improve significantly. The only parameter that showed improvement is the PM10, specifically during March–July of 2020 as compared to the same periods of 2018 and 2019.
Figure 7d shows the air quality measurements at the S5 station. In 2020, the O3 levels increased and the NO2 levels decreased, especially from March to October. Additionally, the PM10 decreased but the SO2 remained at a similar level compared to 2019 and 2018.
Lastly, Figure 7e shows the air pollution records at the S6. As shown, the O3 and SO2 did not change significantly during the years 2018 to 2020; however, the NO2 levels increased slightly where the PM10 decreased in 2020.
In terms of the impact of the lockdown, the data showed significant reductions in NO2, O3, and PM10 but the SO2 levels did not show significant changes in 2020 compared to the previous years. Other than the industrial and low density areas, the NO2 levels decreased in 2020 but increased again from around August to September. The time series trends shown in Figure 7 for the air quality parameters reflected the land use in the areas surrounding the stations, with S1 showing the most impact and S6 showing the least. In areas of low population density and limited activities, the levels of NO2 and O3 in 2020 did not change dramatically compared to previous years. The PM10 levels were slightly improved in all stations in the year 2020 compared to previous years. A summary of the main variations in air quality as measured at the various monitoring stations is presented in Table 6.

4.3. Impact of COVID-19 on Utility Consumption

This section analyzes the utility consumption trends before and during the COVID-19 pandemic. The consumption data were normalized by the number of consuming units (i.e., apartments, villas, buildings, and firms) in the city.

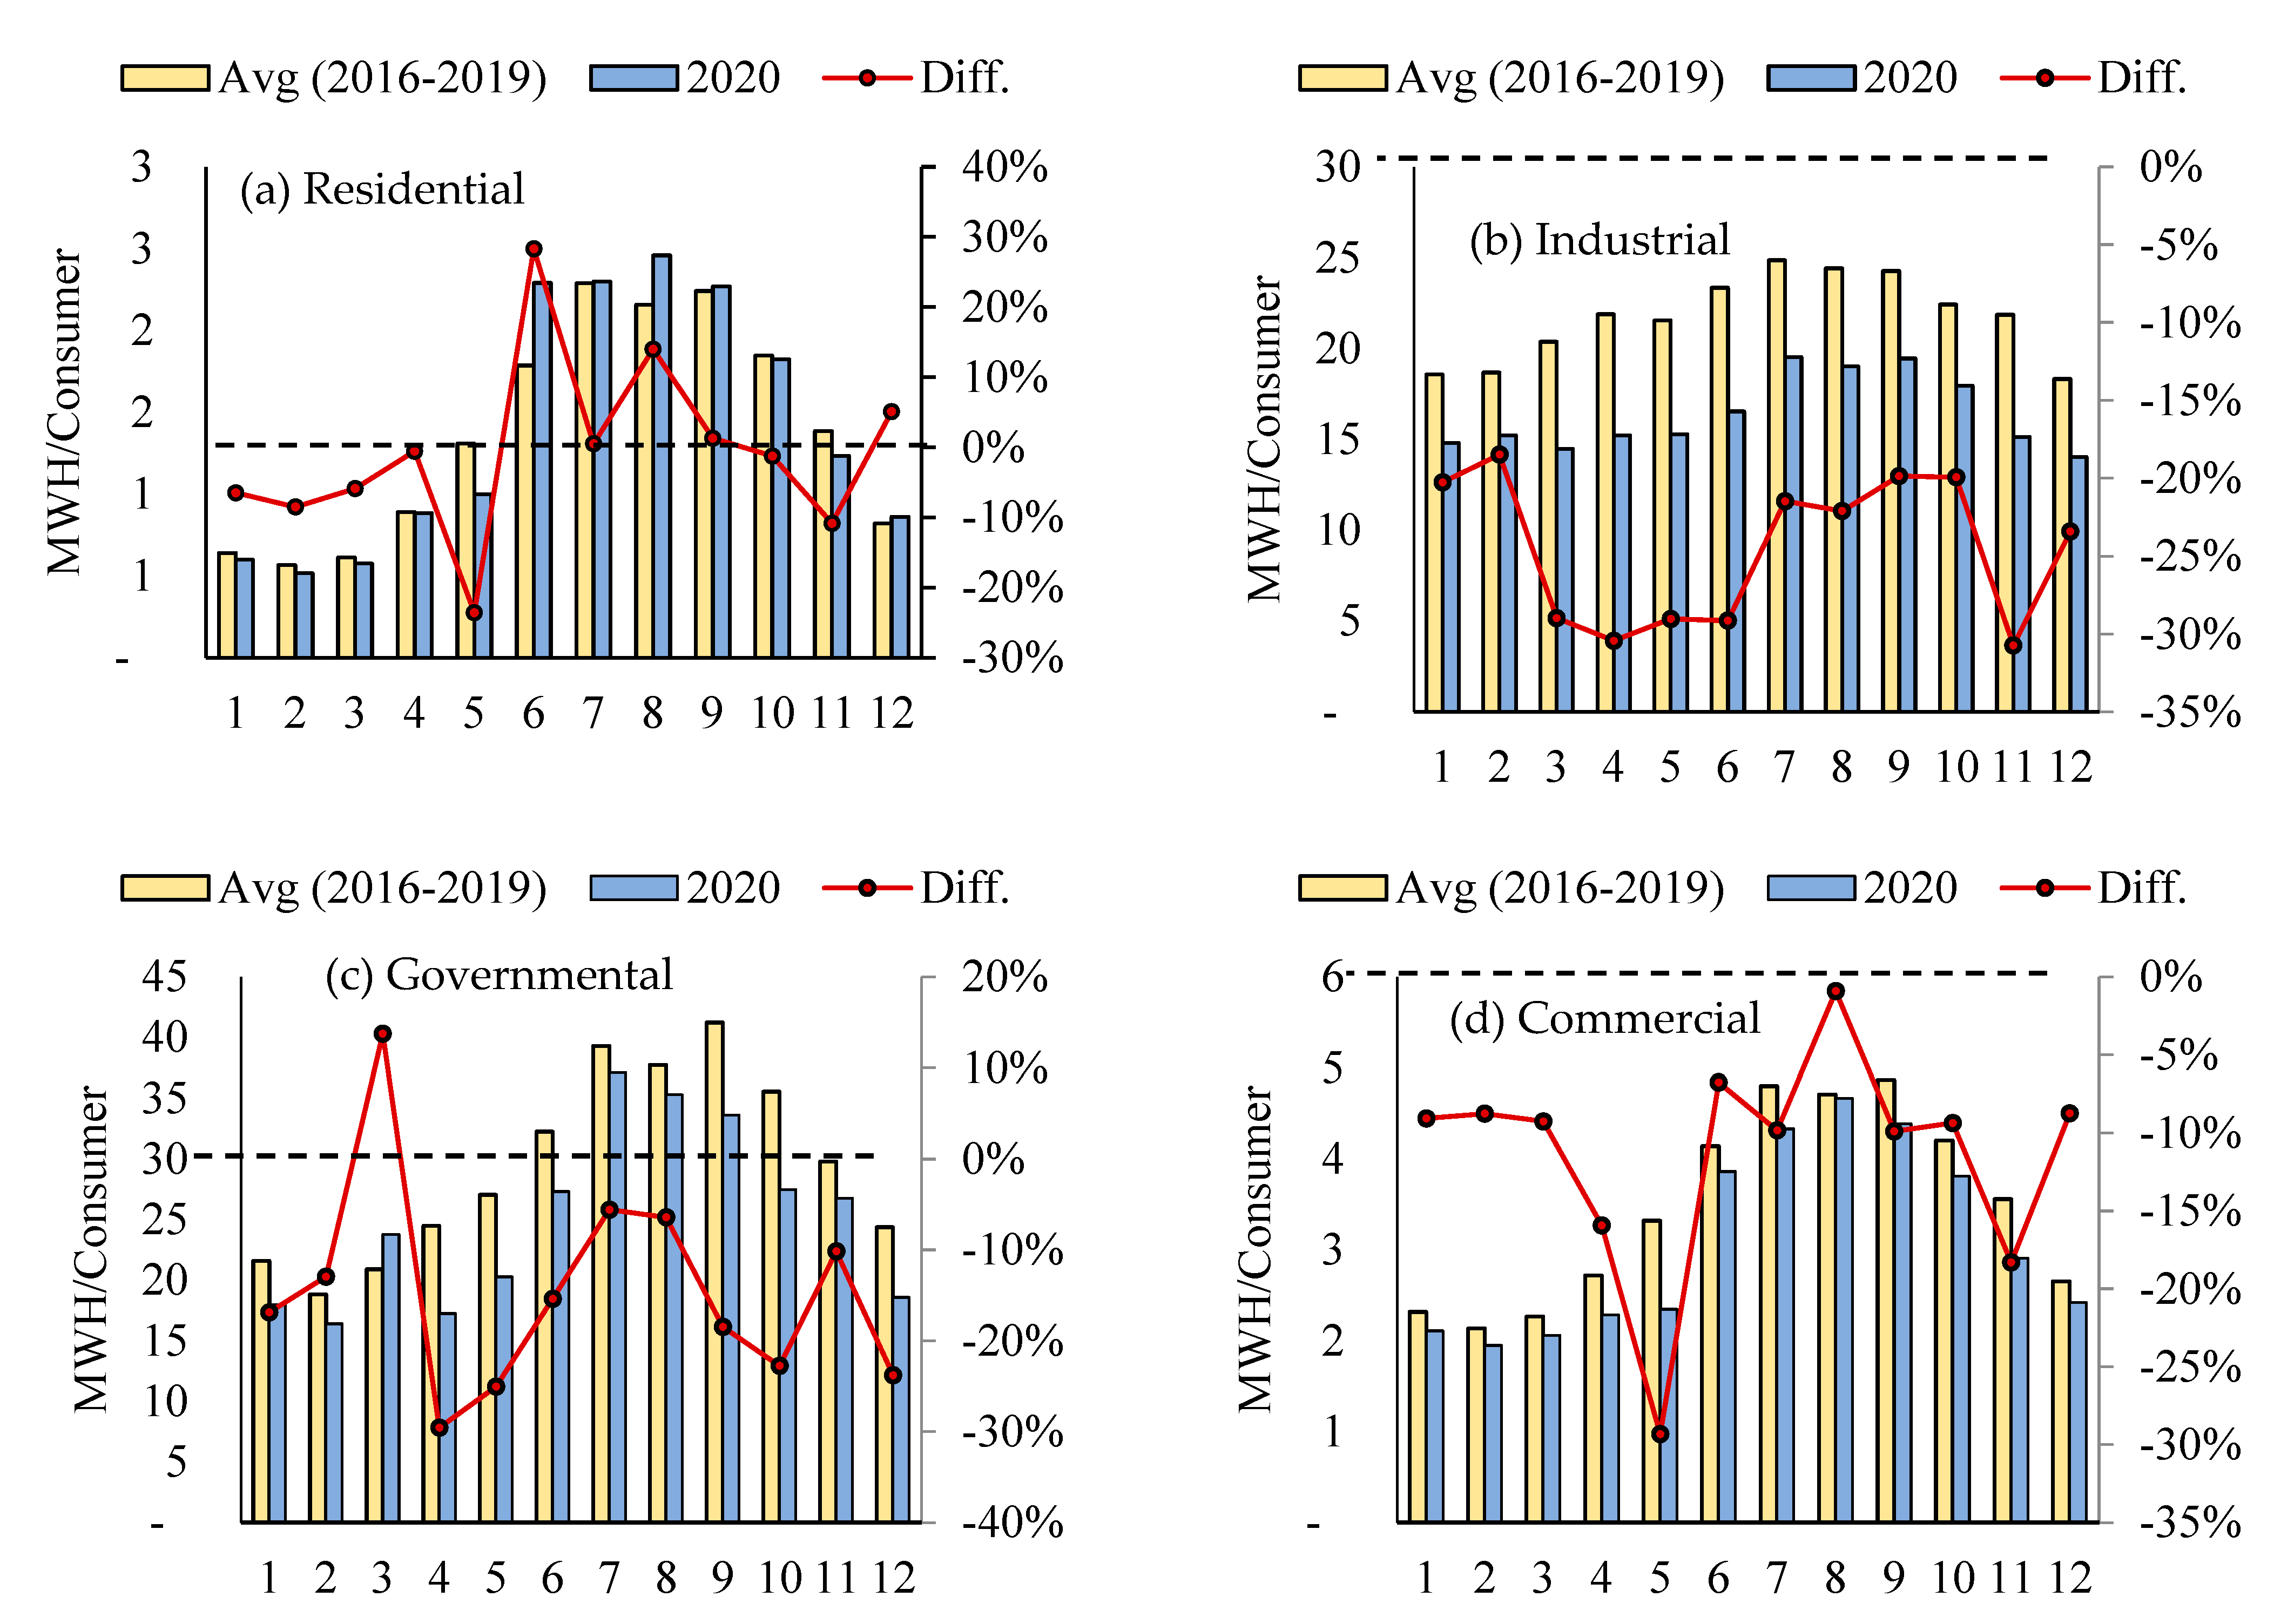
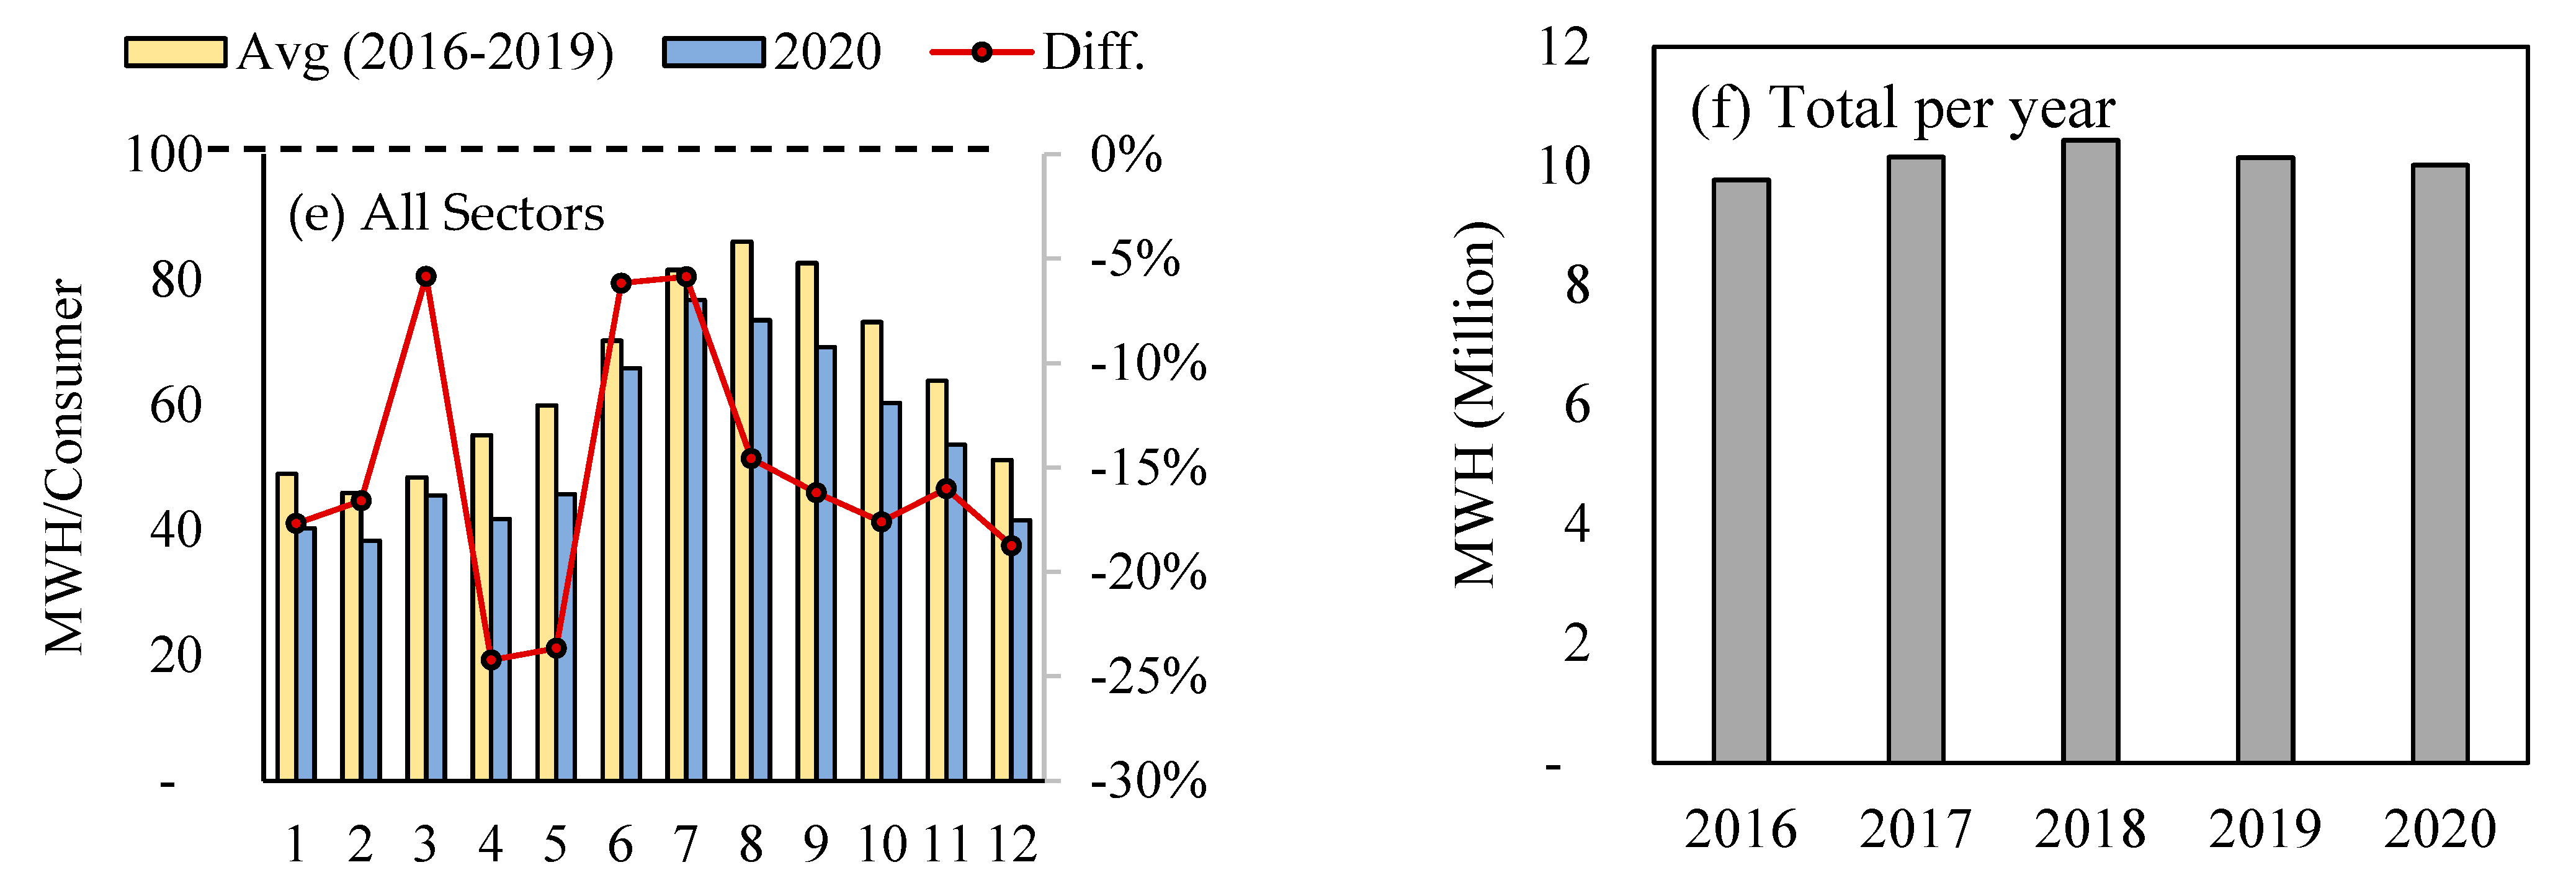
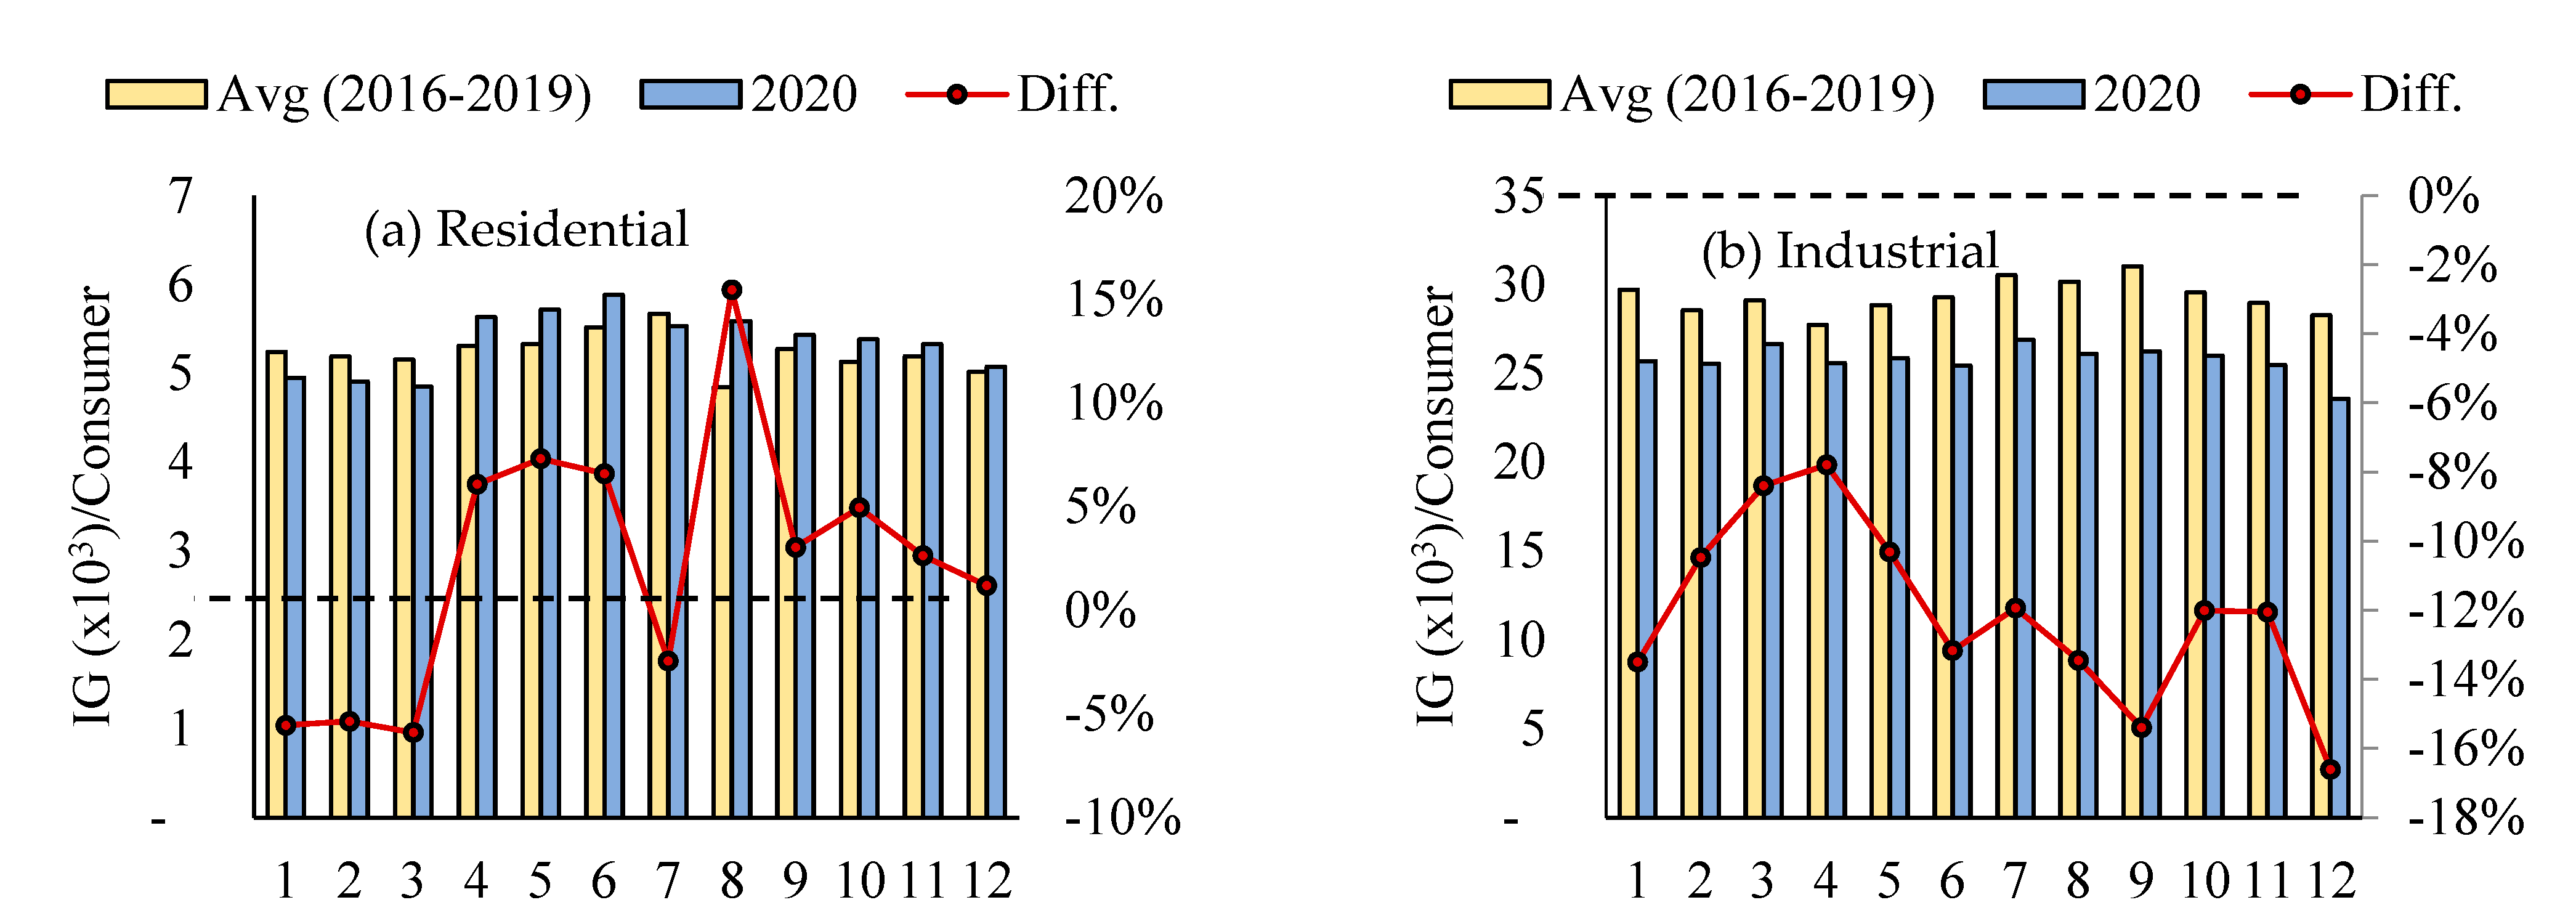
4.3.1. Electricity Consumption

Figure 8 shows the electricity consumption per consumption unit (ECCU) in Sharjah during the period 2016–2020. In Figure 8a–d, we compare the average monthly utility consumption during the years 2016–2019 with the monthly consumption during 2020’s COVID-19 lockdown period. As illustrated in Figure 8a, the residential ECCU was slightly higher during the summer of 2020 (June–August) compared to the average of 2016–2019. The increase in summer consumption may be related to restrictions on international travel, as a significant portion of the UAE population typically spends the summer vacation, which corresponds to school and university summer vacations, outside the country.
In the industrial sector (Figure 8b), the 2020 ECCU was lower than the 2016–2019 average during January and February before the implementation of the COVID-19 lockdown measures. However, the gap between the 2020 and 2016–2019 ECCU widened from March 2020 reflecting the impact of the pandemic, especially during the first few months of the lockdown. In the government and commercial sectors (Figure 8c,d), a significant drop in ECCU occurred in April of 2020 compared to previous years following the implementation of remote work and other lockdown policies. The ECCU recovered in the two sectors as the restrictions were eased but remained below the average of previous years until the end of 2020.
Overall, the combined monthly ECCU data for the various sectors presented in Figure 8e reveal the immediate impact of the COVID-19 during the months of April and May 2020, represented by a decline in ECCU as the lockdown measures became most stringent. This reduction was experienced in all sectors except Residential which increased during COVID-19 lockdown. The data also shows the recovery in ECCU starting May 2020. On the other hand, the overall ECCU remained lower in 2020 compared to the previous years, possibly reflecting the broader impact of COVID-19 on economic activity. Furthermore, the data in Figure 8f, which shows the annual ECCU for the period 2016–2020, indicate that the ECCU was highest in 2018 and then declined slightly in 2019 and 2020.

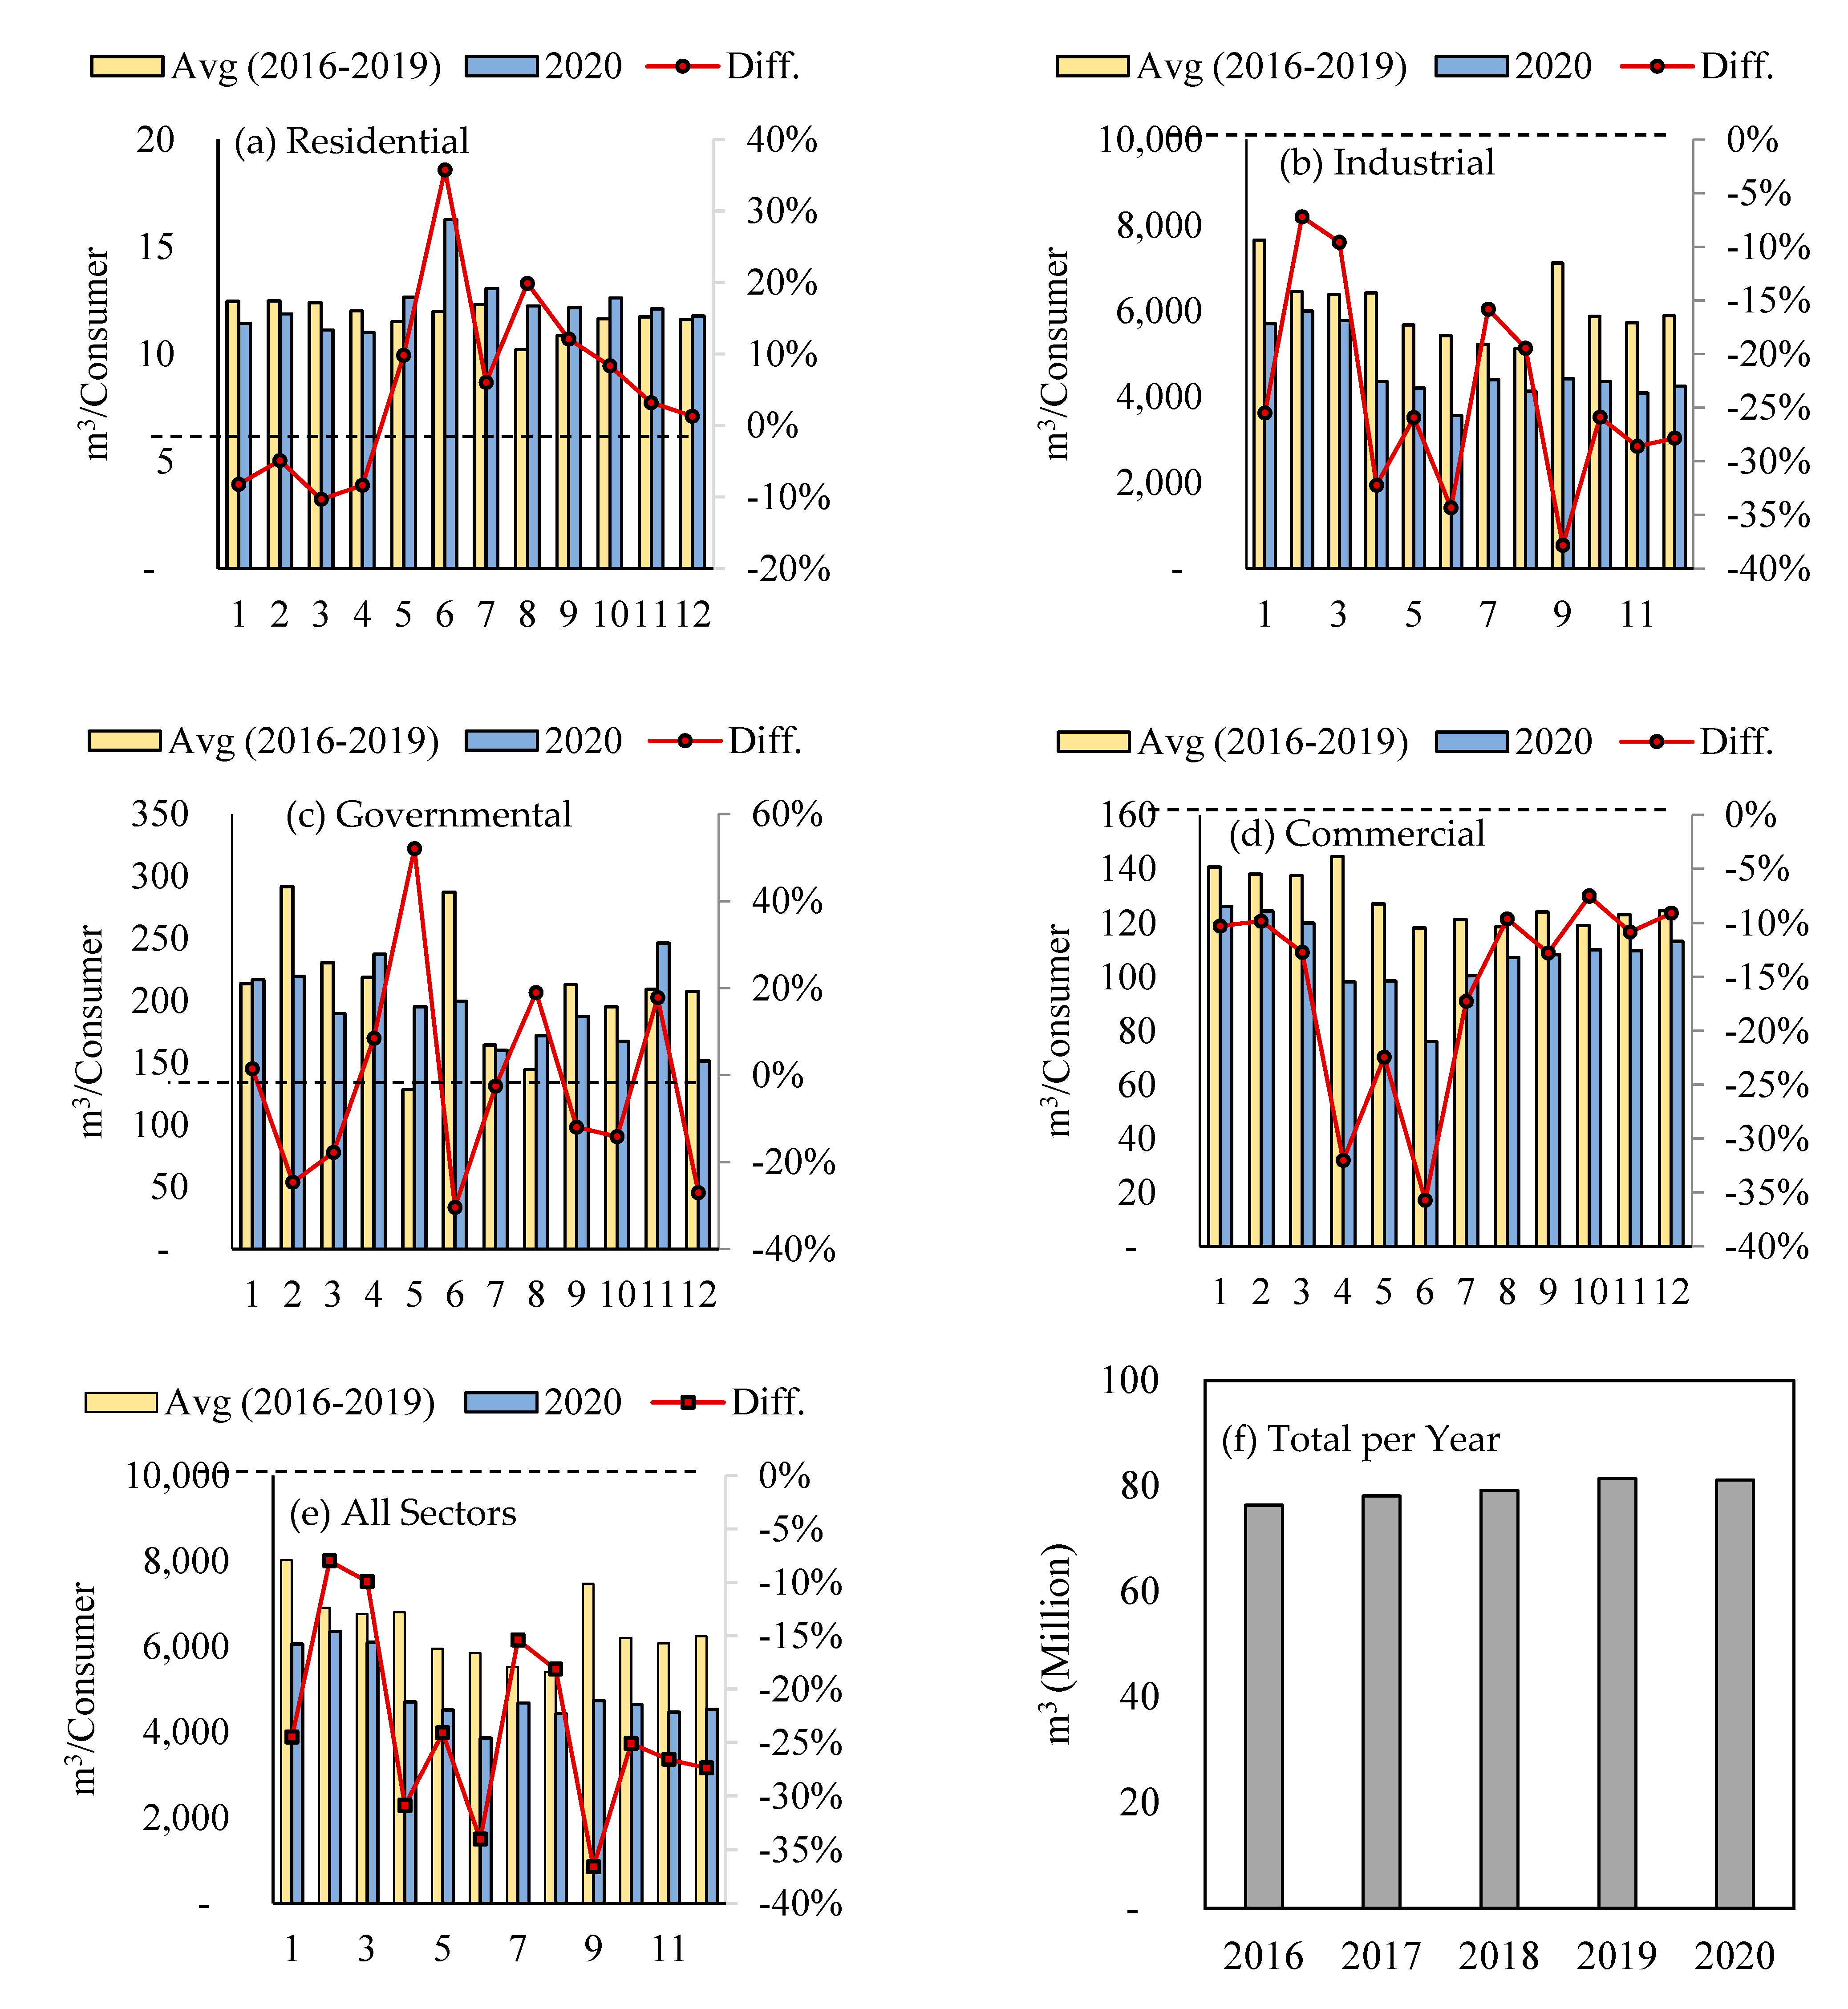
4.3.2. Water Consumption

Figure 9 shows the temporal water consumption per consuming unit (WCCU) in Sharjah for the period between 2016 and 2020. For the residential sector, as presented in Figure 9a, the WCCU in 2020 before the pandemic was lower between January to March compared to the previous years; it then surpassed consumption during the previous years from April until the end of the year. The increased consumption in the residential sector during the pandemic reflects that more people stayed home during the pandemic.
Water consumption in the industrial sector was lower throughout 2020 compared to the average of the previous years (Figure 9b). The impact of COVID-19 on water consumption in the sector was not clear from the data, although the reduction in water consumption following the pandemic increased compared to the reduction before the pandemic. In the governmental sector, the WCCU from January to July in 2020 was higher than the average of the previous years for the same period (Figure 9c). From July to September 2020, the WCCU declined below the average of the previous years. As presented in Figure 9d, the WCCU of facilities within the commercial sector observed a drop in consumption starting February 2020 until October 2020.
Overall, the monthly WCCU data for all sectors, as presented in Figure 9e, shows a decrease in the 2020 consumption compared to previous years. The only exception occurred in October, where the WCCEU in 2020 was larger than the average or previous years. This could be contributed to October’s WCCU in the governmental and commercial sectors in 2020, which witnessed a significant increase. Figure 9f shows the total temporal water consumption in Sharjah, and as can be seen, minor changes were observed.

4.3.3. Gas Consumption

Figure 10 shows the temporal gas consumption per consuming unit (GCCU) in Sharjah for the period between 2016 and 2020. The residential GCCU (Figure 10a) was lower than the average of previous years until May, then it surpassed the average of previous years until the end of the year. Figure 10b shows that GCCU in the industrial sector was lower throughout 2020 compared to the average of previous years. For the governmental sector (Figure 10c), the GCCU in 2020 was lower than the average of previous years except for in April and November. In the commercial sector (Figure 10d), the decline in GCCU became steeper from April 2020, which was just after the implementation of COVID-19 precautions, compared to previous years.
Overall, the monthly GCCU for all sectors, Figure 10e, illustrates a decline in the GCCU from March until the end of the year. Figure 10f, which shows the total temporal gas consumption for the period 2016–2020, illustrates that the gas consumption was generally consistent.
In summary, we noticed that the effect on the utility sector varied based on the utility type and sector. Some sectors showed more impact than others at different times throughout 2020, when COVID-19 restrictions were implemented. For example, the changes in electricity consumption were different in residential sectors to those in industrial sectors; the same trends were observed for water and gas consumption. Nevertheless, the total utility consumption of the city did not appear to be significantly different than in previous years; therefore, the utility consumption for all sectors balanced each other to retain a similar consumption to previous years. Thus, we hypothesize that the COVID-19 lockdown predominately impacted the mobility sector, and as a result, the city’s air quality changed. The next section will explore the relationship between mobility and air quality in Sharjah.

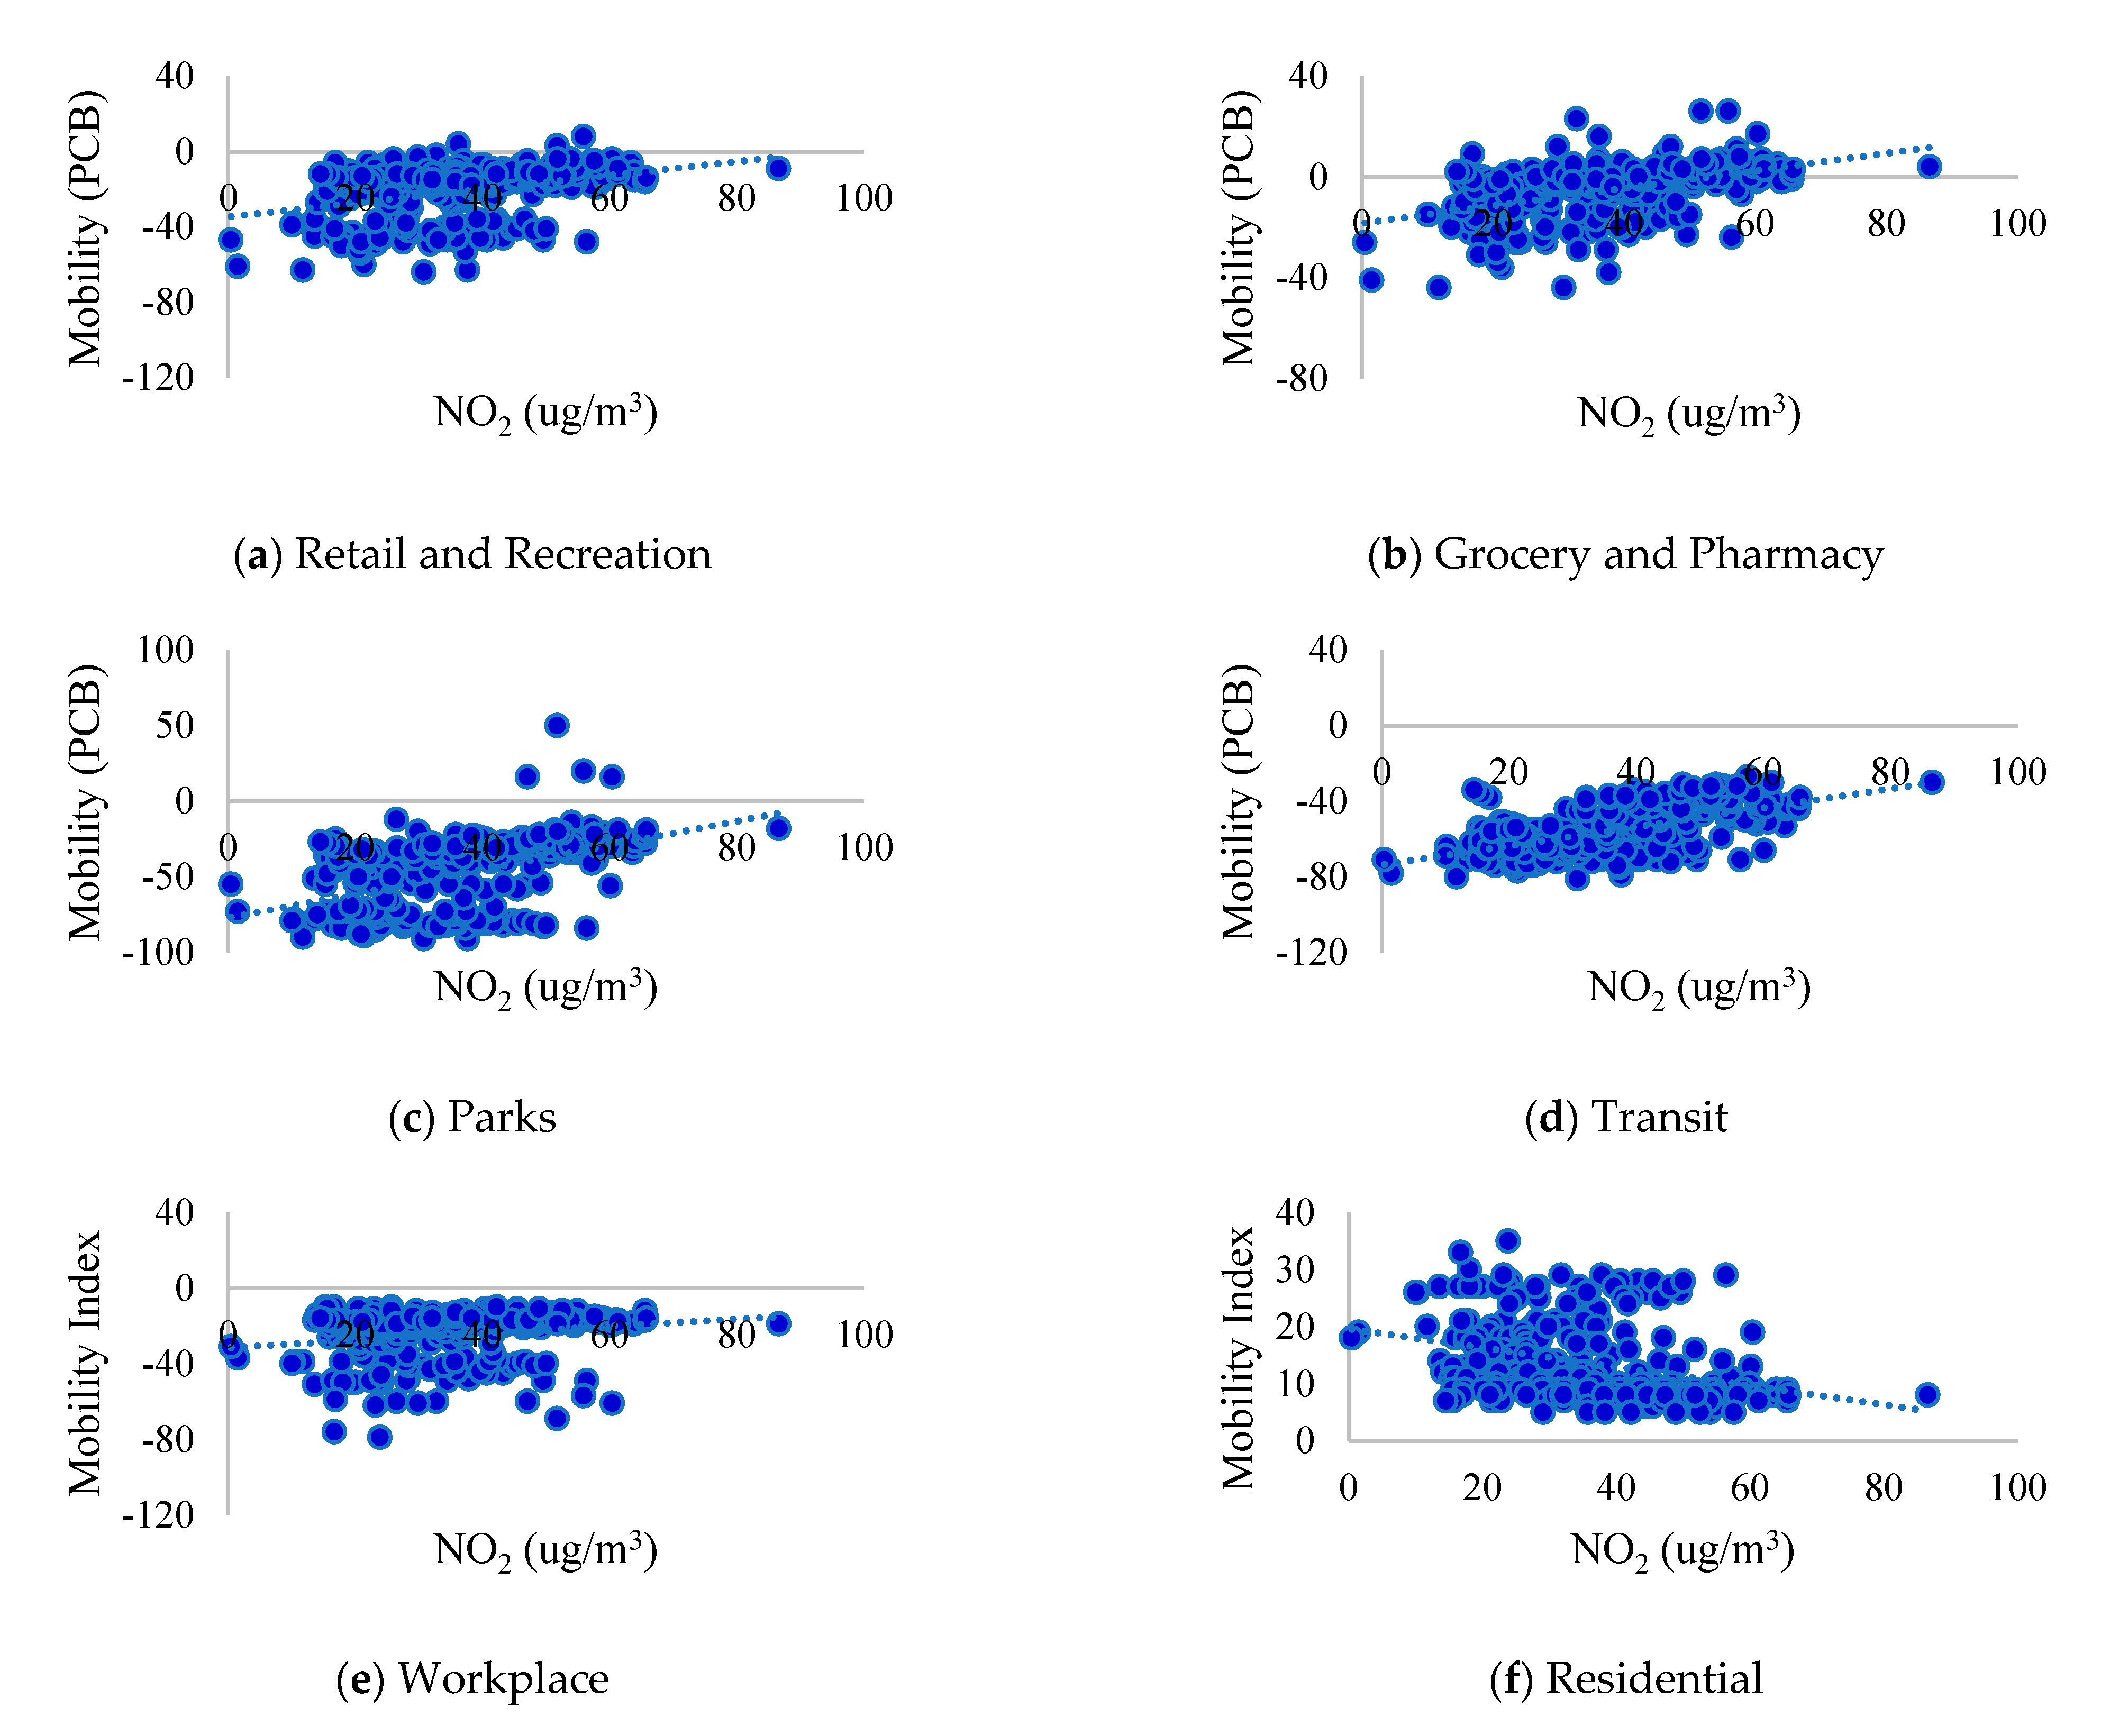
4.4. Relationship between Mobility and Air Quality

The air quality data measured by the various air monitoring stations are closely related to transportation activities. As discussed in the previous section, the pandemic did not result in major changes in electricity, water, and gas consumption in Sharjah. On the other hand, mobility was significantly affected in each sector. Therefore, the observed improvement in air quality during the lockdown in 2020 appears to be closely related to a reduction in traffic volume and changes to mobility during the pandemic. Figure 11 shows the mobility trends, expressed in terms of percentage change from the February 2020 baseline (PCB), versus NO2 levels for the S1 air quality monitoring station. The data indicate that the NO2 levels reflected the increase and decrease in mobility in the various mobility sectors during the pandemic. The lower mobility values were associated with the lower measured NO2 levels. For example, as the mobility in the residential sector increased during the pandemic, reflecting the fact that more people stayed in their homes, while the NO2 levels decreased due to lower mobility for outside activities.
Table 7 below presents the Pearson correlation between mobility at different sectors and the NO2 and O3 at stations S1, S3, and S5. The Pearson correlation is used to test the correlation between variables and to identify whether the correlation is positive or negative. Generally, the Pearson correlation coefficients ranged between −0.59 to 0.68 for the various mobility sectors depending on the location of the air quality stations (i.e., urban, industrial, or suburban). In other words, a correlation between mobility and air quality was found, but the type and magnitude of the correlation varied given the land-use location of the stations and the gas type. For instance, the correlation between mobility in the residential sector and O3 was positive, which means, as people spent more time at residential locations, the O3 levels increased. On the other hand, the correlation between mobility in the retail and recreation sector and O3 was negative, which means, as people commuted and spent time at retail and recreational facilities, the O3 levels decreased. It is important to note here that the spatial resolution of the mobility records was different from that of the air quality data. The mobility records were captured for different sectors across the whole of Sharjah. On the other hand, the air quality data were from fixed stations (a point within the city) that may not represent the response of the whole city.
It should be mentioned that the analyses presented in this article were limited to some extent by the availability of data. For instance, although the mobility data covered several sectors, the data were aggregated for the whole city and did not provide details for the various districts or roads within the city. In addition, the mobility data reflected only a fraction of users in the city, as the mobility reports were generated from participants whose electronic devices allow sharing such data. The lack of traffic data that can be correlated with people’s mobility trends before and during the lockdown was another important limitation of the study. The utility consumption data were also aggregated for the various land uses in Sharjah and lacked the level of detail to allow deeper analysis of the results. Furthermore, the number and distribution of ground monitoring stations in Sharjah did not provide enough coverage across the city to allow a more informed analysis of air quality changes.

5. Conclusions

This study mainly focused on documenting and evaluating the impact of the COVID-19 lockdown on people’s mobility patterns in various sectors (retail and recreation, grocery and pharmacy, parks, transit stations, workplace, and residential) and correlating them with air quality changes (NO2, O3, PM10, and SO2), and utility consumption (electricity, water, and gas) in Sharjah, UAE. The enforcement of the national disinfection program early in the pandemic led to a major decline in mobility across all activity sectors and a corresponding increase in mobility in the residential sector. Analysis of the mobility patterns in the various sectors revealed the parks sector was the most affected, while the grocery and pharmacy sector was the least affected. By March 2021 when most official restrictions had been lifted, the mobility across all sectors remained below the baseline mobility before the pandemic, except for the retail and recreation and grocery and pharmacy sectors.
The evaluation of NO2 levels derived from satellite observations demonstrated a significant reduction in NO2 levels during the lockdown compared to the same period in 2019. On the other hand, the changes in the ground-based air quality parameters varied from one station to another depending on its specific location and surroundings. For instance, improvements in air quality were observed at the station located in Sharjah near a major intersection, reflecting the significant reduction in mobility and the corresponding reduction in traffic. In general terms, the wind speed and direction did not change significantly during the pandemic to influence the observed air quality changes. Furthermore, analysis of the relationship between the mobility and NO2 trends revealed a significant positive correlation for all the mobility sectors except for the residential sector, which showed a significant negative correlation.
Assessment of the consumption of utilities (electricity, water, and gas) on a monthly basis for the various sectors in Sharjah (residential, industrial, governmental, and commercial) showed an overall decline in consumption in 2020 compared to the average of the previous three years. However, electricity consumption increased in the residential sector during the summer of 2020, possibly due to restrictions on the typically extensive summer holiday travel in the UAE. Furthermore, water consumption in residential areas increased in early 2020, which is consistent with the increased mobility in the sector.

Author Contributions

Conceptualization: A.S., R.A.-R., M.A.K., M.B.A.G. and K.H. Methodology: A.S., R.A.-R., M.A.K., M.B.A.G. and K.H. Formal analysis: A.S., R.A.-R., M.A.K., M.B.A.G., K.H., M.H.S. and M.A.B. Investigation and critical review: A.S. Writing—original draft preparation: A.S. and M.A.K. Writing—review and editing: A.S., R.A.-R., M.B.A.G., K.H., M.H.S. and N.A.H. Project administration: A.S., M.A., M.A.B. and S.A.M. Funding acquisition: A.S. All authors have read and agreed to the published version of the manuscript.

Funding

The authors would like to acknowledge the funding received by the University of Sharjah under the title of “Impact Assessment of COVID-19 Lockdown on Air Pollution in the UAE Using Satellite and Ground Monitoring and Potential Impacts on Human Health” under the number “CoV19-0201”.

Institutional Review Board Statement

Not applicable.

Informed Consent Statement

Not applicable.

Data Availability Statement

The mobility data analyzed in this manuscript could be found in its raw format at the following source: https://www.google.com/covid19/mobility/, accessed on 31 October 2021. The air quality data that was retrieved from Sentinel-5P satellite images could be found from here: https://developers.google.com/earth-engine/datasets/catalog/sentinel-5p, accessed on 31 October 2021. Regarding the air quality data from ground stations and data of utility consumption, the raw data of both are confidential cand cannot be shared given the instructions of the governance agencies.

Acknowledgments

The authors would like to acknowledge the support received by individuals at the University of Sharjah, Sharjah Electricity, Water, and Gas Authority (SEWA), Bee’ah Company, and Mohammed Bin Rashed Space Center (MBRSC).

Conflicts of Interest

The authors declare no conflict of interest.

References

  1. WHO Director General WHO Director-General’s Opening Remarks at the Media Briefing on COVID-19—11 March 2020. Available online: https://www.who.int/director-general/speeches/detail/who-director-general-s-opening-remarks-at-the-media-briefing-on-covid-19---11-march-2020 (accessed on 30 October 2021).
  2. Adesanya, O.A. Government preparedness and response towards COVID-19 outbreak in Nigeria: A retrospective analysis of the last 6 months. J. Glob. Health 2020, 10, 1–4. [Google Scholar] [CrossRef] [PubMed]
  3. Ohrling, M.; Øvretveit, J.; Lockowandt, U.; Brommels, M.; Sparring, V. Management of the emergency response to the SARS-CoV-2 (COVID-19) outbreak in Stockholm, Sweden, and winter preparations. J. Prim. Health Care 2020, 12, 207–214. [Google Scholar] [CrossRef]
  4. Anttiroiko, A.V. Successful government responses to the pandemic: Contextualizing national and urban responses to the COVID-19 outbreak in east and west. Int. J. E-Plan. Res. 2021, 10, 1–17. [Google Scholar] [CrossRef]
  5. Jeong, E.; Hagose, M.; Jung, H.; Ki, M. Understanding South Korea’ s Response to the COVID-19 Outbreak: A Real-Time Analysis. Int. J. Environ. Res. Public Health 2020, 17, 9571. [Google Scholar] [CrossRef]
  6. Chen, Z.; Hao, X.; Zhang, X.; Chen, F. Have traffic restrictions improved air quality? A shock from COVID-19. J. Clean. Prod. 2021, 279, 123622. [Google Scholar] [CrossRef]
  7. Elshorbany, Y.F.; Kapper, H.C.; Ziemke, J.R.; Parr, S.A. The status of air quality in the united states during the covid-19 pandemic: A remote sensing perspective. Remote Sens. 2021, 13, 369. [Google Scholar] [CrossRef]
  8. Masum, M.H.; Pal, S.K. Statistical evaluation of selected air quality parameters influenced by COVID-19 lockdown. Glob. J. Environ. Sci. Manag. 2020, 6, 85–94. [Google Scholar] [CrossRef]
  9. Alemdar, K.D.; Kaya, Ö.; Canale, A.; Çodur, M.Y.; Campisi, T. Evaluation of air quality index by spatial analysis depending on vehicle traffic during the COVID-19 outbreak in Turkey. Energies 2021, 14, 5729. [Google Scholar] [CrossRef]
  10. Adams, M.D. Air pollution in Ontario, Canada during the COVID-19 State of Emergency. Sci. Total Environ. 2020, 742, 140516. [Google Scholar] [CrossRef]
  11. Tyagi, B.; Choudhury, G.; Vissa, N.K.; Singh, J.; Tesche, M. Changing air pollution scenario during COVID-19: Redefining the hotspot regions over India. Environ. Pollut. 2021, 271, 116354. [Google Scholar] [CrossRef]
  12. Maheswari, S.; Pethannan, R.; Sabarimurugan, S. Air pollution enhances susceptibility to novel coronavirus (COVID–19) infection—An impact study. Environ. Health Toxicol. 2020, 35, 1–7. [Google Scholar] [CrossRef] [PubMed]
  13. Bekbulat, B.; Apte, J.S.; Millet, D.B.; Robinson, A.L.; Wells, K.C.; Presto, A.A.; Marshall, J.D. Changes in criteria air pollution levels in the US before, during, and after Covid-19 stay-at-home orders: Evidence from regulatory monitors. Sci. Total Environ. 2021, 769, 144693. [Google Scholar] [CrossRef]
  14. Mehmood, K.; Bao, Y.; Abrar, M.M.; Petropoulos, G.P.; Saifullah; Soban, A.; Saud, S.; Khan, Z.A.; Khan, S.M.; Fahad, S. Spatiotemporal variability of COVID-19 pandemic in relation to air pollution, climate and socioeconomic factors in Pakistan. Chemosphere 2021, 271, 129584. [Google Scholar] [CrossRef] [PubMed]
  15. Li, L.; Li, Q.; Huang, L.; Wang, Q.; Zhu, A.; Xu, J.; Liu, Z.; Li, H.; Shi, L.; Li, R.; et al. Air quality changes during the COVID-19 lockdown over the Yangtze River Delta Region: An insight into the impact of human activity pattern changes on air pollution variation. Sci. Total Environ. 2020, 732, 139282. [Google Scholar] [CrossRef] [PubMed]
  16. Liu, Q.; Harris, J.T.; Chiu, L.S.; Sun, D.; Houser, P.R.; Yu, M.; Duffy, D.Q.; Little, M.M.; Yang, C. Spatiotemporal impacts of COVID-19 on air pollution in California, USA. Sci. Total Environ. 2021, 750, 141592. [Google Scholar] [CrossRef] [PubMed]
  17. Wang, S.; Liu, Y.; Hu, T. Examining the change of human mobility adherent to social restriction policies and its effect on COVID-19 cases in Australia. Int. J. Environ. Res. Public Health 2020, 17, 7930. [Google Scholar] [CrossRef] [PubMed]
  18. Orak, N.H.; Ozdemir, O. The impacts of COVID-19 lockdown on PM10 and SO2 concentrations and association with human mobility across Turkey. Environ. Res. 2021, 197, 111018. [Google Scholar] [CrossRef]
  19. Berman, J.D.; Ebisu, K. Changes in U.S. air pollution during the COVID-19 pandemic. Sci. Total Environ. 2020, 739, 139864. [Google Scholar] [CrossRef]
  20. Skirienė, A.F.; Stasiškienė, Ž. COVID-19 and air pollution: Measuring pandemic impact to air quality in five European countries. Atmosphere 2021, 12, 290. [Google Scholar] [CrossRef]
  21. Stübinger, J.; Schneider, L. Epidemiology of Coronavirus COVID-19: Forecasting the Future Incidence in Different Countries. Healthcare 2020, 8, 99. [Google Scholar] [CrossRef] [Green Version]
  22. Wei, J.; Guo, S.; Long, E.; Zhang, L.; Shu, B.; Guo, L. Why does the spread of COVID-19 vary greatly in different countries? Revealing the efficacy of face masks in epidemic prevention. Epidemiol. Infect. 2021, 149, 1–17. [Google Scholar] [CrossRef] [PubMed]
  23. Jabbar, S.I. Automated analysis of fatality rates for COVID 19 across different countries. Alex. Eng. J. 2021, 60, 521–526. [Google Scholar] [CrossRef]
  24. Hale, T.; Noam, A.; Beatriz, K.; Petherick, A.; Phillips, T.; Webster, S. Variations in Government Responses to COVID-19; BSG-WP-2020/032; Oxford, UK, 2020; Available online: https://www.bsg.ox.ac.uk/sites/default/files/2020-12/BSG-WP-2020-032-v10.pdf (accessed on 30 October 2021).
  25. de Villiers, C.; Cerbone, D.; Van Zijl, W. The South African government’s response to COVID-19. J. Public Budg. Account. Financ. Manag. 2020, 32, 797–811. [Google Scholar] [CrossRef]
  26. Kim, S.; Castro, M.C. Spatiotemporal pattern of COVID-19 and government response in South Korea (as of May 31, 2020). Int. J. Infect. Dis. 2020, 98, 328–333. [Google Scholar] [CrossRef] [PubMed]
  27. Arendt, F.; Markiewitz, A.; Mestas, M.; Scherr, S. COVID-19 pandemic, government responses, and public mental health: Investigating consequences through crisis hotline calls in two countries. Soc. Sci. Med. 2020, 265, 113532. [Google Scholar] [CrossRef]
  28. Sarkodie, S.A.; Owusu, P.A. Global assessment of environment, health and economic impact of the novel coronavirus (COVID-19). Environ. Dev. Sustain. 2020, 23, 5005–5015. [Google Scholar] [CrossRef]
  29. Xu, H.; Yan, C.; Fu, Q.; Xiao, K.; Yu, Y.; Han, D.; Wang, W.; Cheng, J. Possible environmental effects on the spread of COVID-19 in China. Sci. Total Environ. 2020, 731, 139211. [Google Scholar] [CrossRef]
  30. Sarkodie, S.A.; Owusu, P.A. Global effect of city-to-city air pollution, health conditions, climatic & socio-economic factors on COVID-19 pandemic. Sci. Total Environ. 2021, 778, 146394. [Google Scholar] [CrossRef]
  31. Eroğlu, H. Effects of Covid-19 outbreak on environment and renewable energy sector. Environ. Dev. Sustain. 2021, 23, 4782–4790. [Google Scholar] [CrossRef]
  32. Radic, A.; Lück, M.; Ariza-Montes, A.; Han, H. Fear and trembling of cruise ship employees: Psychological effects of the COVID-19 pandemic. Int. J. Environ. Res. Public Health 2020, 17, 6741. [Google Scholar] [CrossRef]
  33. Cortés-Álvarez, N.Y.; Vuelvas-Olmos, C.R. COVID 19: Psychological Effects and Associated Factors in Mexican Nurses. Disaster Med. Public Health Prep. 2020, 1–17. [Google Scholar] [CrossRef] [PubMed]
  34. Russo, C.; Simeone, M.; Demartini, E.; Marescotti, M.E.; Gaviglio, A. Psychological pressure and changes in food consumption: The effect of COVID-19 crisis. Heliyon 2021, 7, e06607. [Google Scholar] [CrossRef] [PubMed]
  35. Ripon, R.K.; Mim, S.S.; Puente, A.E.; Hossain, S.; Babor, M.M.H.; Sohan, S.A.; Islam, N. COVID-19: Psychological effects on a COVID-19 quarantined population in Bangladesh. Heliyon 2020, 6, e05481. [Google Scholar] [CrossRef] [PubMed]
  36. Google COVID-19 Community Mobility Reports. Available online: https://www.google.com/covid19/mobility/ (accessed on 1 July 2021).
  37. Google Overview—Community Mobility Reports Help. Available online: https://support.google.com/covid19-mobility/answer/9824897?hl=en (accessed on 1 July 2021).
  38. The European Space Agency Sentinel-5P. Available online: https://sentinels.copernicus.eu/web/sentinel/missions/sentinel-5p (accessed on 23 August 2021).
  39. Coronavirus Preventive Measure in the UAE: Nurseries to Be Closed from Tomorrow, March 1. Available online: https://gulfnews.com/uae/education/coronavirus-preventive-measure-in-the-uae-nurseries-to-be-closed-from-tomorrow-march-1-1.1582973368188 (accessed on 1 October 2020).
  40. Bashir, H.; Alfaham, T. Emirates News Agency—Sharjah Human Resources Department Announces Remote Work for Pregnant, Disabled and Elderly. Available online: https://wam.ae/en/details/1395302830672 (accessed on 1 May 2021).
  41. Shaaban, A. Coronavirus: Prayers at UAE Mosques, Other Places of Worship Suspended for Four Weeks—News|Khaleej Times. Available online: https://www.khaleejtimes.com/coronavirus/coronavirus-prayers-at-uae-mosques-other-places-of-worship-suspended-for-four-weeks (accessed on 1 May 2021).
  42. Sharjah Closes Cinemas, Parks and Gyms Until the End of March|News|Time Out Sharjah. Available online: https://www.timeoutsharjah.com/news/436831-sharjah-closes-cinemas-parks-and-gyms-until-the-end-of-march (accessed on 1 May 2021).
  43. Coronavirus Remote Work: Maximum 30% of Company Workforce Allowed to Work from Office in Private Sector|Government—Gulf News. Available online: https://gulfnews.com/uae/government/coronavirus-remote-work-maximum-30-of-company-workforce-allowed-to-work-from-office-in-private-sector-1.1585249590247 (accessed on 1 May 2021).
  44. COVID-19: Commercial Centers in Sharjah to Reopen on May 3|Government—Gulf News. Available online: https://gulfnews.com/uae/government/covid-19-commercial-centers-in-sharjah-to-reopen-on-may-3-1.1588362162481 (accessed on 1 May 2021).
  45. List of Public Holidays in the UAE for 2020|News-Photos—Gulf News. Available online: https://gulfnews.com/photos/news/list-of-public-holidays-in-the-uae-for-2020-1.1578219844739 (accessed on 1 May 2021).
  46. Mohamed, H.; Bashir, H. Emirates News Agency—30% of Sharjah Government Employees Back to Offices from June 14. Available online: https://wam.ae/en/details/1395302848079 (accessed on 1 July 2021).
  47. National Disinfection Programme—The Official Portal of the UAE Government. Available online: https://u.ae/en/information-and-services/justice-safety-and-the-law/handling-the-covid-19-outbreak/national-disinfection-programme (accessed on 1 June 2021).
  48. COVID-19: Sharjah to Reopen Cinemas, Private Beaches, Gyms, Parks and Swimming Pools from June 24|Uae—Gulf News. Available online: https://gulfnews.com/uae/covid-19-sharjah-to-reopen-cinemas-private-beaches-gyms-parks-and-swimming-pools-from-june-24-1.1592739602881 (accessed on 1 July 2021).
  49. Alfaham, T. Emirates News Agency—50% of Sharjah Government Employees to Return to Offices: SDHR. Available online: http://www.wam.ae/en/details/1395302850401 (accessed on 1 July 2021).
  50. Mohamed, H. UAE Announces Gradual Reopening of Mosques, Other Places of Worship from 1st July—Ministry of Health and Prevention—UAE. Available online: https://wam.ae/en/details/1395302852048 (accessed on 1 July 2021).
  51. Alfaham, T.; AAMIR, M. Emirates News Agency—100% of Sharjah Government Employees to Return to Offices Next Sunday: SDHR. Available online: http://www.wam.ae/en/details/1395302855070 (accessed on 25 July 2021).
  52. Re-Opening of Nurseries with Precautionary Measures Amid COVID-19—The Official Portal of the UAE Government. Available online: https://gov10.bnsights.com/en/information-and-services/education/opening-of-nurseries-with-precautionary-measures-amid-covid-19 (accessed on 23 August 2021).
  53. Ahmed, A.A. Sharjah to Reopen Wedding, Event Halls from November 1—News|Khaleej Times. Available online: https://www.khaleejtimes.com/uae/sharjah-to-reopen-wedding-event-halls-from-november-1 (accessed on 30 October 2021).
  54. Nagraj, A. Covid-19: Sharjah Announces Restrictions, Cuts Capacity at Malls, Gyms and Cinemas. Available online: https://gulfbusiness.com/covid-19-sharjah-announces-restrictions-cuts-capacity-at-malls-gyms-and-cinemas/ (accessed on 1 March 2021).
  55. Mansoor, Z. Covid-19: Sharjah Announces Remote Working for Federal Employees. Available online: https://gulfbusiness.com/covid-19-sharjah-announces-remote-working-for-federal-employees/ (accessed on 1 March 2021).
  56. Bashir, H. Emirates News Agency—MoHAP & MoI to Conduct “National Disinfection Programme” for All Public Utilities, Public Transport over Weekend. Available online: https://wam.ae/en/details/1395302833041 (accessed on 1 June 2021).
  57. Coronavirus: All UAE Beaches, Parks and Swimming Pools to Close from Sunday|The National. Available online: https://www.thenationalnews.com/uae/government/coronavirus-all-uae-beaches-parks-and-swimming-pools-to-close-from-sunday-1.995480 (accessed on 1 October 2020).
  58. Sharjah Public Beaches Reopen, Residents Urged to Follow Coronavirus Safety Measures—News|Khaleej Times. Available online: https://www.khaleejtimes.com/uae/sharjah-public-beaches-reopen-residents-urged-to-follow-coronavirus-safety-measures (accessed on 1 October 2020).
Figure 1. Study area showing Sharjah * on a map of the UAE.
Sustainability 14 01767 g001
Figure 2. Overall methodology framework.
Sustainability 14 01767 g002
Figure 3. Confirmed COVID-19 cases and number of vaccination doses in the UAE.
Sustainability 14 01767 g003
Figure 4. Mobility trends (percent change from the February 2020 baseline, PCB) in Sharjah between February 2020 and June 2021.
Sustainability 14 01767 g004
Figure 5. NO2 Levels retrieved from Sentinel-5P satellite images for the years 2019–2021.
Sustainability 14 01767 g005
Figure 6. Location of air quality ground monitoring stations in Sharjah.
Sustainability 14 01767 g006
Figure 7. Air Quality Data from Ground-Monitoring Stations in Sharjah. The Measured Parameters are: NO2, O3, PM10, and SO2. * M: Monday; T: Tuesday; W: Wednesday; R: Thursday; F: Friday; S: Saturday; SU: Sunday.
Sustainability 14 01767 g007aSustainability 14 01767 g007b
Figure 8. Temporal electricity consumption per consumer based on land use.
Sustainability 14 01767 g008aSustainability 14 01767 g008b
Figure 9. Temporal water consumption per consumer based on land use.
Sustainability 14 01767 g009aSustainability 14 01767 g009b
Figure 10. Temporal gas consumption per consumer based on land use.
Sustainability 14 01767 g010
Figure 11. Coefficient of determination of mobility vs. NO2 levels at S1—Khezamia.
Sustainability 14 01767 g011
Table 1. Sample of air quality data (ug/m3) at one of the installed stations in Sharjah city.
DateSO2NO2COO3PM10Wind Speed (m/s)
1 January 2018 00:00:00 UTC3.5471.751.520.63129.000.66
1 January 2018 01:00:00 UTC1.3777.081.450.03136.001.14
1 January 2018 02:00:00 UTC1.1768.251.750.81182.250.66
1 January 2018 03:00:00 UTC1.1747.801.720.14201.000.39
1 January 2018 04:00:00 UTC0.8645.801.512.49187.000.26
1 January 2018 05:00:00 UTC1.0351.501.570.12168.000.17
1 January 2018 06:00:00 UTC0.4752.051.340.92124.000.14
1 January 2018 07:00:00 UTC0.8553.481.270.00131.000.26
Table 2. Sample of electricity consumption (KWH) in Sharjah across different sectors in 2018.
ResidentialIndustrialGovernmentalCommercialTotal
January141.999.464.4196.3503.0
February134.097.358.3181.0471.8
March157.1118.267.4199.7543.5
April246.6131.882.9255.9718.6
May332.0121.790.0314.8860.4
June454.0118.4104.2364.71043.6
July530.1143.1121.0421.21218.0
Table 3. Dates of different safety policies implemented and public holidays.
SP/PHWeek #DatesSafety Policies Implemented
SP1Week 101 MarchSuspension of all nurseries in Sharjah
SP2Week 118 MarchClosure of schools and universities
SP3Week 1215 MarchRemote work system enforced in Sharjah
SP3Week 1216 March Closure of recreational activities and parks
SP3Week 1216 MarchUAE bans prayers at all places of worship
SP4Week 1324 MarchClosure of malls, shopping centers, and restaurants
SP4Week 1326 MarchThe NDP was launched (8:00 p.m. to 6:00 a.m. travel restrictions)
SP5Week 1429 MarchActivation of remote work (only 30% in-person capacity)
SP6Week 193 May Reopening of malls, shopping centers, and restaurants
PH1Week 2224 May Beginning of Eid al-Fitr (four days holiday)
SP7Week 2514 June30% (max.) of government employees back to offices
SP8Week 2624 JuneThe NDP was completed (10 h travel restrictions were lifted)
SP8Week 2624 June Reopening recreational activities and parks
SP9Week 2728 June 50% of Sharjah government employees back to offices
SP9Week 271 July Reopening of mosques and other places of worship
SP10Week 3019 July 100% of government employees back to offices
PH2Week 3130 July Beginning of Eid al-Adha (five day holiday)
SP11Week 328 August Reopening of all public beaches in Sharjah
PH3Week 3523 August Islamic New Year (one day holiday)
SP12Week 3527 August Nurseries and childcare centers are allowed to re-open
PH4Week 4429 October Commemoration of Prophet Mohammad’s birthday (one day holiday)
SP13Week 451 November Resumption of social events in Sharjah
PH5Week 491 December Commemoration Day (one day holiday)
PH 5Week 49 2 December UAE’s National Day
SP14Week 6 9 February 2021Reduced capacity at malls and recreational activities
SP15Week 7 14 February 2021Implementation of remote work for governmental employees in Sharjah
SP16Week 1512 April 2021Beginning of Ramadan holy month
PH 6Week 1912 May 2021Beginning of Eid al-Fitr (four day holiday)
Table 4. T-tests to assess the statistical difference of mobility trends before, during, and after COVID-19.
People’s Mobility Sectorbefore vs. during COVID-19before vs. after COVID-19buring vs. after COVID-19
Retail and Recreational2.16 × 10−221.10 × 10−34.75 × 10−32
Groceries and Pharmacies1.06 × 10−180.0806.03 × 10−33
Parks7.11 × 10−311.12 × 10−107.71 × 10−74
Transit Stations5.98 × 10−226.43 × 10−111.60 × 10−91
Workplace2.35 × 10−331.68 × 10−176.57 × 10⁻¹⁸
Residential3.84 × 10−291.38 × 10−052.44 × 10−43
Table 5. Spearman Test of statistical differences in wind speed and direction before (2018–2019) and during the pandemic (2020).
Station No.Spearman Test * for Wind SpeedSpearman Test * for Wind Direction
S1 Station0.90390.2065
S2 Station0.032460.1591
S3 Station0.00012170.2263
S5 Station0.96610.2897
S6 Station0.77870.7123
* Significant difference at 95% confidence level exists if test coefficient < 0.05.
Table 6. Microanalysis of air quality changes during COVID-19 lockdown at each metrological station.
Station NumberDescription of LocationAir Quality ObservationGoogle Earth Image Showing Location
S1 StationThe station is located near an intersection at major expressways in Sharjah (Al-Dhaid Road), which is usually busy with passenger cars. The traffic volume was significantly reduced during the lockdown.Noticeable reduction in NO2, O3, and PM10 during the COVID-19 lockdown. Sustainability 14 01767 i001
S2 StationThe station is located in a remote lightly built-up area.No major changes in air quality measurements during the COVID-19 lockdown compared to the pre-lockdown period. Sustainability 14 01767 i002
S3 StationThe station is located on a local road near a parking area for trucks.PM10 showed a noticeable reduction during the COIVD-19 lockdown compared to the pre-lockdown period. Sustainability 14 01767 i003
S5 StationThe station is located between two busy roads, i.e., Al-Dhaid Road and University City Road.Both PM10 and NO2 showed noticeable reductions during the COVID-19 lockdown compared to the pre-lockdown period. Sustainability 14 01767 i004
S6 StationThe station is located on the outskirts of the city between two busy roads. The station is surrounded by some industrial establishments.PM10 declined and NO2 increased during the COVID-19 lockdown compared to the pre-lockdown period. Sustainability 14 01767 i005
Table 7. Pearson correlation of mobility sectors vs. air quality data (NO2 and O3).
Retail and RecreationGrocery and PharmacyParksTransitWorkplaceResidential
S1NO20.370.460.480.570.21−0.34
O3−0.33−0.33−0.17−0.05−0.160.26
S2NO20.290.400.470.560.15−0.29
O3−0.17−0.16−0.22−0.18−0.080.16
S3NO20.180.270.310.430.17−0.19
O3−0.22−0.220.030.16−0.080.13
S5NO20.320.310.400.540.31−0.30
O3−0.13−0.15−0.20−0.180.000.09
S6NO20.520.520.680.670.40−0.59
O3−0.17−0.18−0.33−0.27−0.040.20
Publisher’s Note: MDPI stays neutral with regard to jurisdictional claims in published maps and institutional affiliations.

