1. Introduction
Considering the literature referring to applications of the Monte Carlo method in the health sector, we found works involving the use of the method in relation to the COVID-19 pandemic, applied to the subject of the contagion. Thus, it has been used to analyze if the work activities are suspended when the contagion rate is of high risk. For this estimation, a descriptive model is analyzed to define the operation of the system designed in Excel, the infection rate or the basic number of reproduction within a certain range is considered as a random variable, and the dynamic transmission rate and the constant recovery rate are also considered. The results of the simulation indicate a significant difference between the historical data and the data obtained in the simulation. In the case of the infected variable, a positive slope is maintained, considering a minimum average infection rate. In order to be able to suspend the work, an average infection rate should be considered, considering that in all cases preventive measures should be considered [
1].
When we analyze the transmission parameters of epidemic contagion, using deterministic models, we try to understand the epidemiological growth using multi-peak structures, using Monte Carlo model calculations to understand the spread of COVID-19, through contact interactions. The model considers the restrictions to be able to contain the contagion in the population with a stochastic interaction. The model considers populations susceptible to infection and recovery over time, with daily infection rate data. The results of the simulations consider four countries, India, Serbia, South Africa, and the USA. In all cases, the results reflect observed infection growth rates, the most important contribution being that the model predicts secondary and tertiary waves of infections, which can be used to plan mitigation strategies [
2].
We found studies by sequential mathematical reduction of the three-parameter model (Susceptible-Infected-Recovered-Removed), in the Verhulst equation, together with the parameters presented in the epidemiological processes, by analyzing data from the European Centre for Disease Prevention and Control, applied to COVID-19. The model demonstrates a high degree of correlation, allowing for use in predictive estimates [
3]. Continuing with the analysis of epidemiological models, Susceptible—Infected Unidentified—Confirmed (SUC) was used to estimate the infected population for COVID-19, specifically which people who are infected and not hospitalized, using time series of confirmed cases in China reported by the World Health Organization, using Monte Carlo simulation, with the need to prepare mitigation strategies, such as protection mechanisms and diagnostic kits, and to estimate hospital beds, medical personnel, etc. The proposed model can be used as a mathematical equation to estimate the infected population [
4].
The studies dedicated to the prediction of the spread of COVID-19 are very helpful in epidemiological studies as well as in the mechanisms to mitigate the contagion, a time-dependent model is presented where a discretized method is considered: susceptible-exposed-infected-infected-recovered-dead (SEIRD) through the time domain. The proposed model is applied to simulate and analyze the effects of COVID-19 in China and the USA based on the daily reported cases, where the prediction of the spread is demonstrated [
5].
The most widely used COVID-19 mitigation mechanism is vaccines. A model of uncertainty quantification and sensitivity analysis is presented, using a mathematical model of transmission, by means of mass vaccination strategies, added to social distancing, through a spectral approach, through the expansion of cases in a polynomial type model based on statistical data, in order to have an output variable in a given time to perform sensitivity analysis. The results show that the spectral approach is a useful tool for analyzing uncertainty and analyzing the sensitivity of epidemiological models [
6].
The Susceptible-Infected-Unidentified-Confirmed (SUC) epidemic model was used to estimate the COVID-19 infected population in China, to estimate infected people who are not hospitalized, using Monte Carlo simulation, where the results recommend that to control the spread of the disease it is essential to estimate the number of the infected population that has not been identified [
7].
In the study of infectious diseases, probabilistic models, using training data, obtaining a space-time core, by analyzing infections reported in time and space, are used to understand the dynamics of the spread of infectious diseases. The use of Bayesian Monte Carlo regression is easily extensible, allowing to incorporate previous knowledge to be used in epidemiological cases [
8]. One of the most common techniques in the framework of being able to control infectious diseases are vaccines, whereby the strategy is to control the epidemic. Adopting such strategies, we find people who do not agree with what is called “externality effects”. Hence, the spatial epidemiological model susceptible-vaccinated-infected-recovered (SVIR) is implemented. Through Monte Carlo simulations, it is verified that there is a crossover behavior between the final vaccination level and the epidemic contagion level [
9].
In this work, the Monte Carlo method is applied to analyze the probabilities of occurrence for the estimation of the availability of health personnel in a pandemic day, considering as inputs the number of available personnel, estimated values of contagion, and recovery rate of infected personnel. The method consists of providing the different scenarios that may occur, resulting in a value of the probability of occurrence, with the results of the method. Decisions can be made related to the distribution of personnel to care for patients in a pandemic scenario.
2. Materials and Methods
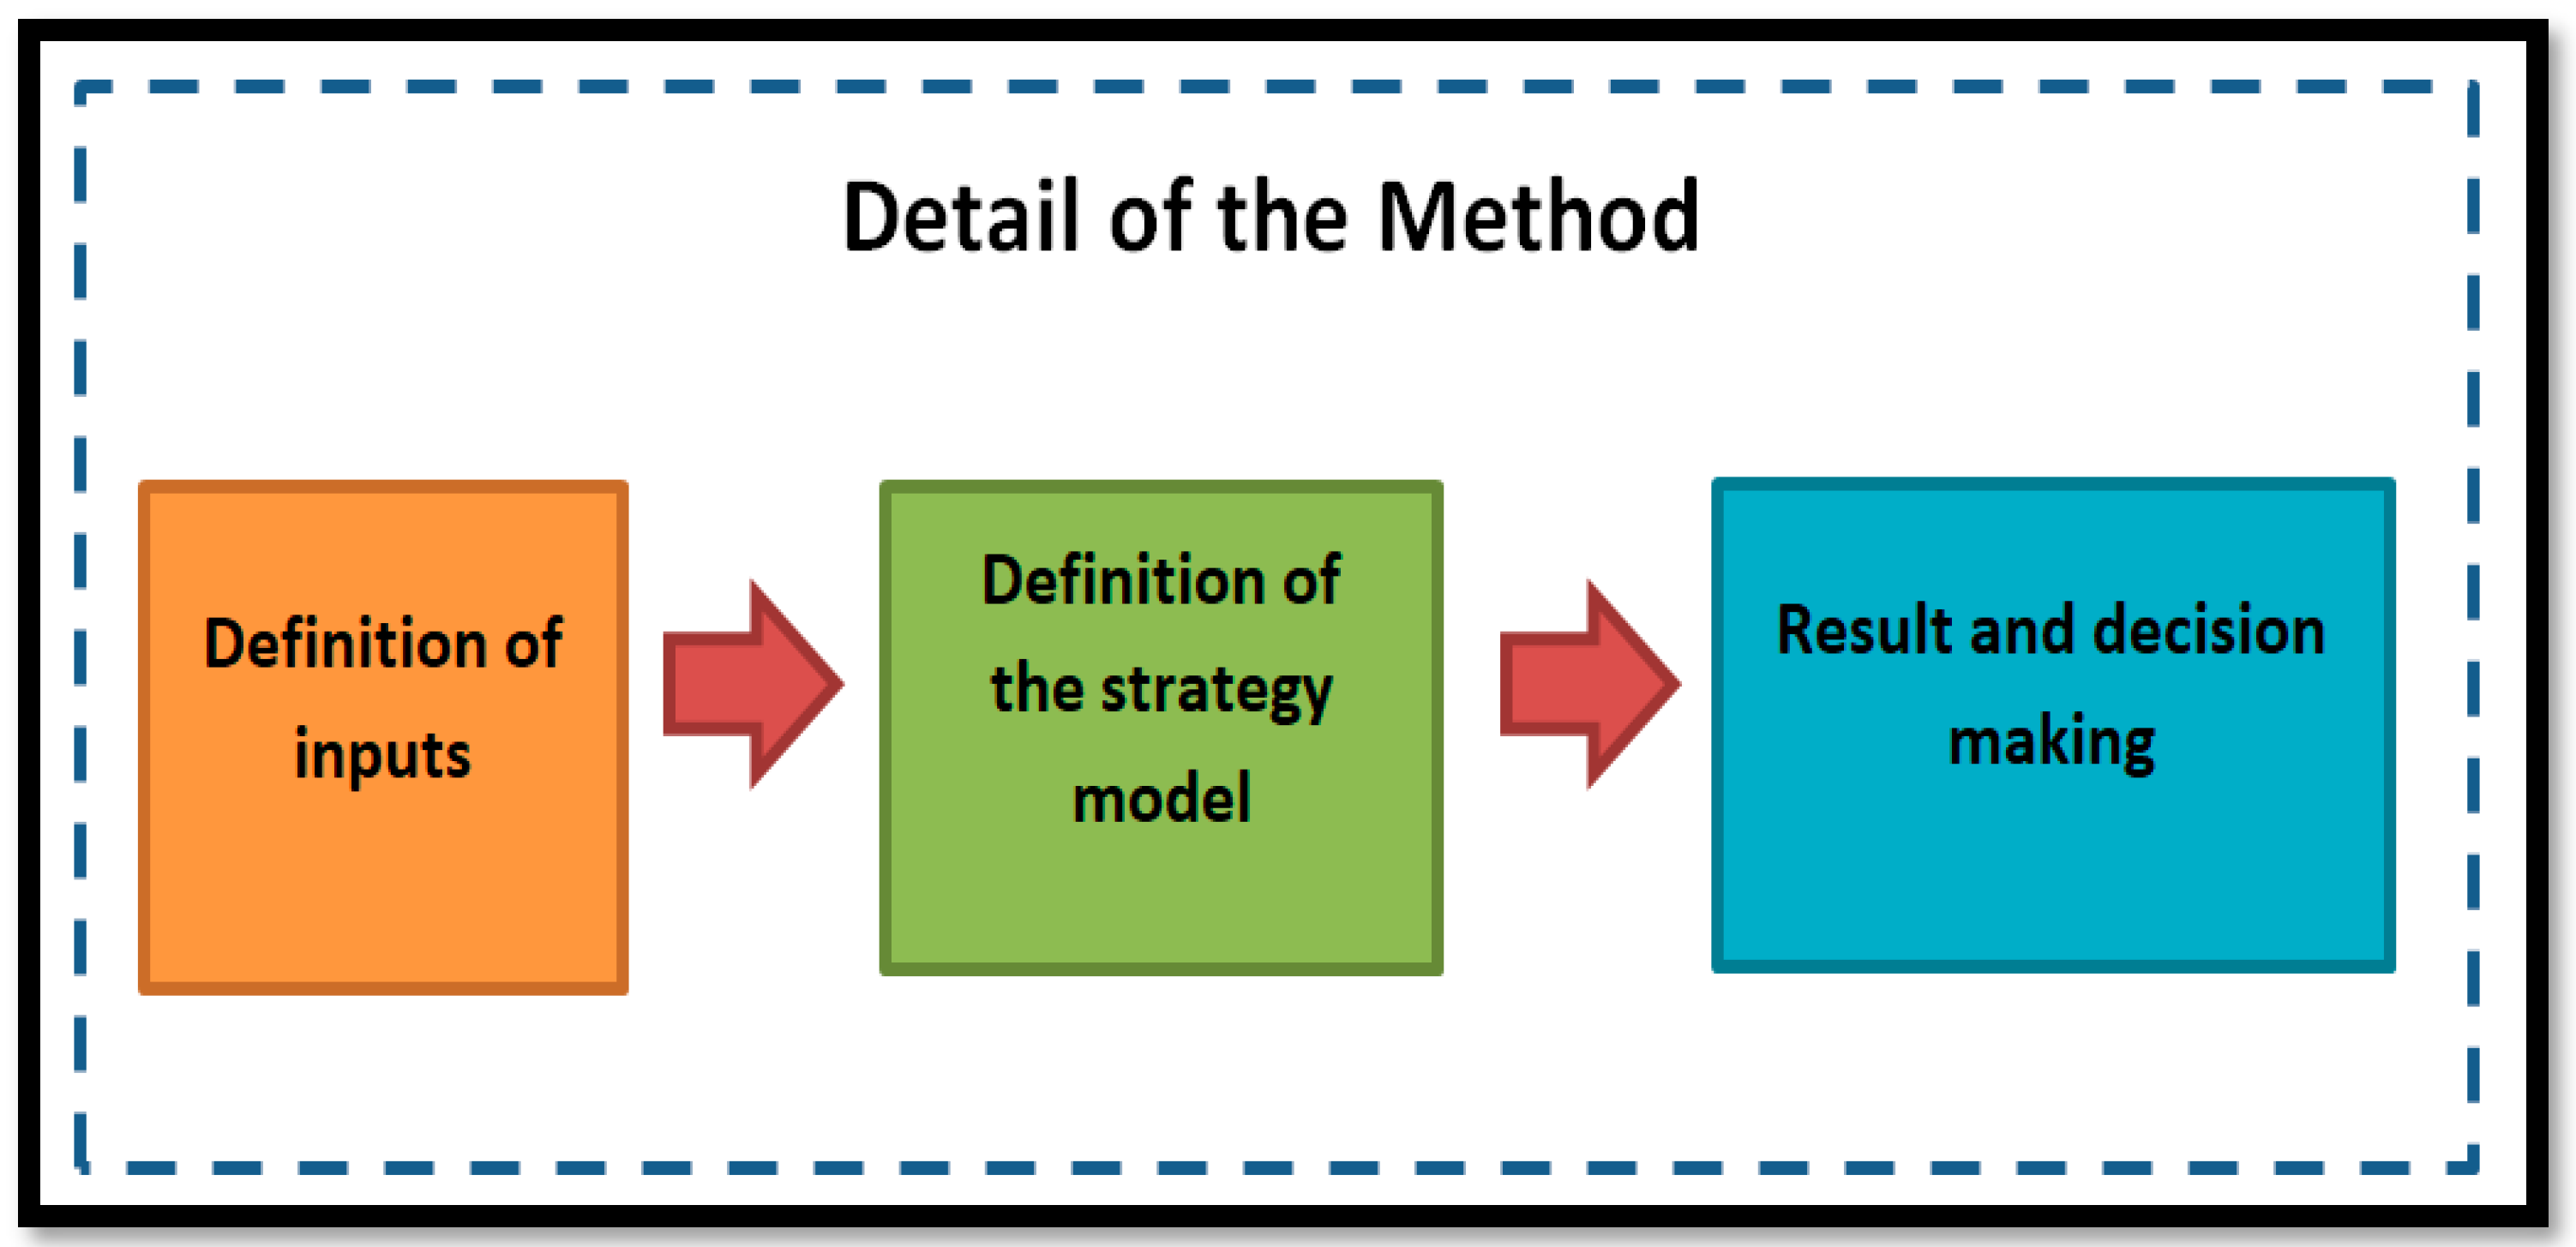
The proposed method is characterized by determining the simulation model, considering the inputs. Then, we define how we organize the data to determine the model of the strategy. Finally, with the results obtained, we can make decisions. The decision is considered in order to know the probability of available personnel to be able to attend patients in one day, in a pandemic scenario.
Figure 1 shows a description of the proposed model.
2.1. Definition of Inputs
The proposed model requires input values, for which we can consider the health personnel positive for COVID-19, evidenced by a rapid test or PCR, after which the staff is isolated and cannot be counted on for care, causing a decrease in staff. As the pandemic continues, there are various scenarios, such as the recovery of staff and new cases of infection. Each scenario is different from one day to the next, changing the probability of infection, recovery, and minimum personnel to care for patients, among other considerations.
In the model, we propose to define a scenario as real as possible. Hence, we identify two groups of inputs, the first related to a group of known factors and a second group considered as estimated factors, which are those related to the possible probabilities of occurrence:
Group of known factors:
Number of personnel available for attention: the total number of health professionals, including physicians, nurses and auxiliary and health personnel.
Number of interactions: the number of interactions to be performed in the simulation is considered.
The inputs considered as known factors are related to the values that we know and that we can have control over. In a real environment, the number of health personnel can vary if we consider hiring health personnel, which increases the number of health personnel. Regarding the number of iterations, it is an average value that we can consider in order to have a larger number of possible situations.
Group of estimated factors:
Accepted percentage of contagion is the percentage of contagion of health personnel that we can accept and that does not affect patient care.
Average percentage of contagion is the average percentage of contagion of health personnel, which is continuously occurring.
Average percentage of personnel recovered from infection is the average percentage of health personnel who have completed the isolation process and are returning to work to attend to patients.
Average percentage of personnel needed for care is the average percentage of personnel needed to care for patients; it is considered as the minimum number of personnel that does not affect the care of patients.
The inputs considered as a group of estimated factors include all the probabilistic values that may occur and directly affect the health personnel, affecting the ability to comply with daily patient care. All values in this group are percentage probability values.
2.2. Definition of the Strategy Model
In the definition of the strategy model, it is necessary to analyze the defined inputs and how they can provide us with a model that corresponds to a possible real situation. These values will allow us to simulate having as a result the probability of occurrence of the values defined in the inputs. Next, we define an input model:
Number of personal available for attention: 100
Number of interactions: 1000
Accepted percentage of contagion: 10
Average percentage of contagion: 10
Average percentage of personnel recovered from infection: 80
Average percentage of personal need for care: 80
One of the inputs that can be variable is the number of interactions, which can be from “1” interaction to “n” interactions, in the case presented we consider “1000” interactions as average, at the time of execution a different number can be considered, the choice will depend on the selected criterion, we can consider performing several executions with different values and depending on the results, find the value of the interaction that gives us the best results, a second option would be to run with an average value, which is the selected criterion.
Regarding the estimated values we consider as an average value in a health center, we consider as 100 the number of workers dedicated to patient care, we consider a run of 1000 iterations or situations, we consider an acceptable contagion rate of 10%, we consider a personnel contagion rate of 10%, for the recovery rate of the personnel we consider 80% and finally we consider an ideal situation that requires a minimum of 80% of the health personnel to be able to comply with patient care. The data described are taken into consideration to be able to analyze our model, and the values are estimated as minimum considerations to be able to comply with the mission of the health centers, which is patient care.
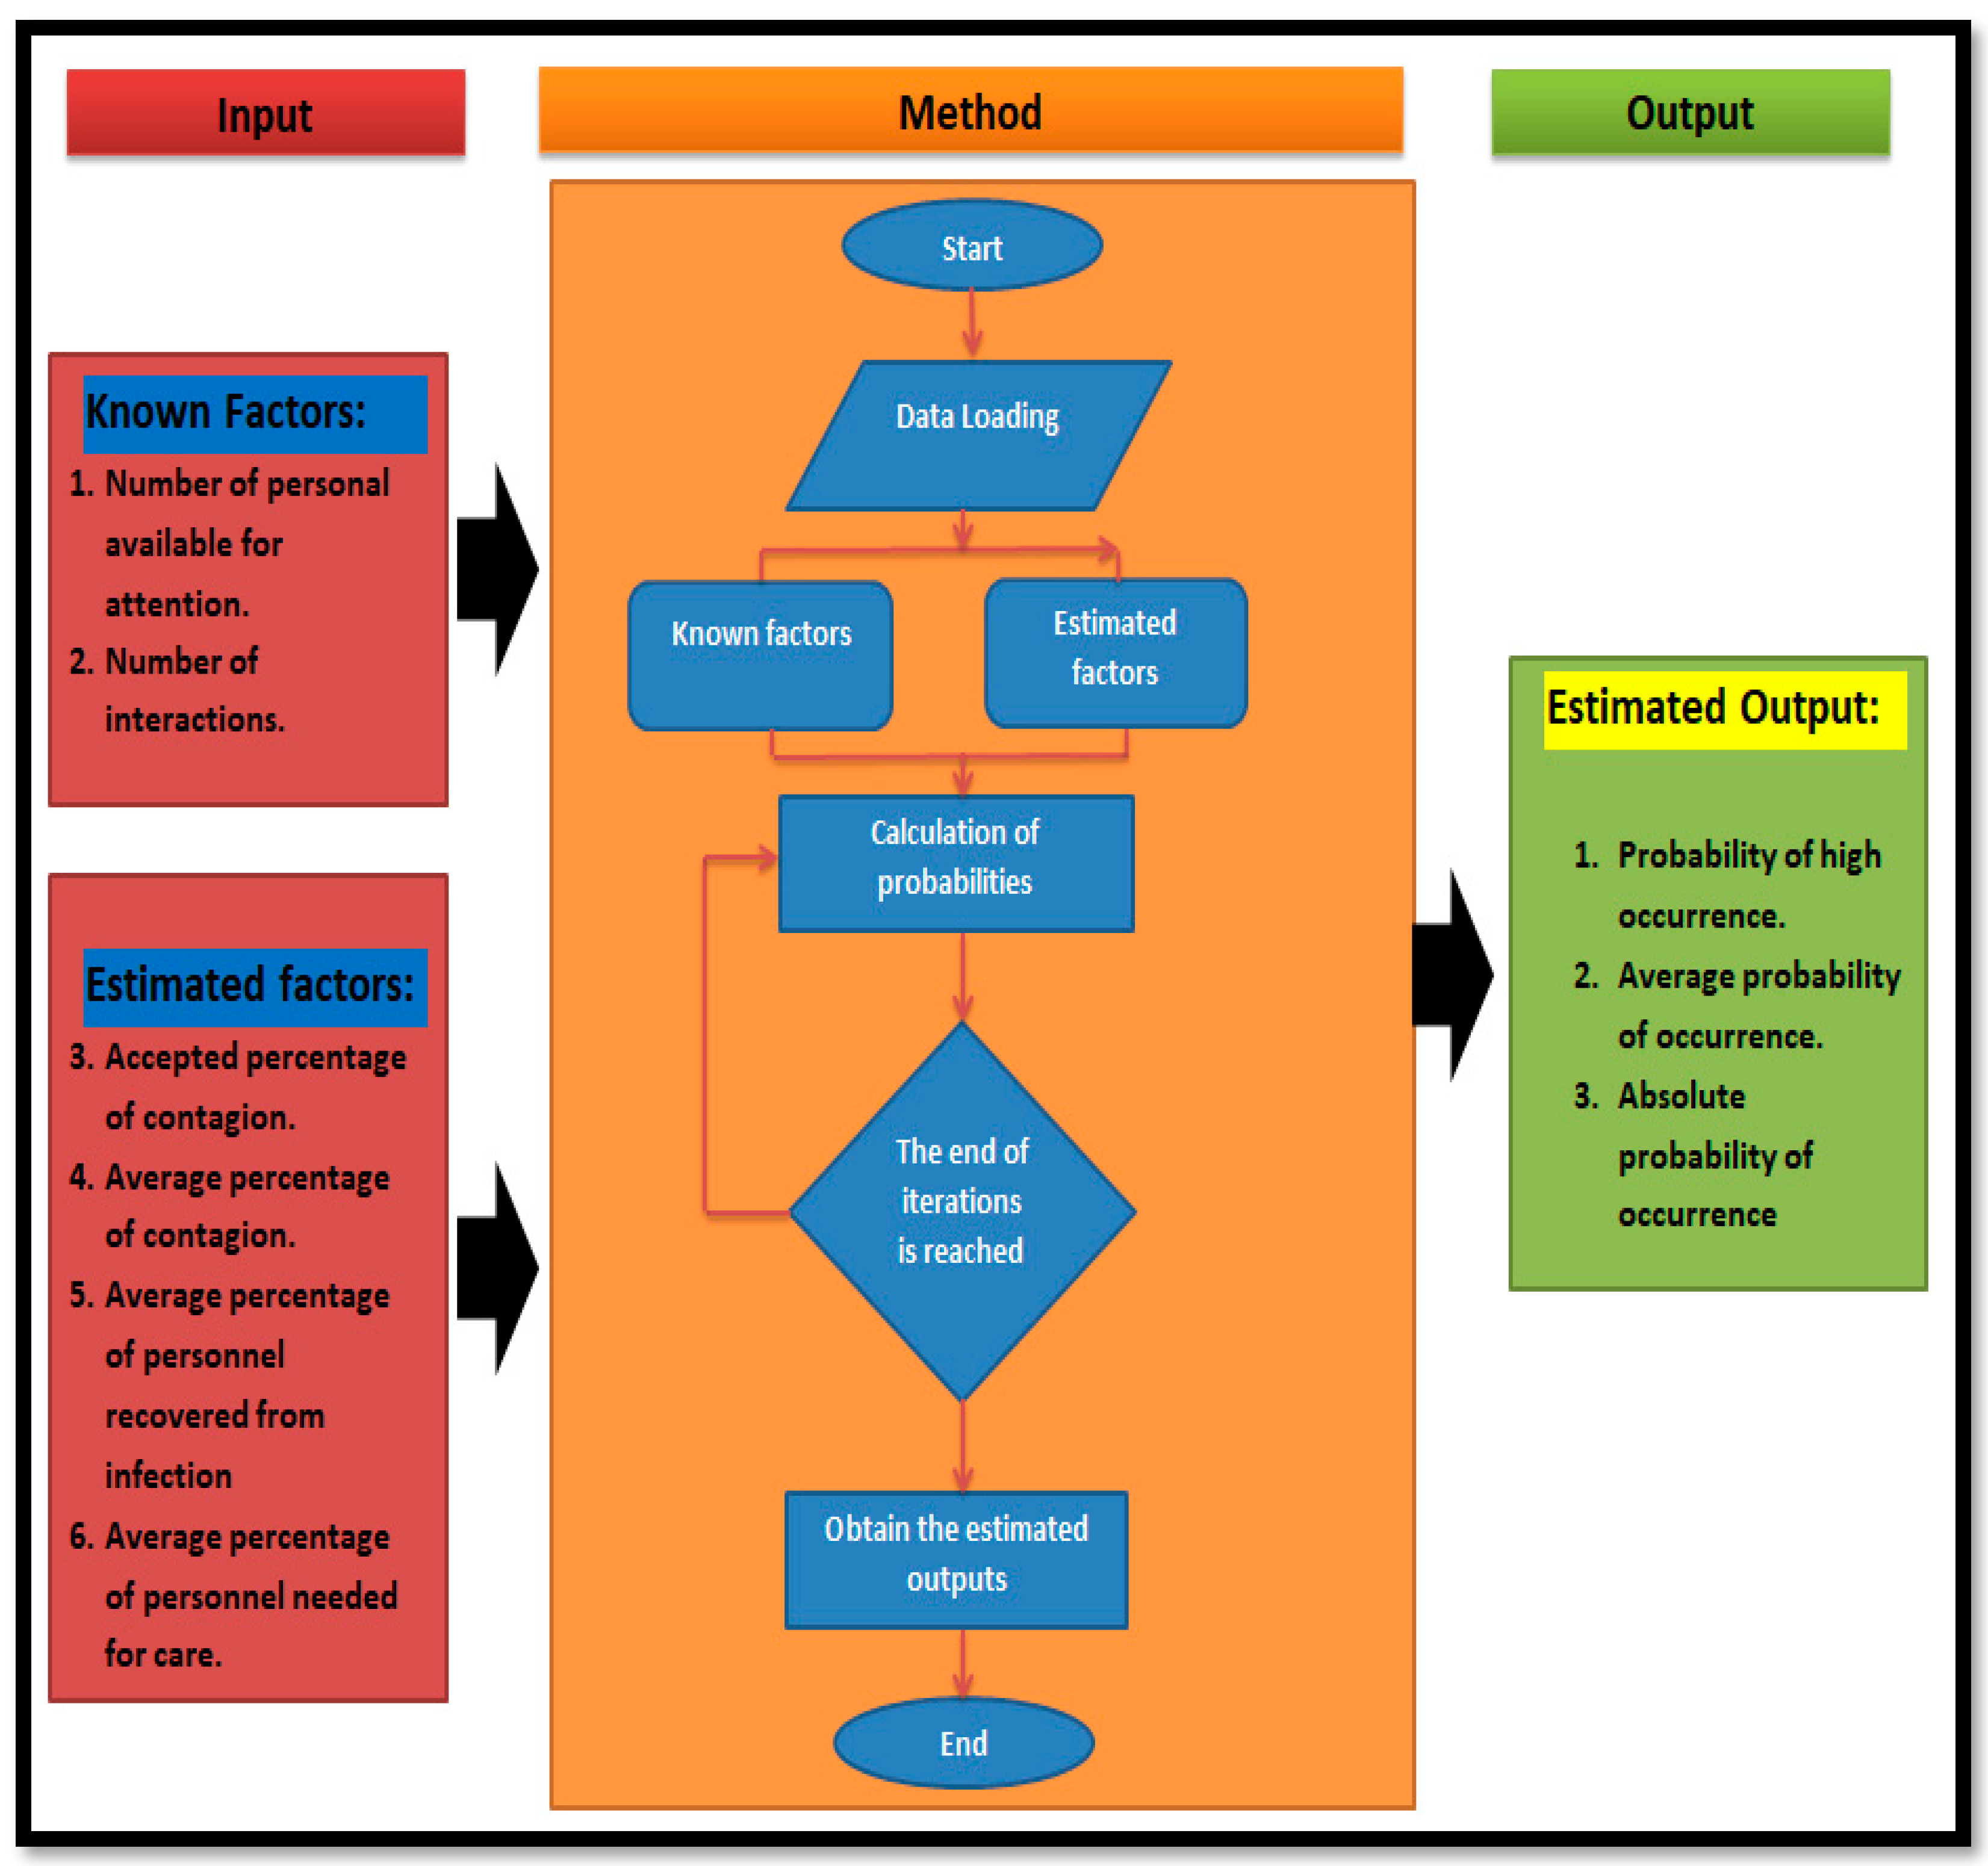
Just as we have the inputs, it is necessary to consider outputs to be able to analyze and thus make decisions. In the case of the proposed model, we consider the following probability values as outputs:
Probability of high occurrence, defined as the high probability of occurrence of the values indicated in the entry.
Average probability of occurrence is the average probability of occurrence of the values indicated in the input.
Absolute probability of occurrence, considered as the absolute probability of occurrence that the data of the entries will occur.
In order to be able to analyze outputs and estimate possible strategies for making decisions about staffing for care in a pandemic scenario, we consider the average probability of occurrence.
Figure 2 shows the proposed model, considering how the inputs and outputs are organized and the method of making decisions until an average probability value is obtained that can be accepted as useful for organizing health personnel. In the model, we present a method to find the highest average value of occurrence. In order to obtain the best results, we can vary the inputs related to the contagion rate that vary depending on how the pandemic evolves. In our case, we can vary the accepted contagion rate and the average contagion rate. We perform the simulation with the change of these inputs until we have the highest value for the probability of occurrence.
2.3. Results and Decision Making
In the methodology presented, we have 3 outputs that are related to the probability of occurrence of the scenario presented in the inputs. We recommend using the average value of occurrence because it is closer to a real situation compared to the highest value or the absolute value. In the case of being able to find the highest average value of occurrence, after having changed the inputs related to the probability of contagion, the decision is made to accept the proposed scenario for the day and to define the strategy to face the working day.
3. Results
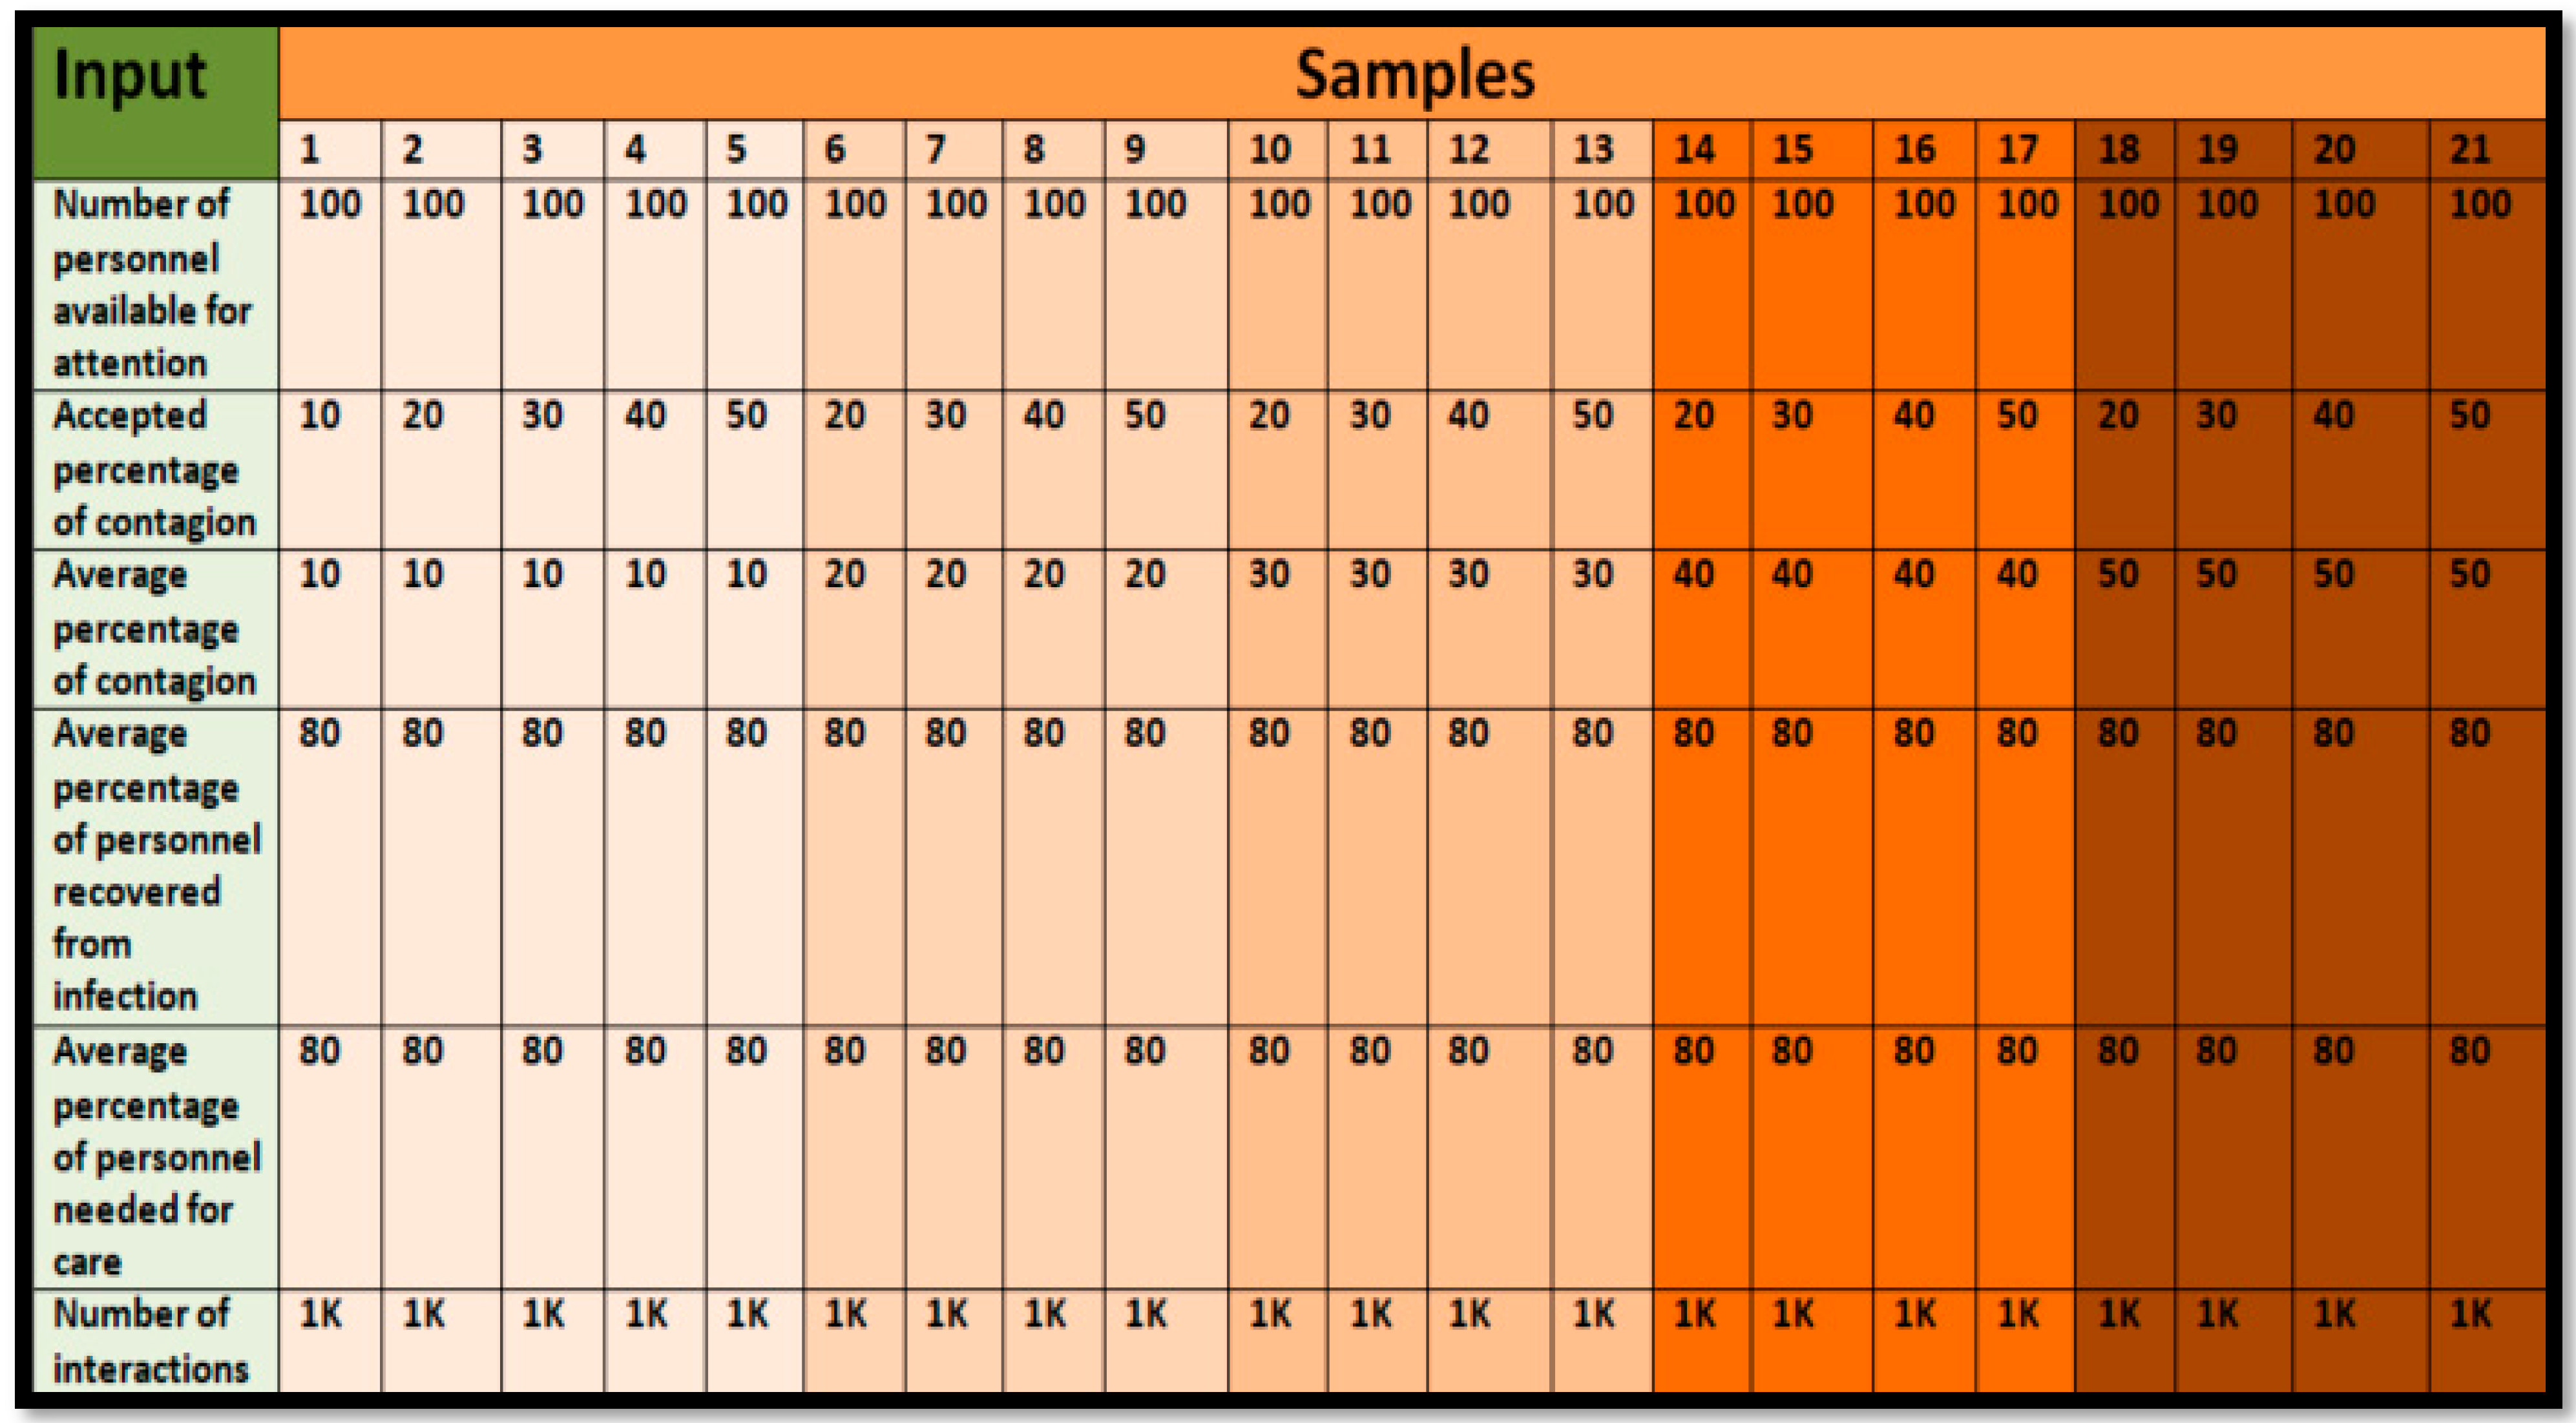
The results presented below are related to present different possible scenarios, changing the inputs related to the contagion rate, to each possible scenario a run of 1000 iterations is performed, obtaining the values of the outputs. In
Figure 3, we present 21 possible scenarios where we can configure the values of the input data. By organizing the inputs and defining the possible scenarios of occurrence, we define them in groups distinguished by color, as described below:
In order to be able to work with the model, we define the inputs with constant values, as is the case of the number of workers available for patient care, 100. For the case of interactions, we consider 1000, the average contagion rate of the personnel we consider 80%, and the recovery rate we also consider 80%, leaving to define several values related to the contagion rate, as can be seen in
Figure 3.
For the case of the accepted percentage of infection, we consider 10–50%. This rate may change and will depend on the health facility. For the average percentage of infection, we consider similarly from 10% to 50%. In both cases, we evaluate with increments of 10%. In case we need to evaluate in more detail, we can consider shorter increments such as 1% and assume higher infection rates. With the described data, we can evaluate 21 possible cases.
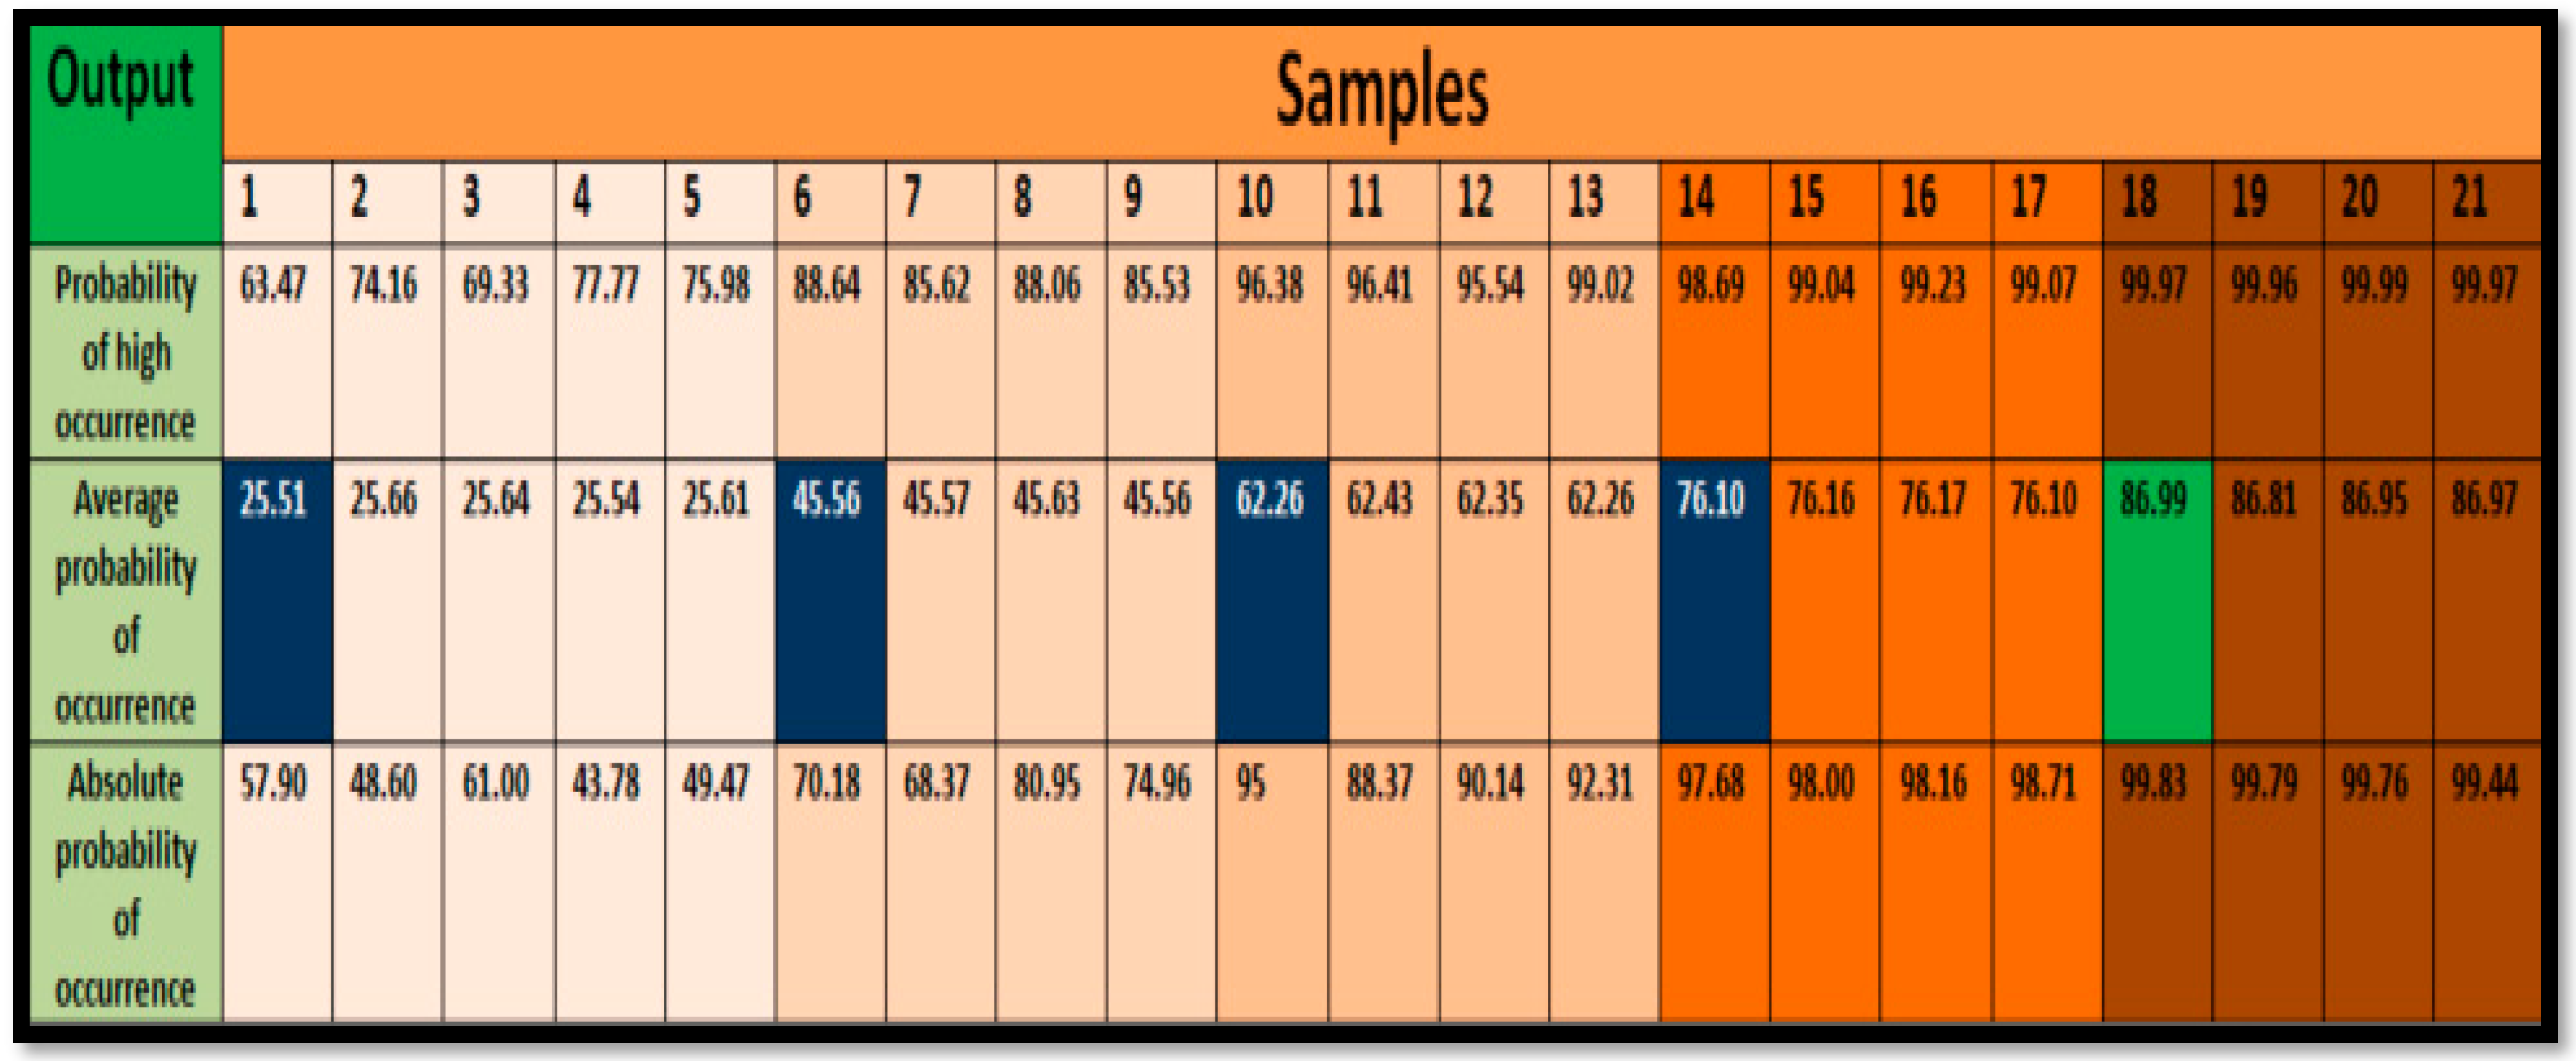
In the case of the outputs, we also have 21 outputs, grouped in the probabilities of occurrence.
Figure 4 shows the outputs corresponding to the inputs, with the three possible values of concurrence according to the scenario presented in the inputs. The figure shows in blue the highest values of the average probability of occurrence and in green the scenario with the highest average value of occurrence that should be taken in order to plan the working day at the health center.
Below, we explain each of the 21 cases by changing only the entries related to the contagion rate. The other entries remain constant:
We have a 10% staff contagion acceptance rate with 10% of the average staff contagion. We have as a result an average occurrence value of 25.51%.
We increase to 20% staff contagion acceptance percentage, maintaining 10% of the average staff contagion. With this variation, we have as a result an average occurrence value of 25.66%.
We increase to 30% staff contagion acceptance percentage, maintaining 10% of the average staff contagion. With this variation, we have as a result an average occurrence value of 25.64%.
We increase to 40% staff contagion acceptance percentage, maintaining 10% of the average staff contagion. With this variation, we have as a result an average occurrence value of 25.54%.
We increase to 50% staff contagion acceptance percentage, maintaining 10% of the average staff contagion. With this variation, we have as a result an average occurrence value of 25.61%.
We can indicate that in the model presented, increasing the rate of acceptance of contagion for health personnel, the average value of occurrence does not vary, remaining at an average value of 25.51%. When we vary the average percentage of contagion from 10% to 20% and vary the average acceptance of contagion:
We have a 20% average contagion percentage, starting with 20% of the contagion acceptance rate. With these new input data, we have as a result an average occurrence value of 45.56%.
We increase to a 30% staff contagion acceptance percentage while maintaining 20% of the average staff contagion. With this variation, we have as a result an average occurrence value of 45.57%.
We increase to 40% staff contagion acceptance percentage and maintaining 20% of the average staff contagion. With this variation we have as a result an average occurrence value of 45.63%.
We increase to 50% staff contagion acceptance percentage and maintaining 20% of the average staff contagion. With this variation, we have as a result an average occurrence value of 45.56%.
We can indicate that, in the model presented, by increasing the rate of acceptance of contagion for health personnel, the average value of occurrence does not vary, remaining at an average value of 45.56%, allowing a comparison with the previous group, increasing from 25.51% to 45.56%. We then varied the average percentage of contagion from 20% to 30% and varied the average acceptance of contagion:
We have 20% the accepted percentage of contagion, starting with 20% the average contagion. With these new input data, we have as a result an average occurrence value of 45.56%.
We increase to 30% staff contagion acceptance percentage and maintaining 30% of the average staff contagion. With this variation, we have as a result an average occurrence value of 62.43%.
We increase to 40% staff contagion acceptance percentage and maintaining 30% of the average staff contagion. With this variation, we have as a result an average occurrence value of 62.35%.
We increase to 50% staff contagion acceptance percentage and maintaining 30% of the average staff contagion. With this variation, we have as a result an average occurrence value of 62.26%.
We can indicate that in the model presented, by increasing the rate of acceptance of contagion for health personnel, the average value of occurrence does not vary, remaining at an average value of 62.26%, allowing a comparison with the previous group, increasing from 45.56% to 62.26%. We then varied the average percentage of contagion from 30% to 40% and varied the average acceptance of contagion:
We have 20% the accepted percentage of contagion, starting with 40% the average contagion. With these new input data, we have as a result an average occurrence value of 76.10%.
We increase to 30% staff contagion acceptance percentage while maintaining 40% average staff contagion. With this variation, we have as a result an average occurrence value of 76.16%.
We increase to 40% staff contagion acceptance percentage and maintaining 40% of the average staff contagion. With this variation, we have as a result an average occurrence value of 76.17%.
We increase to 50% staff contagion acceptance percentage and maintaining 40% of the average staff contagion. With this variation, we have as a result an average occurrence value of 76.10%.
We can indicate that, in the model presented, increasing the rate of acceptance of contagion for health personnel, the average value of occurrence does not vary, remaining at an average value of 76.10%, allowing for a comparison with the previous group, increasing from 62.26% to 76.10%. We then varied the average percentage of contagion from 40% to 50% and varied the average acceptance of contagion:
Cases 18–21 present infection percentages of 20%, 30%, 40%, and 50% of accepted infections, respectively, with an average infection rate of 50%. As a result, mean occurrence values range from 86.81% to 86.97%.
We can indicate that in the model presented, increasing the rate of acceptance of contagion for health personnel, the average value of occurrence does not vary, remaining at an average value of 86.99%, compared to the previous group, increasing from 76.10% to 86.99%.
Having carried out the simulation of 21 possible scenarios, we can indicate the scenario where we have a higher probability of occurrence of 86.99%. Hence, scenario 18 is the most likely to occur, where working with 100 people, at an accepted infection rate of 20% and a probability of infection of 50%, having a recovery rate of 80% and the necessary percentage of personnel. This scenario is the most likely to occur so we can accept to work with a possible infection rate of 50% for health personnel while keeping 20% as the accepted infection rate for staff dedicated to care.
The results presented are real values assumed in a health facility with approximately 100 physicians, who are distributed among the different services it provides. By performing an analysis, we can define the minimum staff to ensure the continuity of patient care, and the results help to establish mechanisms to mitigate the effects of major contagions, where additional staff is required. If the model needs to be applied, it is recommended to evaluate the input variables depending on the health facility, so that the results are as realistic as possible.
These results indicate that the most likely scenario in a pandemic situation where health care personnel are in direct contact with patients, and thus more likely to become infected, is case 18, where all physicians have a 50% chance of becoming infected. Moreover, with an accepted minimum probability of 20% that the individual will become infected, we can assume this scenario and organize the personnel according to the needs of the health center.
4. Conclusions
In conclusion, by applying Monte Carlo simulation, we can evaluate the probabilities of occurrence of different scenarios related to the availability of health personnel. For this evaluation, we determined a number of inputs related to the number of personnel available as well as the probabilities of contagion and the minimum number of personnel necessary to be able to attend patients.
By means of Monte Carlo simulation, we can estimate the probability of occurrence of the different scenarios. In the calculation, we find three results of the probability of occurrence, such as high probability, average probability, and absolute probability. Hence, it is recommended to work with the average probability, as a safer option of occurrence.
In relation to the analysis of the results obtained, we can indicate that the strong point of the method is related to the identification and determination of the necessary inputs to model the simulation. In the results obtained, we can indicate that it is necessary to know the probability of occurrence of contagion, which can be the daily contagion rate. In addition, it is also necessary to know the availability of health personnel required to be able to attend the patients, as well as the contagion recovery rates and a probability of acceptance of the contagion of the health center, which can ensure the continuity of care to patients. Below, we present the input data to be able to simulate through Monte Carlo. These data correspond to real situations that make possible the continuity of care. The model presented presents 21 possible cases that may occur:
Number of personal available for attention: 100
Number of interactions: 1000
Accepted percentage of contagion: 20%
Average percentage of contagion: 50%
Average percentage of personnel recovered from infection: 80
Average percentage of personal need for care: 80
This indicates that on a pandemic day, the most likely scenario of occurrence is that an average rate of infection of health personnel can occur at 50%, with a probability of acceptance of infection of 20%, keeping constant the minimum number of personnel for care with 80% of the total personnel, and with a probability of recovery of infected personnel who will return to work with 80%, as evaluated with 100 workers and 1000 iterations.
In the model presented, we have as variables the percentage of accepted contagion and the average percentage of contagion. In both cases, we consider from 10% to 50%, with increments of 10%. It is recommended to perform evaluations considering higher values, which will depend on the type of health facility, so we can indicate that these values can vary if we analyze in reference health centers that attend to large numbers of patients per day, as well as health facilities that attend to a limited number of patients. Likewise, if more cases need to be evaluated, 1% increments can be considered in order to obtain different values and be sensitive to the model.


 ,
, 


