
Prevalence and Potential Determinants of COVID-19 Vaccine Hesitancy and Resistance in Qatar: Results from a Nationally Representative Survey of Qatari Nationals and Migrants between December 2020 and January 2021

 , , and
Abstract
:1. Introduction
2. Materials and Methods
2.1. Setting
2.2. Sample Design and Participants
2.3. Procedures
2.4. Measures
3. Statistical Analysis
4. Results
5. Discussion
6. Conclusions
Supplementary Materials
Author Contributions
Funding
Institutional Review Board Statement
Informed Consent Statement
Data Availability Statement
Acknowledgments
Conflicts of Interest
Appendix A
Appendix A.1. Sample Size Calculation
Appendix A.2. Phone Interview Outcomes and Response Rates

| Phone Interview Status | Frequency |
|---|---|
| Total sample | 8323 |
| Completed | 1038 |
| Not completed | 7285 |
| Eligible cellphone | 874 |
| Ineligible cellphone | 5116 |
| Unknown eligibility | 1258 |
| Response rate (RR1) | 31.57 |
| Response rate (RR2) | 44.41 |
Appendix A.3. Sampling Weights
References
- WHO Novel Coronavirus—China. Date: 12 January 2020. Available online: Http://Www.Who.Int/Csr/Don/12-January-2020-Novel-Coronavirus-China/En/ (accessed on 21 January 2021).
- Countries Where Coronavirus Has Spread—Worldometer. Available online: https://www.worldometers.info/coronavirus/countries-where-coronavirus-has-spread/ (accessed on 23 January 2021).
- 2020 Impact Report|Saturna Sustainable Funds|Saturna Capital. Available online: https://www.saturna.com/sustainable/white-papers/2020-impact-report (accessed on 24 January 2021).
- Flaxman, S.; Mishra, S.; Gandy, A.; Unwin, H.J.T.; Coupland, H.; Mellan, T.A.; Zhu, H.; Berah, T.; Eaton, J.W.; Guzman, P.N.P.; et al. Estimating the Number of Infections and the Impact of Non-Pharmaceutical Interventions on COVID-19 in European Countries: Technical Description Update. arXiv 2020, arXiv:2004.11342. [Google Scholar]
- Gomes, M.G.M.; Aguas, R.; Corder, R.M.; King, J.G.; Langwig, K.E.; Souto-Maior, C.; Carneiro, J.; Ferreira, M.U.; Penha-Gonçalves, C. Individual Variation in Susceptibility or Exposure to SARS-CoV-2 Lowers the Herd Immunity Threshold. Epidemiology 2020. preprint. [Google Scholar] [CrossRef]
- Pitzer, V.E.; Chitwood, M.; Havumaki, J.; Menzies, N.A.; Perniciaro, S.; Warren, J.L.; Weinberger, D.M.; Cohen, T. The Impact of Changes in Diagnostic Testing Practices on Estimates of COVID-19 Transmission in the United States. Epidemiology 2020. preprint. [Google Scholar] [CrossRef] [Green Version]
- Grant, A.; Hunter, P.R. Immunisation, Asymptomatic Infection, Herd Immunity and the New Variants of COVID 19. Infect. Dis. 2021. [Google Scholar] [CrossRef]
- Coronavirus Disease (COVID-19): Herd Immunity, Lockdowns and COVID-19. Available online: https://www.who.int/news-room/q-a-detail/herd-immunity-lockdowns-and-covid-19 (accessed on 23 January 2021).
- FDA Takes Additional Action in Fight against COVID-19 by Issuing Emergency Use Authorization for Second COVID-19 Vaccine|FDA. Available online: https://www.fda.gov/news-events/press-announcements/fda-takes-additional-action-fight-against-covid-19-issuing-emergency-use-authorization-second-covid (accessed on 23 January 2021).
- Chung, J.Y.; Thone, M.N.; Kwon, Y.J. COVID-19 Vaccines: The Status and Perspectives in Delivery Points of View. Adv. Drug Deliv. Rev. 2021, 170, 1–25. [Google Scholar] [CrossRef] [PubMed]
- Rawat, K.; Kumari, P.; Saha, L. COVID-19 Vaccine: A Recent Update in Pipeline Vaccines, Their Design and Development Strategies. Eur. J. Pharmacol. 2021, 892, 173751. [Google Scholar] [CrossRef] [PubMed]
- Kis, Z.; Shattock, R.; Shah, N.; Kontoravdi, C. Emerging Technologies for Low-Cost, Rapid Vaccine Manufacture. Biotechnol. J. 2018, 1800376. [Google Scholar] [CrossRef] [PubMed] [Green Version]
- Polack, F.P.; Thomas, S.J.; Kitchin, N.; Absalon, J.; Gurtman, A.; Lockhart, S.; Perez, J.L.; Pérez Marc, G.; Moreira, E.D.; Zerbini, C.; et al. Safety and Efficacy of the BNT162b2 MRNA Covid-19 Vaccine. N. Engl. J. Med. 2020, 383, 2603–2615. [Google Scholar] [CrossRef]
- Baden, L.R.; El Sahly, H.M.; Essink, B.; Kotloff, K.; Frey, S.; Novak, R.; Diemert, D.; Spector, S.A.; Rouphael, N.; Creech, C.B.; et al. Efficacy and Safety of the MRNA-1273 SARS-CoV-2 Vaccine. N. Engl. J. Med. 2020, NEJMoa2035389. [Google Scholar] [CrossRef]
- MacDonald, N.E. Vaccine Hesitancy: Definition, Scope and Determinants. Vaccine 2015, 33, 4161–4164. [Google Scholar] [CrossRef]
- Kestenbaum, L.A.; Feemster, K.A. Identifying and Addressing Vaccine Hesitancy. Pediatr. Ann. 2015, 44, e71–e75. [Google Scholar] [CrossRef] [Green Version]
- Wolfe, R.M. Anti-Vaccinationists Past and Present. BMJ 2002, 325, 430–432. [Google Scholar] [CrossRef] [Green Version]
- Murphy, J.; Vallières, F.; Bentall, R.P.; Shevlin, M.; McBride, O.; Hartman, T.K.; McKay, R.; Bennett, K.; Mason, L.; Gibson-Miller, J.; et al. Psychological Characteristics Associated with COVID-19 Vaccine Hesitancy and Resistance in Ireland and the United Kingdom. Nat. Commun. 2021, 12, 29. [Google Scholar] [CrossRef]
- Neumann-Böhme, S.; Varghese, N.E.; Sabat, I.; Barros, P.P.; Brouwer, W.; van Exel, J.; Schreyögg, J.; Stargardt, T. Once We Have It, Will We Use It? A European Survey on Willingness to Be Vaccinated against COVID-19. Eur. J. Health Econ. 2020, 21, 977–982. [Google Scholar] [CrossRef]
- Malik, A.A.; McFadden, S.M.; Elharake, J.; Omer, S.B. Determinants of COVID-19 Vaccine Acceptance in the US. EClinicalMedicine 2020, 26, 100495. [Google Scholar] [CrossRef]
- Dodd, R.H.; Pickles, K.; Nickel, B.; Cvejic, E.; Ayre, J.; Batcup, C.; Bonner, C.; Copp, T.; Cornell, S.; Dakin, T.; et al. Concerns and Motivations about COVID-19 Vaccination. Lancet Infect. Dis. 2021, 21, 161–163. [Google Scholar] [CrossRef]
- Sallam, M.; Dababseh, D.; Eid, H.; Al-Mahzoum, K.; Al-Haidar, A.; Taim, D.; Yaseen, A.; Ababneh, N.A.; Bakri, F.G.; Mahafzah, A. High Rates of COVID-19 Vaccine Hesitancy and Its Association with Conspiracy Beliefs: A Study in Jordan and Kuwait among Other Arab Countries. Vaccines 2021, 9, 42. [Google Scholar] [CrossRef]
- Alsuwaidi, A.R.; Elbarazi, I.; Al-Hamad, S.; Aldhaheri, R.; Sheek-Hussein, M.; Narchi, H. Vaccine Hesitancy and Its Determinants among Arab Parents: A Cross-Sectional Survey in the United Arab Emirates. Hum. Vaccines Immunother. 2020, 16, 3163–3169. [Google Scholar] [CrossRef]
- Abdulla, M.; Reagu, S.M.; Al-Khal, A.; Elzain, M.; Jones, R.M. Covid-19 Vaccine Hesitancy and Attitudes in Qatar: A National Cross-Sectional Survey of a Migrant Majority Population. Influenza Other Respir. Viruses 2021. [Google Scholar] [CrossRef]
- Coronavirus Update (Live): 137,803,375 Cases and 2,965,568 Deaths from COVID-19 Virus Pandemic—Worldometer. Available online: https://www.worldometers.info/coronavirus/ (accessed on 13 April 2021).
- Qatar Population 2020 (Demographics, Maps, Graphs). Available online: https://worldpopulationreview.com/countries/qatar-population (accessed on 24 January 2021).
- Qatar Reports First Case of Coronavirus—The Peninsula Qatar. Available online: https://www.thepeninsulaqatar.com/article/29/02/2020/Qatar-reports-first-case-of-coronavirus (accessed on 23 January 2021).
- Qatar Administers One Millionth Covid-19 Vaccine Dose Today—The Peninsula Qatar. Available online: https://www.thepeninsulaqatar.com/article/07/04/2021/Qatar-administers-one-millionth-Covid-19-vaccine-dose-today (accessed on 13 April 2021).
- Casady, R.J. Stratified Telephone Survey Designs. Surv. Methodol. 1993, 19, 103–113. Available online: Https://Scholar.Google.Com/Scholar_lookup?Title=Stratified%20telephone%20survey%20designs&author=R.J.%20Casady&publication_year=1993 (accessed on 14 April 2021).
- Kelly, J. Computer-Assisted Telephone Interviewing (CATI). Encyclopedia of Survey Research Methods, Survey Research. Google Search. Available online: https://www.google.com/search?q=Kelly%2C+J.%2C+2008.+Computer-Assisted+Telephone+Interviewing+(CATI).+Encyclopedia+of+Survey+Research+Methods%2C+Survey+Research.&rlz=1C1CHBD_enQA904QA904&oq=Kelly%2C+J.%2C+2008.+Computer-Assisted+Telephone+Interviewing+(CATI).+Encyclopedia+of+Survey+Research+Methods%2C+Survey+Research.&aqs=chrome.0.69i59j69i60l2.2037j0j7&sourceid=chrome&ie=UTF-8 (accessed on 14 February 2021).
- AAPOR. Standard Definitions—AAPOR. Available online: https://www.aapor.org/Standards-Ethics/Standard-Definitions-(1).aspx (accessed on 14 February 2021).
- Gardner, A.; Pessoa, S.; Diop, A.; Al-Ghanim, K.; Le Trung, K.; Harkness, L. A Portrait of Low-Income Migrants in Contemporary Qatar. J. Arab. Stud. 2013, 3, 1–17. [Google Scholar] [CrossRef]
- Kroenke, K.; Strine, T.W.; Spitzer, R.L.; Williams, J.B.W.; Berry, J.T.; Mokdad, A.H. The PHQ-8 as a Measure of Current Depression in the General Population. J. Affect. Disord. 2009, 114, 163–173. [Google Scholar] [CrossRef] [PubMed]
- Löwe, B.; Wahl, I.; Rose, M.; Spitzer, C.; Glaesmer, H.; Wingenfeld, K.; Schneider, A.; Brähler, E. A 4-Item Measure of Depression and Anxiety: Validation and Standardization of the Patient Health Questionnaire-4 (PHQ-4) in the General Population. J. Affect. Disord. 2010, 122, 86–95. [Google Scholar] [CrossRef] [PubMed]
- Martin, A.; Rief, W.; Klaiberg, A.; Braehler, E. Validity of the Brief Patient Health Questionnaire Mood Scale (PHQ-9) in the General Population. Gen. Hosp. Psychiatry 2006, 28, 71–77. [Google Scholar] [CrossRef]
- Rancans, E.; Trapencieris, M.; Ivanovs, R.; Vrublevska, J. Validity of the PHQ-9 and PHQ-2 to Screen for Depression in Nationwide Primary Care Population in Latvia. Ann. Gen. Psychiatry 2018, 17, 33. [Google Scholar] [CrossRef] [Green Version]
- Spitzer, R.L.; Kroenke, K.; Williams, J.B.W.; Löwe, B. A Brief Measure for Assessing Generalized Anxiety Disorder: The GAD-7. Arch. Intern. Med. 2006, 166, 1092–1097. [Google Scholar] [CrossRef] [Green Version]
- De Figueiredo, A.; Simas, C.; Karafillakis, E.; Paterson, P.; Larson, H.J. Mapping Global Trends in Vaccine Confidence and Investigating Barriers to Vaccine Uptake: A Large-Scale Retrospective Temporal Modelling Study. Lancet 2020, 396, 898–908. [Google Scholar] [CrossRef]
- Larson, H.J.; Jarrett, C.; Eckersberger, E.; Smith, D.M.D.; Paterson, P. Understanding Vaccine Hesitancy around Vaccines and Vaccination from a Global Perspective: A Systematic Review of Published Literature, 2007–2012. Vaccine 2014, 32, 2150–2159. [Google Scholar] [CrossRef]
- Stata|StataCorp LLC. Available online: https://www.stata.com/company/ (accessed on 14 February 2021).
- Freeman, D.; Loe, B.S.; Chadwick, A.; Vaccari, C.; Waite, F.; Rosebrock, L.; Jenner, L.; Petit, A.; Lewandowsky, S.; Vanderslott, S.; et al. COVID-19 Vaccine Hesitancy in the UK: The Oxford Coronavirus Explanations, Attitudes, and Narratives Survey (Oceans) II. Psychol. Med. 2020, 1–15. [Google Scholar] [CrossRef]
- Al-Mohaithef, M.; Padhi, B.K. Determinants of COVID-19 Vaccine Acceptance in Saudi Arabia: A Web-Based National Survey. J. Multidiscip. Healthc. 2020, 13, 1657–1663. [Google Scholar] [CrossRef]
- Omari, K.; Baron-Epel, O. Low Rates of Child Restraint System Use in Cars May Be Due to Fatalistic Beliefs and Other Factors. Transp. Res. Part F Traffic Psychol. Behav. 2013, 16, 53–59. [Google Scholar] [CrossRef]
- Elbarazi, I.; Al-Hamad, S.; Alfalasi, S.; Aldhaheri, R.; Dubé, E.; Alsuwaidi, A.R. Exploring Vaccine Hesitancy among Healthcare Providers in the United Arab Emirates: A Qualitative Study. Hum. Vaccines Immunother. 2020, 1–8. [Google Scholar] [CrossRef]
- Massey, P.M.; Kearney, M.D.; Hauer, M.K.; Selvan, P.; Koku, E.; Leader, A.E. Dimensions of Misinformation About the HPV Vaccine on Instagram: Content and Network Analysis of Social Media Characteristics. J. Med. Internet Res. 2020, 22, e21451. [Google Scholar] [CrossRef]
- Betsch, C.; Renkewitz, F.; Betsch, T.; Ulshöfer, C. The Influence of Vaccine-Critical Websites on Perceiving Vaccination Risks. J. Health Psychol. 2010, 15, 446–455. [Google Scholar] [CrossRef]
- Shao, C.; Ciampaglia, G.L.; Varol, O.; Yang, K.-C.; Flammini, A.; Menczer, F. The Spread of Low-Credibility Content by Social Bots. Nat. Commun. 2018, 9, 4787. [Google Scholar] [CrossRef] [Green Version]
- Romer, D.; Jamieson, K.H. Conspiracy Theories as Barriers to Controlling the Spread of COVID-19 in the U.S. Soc. Sci. Med. 2020, 263, 113356. [Google Scholar] [CrossRef]
- Schoch-Spana, M.; Brunson, E.K.; Long, R.; Ruth, A.; Ravi, S.J.; Trotochaud, M.; Borio, L.; Brewer, J.; Buccina, J.; Connell, N.; et al. The Public’s Role in COVID-19 Vaccination: Human-Centered Recommendations to Enhance Pandemic Vaccine Awareness, Access, and Acceptance in the United States. Vaccine 2020, S0264410X20313682. [Google Scholar] [CrossRef]
- Ministry of Public Health—Immunization. Available online: https://www.moph.gov.qa/english/OurServices/eservices/Pages/Baby-Immunization%E2%80%8B%E2%80%8B.aspx (accessed on 23 January 2021).
- Eriksson, K.; Vartanova, I. Vaccine Confidence Is Higher in More Religious Countries. Hum. Vaccines Immunother. 2021, 1–3. [Google Scholar] [CrossRef]
- Poliomyelitis in Pakistan: Time for the Muslim World to Step in—PubMed. Available online: https://pubmed.ncbi.nlm.nih.gov/23623055/ (accessed on 14 April 2021).
- Larson, H.J.; Cooper, L.Z.; Eskola, J.; Katz, S.L.; Ratzan, S. Addressing the Vaccine Confidence Gap. Lancet 2011, 378, 526–535. [Google Scholar] [CrossRef]
- Chatters, L.M. Religion and Health: Public Health Research and Practice. Annu. Rev. Public Health 2000, 21, 335–367. [Google Scholar] [CrossRef] [Green Version]
- American Association for Public Opinion Research (April, 2015). Standard Definitions. Available online: http://wwwaapororg/AAPORKentico/AAPOR_Main/media/publications/Standard-Definitions2015_8theditionwithchanges_April2015_logopdf (accessed on 5 May 2021).
- Varedian, M.; Forsman, G. Comparing Propensity Score Weighting with other Weighting Methods: A Case Study on Web data; Section on Survey Statistics, American Statistical Association: Alexandria, VA, USA, 2003. [Google Scholar]
- Ministry of Development Planning and Statistics. The General Simplified Census of Population, Housing and Establishment, Doha, Qatar. 2015. Available online: https://www.psa.gov.qa/en/knowledge/HomePagePublications/Census%202015.pdf (accessed on 5 May 2021).


| Variables | Frequency (n) | Unweighted Percentages (%) | Weighted Percentages (%) |
|---|---|---|---|
| Migrant Status/Type | |||
| Qataris (Non-migrants) | 171 | 16.5 | 19.6 |
| White-collar migrants | 689 | 66.4 | 57.1 |
| Blue-collar migrants | 178 | 17.1 | 23.3 |
| Education Level | |||
| Undergraduate or less | 895 | 86.5 | 87.5 |
| Graduate/Professional | 140 | 13.5 | 12.5 |
| Gender | |||
| Male | 709 | 68.3 | 66.7 |
| Female | 329 | 31.7 | 33.3 |
| Age Group (Years) | |||
| 18–29 | 201 | 19.9 | 23.1 |
| 30–34 | 180 | 17.8 | 18.3 |
| 35–39 | 201 | 19.9 | 19.1 |
| 40+ | 428 | 42.4 | 39.5 |
| Marital Status | |||
| Married | 759 | 73.3 | 68.8 |
| Separated/Divorced/Widowed | 48 | 4.6 | 5.2 |
| Never married | 228 | 22.0 | 26.0 |
| Employment Status | |||
| Unemployed | 240 | 23.2 | 24.1 |
| Employed | 796 | 76.8 | 75.9 |
| Ethnicity | |||
| Arab | 579 | 55.8 | 54.1 |
| Non-Arab | 459 | 44.2 | 45.9 |
| Living Arrangement | |||
| Live with Others | 863 | 83.1 | 83.0 |
| Live Alone | 175 | 16.9 | 17.0 |
| Depression or Anxiety 1 | |||
| Yes | 81 | 8.02 | 8.5 |
| No | 928 | 92.0 | 91.5 |
| Chronic Disease 2 | |||
| Yes | 268 | 25.8 | 24.5 |
| No | 770 | 74.2 | 75.5 |
| COVID-19 Status 3 | |||
| Yes | 85 | 8.2 | 7.9 |
| No | 953 | 91.8 | 92.1 |
| COVID-19 Related Death 4 | |||
| Yes | 134 | 12.9 | 12.1 |
| No | 904 | 87.1 | 87.9 |
| Quarantine Status 5 | |||
| Yes | 229 | 22.1 | 22.2 |
| No | 809 | 77.9 | 77.8 |
| COVID-19 Infection Concerns 6 | |||
| Not at all concerned | 184 | 19.5 | 20.4 |
| Not too concerned | 159 | 16.8 | 16.1 |
| Somewhat concerned | 307 | 32.5 | 30.6 |
| Very concerned | 295 | 31.2 | 32.9 |
| Willing to Get the Vaccine 7 | |||
| Accepting Group | 430 | 42.0 | 42.7 |
| Hesitant Group | 475 | 46.4 | 45.2 |
| Resistant Group | 118 | 11.5 | 12.1 |
| Explanatory Variables | Willingness to Get the Vaccine 11 (%) | ||||
|---|---|---|---|---|---|
| Accepting | Hesitant | Resistant | p-Value * | ||
| Migrant Status/Type | Qataris (non-migrants) | 10.8 | 21.1 | 43.5 | <0.0001 |
| White-collar migrants | 57.8 | 61.7 | 41.8 | ||
| Blue-collar migrants | 31.4 | 17.2 | 14.7 | ||
| Education Level | Undergraduate or less | 84.5 | 88.0 | 94.7 | 0.010 |
| Graduate/Professional | 15.5 | 12.0 | 5.3 | ||
| Gender | Male | 77.5 | 61.5 | 44.9 | <0.0001 |
| Female | 22.5 | 38.5 | 55.1 | ||
| Age Group (Years) | 18–29 | 20.9 | 22.6 | 33.4 | 0.003 |
| 30–34 | 15.8 | 23.2 | 8.8 | ||
| 35–39 | 19.7 | 19.1 | 16.9 | ||
| 40+ | 43.7 | 35.6 | 40.9 | ||
| Marital Status | Ever married | 73.3 | 74.9 | 74.8 | 0.889 |
| Never married | 26.7 | 25.1 | 25.2 | ||
| Employment Status | Unemployed | 15.8 | 28.0 | 38.4 | <0.0001 |
| Employed | 84.2 | 72.0 | 61.6 | ||
| Ethnicity | Arab | 36.6 | 65.0 | 76.0 | <0.0001 |
| Non-Arab | 63.4 | 35.0 | 24.0 | ||
| Living Arrangement | Live with others | 77.1 | 87.1 | 87.6 | 0.001 |
| Live alone | 22.9 | 12.9 | 12.4 | ||
| Depression or Anxiety 1 | Yes | 5.8 | 9.6 | 14.3 | 0.018 |
| No | 94.2 | 90.4 | 85.7 | ||
| Chronic Disease 2 | Yes | 24.6 | 22.7 | 32.1 | 0.125 |
| No | 75.4 | 77.3 | 67.9 | ||
| COVID-19 Status 3 | Yes | 7.8 | 7.8 | 9.5 | 0.819 |
| No | 92.2 | 92.2 | 90.5 | ||
| COVID-19 Related Death 4 | Yes | 11.9 | 13.7 | 8.9 | 0.337 |
| No | 88.1 | 86.3 | 91.1 | ||
| Quarantine Status 5 | Yes | 23.0 | 22.3 | 20.5 | 0.848 |
| No | 77.0 | 77.7 | 79.5 | ||
| COVID-19 Infection Concerns 6 | Not at all/Not too concerned | 33.1 | 35.3 | 50.0 | <0.0001 |
| Somewhat concerned | 25.6 | 37.3 | 25.8 | ||
| Very concerned | 41.3 | 27.4 | 24.2 | ||
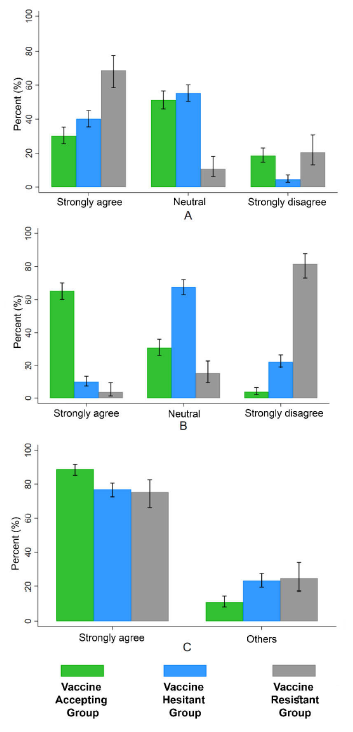
| Effective COVID-19 Containment in Qatar 7 | Strongly agree | 88.9 | 76.9 | 75.3 | <0.0001 |
| Somewhat agree or disagree/Neutral | 11.1 | 23.2 | 24.7 | ||
| Strongly agree | 30.2 | 40.2 | 68.8 | <0.0001 | |
| COVID-19 Vaccine Side-Effects Are of Concern 8 | Somewhat agree | 38.6 | 43.6 | 6.0 | |
| Neutral | 1.9 | 2.2 | 1.0 | ||
| Somewhat disagree | 10.8 | 9.5 | 3.8 | ||
| Strongly disagree | 18.5 | 4.5 | 20.5 | ||
| COVID-19 Vaccine Should Be Mandatory 9 | Strongly agree | 65.3 | 9.8 | 3.6 | <0.0001 |
| Somewhat agree | 21.3 | 34.6 | 5.0 | ||
| Neutral | 1.7 | 5.0 | 1.5 | ||
| Somewhat disagree | 8.0 | 28.1 | 8.4 | ||
| Strongly disagree | 3.7 | 22.5 | 81.5 | ||
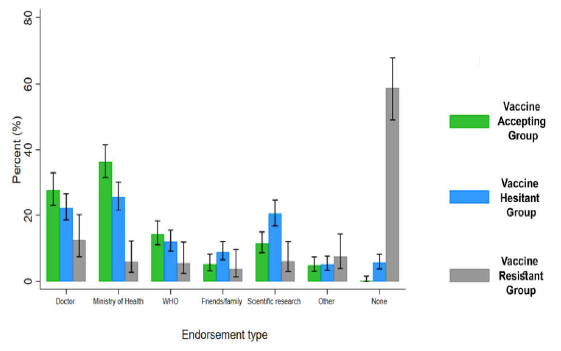
| Endorsement Source for Vaccine 10 | My doctor | 27.7 | 22.3 | 12.5 | <0.0001 |
| Ministry of Health | 36.4 | 25.7 | 5.9 | ||
| WHO | 14.3 | 12.0 | 5.4 | ||
| Positive feedback from Friends/Family | 5.2 | 8.9 | 3.7 | ||
| Scientific research | 11.5 | 20.5 | 6.0 | ||
| Other | 4.8 | 5.1 | 7.6 | ||
| I will not accept vaccine | 0.2 | 5.6 | 58.9 | ||
| Variables | Reference Category | Fully Adjusted Model Willingness to Get Vaccine | |||||
|---|---|---|---|---|---|---|---|
| Hesitant Versus Accepting | Resistant Versus Accepting | ||||||
| RRR | 95% CI | p-Value | RRR | 95% CI | p-Value * | ||
| Age Group | 18–29 | ||||||
| 30–34 | 1.72 | 0.98–3.03 | 0.061 | 0.69 | 0.26–1.80 | 0.443 | |
| 35–39 | 1.16 | 0.65–2.07 | 0.622 | 0.83 | 0.33–2.08 | 0.696 | |
| 40+ | 0.72 | 0.42–1.27 | 0.263 | 0.59 | 0.25–1.41 | 0.236 | |
| Gender | Male | ||||||
| Female | 1.57 | 1.06–2.33 | 0.023 | 3.43 | 1.87–6.28 | <0.0001 | |
| Migrant Status/Type White-collar migrants | Qataris (non-migrant) | 0.68 | 0.39–1.17 | 0.163 | 0.32 | 0.16–0.67 | 0.002 |
| Blue-collar migrants | 0.49 | 0.25–0.94 | 0.032 | 0.32 | 0.12–0.87 | 0.025 | |
| Ethnicity Arab | Non-Arab | 3.11 | 2.15–4.49 | <0.0001 | 4.20 | 2.09–8.47 | <0.0001 |
| Education level | Undergrad or less | ||||||
| Graduate/Professional | 0.78 | 0.50–1.21 | 0.270 | 0.44 | 0.16–1.21 | 0.111 | |
| Employment status | Unemployed | ||||||
| Employed | 0.94 | 0.60–1.47 | 0.779 | 1.18 | 0.61–2.31 | 0.619 | |
| Marital status | Ever married | ||||||
| Never married | 0.89 | 0.55–1.41 | 0.614 | 1.07 | 0.51–2.26 | 0.850 | |
| Living arrangement | Live with Others | ||||||
| Live alone | 0.68 | 0.44–1.05 | 0.083 | 1.08 | 0.50–2.35 | 0.843 | |
| Depression or anxiety 1 Yes | No | 1.10 | 0.57–2.11 | 0.778 | 1.30 | 0.54–3.09 | 0.558 |
| Chronic disease 2 Yes | No | 0.83 | 0.56–1.29 | 0.351 | 1.16 | 0.62–2.16 | 0.637 |
| Quarantine status 3 Yes | No | 0.82 | 0.54–1.23 | 0.340 | 0.54 | 0.26–1.11 | 0.096 |
| COVID-19 related death 4 Yes | No | 1.18 | 0.73–1.88 | 0.500 | 0.66 | 0.26–1.66 | 0.380 |
| COVID-19 infection concerns 5 | |||||||
| Somewhat/Very concerned | Not concerned at all/Not too concerned | 1.01 | 0.72–1.43 | 0.938 | 0.48 | 0.27–0.83 | 0.009 |
| COVID-19 vaccine side-effects are of concern 6 | |||||||
| Somewhat agree or disagree/Neutral Strongly agree | Strongly disagree | 5.69 8.28 | 3.06–10.59 4.32–15.90 | <0.0001 <0.0001 | 0.53 6.30 | 0.21–1.34 2.81–14.13 | 0.178 <0.0001 |
Publisher’s Note: MDPI stays neutral with regard to jurisdictional claims in published maps and institutional affiliations. |
© 2021 by the authors. Licensee MDPI, Basel, Switzerland. This article is an open access article distributed under the terms and conditions of the Creative Commons Attribution (CC BY) license (https://creativecommons.org/licenses/by/4.0/).
Share and Cite
Khaled, S.M.; Petcu, C.; Bader, L.; Amro, I.; Al-Hamadi, A.M.H.A.; Al Assi, M.; Ali, A.A.M.; Le Trung, K.; Diop, A.; Bellaj, T.; et al. Prevalence and Potential Determinants of COVID-19 Vaccine Hesitancy and Resistance in Qatar: Results from a Nationally Representative Survey of Qatari Nationals and Migrants between December 2020 and January 2021. Vaccines 2021, 9, 471. https://doi.org/10.3390/vaccines9050471
Khaled SM, Petcu C, Bader L, Amro I, Al-Hamadi AMHA, Al Assi M, Ali AAM, Le Trung K, Diop A, Bellaj T, et al. Prevalence and Potential Determinants of COVID-19 Vaccine Hesitancy and Resistance in Qatar: Results from a Nationally Representative Survey of Qatari Nationals and Migrants between December 2020 and January 2021. Vaccines. 2021; 9(5):471. https://doi.org/10.3390/vaccines9050471
Chicago/Turabian StyleKhaled, Salma M., Catalina Petcu, Lina Bader, Iman Amro, Aisha Mohammed H. A. Al-Hamadi, Marwa Al Assi, Amal Awadalla Mohamed Ali, Kien Le Trung, Abdoulaye Diop, Tarek Bellaj, and et al. 2021. "Prevalence and Potential Determinants of COVID-19 Vaccine Hesitancy and Resistance in Qatar: Results from a Nationally Representative Survey of Qatari Nationals and Migrants between December 2020 and January 2021" Vaccines 9, no. 5: 471. https://doi.org/10.3390/vaccines9050471