
Epidemiological Differences in the Impact of COVID-19 Vaccination in the United States and China
by
 ,
,
Monia Makhoul
1,2,3, 
Hiam Chemaitelly
1,2,
Houssein H. Ayoub
4,
Shaheen Seedat
1,2,3 and
Laith J. Abu-Raddad
1,2,3,*
1
Infectious Disease Epidemiology Group, Weill Cornell Medicine-Qatar, Cornell University, Qatar Foundation-Education City, Doha 24144, Qatar
2
World Health Organization Collaborating Centre for Disease Epidemiology Analytics on HIV/AIDS, Sexually Transmitted Infections, and Viral Hepatitis, Weill Cornell Medicine–Qatar, Cornell University, Qatar Foundation–Education City, Doha 24144, Qatar
3
Department of Population Health Sciences, Weill Cornell Medicine, Cornell University, New York, NY 10022, USA
4
Department of Mathematics, Statistics, and Physics, Qatar University, Doha 2713, Qatar
*
Author to whom correspondence should be addressed.
Vaccines 2021, 9(3), 223; https://doi.org/10.3390/vaccines9030223
Submission received: 7 January 2021
/
Revised: 4 February 2021
/
Accepted: 2 March 2021
/
Published: 5 March 2021
(This article belongs to the Section Vaccines against Infectious Diseases)
Abstract
:This study forecasts Coronavirus Disease 2019 (COVID-19) vaccination impact in two countries at different epidemic phases, the United States (US) and China. We assessed the impact of both a vaccine that prevents infection (VES of 95%) and a vaccine that prevents only disease (VEP of 95%) through mathematical modeling. For VES of 95% and gradual easing of restrictions, vaccination in the US reduced the peak incidence of infection, disease, and death by >55% and cumulative incidence by >32% and in China by >77% and >65%, respectively. Nearly three vaccinations were needed to avert one infection in the US, but only one was needed in China. For VEP of 95%, vaccination benefits were half those for VES of 95%. In both countries, impact of vaccination was substantially enhanced with rapid scale-up, vaccine coverage >50%, and slower or no easing of restrictions, particularly in the US. COVID-19 vaccination can flatten, delay, and/or prevent future epidemic waves. However, vaccine impact is destined to be heterogeneous across countries because of an underlying “epidemiologic inequity” that reduces benefits for countries already at high incidence, such as the US. Despite 95% efficacy, actual vaccine impact could be meager in such countries if vaccine scale-up is slow, acceptance is poor, or restrictions are eased prematurely.
1. Introduction
With over 80 million infections and a death toll approaching two million [1], the severe acute respiratory syndrome coronavirus 2 (SARS-CoV-2) pandemic has been one of the most challenging global health emergencies in recent history [2]. The unparalleled burden on healthcare systems has necessitated unprecedented restrictions on mobility and on social and economic activities [3,4]. The ensuing losses to national and global economies are probably the largest since the Great Depression [2].
We previously developed a mathematical model to investigate the generic population-level impact of SARS-CoV-2 vaccination [5]. In light of recently produced vaccines with ~95% efficacy against Coronavirus Disease 2019 (COVID-19) symptomatic disease [6,7], the model was extended to assess the impact of these novel vaccines on COVID-19 morbidity and mortality in two major countries at different epidemic phases, the United States (US) and China. The impact was assessed under two different assumptions for the mechanism of action of the vaccine—that it prevents both infection and disease or that it prevents only disease. The impact was further assessed at different levels of vaccine coverage, different time courses for vaccine scale-up, and different schedules for easing of social and physical distancing restrictions following the launch of vaccination.
2. Materials and Methods
2.1. Mathematical Model and Parameterization
The extended model was age-structured, stratifying the population into cohorts based on vaccination status, age group, infection status, infection stage, and disease stage. Vaccination was defined as completion of two vaccine doses [6,7,8]. Population movement among cohorts was determined using a set of coupled nonlinear differential equations. Given interest in assessing vaccination impact in the short-term (over only 2021), demography was assumed stable. Contact between individuals in different age groups was determined using an age-mixing matrix that allowed a range of assortativeness in mixing. Details of the model are in Supplementary Information Text S1A, S1B and Figures S1 and S2. The model was coded, fitted, and analyzed using MATLAB R2019a [9].
Since the evidence suggests that reinfection with this virus is a rare event [10,11,12,13,14,15], those recovered from infection were assumed protected against reinfection, but only for one year, based on the behavior of other “common cold” coronaviruses [16]. For the same purpose, it was assumed that vaccine-induced immunity will also last for only one year, a conservative assumption given that studies have been increasingly suggesting that immunity may be more durable and long-lasting [10,15,17,18,19]. The waning of both natural and vaccine immunity was assumed to follow a gamma distribution of order . That is, most people lose their immunity after about one year, and only a small minority lose their immunity after a period that is either much shorter or much longer than one year (Figure S3).
The model was parameterized using state-of-the-art empirical evidence for the infection’s natural history and epidemiology. The natural history and the distribution of infected individuals across mild (or asymptomatic), severe, or critical infection stages and the infection mortality rate in each age group were based on natural history studies [20,21,22,23,24,25,26,27] and existing comprehensive analyses of analyzed epidemics [16,28,29] that followed the World Health Organization (WHO) guidelines for classifying infection severity [30] and determining COVID-related death [31]. All age groups were assumed (biologically) equally susceptible to this infection. Population demographic information (size, age distribution, and life expectancy) were obtained from the United Nations World Population Prospects database [32]. Details of model parameters, values, and justifications are in Supplementary Information Text S1C and Tables S1 and S2.
2.2. Characteristics of the Vaccine and Scale-Up Scenarios
Since the primary endpoint of the vaccine’s randomized clinical trials was efficacy of the vaccine against laboratory-confirmed COVID-19 cases [6,7,8], and not just any infection, documented or undocumented, it is unknown whether the vaccine prophylactically reduces susceptibility to the infection (that is, efficacy defined as the proportional reduction in the susceptibility to infection among those vaccinated compared to those unvaccinated [5]) or whether it just reduced serious symptomatic COVID-19 cases with no effect on infection (that is, efficacy against disease progression, defined as the proportional reduction in the fraction of individuals with severe or critical infection among those vaccinated but who still acquired the infection compared to those unvaccinated [5]). These two mechanisms of action bracket the two extremes for the vaccine’s biological effect, with the former mechanism being the most optimistic (reducing both infection and disease) and the latter being the most pessimistic (reducing only disease).
Notwithstanding this uncertainty, the impact of the vaccine was assessed under each of these mechanisms of action, assuming or , thus covering the spectrum for potential vaccine impact. However, further more specific estimates can be generated as data on the vaccines’ mechanisms of action become available. In the baseline scenario, the vaccine was introduced in both countries on 1 January 2021 with a scale-up to reach vaccine coverage of 80% by the end of 2021. Given that the purpose of vaccination is to alleviate the need for restrictions that have stifled social and economic activities, social distancing restrictions were assumed to be eased gradually over six months, so that “normalcy” would be attained at the end of these six months. Normalcy was defined as a social contact rate in the population equal to that prior to the pandemic.
Since the US has experienced a large epidemic, it was assumed that 20% of the US population has already been infected by 1 January 2021 [33], with those already infected (if subsequently vaccinated) assumed to have natural immunity against reinfection as supported by reinfection studies [10,15,19]. Moreover, the basic reproduction number at time of onset of vaccination was assumed at , reflecting the current phase of an expanding epidemic. It was also assumed that will gradually increase with easing of restrictions to reach at the end of six months. The value of is justified by existing estimates assuming a “natural” epidemic in the absence of non-pharmaceutical interventions and by evidence of higher infectiousness for this virus after the emergence of the D614G mutation [34,35,36,37] and of new variants for this virus [38].
For China, it was assumed that the entire population is still susceptible to the infection, given the small number of documented infections relative to its large population size, and that the epidemic was contained [1,25]. Moreover, it was assumed that at the onset of vaccination (reflecting the non-expanding epidemic), but that will gradually increase with easing of restrictions to reach an at the end of six months.
2.3. Measures of Vaccine Impact
The population-level impact of SARS-CoV-2 vaccination was assessed by quantifying incidence, cumulative incidence, and reduction in incidence of infections, severe disease cases, critical disease cases, and COVID-19 deaths arising in the presence of vaccination compared to the counter-factual scenario of no vaccination. These measures of vaccine impact factor both direct and indirect public health benefits of vaccination, that is, the direct effects of the vaccine due to or efficacies and the indirect effects due to the reduction in onward infection transmission given higher proportions of immune individuals (applicable only in the case of ). Vaccine effectiveness, that is, number of vaccinations needed to avert one infection or one adverse disease outcome (ratio of the number of vaccinations relative to the number of averted outcomes), was further calculated using the different scenarios to inform future cost-effectiveness analyses. In this regard, vaccine “effectiveness” is not to be confused with vaccine biological “efficacy”, which is assumed constant at 95% [6,7]. Impact of vaccination prioritization by age was not assessed, as it was investigated in earlier studies [5,39].
2.4. Uncertainty Analysis
A multivariable uncertainty analysis was conducted to determine the range of uncertainty for model predictions using 500 model runs. At each run, Latin Hypercube sampling [40,41] was applied to select vaccine efficacy from within its reported credible range [7] and to select a vaccine duration of protection within ±30% of one year duration. The resulting distribution for vaccine impact across all 500 runs was used to calculate the predicted means of different outcomes and the uncertainty associated with those means.
3. Results
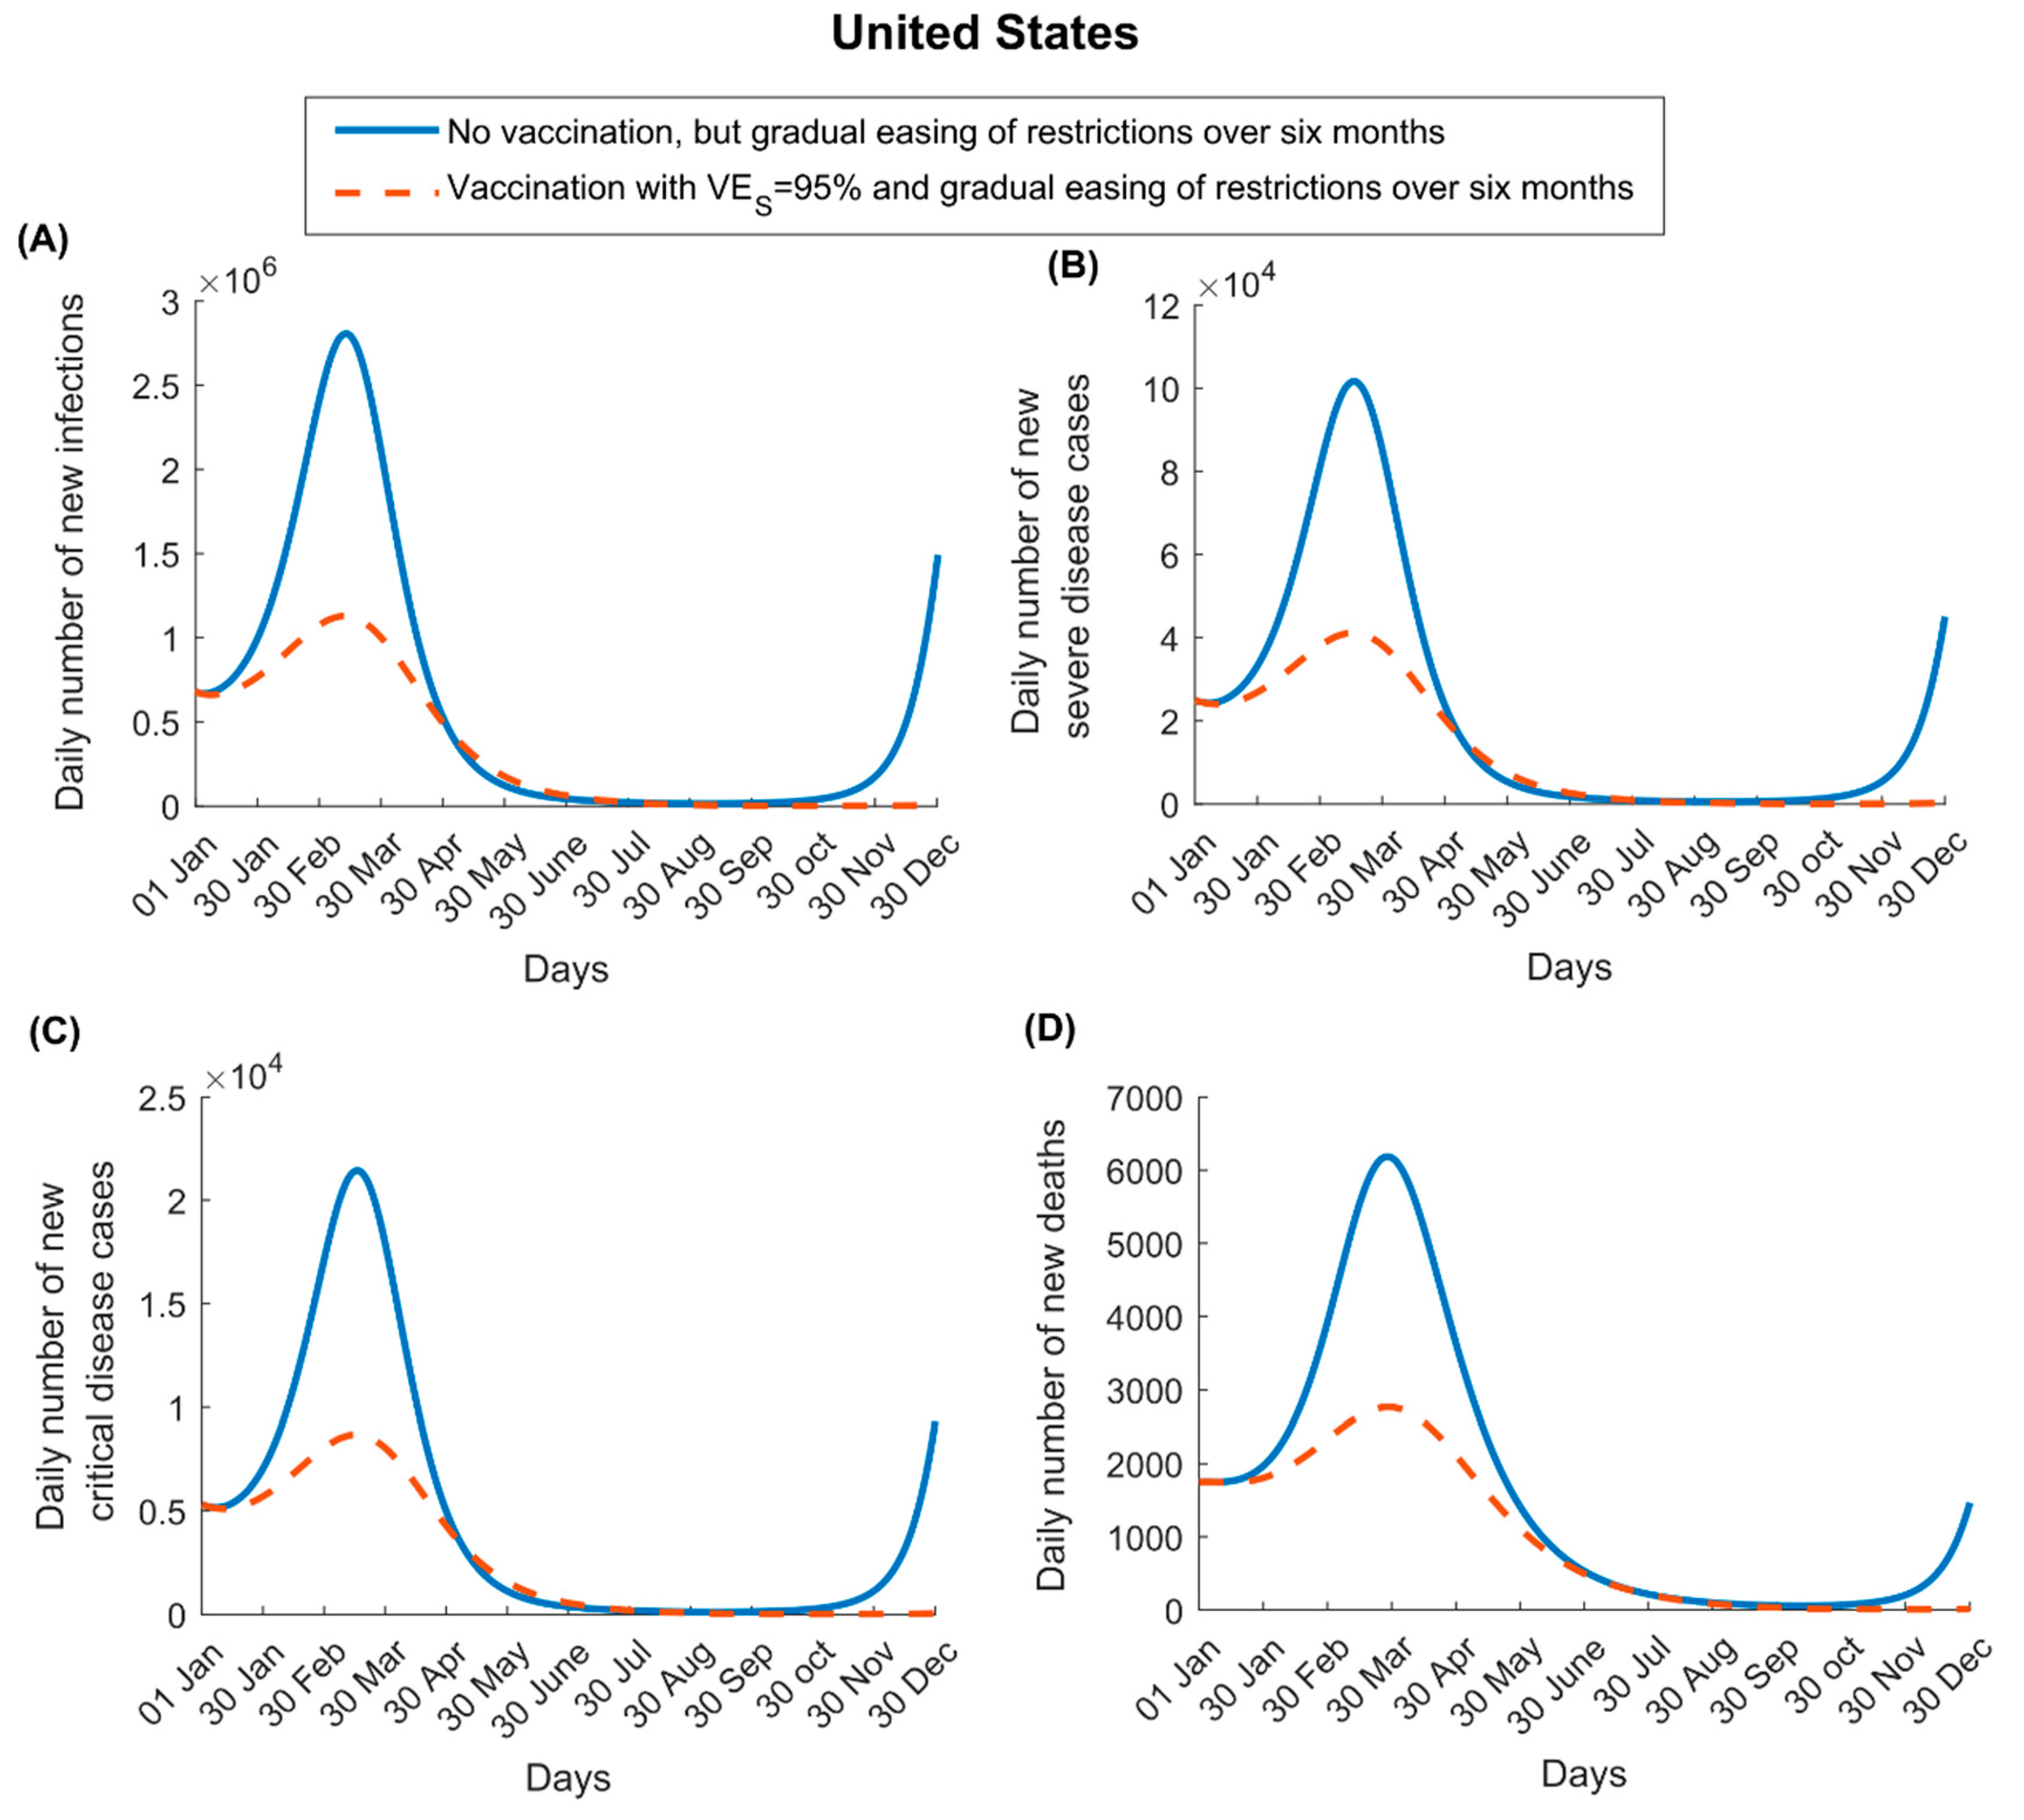
For , vaccination in the US flattened the epidemic curve but did not prevent a new epidemic wave, though it resulted in a smaller one, with the assumed gradual easing of restrictions following the onset of vaccination (Figure 1). The vaccine reduced peak incidence of infection, severe disease, critical disease, and COVID-19 death by 59.6%, 59.5%, 59.0%, and 55.3%, respectively, and cumulative number of infections, severe disease cases, critical disease cases, and deaths by 35.7%, 35.2%, 35.0%, and 32.7%, respectively, by the end of 2021. However, incidence started to increase toward the end of 2021, as vaccine immunity waned and those previously infected began losing their protective immunity against reinfection.
For , the vaccination had no impact on infection (as it does not protect against infection) and less impact on disease and death (Figure S5). Peak incidence of severe disease, critical disease, and death was reduced by only 22.0%, 22.0%, and 21.1%, respectively. The cumulative numbers of severe disease cases, critical disease cases, and deaths were reduced by only 17.4%, 17.2%, and 16.7%, respectively, by the end of 2021.
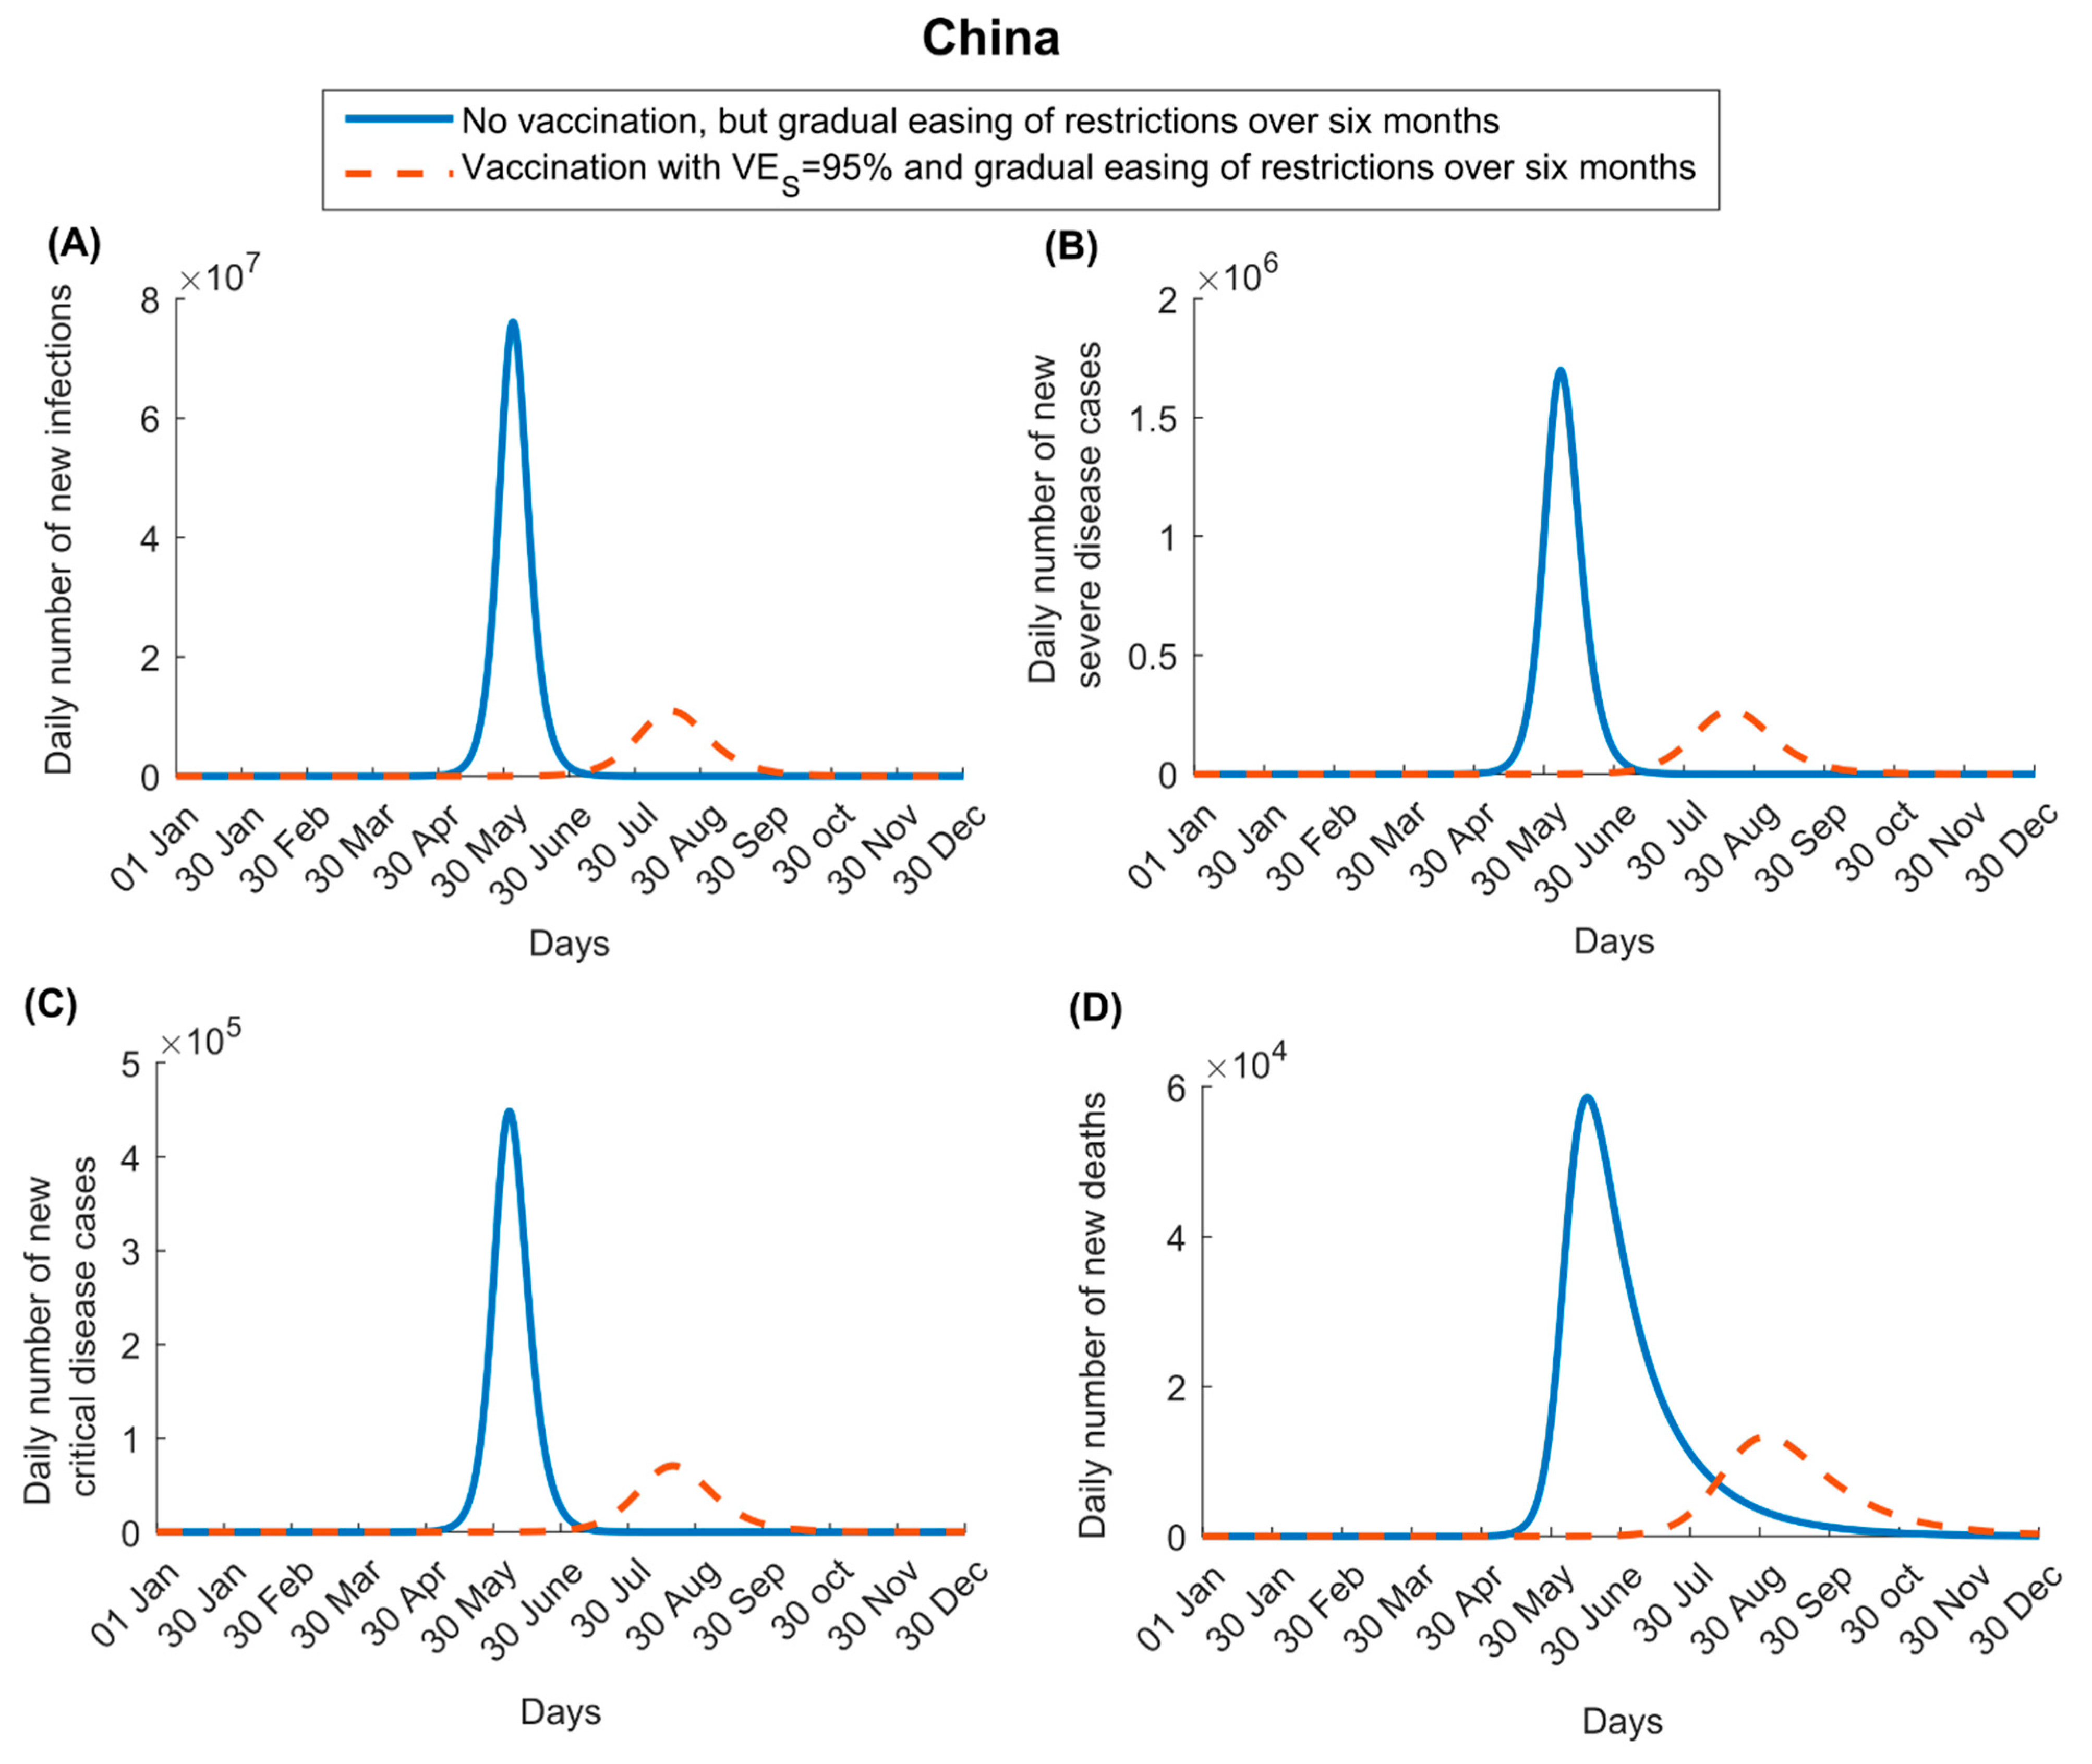
In China, the impact of vaccination was larger than in the US, as the vaccine was introduced at a time when disease incidence was negligible. For , vaccination not only flattened the epidemic curve but also delayed it by a few months (Figure 2). The vaccine reduced peak incidence of infection, severe disease, critical disease, and death by 85.6%, 84.2%, 84.3%, and 77.3%, respectively, and cumulative number of infections, severe disease cases, critical disease cases, and deaths by 65.7%, 65.0%, 65.3%, and 65.3%, respectively, by the end of 2021. Unlike the US, no epidemic re-emergence is seen in China towards the end of the year 2021, as the vast majority of infections in this country would have happened during the course of that year, and thus recovered persons would not have lost their immunity by the end of that year.
For , the vaccination had less impact on disease and death (Figure S6). Peak incidence of severe disease, critical disease, and death was reduced by 44.5% for all of these indicators as well as for their cumulative numbers.
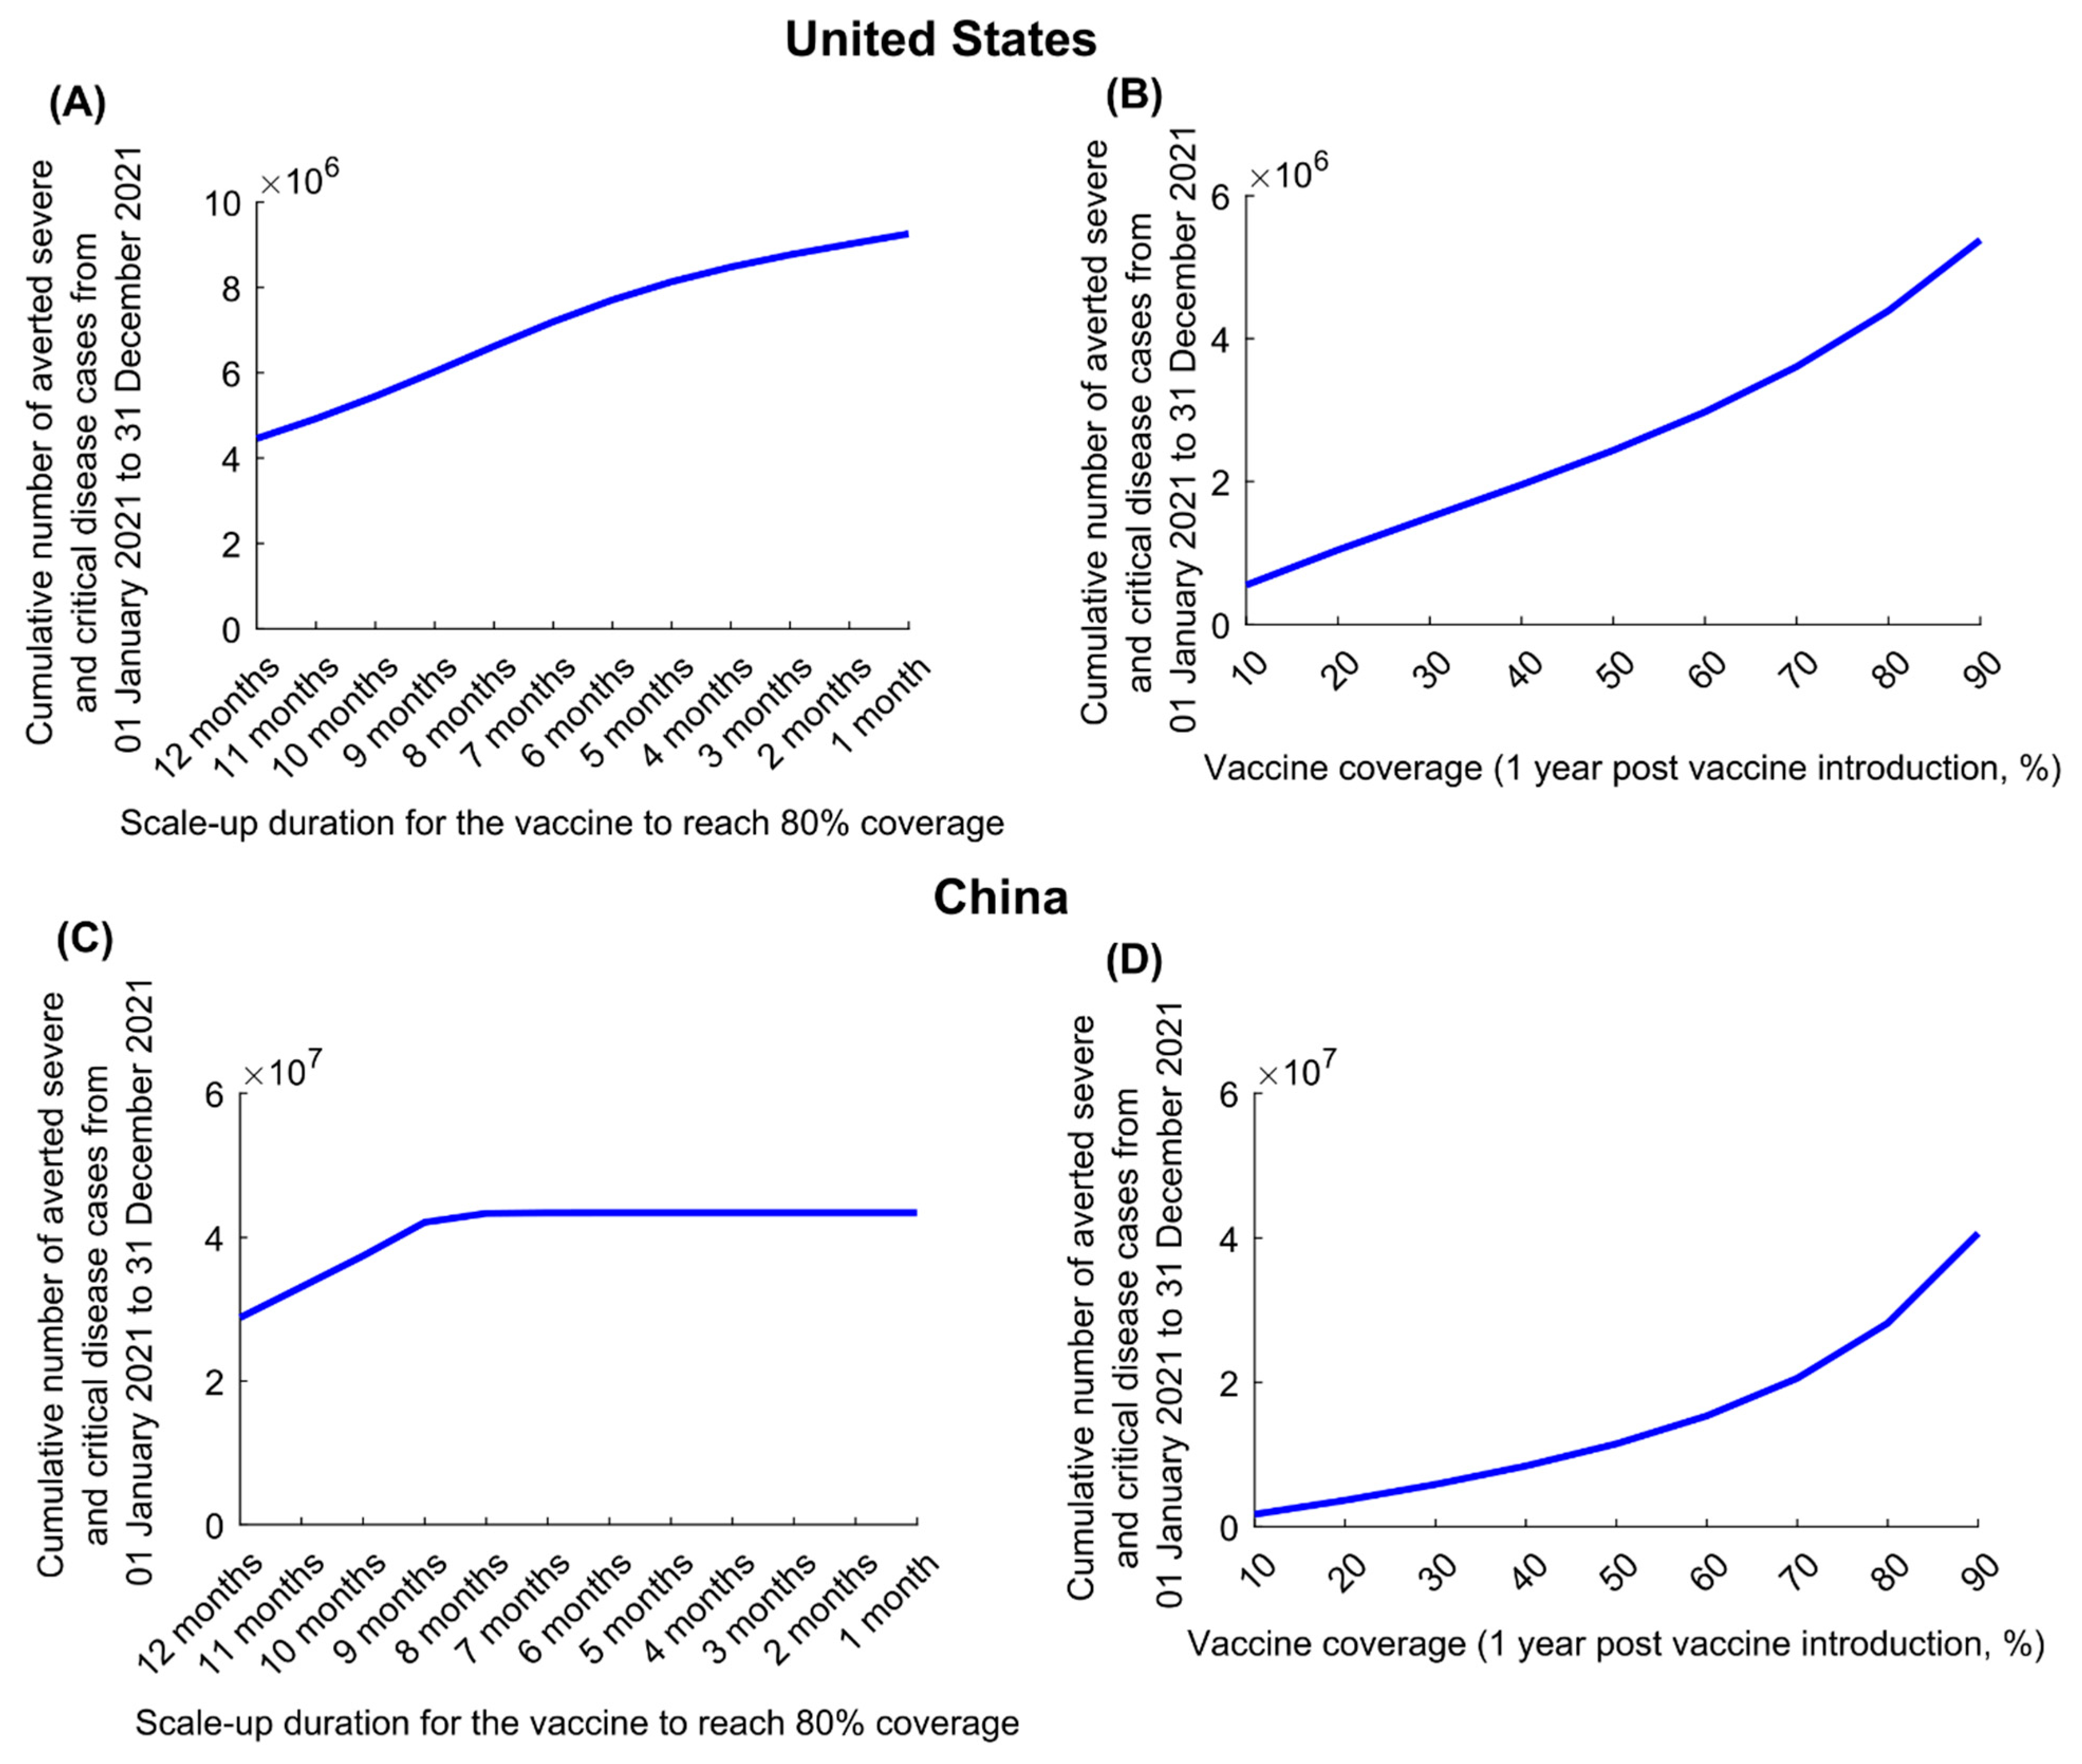
In the US, for , the cumulative number of averted disease cases increased steadily in response to shorter scale-up (to 80% coverage) (Figure 3A). However, in China, there was no additional benefit to be had by shortening scale-up to less than 8 months, as the epidemic was fully contained (Figure 3C). Similar results were obtained for , as shown for the US and China (Figure S7A,C), respectively.
For , the cumulative number of averted disease cases increased steadily with higher vaccine coverage (by end of 2021) in both countries (Figure 3B,D). The gains in averted disease cases increased sharply as vaccine coverage exceeded 70% in the US and 50% in China, because such coverage prevented a much larger epidemic wave. Similar results were obtained for in both the US and China (Figure S7B,D, respectively).
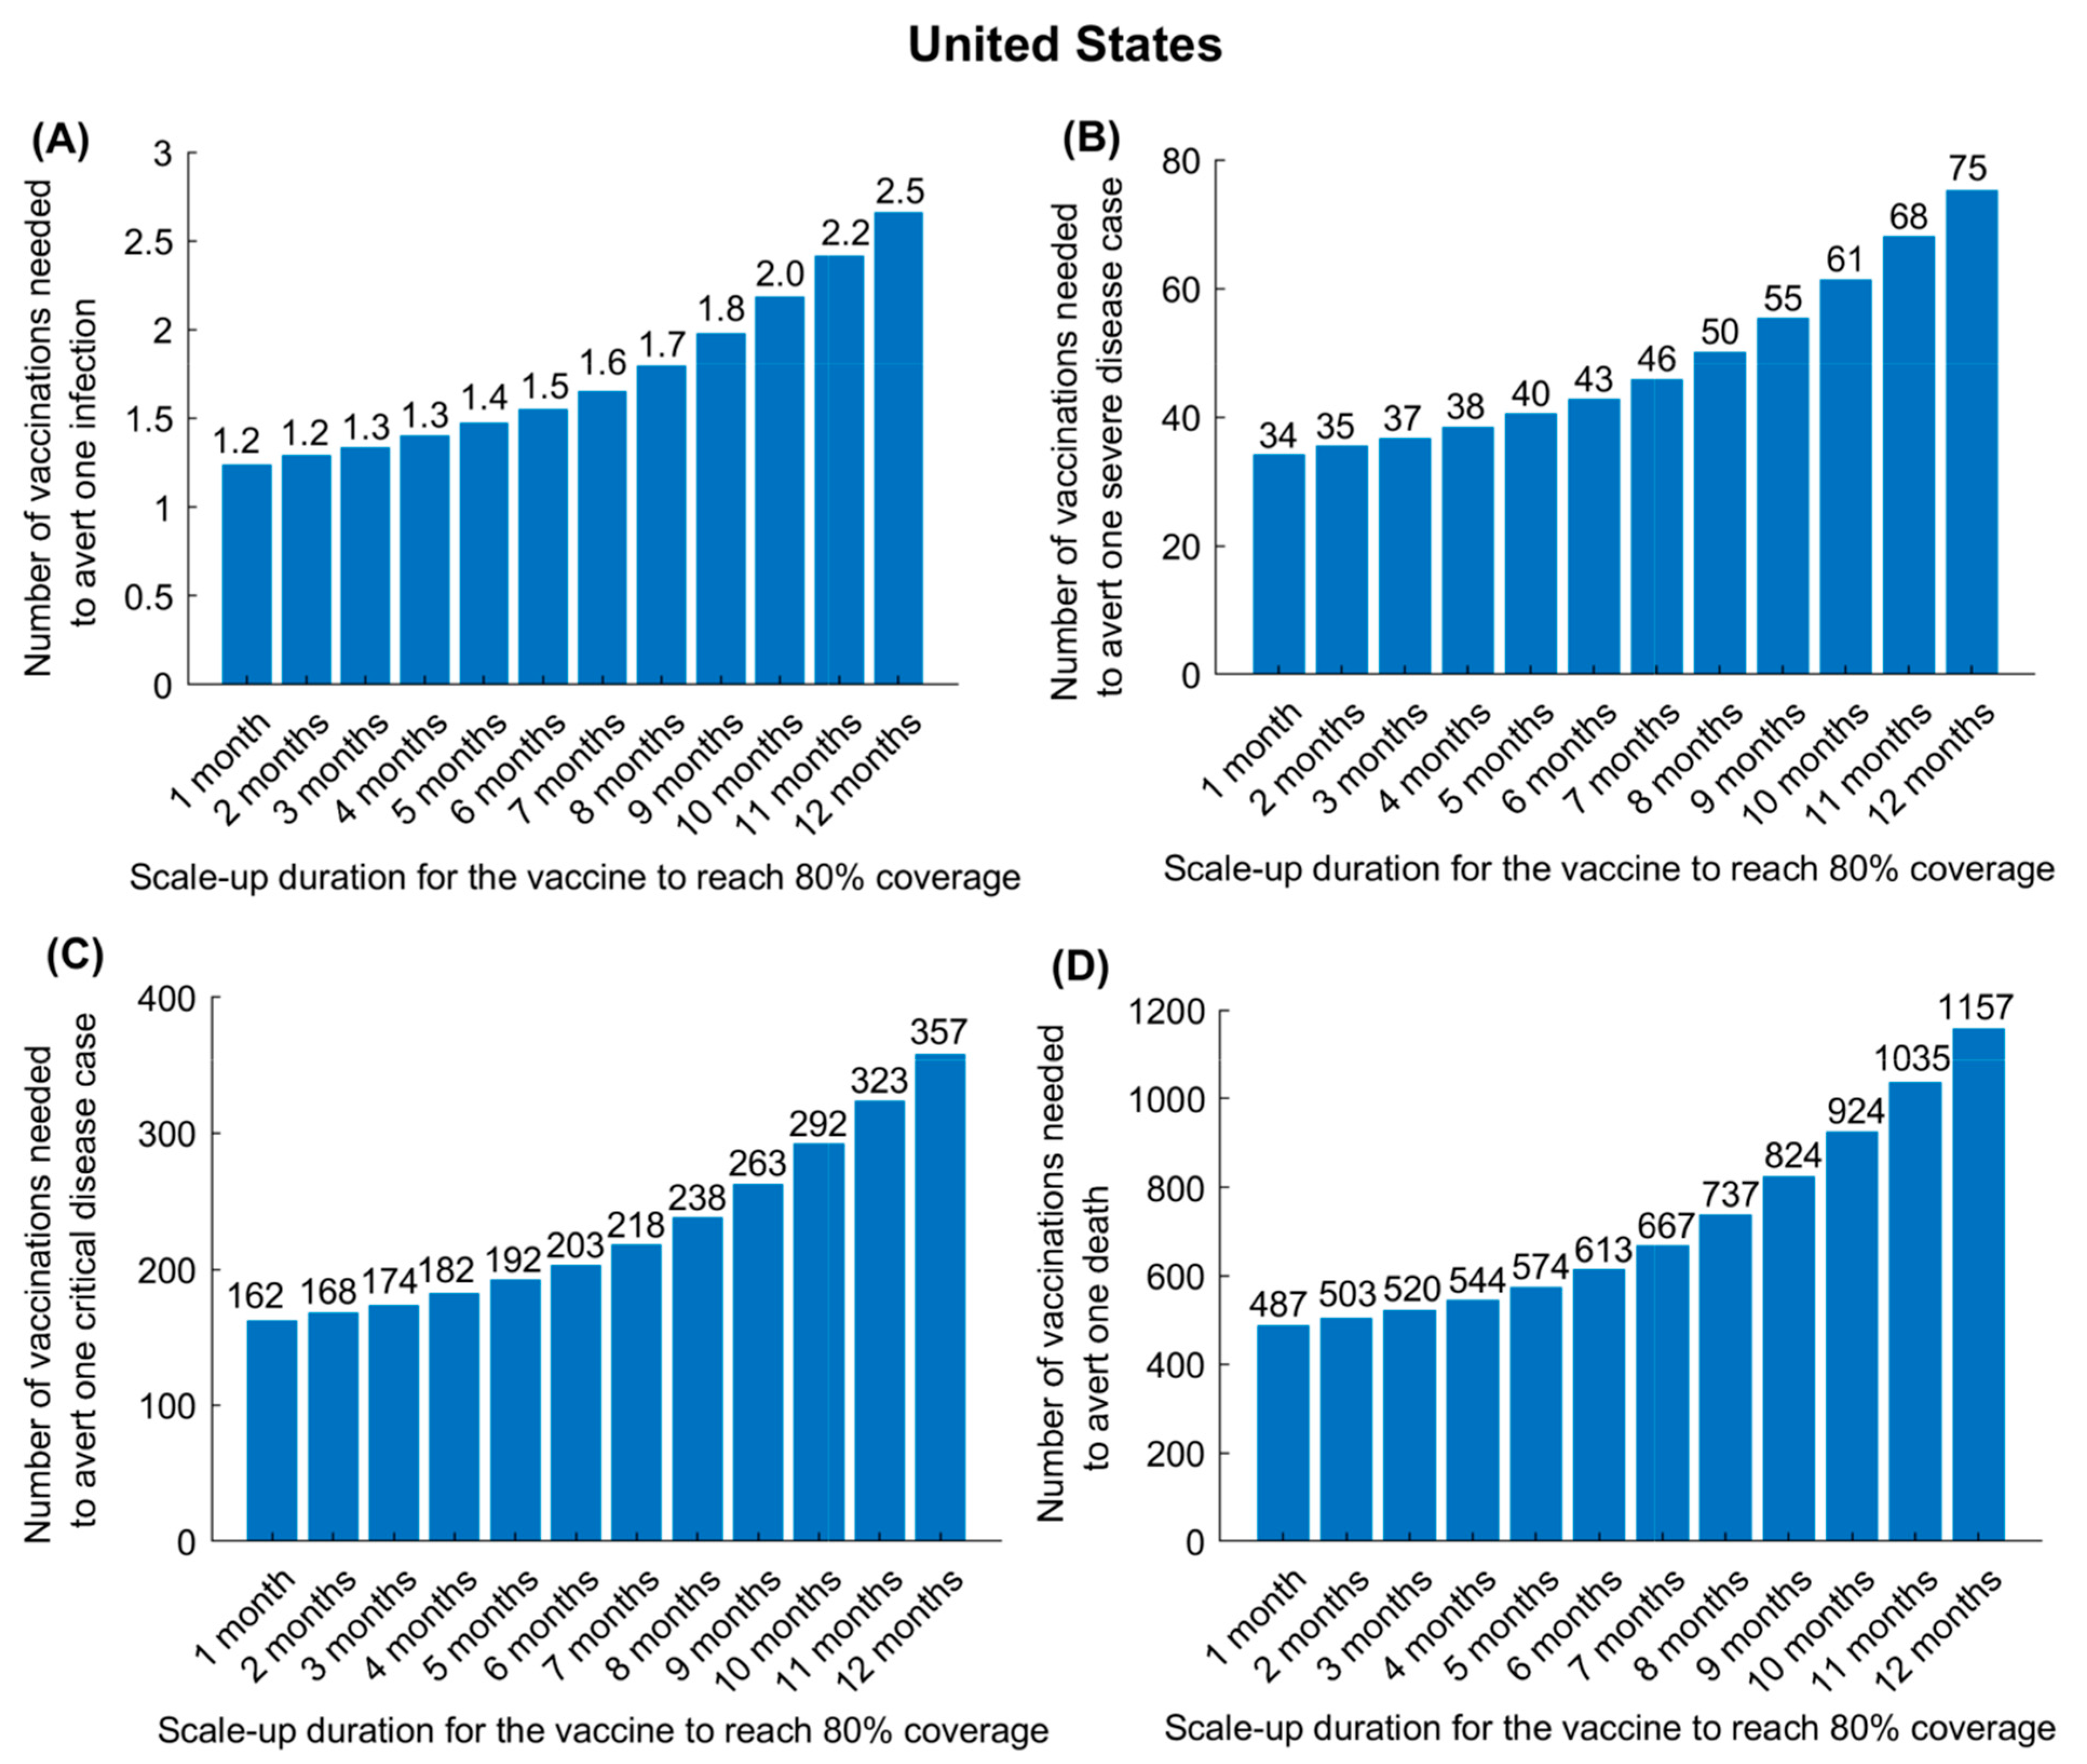
In the US, for , the effectiveness of the vaccine in preventing infection (Figure 4A), severe disease (Figure 4B), critical disease (Figure 4C), and death (Figure 4D) was substantially enhanced by more rapid scale-up to reach 80% coverage, since the epidemic was already at high incidence at time vaccination was launched. Whereas, in the US, only one vaccination was needed to avert one infection, provided that scale-up could be accomplished in 6 months, nearly three vaccinations were needed to avert one infection if the scale-up required 12 months. This, however, was not the case in China (Figure S8). Regardless of the speed of scale-up, only one vaccination was needed to avert one infection.
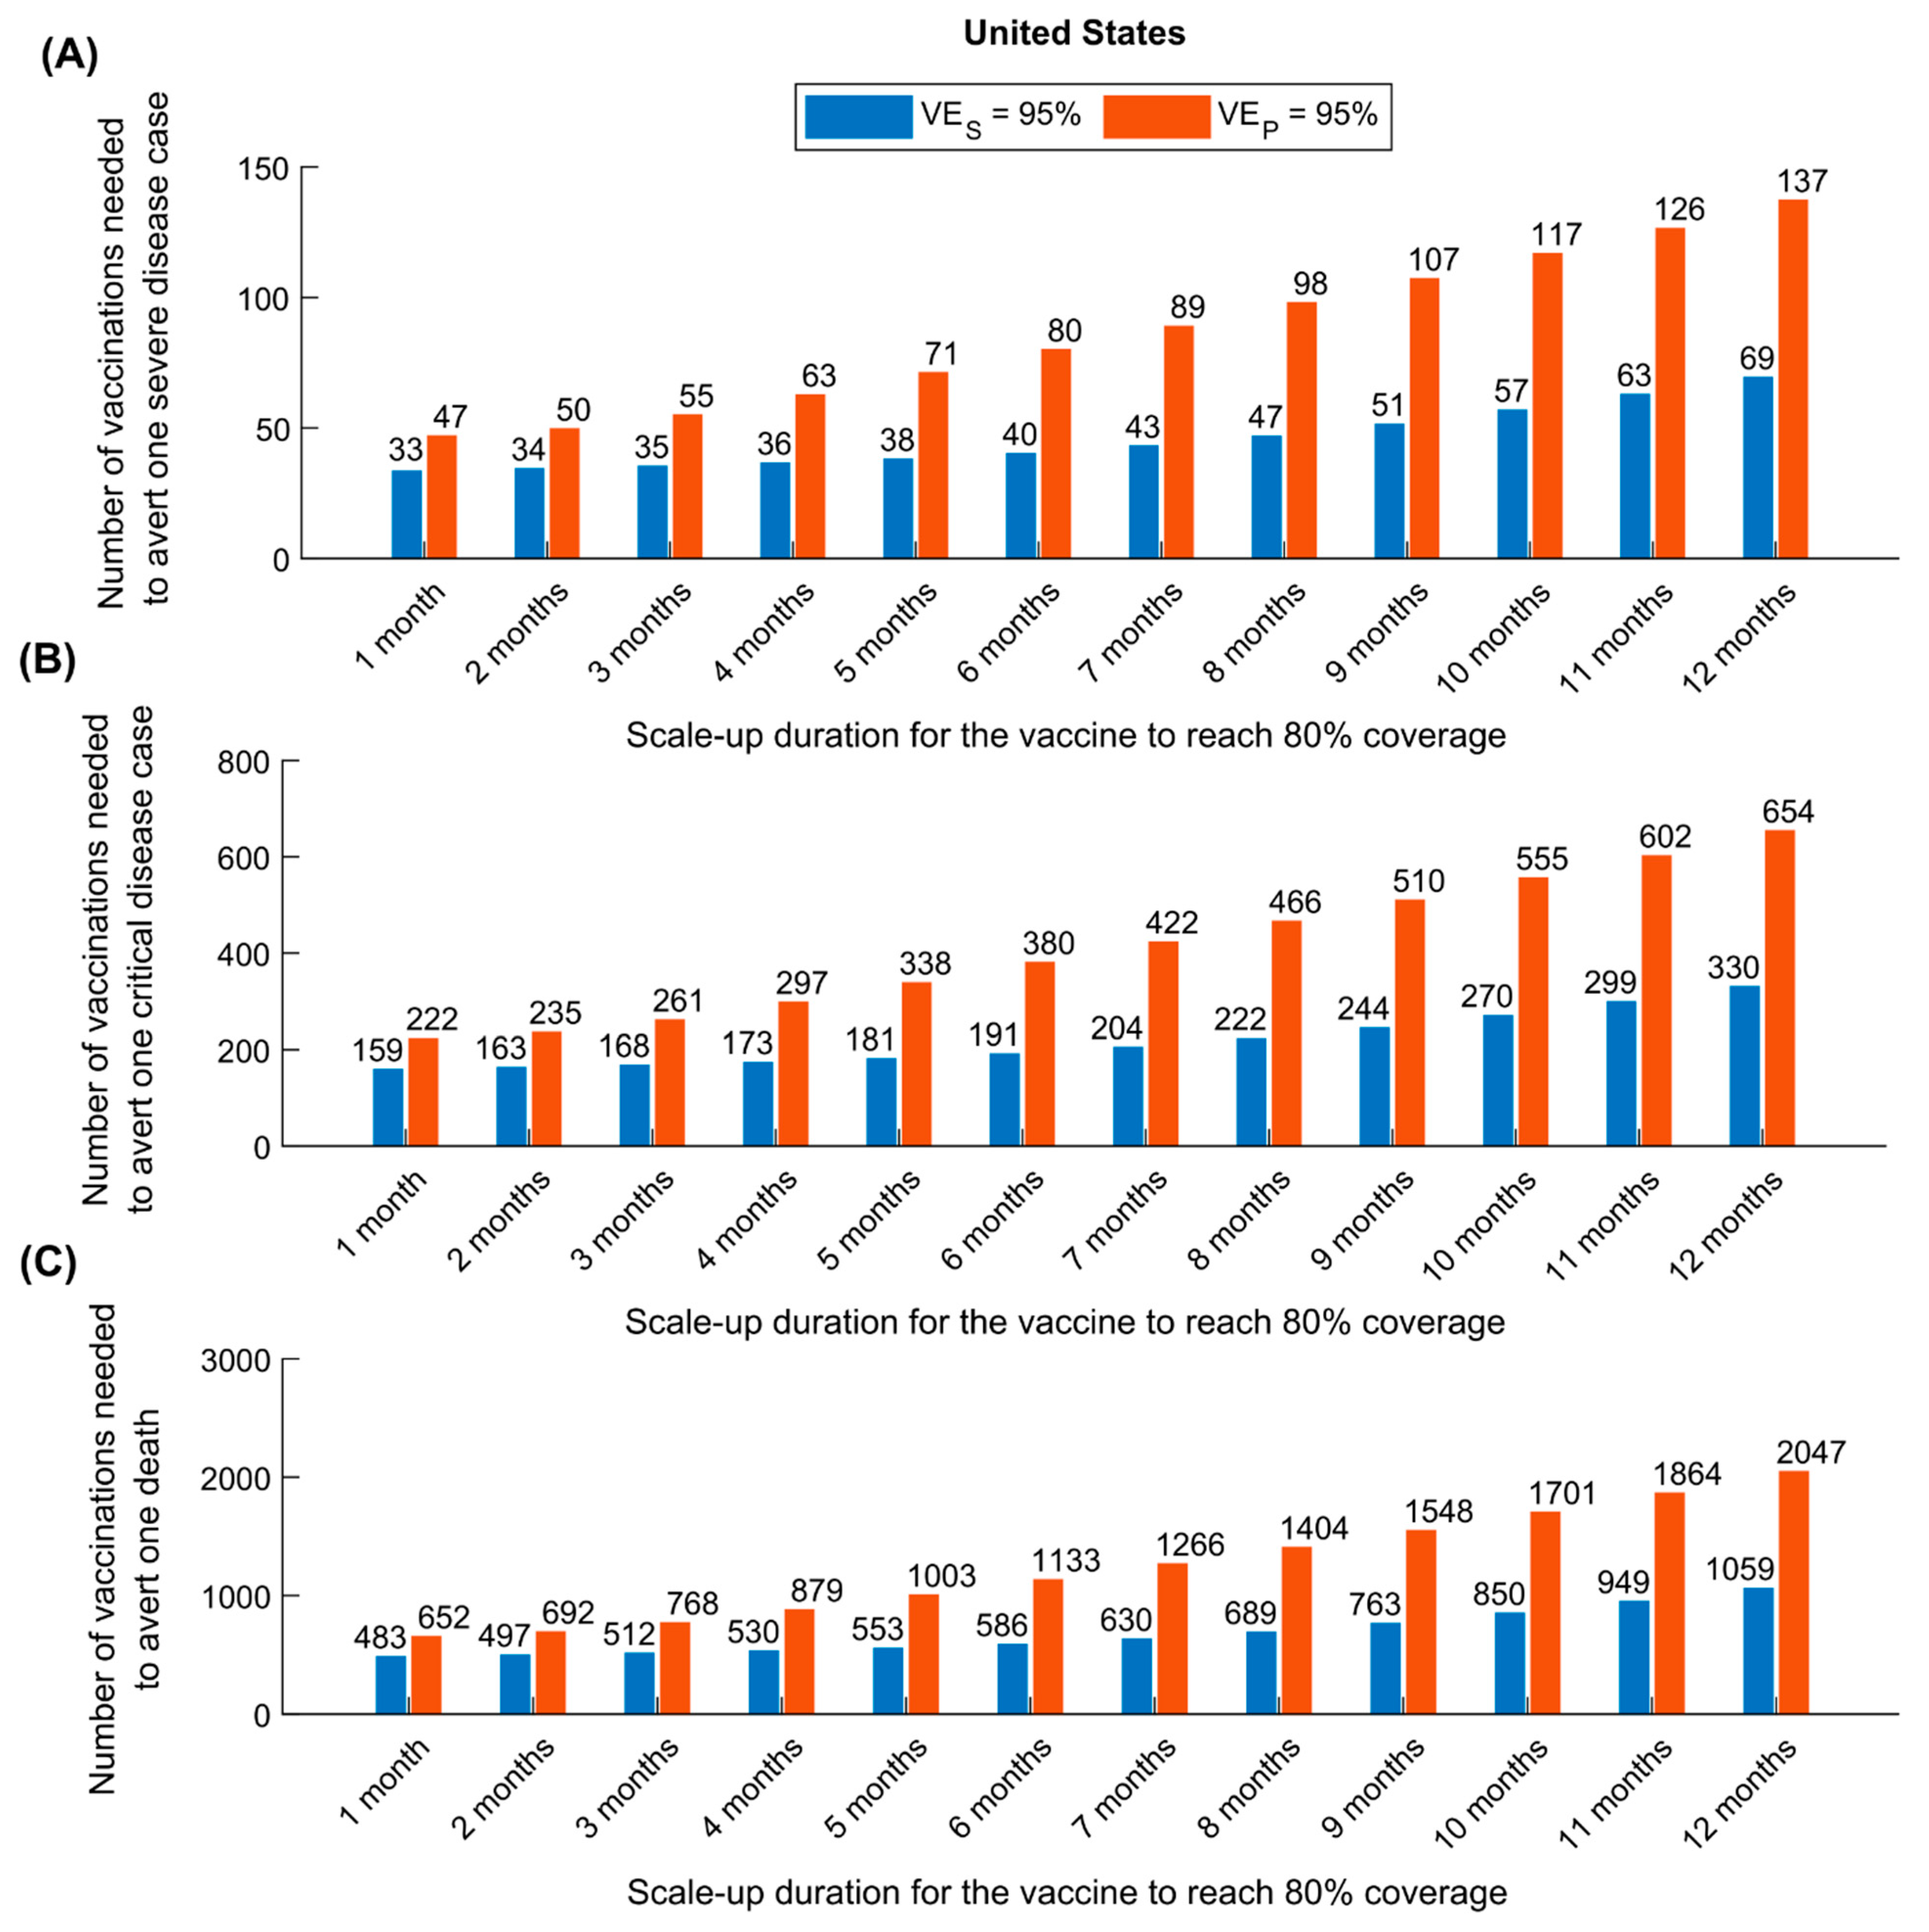
Figure 5 shows a comparison of the impact of vaccine scale-up duration on the number of vaccinations needed to avert one severe disease case (Figure 5A), one critical disease case (Figure 5B), and one death (Figure 5C), in the US, between the assumption of and that of . As expected, a vaccine that prevents infection (and consequently disease) was superior to a vaccine preventing only disease. That superiority was even greater if scale-up is longer, where twice as many vaccinations were needed to avert each of these outcomes. Similar results were obtained for China (Figure S9).
In all of the above scenarios, it was assumed that easing of social restrictions would occur during six months following initiation of vaccination. However, as expected, a longer duration for easing restrictions resulted in a more favorable impact of vaccination in both the US and China (Figure S10).
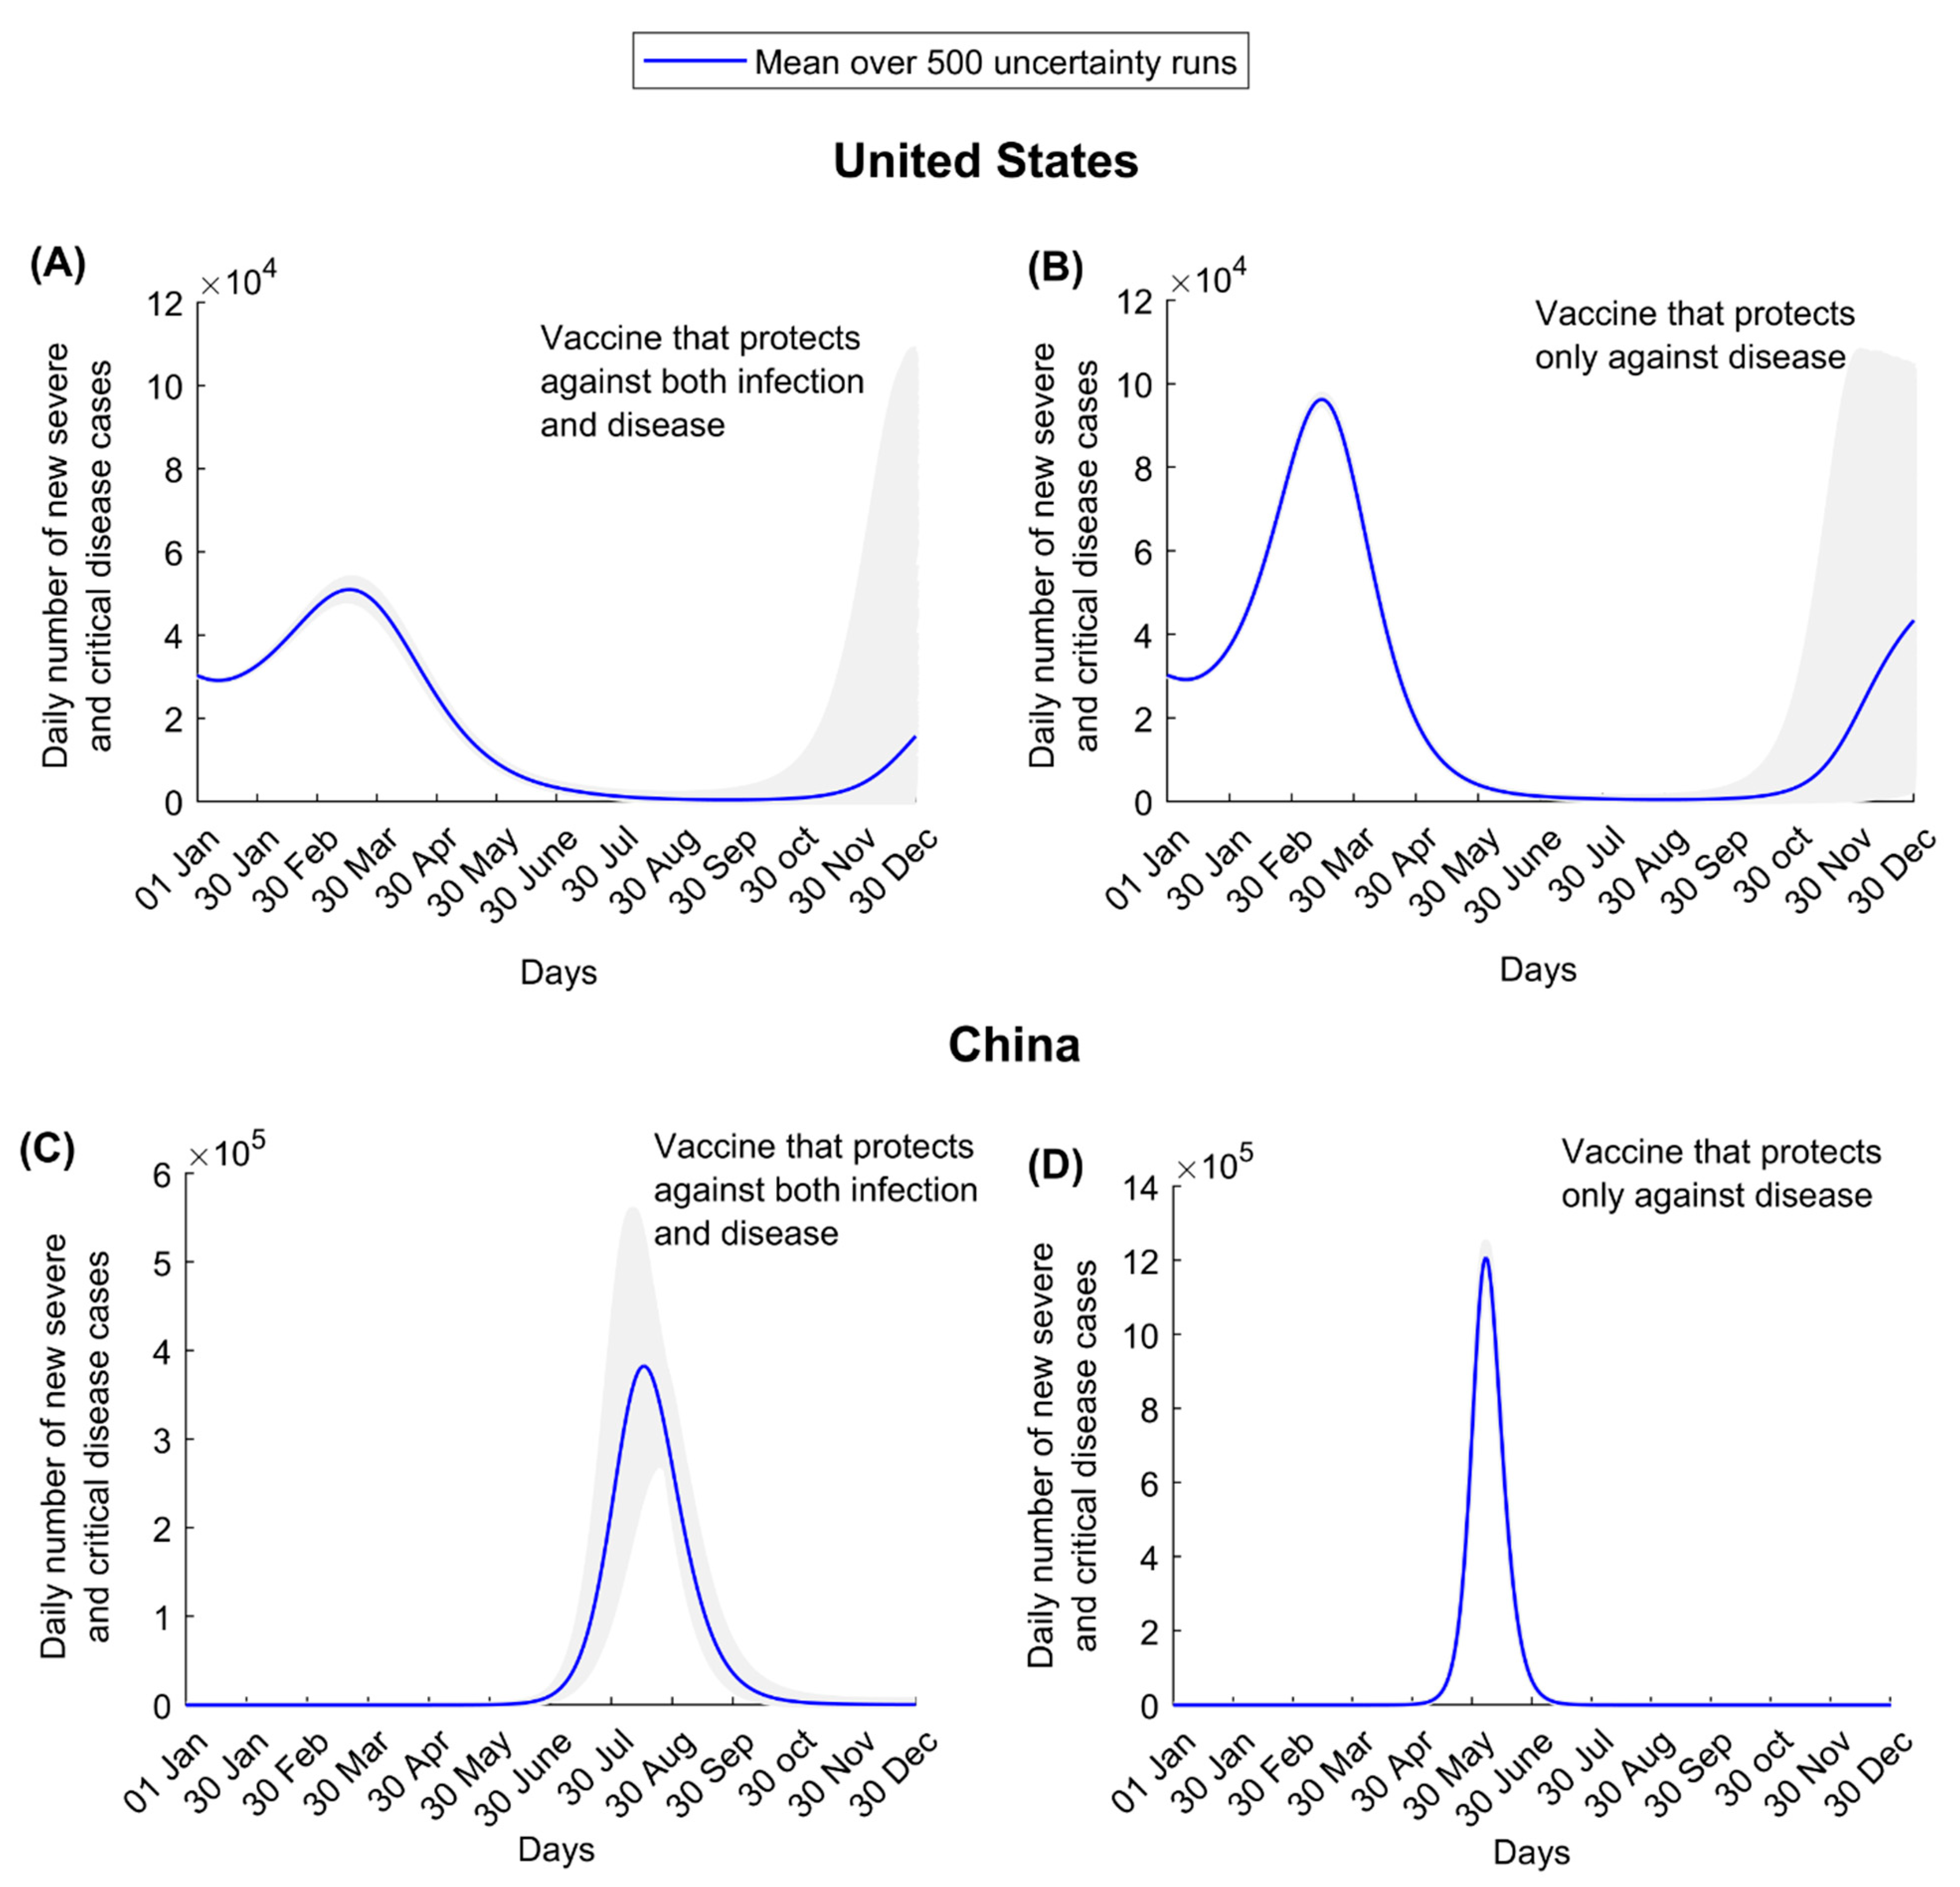
Uncertainty regarding the projected impact was small in the short-term for the US and China in the first wave after vaccinations commenced, but it was large toward the end of 2021, as expected, due to uncertainty about persistence of the vaccine’s protective immunity (Figure 6).
4. Discussion
The key conceptual finding that emerges from this study is that vaccine impact is strongly dependent on the difference between two essential metrics, “time to infection” and “time to vaccination”. The competing “hazard” dynamics between the event of infection and the event of vaccination explain the variability of impact under the parameters considered: incidence at the onset of vaccination, duration of scale-up, vaccine coverage, or timing of the easing of restrictions. As the average time to vaccination is shortened relative to the average time to infection, by altering these parameters (by more rapid scale-up, slower easing of restrictions, or reducing infection incidence through lockdowns or other restrictive measures), the impact would be more favorable, and fewer vaccinations would be needed to avert one infection or disease outcome.
A striking demonstration of this concept’s importance can be seen in the case of a vaccine that does not prevent infection but prevents disease with (Figures S4 and S5). This vaccine would not affect the time to infection in the population, and any easing of restrictions with vaccination will shorten the time to infection. Accordingly, such a vaccine, despite its 95% efficacy, would end up averting <20% of disease cases and deaths in the US and <50% in China. Since the time to infection in the US is much shorter than in China, as a consequence of the current high incidence rate, vaccine impact will be more favorable in China, where vaccination can be scaled up over a longer duration and still have superior impact to that in the US.
A consequence of the above findings is that vaccine impact will likely be heterogenous among nations. Countries with low or negligible incidence will benefit most from vaccination. Vaccine cost-effectiveness will be also optimized in such countries, with only one vaccination needed to avert one infection for a vaccine with (Figure S8).
Several other findings emerged from this study. Vaccination will flatten the epidemic curve but may not prevent (or delay) a new wave, unless it is scaled up very rapidly (Figure 1, Figure 2 and Figure 3). There is every virtue in rapidly scaling up vaccination, particularly in countries already suffering substantial incidence (Figure 3). Importantly, vaccination impact does not increase linearly with vaccine coverage; gains from vaccination would be proportionally higher if vaccine coverage exceeds 50% (Figure 3), stressing the importance of reaching high vaccine coverage. Easing of restrictions concurrently with vaccination can undermine many benefits of vaccination, as more people are likely to become infected before they are vaccinated. Easing of restrictions needs to be slow and gradual, tailored to the epidemiologic situation in each country (Figure S10). For instance, with its ongoing high incidence, easing of restrictions is not warranted in the US, while vaccination is scaled up.
With 95% efficacy, COVID-19 vaccination is very cost-effective, as fewer than three vaccinations are needed to avert one infection, and this effectiveness can be optimized further with more rapid scale-up (Figure 4 and Figure S8). The impact of vaccination in averting disease or death is two-fold higher for a vaccine that prevents infection compared to a vaccine that only prevents disease (Figure 1 and Figure 2 versus Figures S4 and S5). This is because preventing infection not only prevents disease directly but also reduces infection circulation, thus also indirectly reducing disease. Moreover, twice as many vaccinations are needed to avert one disease or death outcome for a vaccine that prevents only disease compared to one that prevents infection (Figure 5 and Figure S9).
This study has some limitations. Model estimations are contingent on the validity and the generalizability of input data. While we used available evidence for SARS-CoV-2 natural history and epidemiology, our understanding of its epidemiology is still evolving. All age groups were assumed equally susceptible to infection, but evidence suggests some biological differences in susceptibility [42,43,44,45,46,47,48,49]. The exact extent of exposure to the infection in both the US and China is unknown but plays an important role in vaccine impact. From an epidemiological perspective, we assumed that 20% of the US population and a negligible percentage of the Chinese population have been already infected, but vaccine impact can be quite different if such assumptions prove unrealistic. Vaccinated persons were assumed to be immediately protected once vaccinated, but in reality, vaccine protection develops over the course of a month following inoculation [6,7]. Two parameters remain unknown despite being critical to the longer-term impact of vaccination: durations of vaccine protection and natural immunity. If both prove to be relatively brief, the impact of the vaccine will be diminished, and it may be necessary to periodically re-immunize or to develop additional vaccines that protect against other circulating variants of this virus. Analysis was conducted at the national level, but operational differences at the subregional level may yield sub-regional differences in vaccination impact.
5. Conclusions
COVID-19 vaccination can have an immense impact on averting infection and/or disease. It can substantially flatten and delay future epidemic waves (if not prevent them altogether) and will be highly cost-effective, given the small number of vaccinations needed to avert one infection or one disease outcome. However, the impact of vaccination is likely to vary among countries, reflecting an underlying “epidemiological inequity”, as the epidemic phase in those countries also varies. Nations that will benefit most from vaccination are those where waiting time before vaccination is much shorter than time to infection, that is, countries currently at low incidence, such as China. For countries at high incidence, the impact may prove far less than current expectations, despite the vaccine’s 95% efficacy, if vaccination is scaled up slowly and/or if restrictions are eased prematurely. For countries such as the US, there is every virtue in scaling up vaccination rapidly, reaching high vaccine coverage, and delaying any easing of restrictions until viral incidence reaches low levels.
Supplementary Materials
The following are available online at https://www.mdpi.com/2076-393X/9/3/223/s1, Text S1A: Model Structure, Figure S1: Schematic diagram describing the SARS-CoV-2 transmission dynamics in presence of a vaccine that reduces susceptibility to infection, Table S1: Definitions of population variables and symbols used in the model, Text S1B: Model adjustment for a vaccine that reduces only severe and critical disease, Figure S2: Schematic diagram describing the SARS-CoV-2 transmission dynamics in presence of a vaccine that reduces severe and critical disease, but does not prevent infection, Figure S3: Distribution of waning of natural infection and vaccine immunity, Text S1C: Parameter values, Table S2: Model assumptions in terms of parameter values, Figure S4: Vaccine coverage scale-up, Figure S5: Impact of SARS-CoV-2 vaccination on number of (A) new infections, (B) new severe disease cases, (C) new critical disease cases, and (D) new deaths in the United States, Figure S6: Impact of SARS-CoV-2 vaccination on number of (A) new infections, (B) new severe disease cases, (C) new critical disease cases, and (D) new deaths in China, Figure S7: Impact of vaccine scale-up duration and vaccine coverage on number of averted severe and critical disease cases for a vaccine that protects only against disease, Figure S8: Impact of vaccine scale-up duration on number of vaccinations needed to avert one infection (A), one severe disease case (B), one critical disease case (C), and one death (D), in China, Figure S9: Comparison of the impact of a vaccine acting against infection (VES efficacy) versus a vaccine acting only against disease (VEP efficacy) in China, Figure S10: Impact of the duration of easing of the social and physical distancing restrictions on number of averted severe and critical disease cases.
Author Contributions
Conceptualization, L.J.A.-R.; methodology, L.J.A.-R., M.M. and H.C.; validation, L.J.A.-R. and M.M.; formal analysis, L.J.A.-R., M.M. and H.C.; writing—original draft preparation, L.J.A.-R., M.M. and H.C.; writing—review and editing, L.J.A.-R., M.M., H.C., H.H.A. and S.S.; supervision, L.J.A.-R.; project administration, L.J.A.-R.; funding acquisition, L.J.A.-R. All authors have read and agreed to the published version of the manuscript.
Funding
The developed mathematical models were made possible by NPRP grant number 9-040-3-008 (Principal investigator: LJA) and NPRP grant number 12S-0216-190094 (Principal investigator: LJA) from the Qatar National Research Fund (a member of Qatar Foundation; https://www.qnrf.org, accessed on 4 March 2021). The statements made herein are solely the responsibility of the authors.
Institutional Review Board Statement
Not applicable.
Informed Consent Statement
Not applicable.
Data Availability Statement
All data are available in the manuscript and its Supplementary Materials. Code programmed in MATLAB can be found at: https://github.com/MouniaM/Mounia_Vacc_covid19.git (accessed on 2 February 2021).
Acknowledgments
The authors are grateful for support provided by the Biomedical Research Program and the Biostatistics, Epidemiology, and Biomathematics Research Core, both at Weill Cornell Medicine-Qatar.
Conflicts of Interest
The authors declare no conflict of interest. The funders had no role in the design of the study; in the collection, analyses, or interpretation of data; in the writing of the manuscript, or in the decision to publish the results.
References
- COVID-19 Outbreak Live Update. Available online: https://www.worldometers.info/coronavirus/ (accessed on 11 November 2020).
- United Nations. Shared Responsibility, Global Solidarity: Responding to the Socio-Economic Impacts of COVID-19. Available online: https://www.un.org/sites/un2.un.org/files/sg_report_socio-economic_impact_of_covid19.pdf (accessed on 16 April 2020).
- Kaplan, J.; Frias, L.; McFall-Johnsen, M. A Third of the Global Population Is on Coronavirus Lockdown. Available online: https://www.businessinsider.com.au/countries-on-lockdown-coronavirus-italy-2020-3 (accessed on 25 April 2020).
- Gilardino, R.E. Does “flattening the curve” affect critical care services delivery for COVID-19? A global health perspective. Int. J. Health Policy Manag. 2020, 9, 503–507. [Google Scholar] [CrossRef] [PubMed]
- Makhoul, M.; Ayoub, H.H.; Chemaitelly, H.; Seedat, S.; Mumtaz, G.R.; Al-Omari, S.; Abu-Raddad, L.J. Epidemiological impact of SARS-CoV-2 vaccination: Mathematical modeling analyses. Vaccines 2020, 8, 668. [Google Scholar] [CrossRef] [PubMed]
- Jackson, L.A.; Anderson, E.J.; Rouphael, N.G.; Roberts, P.C.; Makhene, M.; Coler, R.N.; McCullough, M.P.; Chappell, J.D.; Denison, M.R.; Stevens, L.J.; et al. An mRNA Vaccine against SARS-CoV-2—Preliminary Report. N. Engl. J. Med. 2020, 383, 1920–1931. [Google Scholar] [CrossRef]
- Polack, F.P.; Thomas, S.J.; Kitchin, N.; Absalon, J.; Gurtman, A.; Lockhart, S.; Perez, J.L.; Perez Marc, G.; Moreira, E.D.; Zerbini, C.; et al. Safety and Efficacy of the BNT162b2 mRNA Covid-19 Vaccine. N. Engl. J. Med. 2020, 383, 2603–2615. [Google Scholar] [CrossRef]
- Voysey, M.; Clemens, S.A.C.; Madhi, S.A.; Weckx, L.Y.; Folegatti, P.M.; Aley, P.K.; Angus, B.; Baillie, V.L.; Barnabas, S.L.; Bhorat, Q.E.; et al. Safety and efficacy of the ChAdOx1 nCoV-19 vaccine (AZD1222) against SARS-CoV-2: An interim analysis of four randomised controlled trials in Brazil, South Africa, and the UK. Lancet 2020, 397, 99–111. [Google Scholar] [CrossRef]
- MATLAB®. The Language of Technical Computing; The MathWorks, Inc.: Natick, MA, USA, 2019. [Google Scholar]
- Abu-Raddad, L.J.; Chemaitelly, H.; Malek, J.A.; Ahmed, A.A.; Mohamoud, Y.A.; Younuskunju, S.; Ayoub, H.H.; Al Kanaani, Z.; Al Khal, A.; Al Kuwari, E.; et al. Assessment of the risk of SARS-CoV-2 reinfection in an intense re-exposure setting. Clin. Infect. Dis. 2020, ciaa1846. [Google Scholar] [CrossRef]
- Tillett, R.L.; Sevinsky, J.R.; Hartley, P.D.; Kerwin, H.; Crawford, N.; Gorzalski, A.; Laverdure, C.; Verma, S.C.; Rossetto, C.C.; Jackson, D.; et al. Genomic evidence for reinfection with SARS-CoV-2: A case study. Lancet Infect. Dis. 2020, 21, 52–58. [Google Scholar] [CrossRef]
- To, K.K.; Hung, I.F.; Ip, J.D.; Chu, A.W.; Chan, W.M.; Tam, A.R.; Fong, C.H.; Yuan, S.; Tsoi, H.W.; Ng, A.C.; et al. COVID-19 re-infection by a phylogenetically distinct SARS-coronavirus-2 strain confirmed by whole genome sequencing. Clin. Infect. Dis. 2020. [Google Scholar] [CrossRef]
- Van Elslande, J.; Vermeersch, P.; Vandervoort, K.; Wawina-Bokalanga, T.; Vanmechelen, B.; Wollants, E.; Laenen, L.; Andre, E.; Van Ranst, M.; Lagrou, K.; et al. Symptomatic SARS-CoV-2 reinfection by a phylogenetically distinct strain. Clin. Infect. Dis. 2020. [Google Scholar] [CrossRef] [PubMed]
- Prado-Vivar, B.; Becerra-Wong, M.; Guadalupe, J.J.; Marquez, S.; Gutierrez, B.; Rojas-Silva, P.; Trueba, G.; Barragan, V.; Cardenas, P. COVID-19 re-infection by a phylogenetically distinct SARS-CoV-2 variant, first confirmed event in South America. SSRN 2020. preprint. [Google Scholar] [CrossRef]
- Abu-Raddad, L.J.; Chemaitelly, H.; Coyle, P.; Malek, J.A.; Ahmed, A.A.; Mohamoud, Y.A.; Younuskunju, S.; Ayoub, H.H.; Al Kanaani, Z.; Al Kuwari, E.; et al. SARS-CoV-2 reinfection in a cohort of 43,000 antibody-positive individuals followed for up to 35 weeks. medRxiv 2021. [Google Scholar] [CrossRef]
- Kissler, S.M.; Tedijanto, C.; Goldstein, E.; Grad, Y.H.; Lipsitch, M. Projecting the transmission dynamics of SARS-CoV-2 through the postpandemic period. Science 2020, 368, 860–868. [Google Scholar] [CrossRef] [PubMed]
- Dan, J.M.; Mateus, J.; Kato, Y.; Hastie, K.M.; Yu, E.D.; Faliti, C.E.; Grifoni, A.; Ramirez, S.I.; Haupt, S.; Frazier, A.; et al. Immunological memory to SARS-CoV-2 assessed for up to 8 months after infection. Science 2021. [Google Scholar] [CrossRef]
- Wajnberg, A.; Amanat, F.; Firpo, A.; Altman, D.R.; Bailey, M.J.; Mansour, M.; McMahon, M.; Meade, P.; Mendu, D.R.; Muellers, K.; et al. Robust neutralizing antibodies to SARS-CoV-2 infection persist for months. Science 2020, 370, 1227–1230. [Google Scholar] [CrossRef]
- Lumley, S.F.; O’Donnell, D.; Stoesser, N.E.; Matthews, P.C.; Howarth, A.; Hatch, S.B.; Marsden, B.D.; Cox, S.; James, T.; Warren, F.; et al. Antibody Status and Incidence of SARS-CoV-2 Infection in Health Care Workers. N. Engl. J. Med. 2020, 384, 533–540. [Google Scholar] [CrossRef]
- Li, R.; Pei, S.; Chen, B.; Song, Y.; Zhang, T.; Yang, W.; Shaman, J. Substantial undocumented infection facilitates the rapid dissemination of novel coronavirus (SARS-CoV2). Science 2020, 368, 489–493. [Google Scholar] [CrossRef] [Green Version]
- Lauer, S.A.; Grantz, K.H.; Bi, Q.; Jones, F.K.; Zheng, Q.; Meredith, H.R.; Azman, A.S.; Reich, N.G.; Lessler, J. The Incubation Period of Coronavirus Disease 2019 (COVID-19) From Publicly Reported Confirmed Cases: Estimation and Application. Ann. Intern. Med. 2020, 172, 577–582. [Google Scholar] [CrossRef] [PubMed] [Green Version]
- Rothe, C.; Schunk, M.; Sothmann, P.; Bretzel, G.; Froeschl, G.; Wallrauch, C.; Zimmer, T.; Thiel, V.; Janke, C.; Guggemos, W.; et al. Transmission of 2019-nCoV Infection from an Asymptomatic Contact in Germany. N. Engl. J. Med. 2020, 382, 970–971. [Google Scholar] [CrossRef] [PubMed] [Green Version]
- Zou, L.; Ruan, F.; Huang, M.; Liang, L.; Huang, H.; Hong, Z.; Yu, J.; Kang, M.; Song, Y.; Xia, J.; et al. SARS-CoV-2 Viral Load in Upper Respiratory Specimens of Infected Patients. N. Engl. J. Med. 2020, 382, 1177–1179. [Google Scholar] [CrossRef] [PubMed]
- He, X.; Lau, E.H.Y.; Wu, P.; Deng, X.; Wang, J.; Hao, X.; Lau, Y.C.; Wong, J.Y.; Guan, Y.; Tan, X.; et al. Temporal dynamics in viral shedding and transmissibility of COVID-19. Nat. Med. 2020, 26, 672–675. [Google Scholar] [CrossRef] [PubMed] [Green Version]
- World Health Organization. Report of the WHO-China Joint Mission on Coronavirus Disease 2019 (COVID-19). Available online: https://www.who.int/docs/default-source/coronaviruse/who-china-joint-mission-on-covid-19-final-report.pdf (accessed on 10 March 2020).
- Guan, W.J.; Ni, Z.Y.; Hu, Y.; Liang, W.H.; Ou, C.Q.; He, J.X.; Liu, L.; Shan, H.; Lei, C.L.; Hui, D.S.C.; et al. Clinical Characteristics of Coronavirus Disease 2019 in China. N. Engl. J. Med. 2020, 382, 1708–1720. [Google Scholar] [CrossRef]
- Huang, C.; Wang, Y.; Li, X.; Ren, L.; Zhao, J.; Hu, Y.; Zhang, L.; Fan, G.; Xu, J.; Gu, X.; et al. Clinical features of patients infected with 2019 novel coronavirus in Wuhan, China. Lancet 2020, 395, 497–506. [Google Scholar] [CrossRef] [Green Version]
- Salje, H.; Tran Kiem, C.; Lefrancq, N.; Courtejoie, N.; Bosetti, P.; Paireau, J.; Andronico, A.; Hoze, N.; Richet, J.; Dubost, C.L.; et al. Estimating the burden of SARS-CoV-2 in France. Science 2020, 369, 208–211. [Google Scholar] [CrossRef]
- Seedat, S.; Chemaitelly, H.; Ayoub, H.; Makhoul, M.; Mumtaz, G.R.; Al Kanaani, Z.; Al Khal, A.; Al Kuwari, E.; Butt, A.A.; Coyle, P.; et al. SARS-CoV-2 infection hospitalization, severity, criticality, and fatality rates. medRxiv 2020. [Google Scholar] [CrossRef]
- World Health Organization. Clinical Management of COVID-19. Available online: https://www.who.int/publications-detail/clinical-management-of-covid-19 (accessed on 31 May 2020).
- World Health Organization. International Guidelines for Certification and Classification (Coding) of COVID-19 as Cause of Death. Document Number: WHO/HQ/DDI/DNA/CAT. Available online: https://www.who.int/classifications/icd/Guidelines_Cause_of_Death_COVID-19-20200420-EN.pdf?ua=1 (accessed on 1 June 2020).
- United Nations Department of Economic and Social Affairs Population Dynamics. The 2019 Revision of World Population Prospects. Available online: https://population.un.org/wpp/ (accessed on 1 March 2020).
- Bajema, K.L.; Wiegand, R.E.; Cuffe, K.; Patel, S.V.; Iachan, R.; Lim, T.; Lee, A.; Moyse, D.; Havers, F.P.; Harding, L.; et al. Estimated SARS-CoV-2 Seroprevalence in the US as of September 2020. JAMA Intern. Med. 2020. [Google Scholar] [CrossRef]
- He, W.; Yi, G.Y.; Zhu, Y. Estimation of the basic reproduction number, average incubation time, asymptomatic infection rate, and case fatality rate for COVID-19: Meta-analysis and sensitivity analysis. J. Med. Virol. 2020, 92, 2543–2550. [Google Scholar] [CrossRef]
- MIDAS Online COVID-19 Portal. COVID-19 Parameter Estimates: Basic Reproduction Number. Available online: https://github.com/midas-network/COVID-19/tree/master/parameter_estimates/2019_novel_coronavirus (accessed on 19 May 2020).
- Korber, B.; Fischer, W.M.; Gnanakaran, S.; Yoon, H.; Theiler, J.; Abfalterer, W.; Hengartner, N.; Giorgi, E.E.; Bhattacharya, T.; Foley, B.; et al. Tracking Changes in SARS-CoV-2 Spike: Evidence that D614G Increases Infectivity of the COVID-19 Virus. Cell 2020, 182, 812–827.e819. [Google Scholar] [CrossRef] [PubMed]
- Grubaugh, N.D.; Hanage, W.P.; Rasmussen, A.L. Making Sense of Mutation: What D614G Means for the COVID-19 Pandemic Remains Unclear. Cell 2020, 182, 794–795. [Google Scholar] [CrossRef] [PubMed]
- Lauring, A.S.; Hodcroft, E.B. Genetic Variants of SARS-CoV-2-What Do They Mean? JAMA J. Am. Med. Assoc. 2021. [Google Scholar] [CrossRef]
- Bubar, K.M.; Reinholt, K.; Kissler, S.M.; Lipsitch, M.; Cobey, S.; Grad, Y.H.; Larremore, D.B. Model-informed COVID-19 vaccine prioritization strategies by age and serostatus. Science 2021, 371, 916–921. [Google Scholar] [CrossRef]
- Mckay, M.D.; Beckman, R.J.; Conover, W.J. A Comparison of Three Methods for Selecting Values of Input Variables in the Analysis of Output from a Computer Code. Technometrics 1979, 21, 239–245. [Google Scholar] [CrossRef]
- Sanchez, M.A.; Blower, S.M. Uncertainty and sensitivity analysis of the basic reproductive rate—Tuberculosis as an example. Am. J. Epidemiol. 1997, 145, 1127–1137. [Google Scholar] [CrossRef] [Green Version]
- Ayoub, H.H.; Chemaitelly, H.; Mumtaz, G.R.; Seedat, S.; Awad, S.F.; Makhoul, M.; Abu-Raddad, L.J. Characterizing key attributes of the epidemiology of COVID-19 in China: Model-based estimations. Glob. Epidemiol. 2020, 2, 100042. [Google Scholar] [CrossRef]
- Davies, N.G.; Klepac, P.; Liu, Y.; Prem, K.; Jit, M.; CMMID COVID-19 Working Group; Eggo, R.M. Age-dependent effects in the transmission and control of COVID-19 epidemics. Nat. Med. 2020, 26, 1205–1211. [Google Scholar] [CrossRef]
- Mizumoto, K.; Omori, R.; Nishiura, H. Age specificity of cases and attack rate of novel coronavirus disease (COVID-19). medRxiv 2020. [Google Scholar] [CrossRef] [Green Version]
- Zhu, Y.; Bloxham, C.J.; Hulme, K.D.; Sinclair, J.E.; Tong, Z.W.M.; Steele, L.E.; Noye, E.C.; Lu, J.; Chew, K.Y.; Pickering, J.; et al. Children are unlikely to have been the primary source of household SARS-CoV-2 infections. medRxiv 2020. [Google Scholar] [CrossRef]
- Colson, P.; Tissot-Dupont, H.; Morand, A.; Boschi, C.; Ninove, L.; Esteves-Vieira, V.; Gautret, P.; Brouqui, P.; Parola, P.; Lagier, J.C.; et al. Children account for a small proportion of diagnoses of SARS-CoV-2 infection and do not exhibit greater viral loads than adults. Eur. J. Clin. Microbiol. Infect. Dis. 2020, 39, 1983–1987. [Google Scholar] [CrossRef] [PubMed]
- Macartney, K.; Quinn, H.E.; Pillsbury, A.J.; Koirala, A.; Deng, L.; Winkler, N.; Katelaris, A.L.; O’Sullivan, M.V.N.; Dalton, C.; Wood, N.; et al. Transmission of SARS-CoV-2 in Australian educational settings: A prospective cohort study. Lancet Child Adolesc. Health 2020, 4, 807–816. [Google Scholar] [CrossRef]
- Goldstein, E.; Lipsitch, M.; Cevik, M. On the effect of age on the transmission of SARS-CoV-2 in households, schools and the community. J. Infect. Dis. 2021, 223, 362–369. [Google Scholar] [CrossRef] [PubMed]
- Merckx, J.; Labrecque, J.A.; Kaufman, J.S. Transmission of SARS-CoV-2 by Children. Dtsch. Arztebl. Int. 2020, 117, 553–560. [Google Scholar] [CrossRef] [PubMed]
Figure 1.
Impact of severe acute respiratory syndrome coronavirus 2 (SARS-CoV-2) vaccination on numbers of (A) new infections, (B) new severe disease cases, (C) new critical disease cases, and (D) new deaths in the United States. The vaccine is assumed to have an efficacy of 95% against infection and is introduced on 1 January 2021, when the proportion of the population already infected is 20%. Vaccine coverage is scaled up to reach 80% by 31 December 2021 (Figure S4A shows the vaccine coverage scale-up in the United States over time). Duration of both vaccine protection and natural immunity is one year. This scenario assumes an of 1.2 on 1 January 2021, which increases with gradual easing of restrictions to reach 4.0 after six months. Results of a scenario assuming that the vaccine has no efficacy against infection but an efficacy of 95% against severe and critical disease are shown in Figure S5.

Figure 2.
Impact of SARS-CoV-2 vaccination on numbers of (A) new infections, (B) new severe disease cases, (C) new critical disease cases, and (D) new deaths in China. The vaccine is assumed to have an efficacy of 95% against infection and is introduced on 1 January 2021. Vaccine coverage is scaled up to reach 80% by 31 December 2021 (Figure S4B shows the vaccine coverage scale-up in China over time). Duration of both vaccine protection and natural immunity is one year. This scenario assumes an of 1.0 on 1 January 2021, which increases with gradual easing of restrictions to reach 4.0 after six months. Results of a scenario assuming that the vaccine has no efficacy against infection but an efficacy of 95% against severe and critical disease are shown in Figure S6.

Figure 3.
Impact of vaccine scale-up duration and vaccine coverage on numbers of averted severe and critical disease cases for a vaccine that protects against both infection and disease. Cumulative averted severe and critical disease cases in (A) the United States and (C) China at different vaccination scale-up durations to reach 80% coverage. Cumulative averted severe and critical disease cases in (B) the United States and (D) China at varying levels of vaccine coverage. The vaccine is assumed to have an efficacy of 95% against infection and is introduced on 1 January 2021, when the cumulative proportion of the population infected is 20% in the United States and 0% in China. Duration of both vaccine protection and natural immunity is one year. This scenario assumes gradual easing of restrictions within 6 months. The results of a scenario assuming the vaccine has no efficacy against infection but an efficacy of 95% against severe and critical disease is shown in Figure S7.

Figure 4.
Impact of vaccine scale-up duration on the number of vaccinations needed to avert one infection (A), one severe disease case (B), one critical disease case (C), and one death (D) in the United States. The vaccine is assumed to have an efficacy of 95% against infection and is introduced on 1 January 2021, when the cumulative proportion of the population infected is 20%. Duration of both vaccine protection and natural immunity is one year. This scenario assumes a gradual easing of restrictions within 6 months. Corresponding results for China are shown in Figure S8.

Figure 5.
Comparison of the impact of a vaccine acting against infection (VES efficacy) versus a vaccine acting only against disease (VEP efficacy) in the United States. The number of vaccinations needed to avert one severe disease case (A), one critical disease case (B), and one death (C) for a vaccine with versus a vaccine with . The vaccine is introduced on 1 January 2021, when the cumulative proportion of the population infected is 20%. Duration of both vaccine protection and natural immunity is one year. This scenario assumes a gradual easing of restrictions within 6 months. Corresponding results for China are shown in Figure S9.

Figure 6.
Numbers of new severe and critical disease cases in the United States assuming (A) a vaccine that protects against both infection and disease and (B) a vaccine that protects only against disease. Numbers of new severe and critical disease cases in China assuming (C) a vaccine that protects against both infection and disease and (D) a vaccine that protects only against disease. These scenarios assume gradual easing of restrictions within 6 months. Shaded areas are the results of the 500 uncertainty runs, while the solid line is the mean of those runs.

Publisher’s Note: MDPI stays neutral with regard to jurisdictional claims in published maps and institutional affiliations. |
© 2021 by the authors. Licensee MDPI, Basel, Switzerland. This article is an open access article distributed under the terms and conditions of the Creative Commons Attribution (CC BY) license (http://creativecommons.org/licenses/by/4.0/).
Share and Cite
MDPI and ACS Style
Makhoul, M.; Chemaitelly, H.; Ayoub, H.H.; Seedat, S.; Abu-Raddad, L.J. Epidemiological Differences in the Impact of COVID-19 Vaccination in the United States and China. Vaccines 2021, 9, 223. https://doi.org/10.3390/vaccines9030223
AMA Style
Makhoul M, Chemaitelly H, Ayoub HH, Seedat S, Abu-Raddad LJ. Epidemiological Differences in the Impact of COVID-19 Vaccination in the United States and China. Vaccines. 2021; 9(3):223. https://doi.org/10.3390/vaccines9030223
Chicago/Turabian StyleMakhoul, Monia, Hiam Chemaitelly, Houssein H. Ayoub, Shaheen Seedat, and Laith J. Abu-Raddad. 2021. "Epidemiological Differences in the Impact of COVID-19 Vaccination in the United States and China" Vaccines 9, no. 3: 223. https://doi.org/10.3390/vaccines9030223
Note that from the first issue of 2016, this journal uses article numbers instead of page numbers. See further details here.