
In Silico Screening and Testing of FDA-Approved Small Molecules to Block SARS-CoV-2 Entry to the Host Cell by Inhibiting Spike Protein Cleavage


Abstract
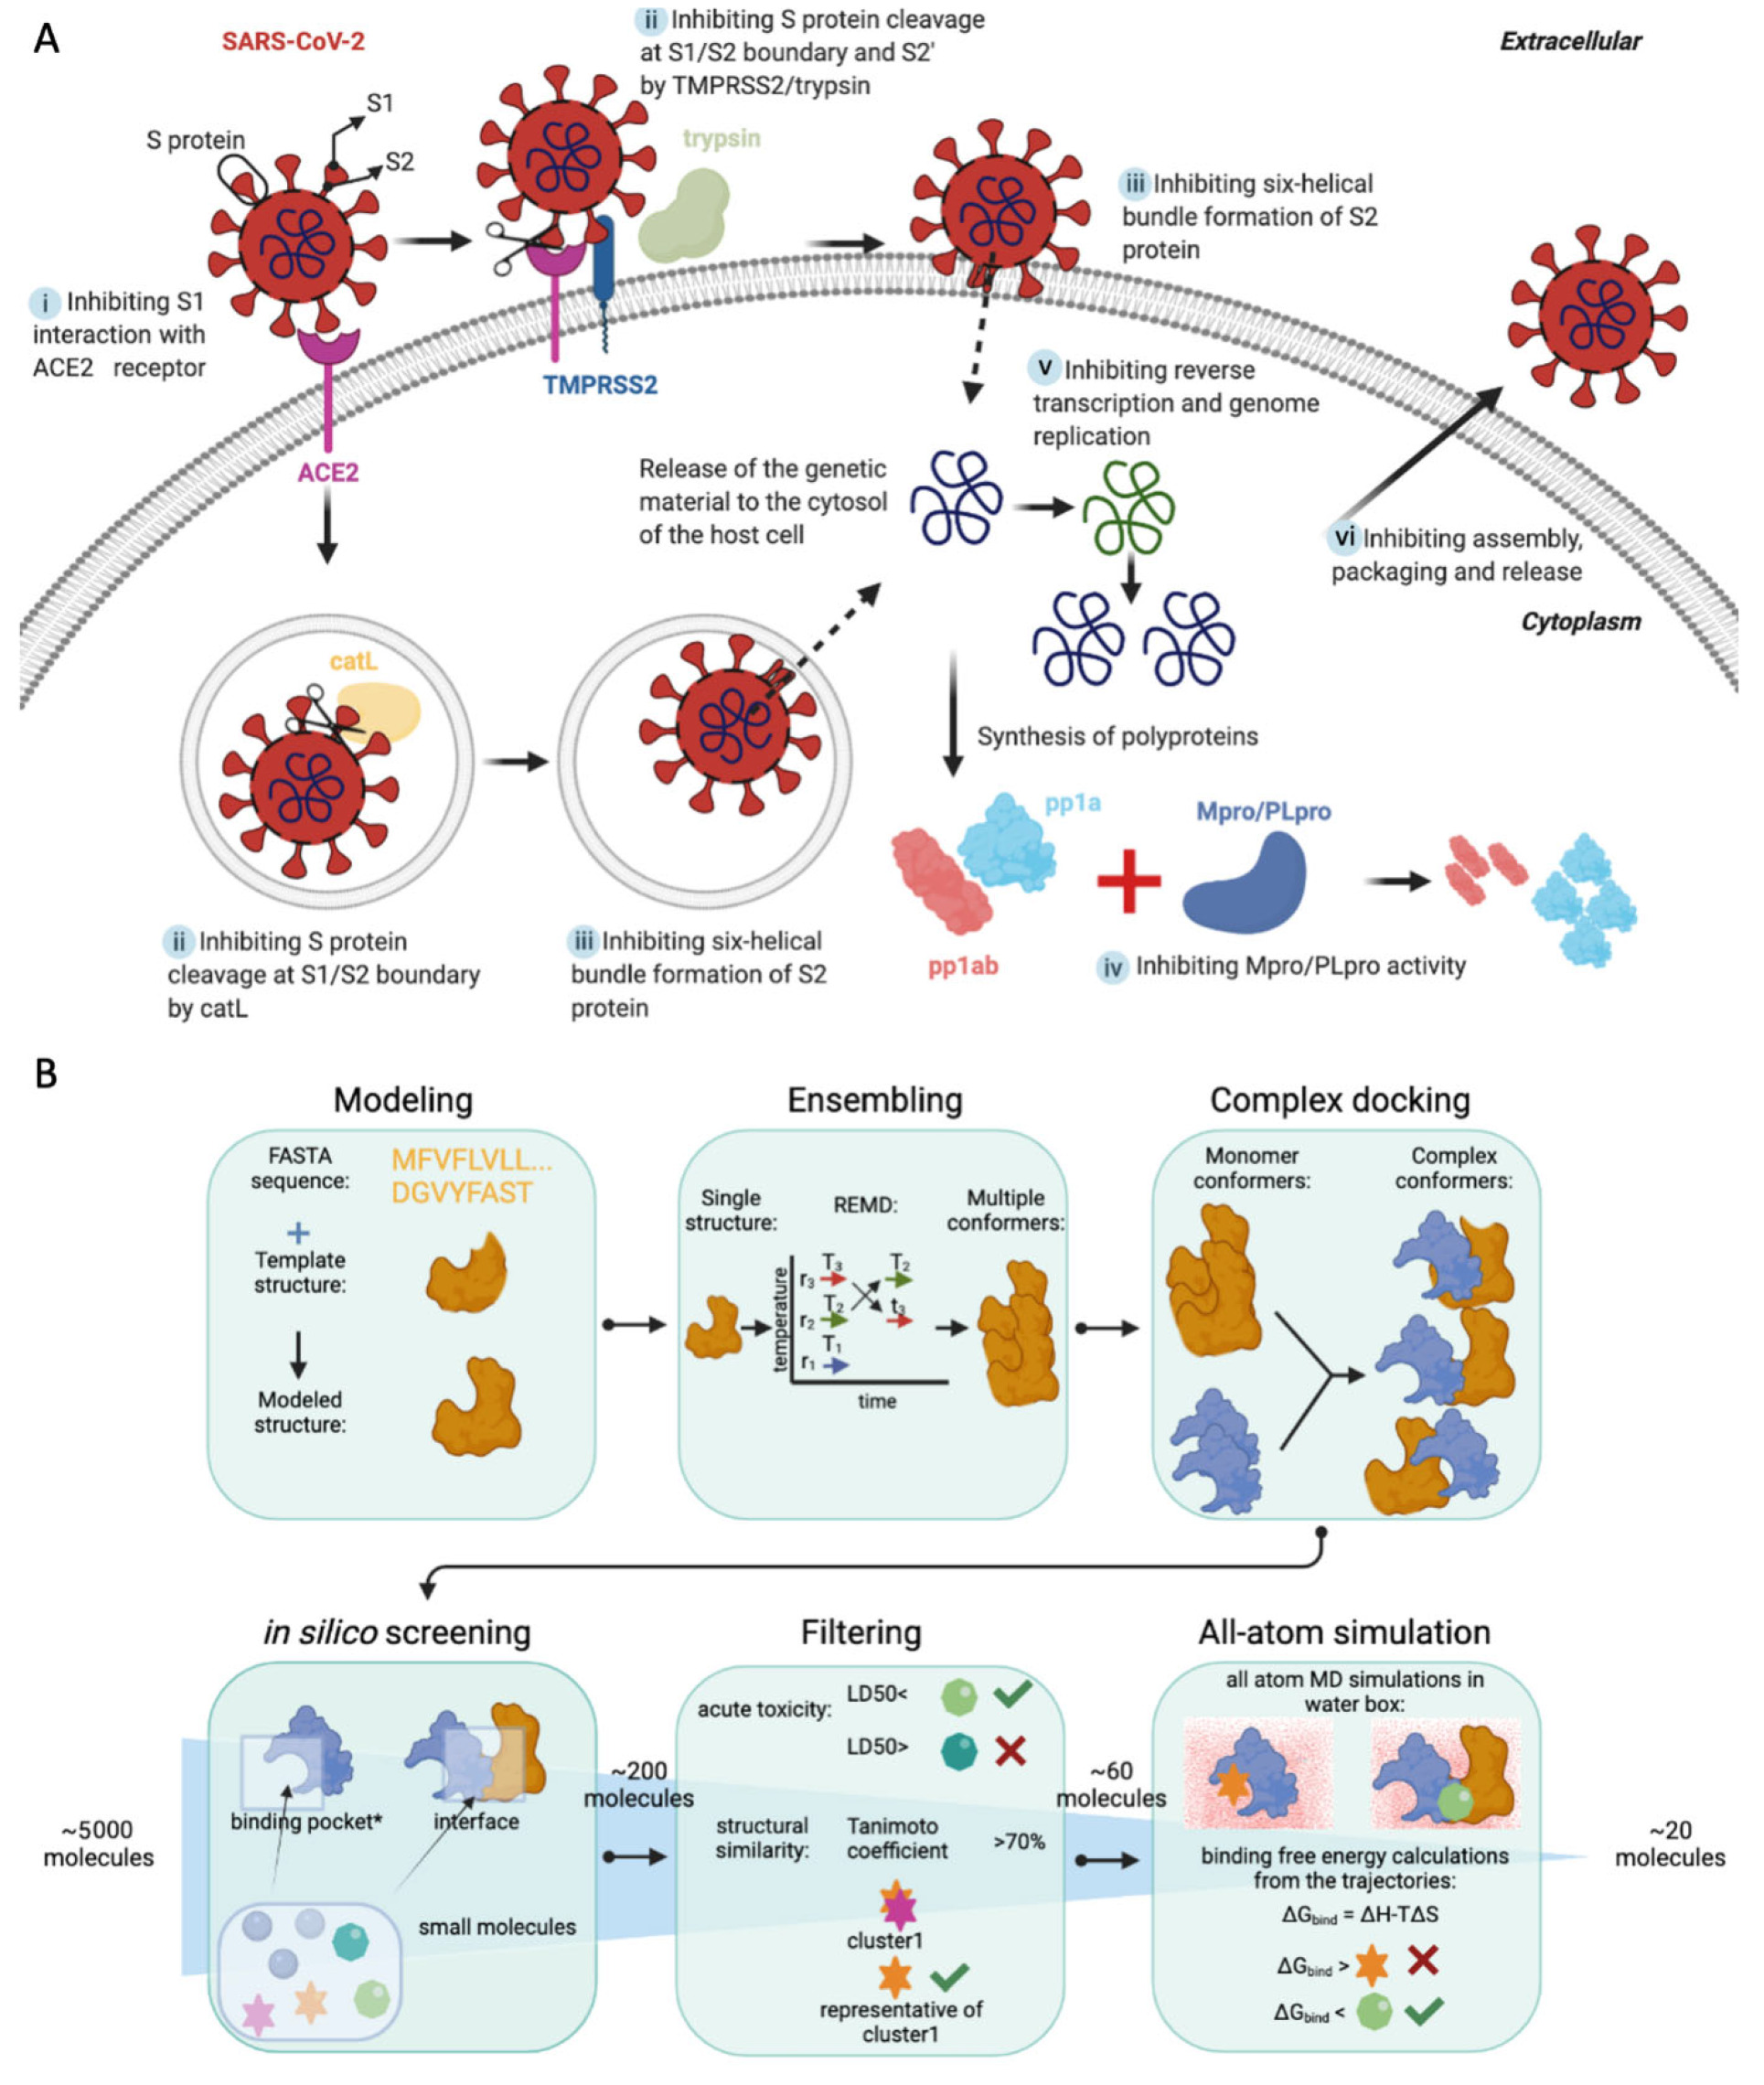
:1. Introduction
2. Results
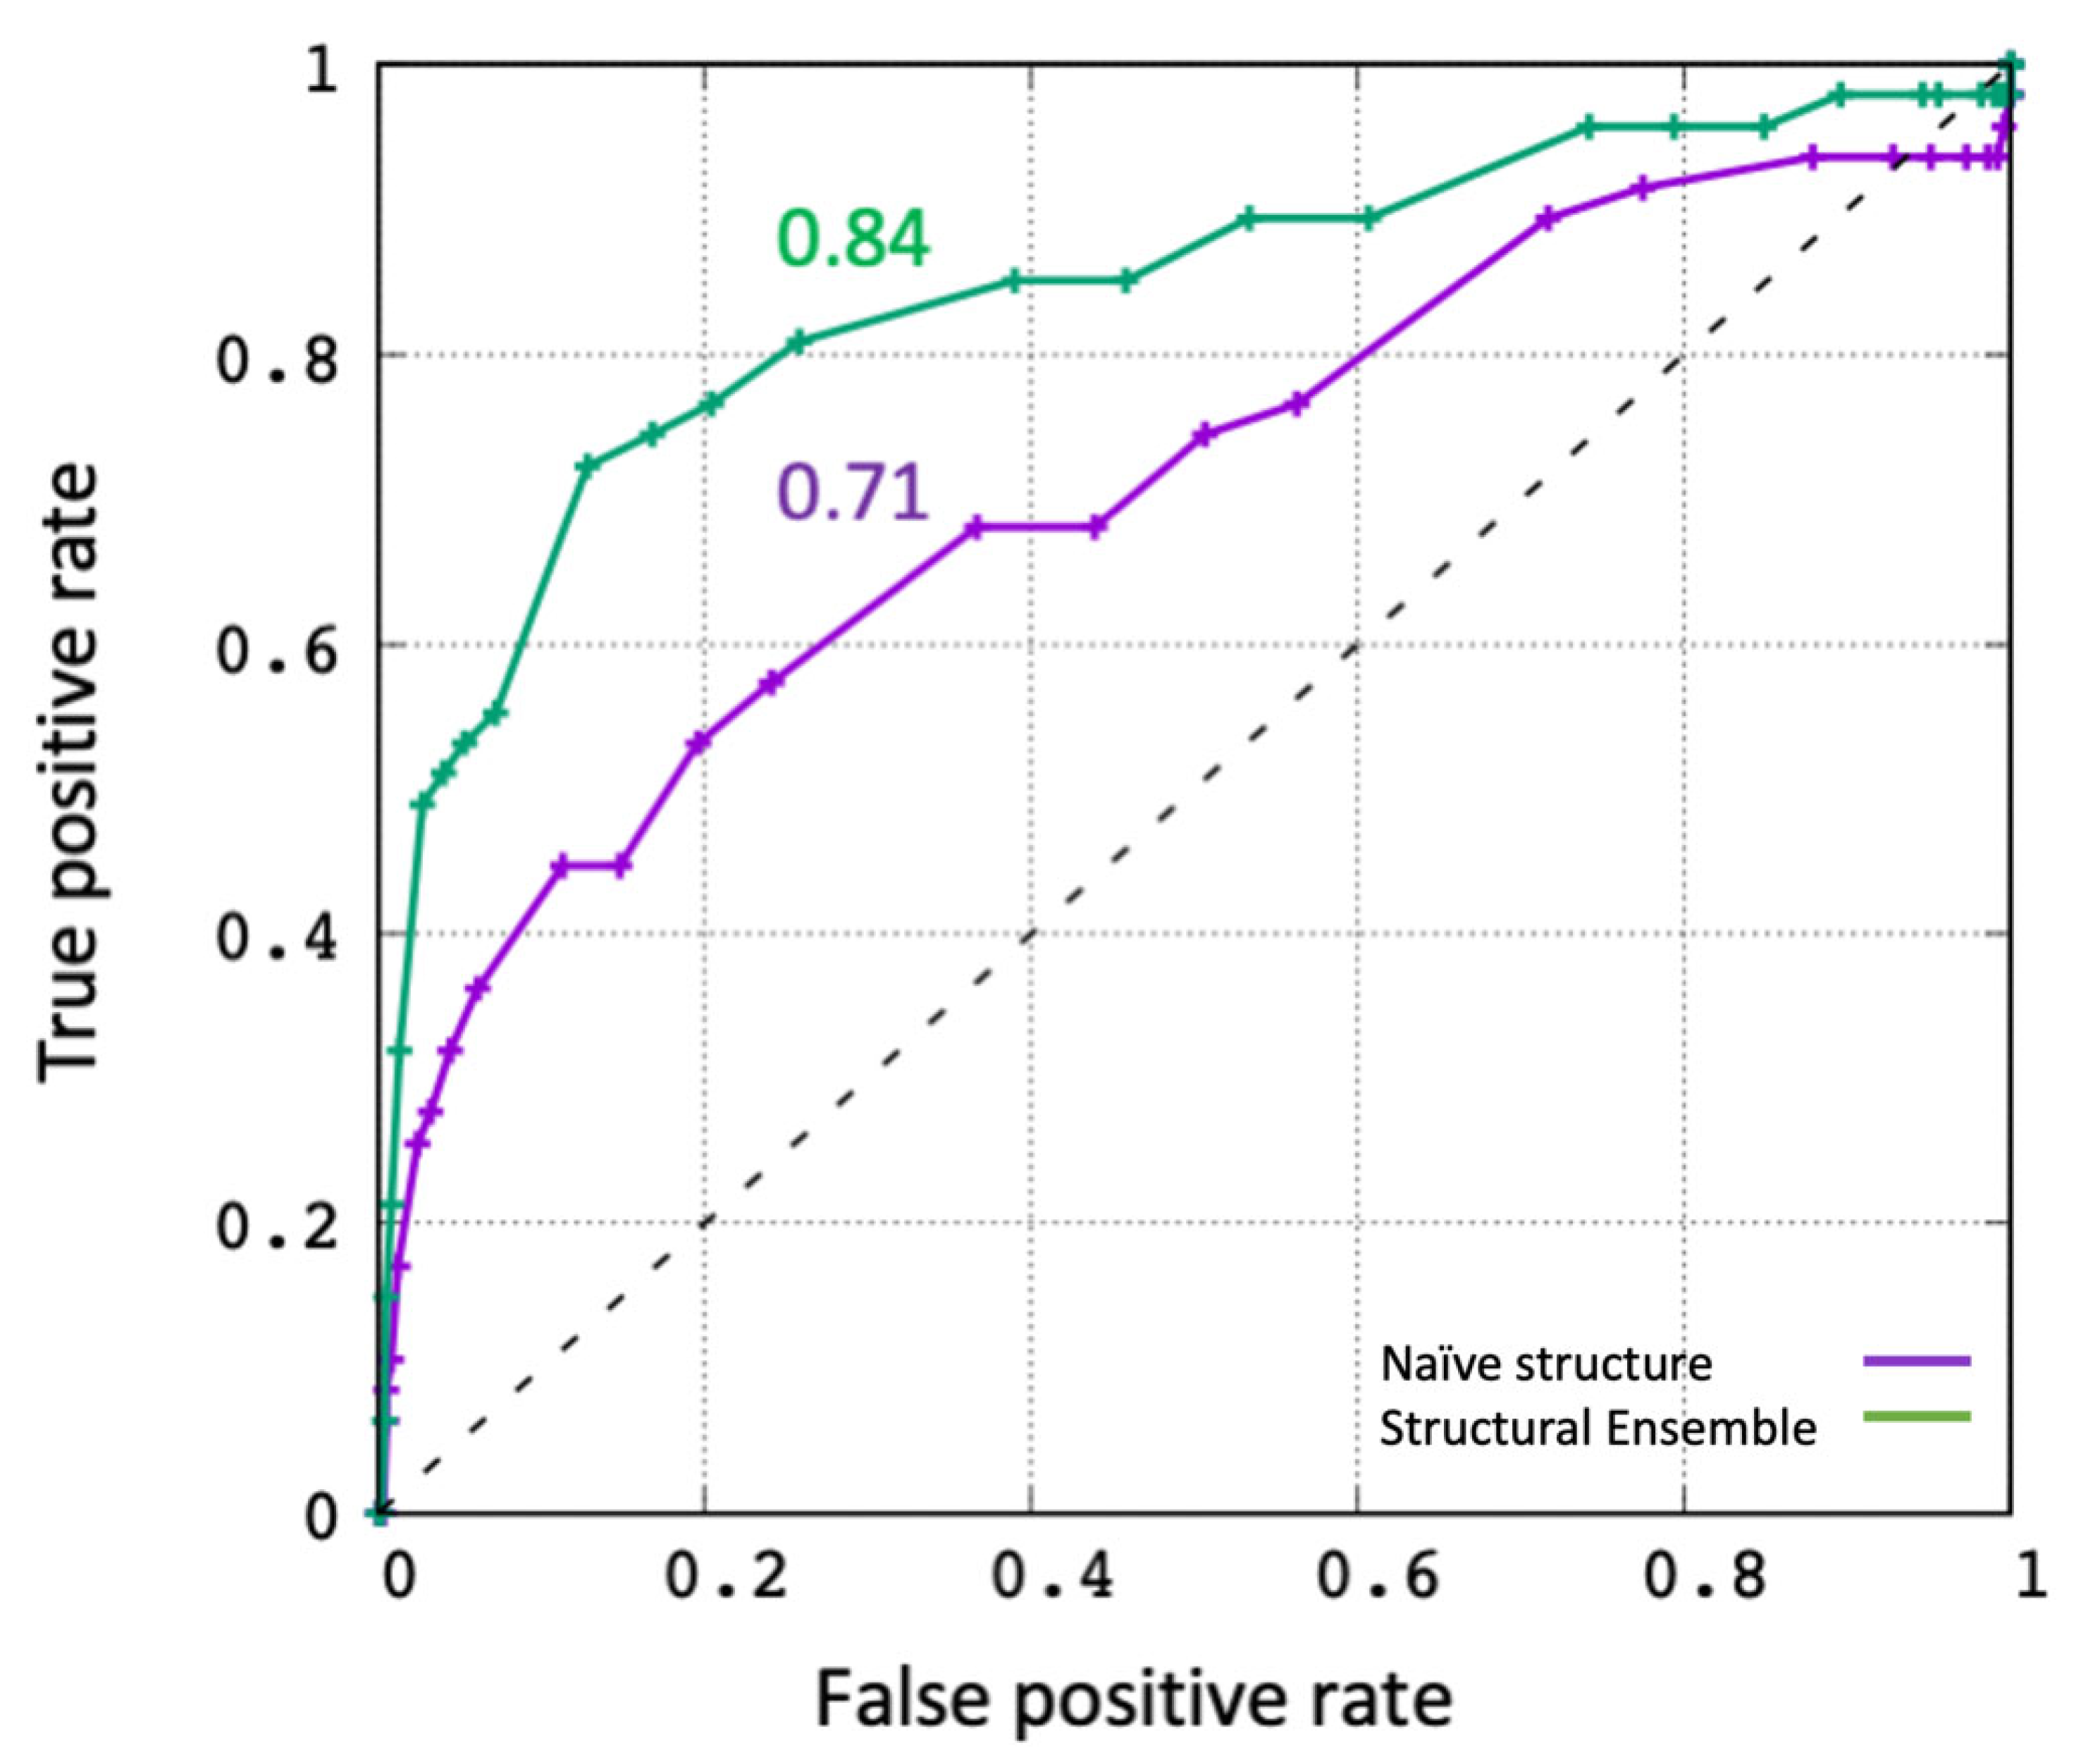
2.1. Evaluating the In Silico Docking Pipeline Incorporating an Ensemble of Receptor Configurations
2.2. Identifying the Top Molecules to Target Unbound Proteases, S Protein and Protease-S Protein Complexes
2.3. Curating a More Refined List of Ligands according to Their Toxicity, Structural and Functional Similarity
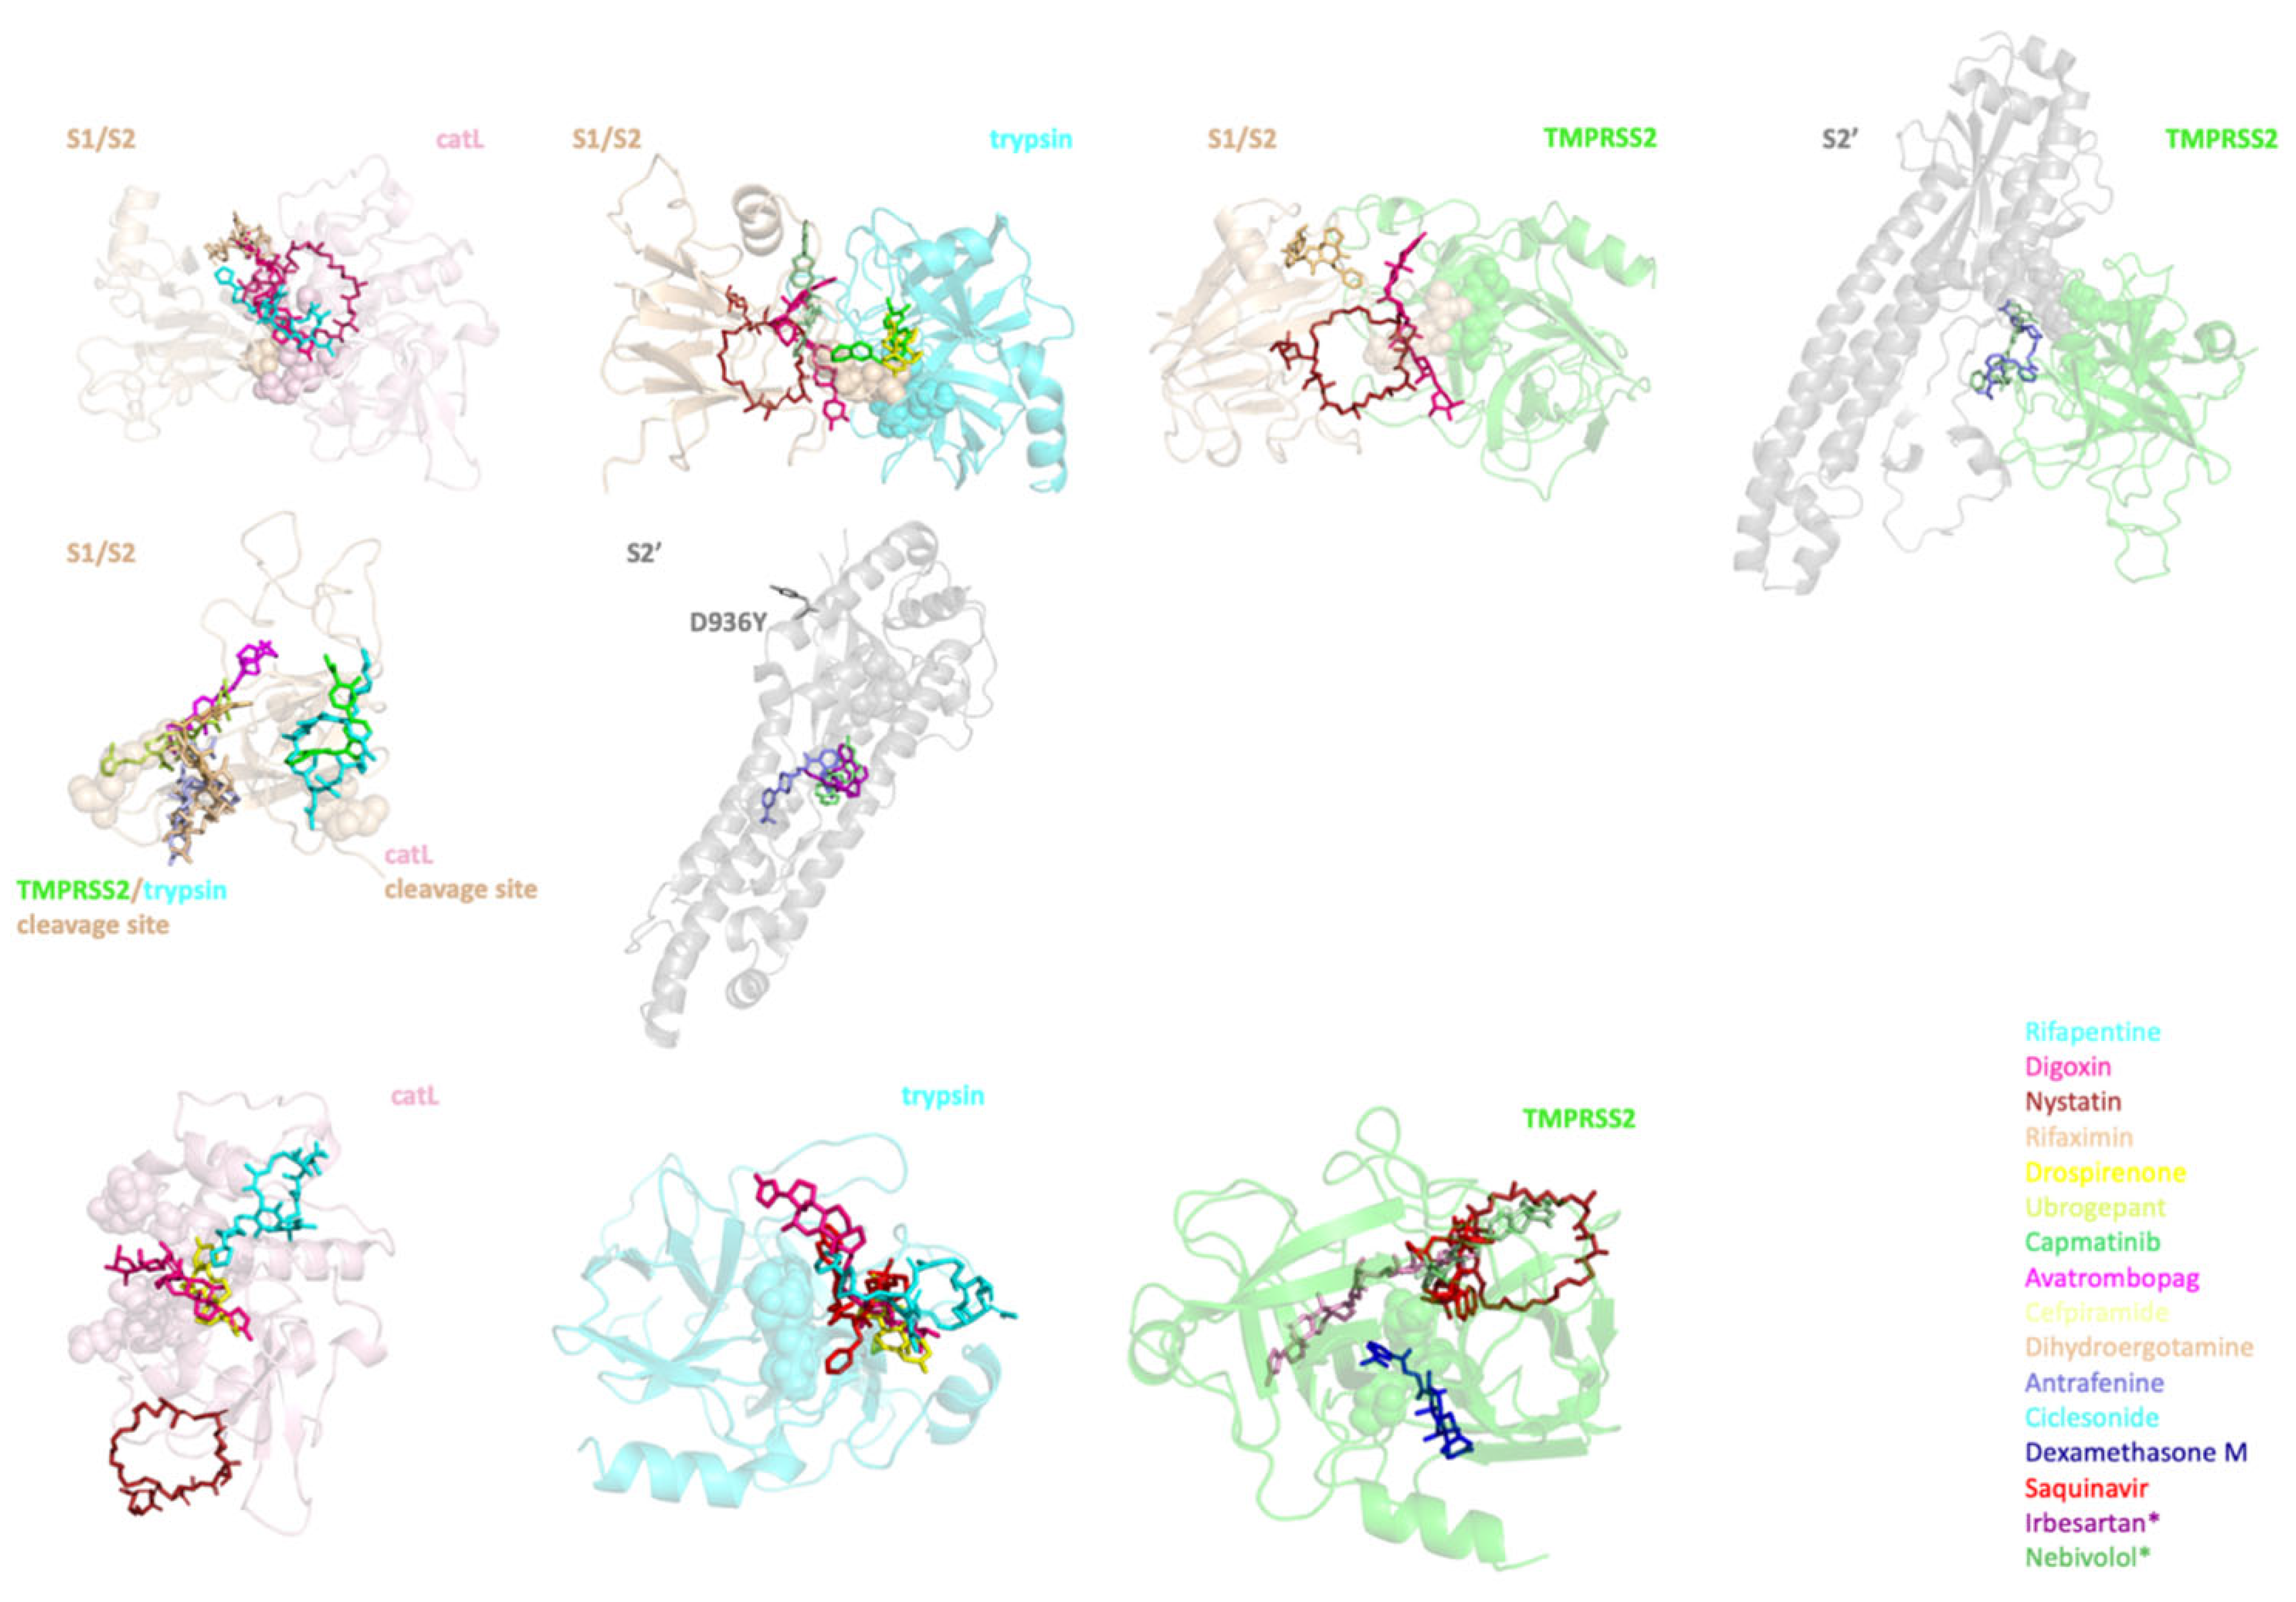
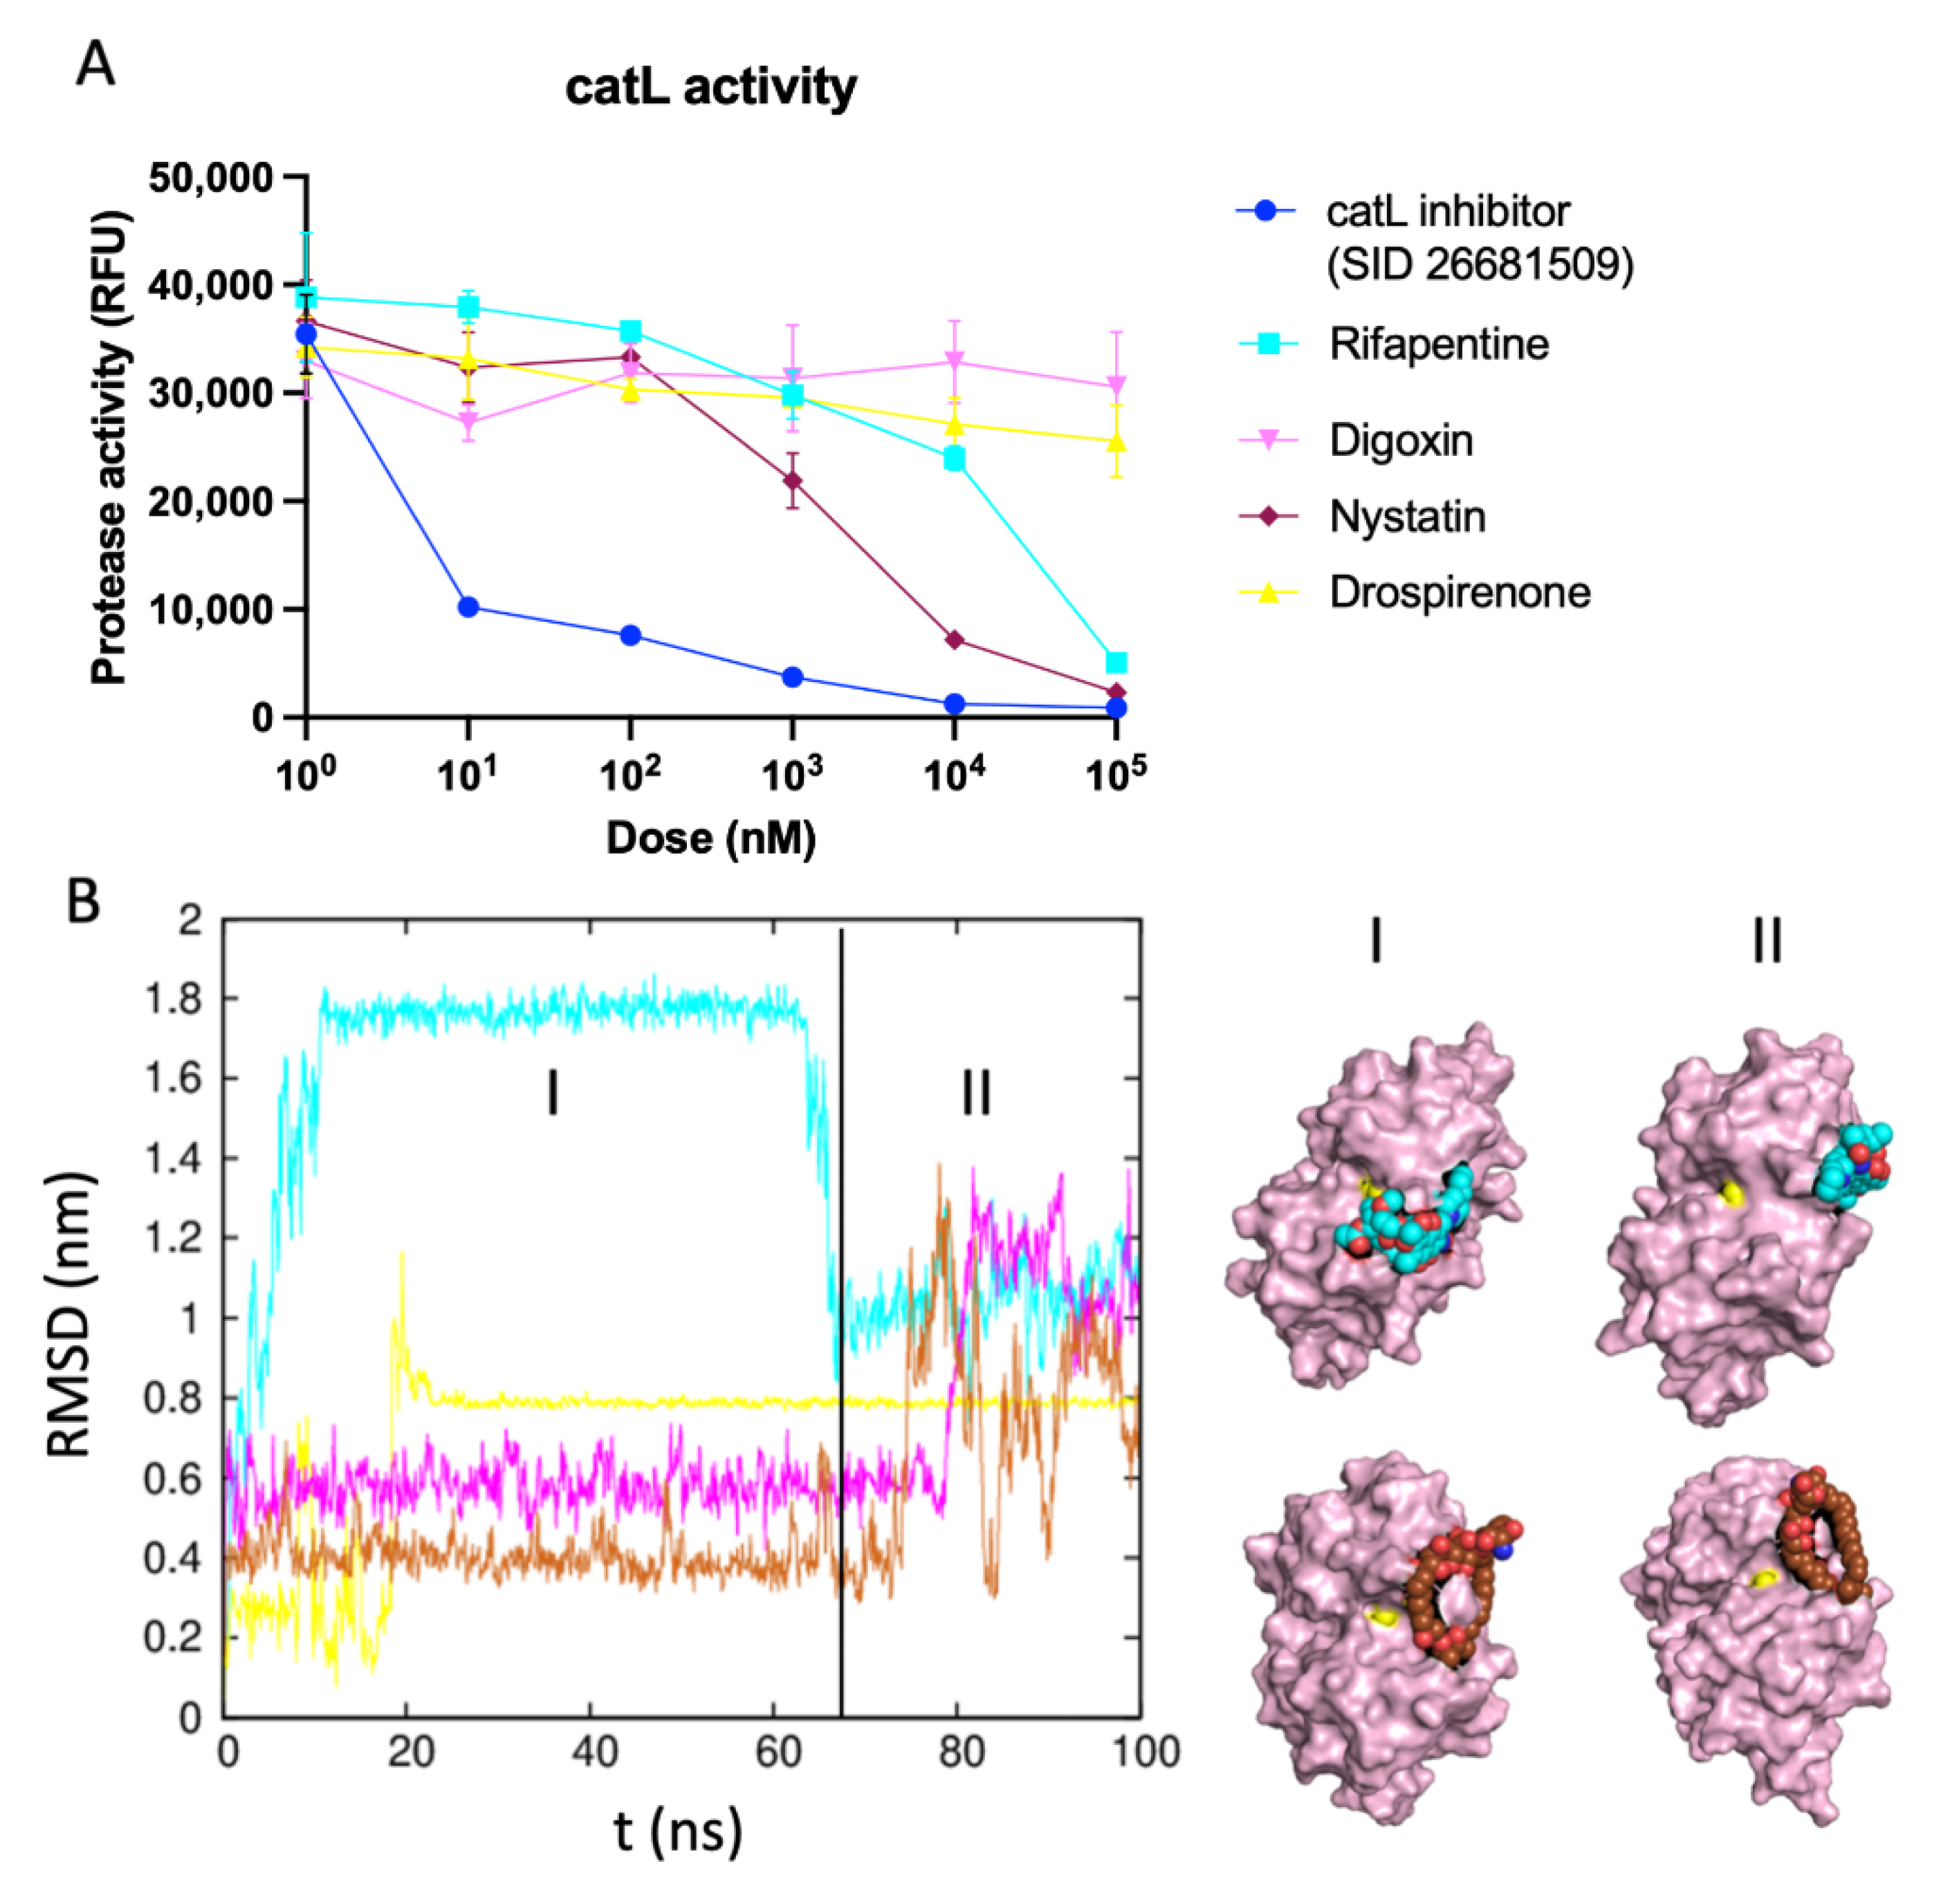
2.4. Identifying the Best Binding Ligands to Inhibit Proteolytic Cleavage of S Protein
3. Discussion
4. Materials and Methods
4.1. Computational Methods
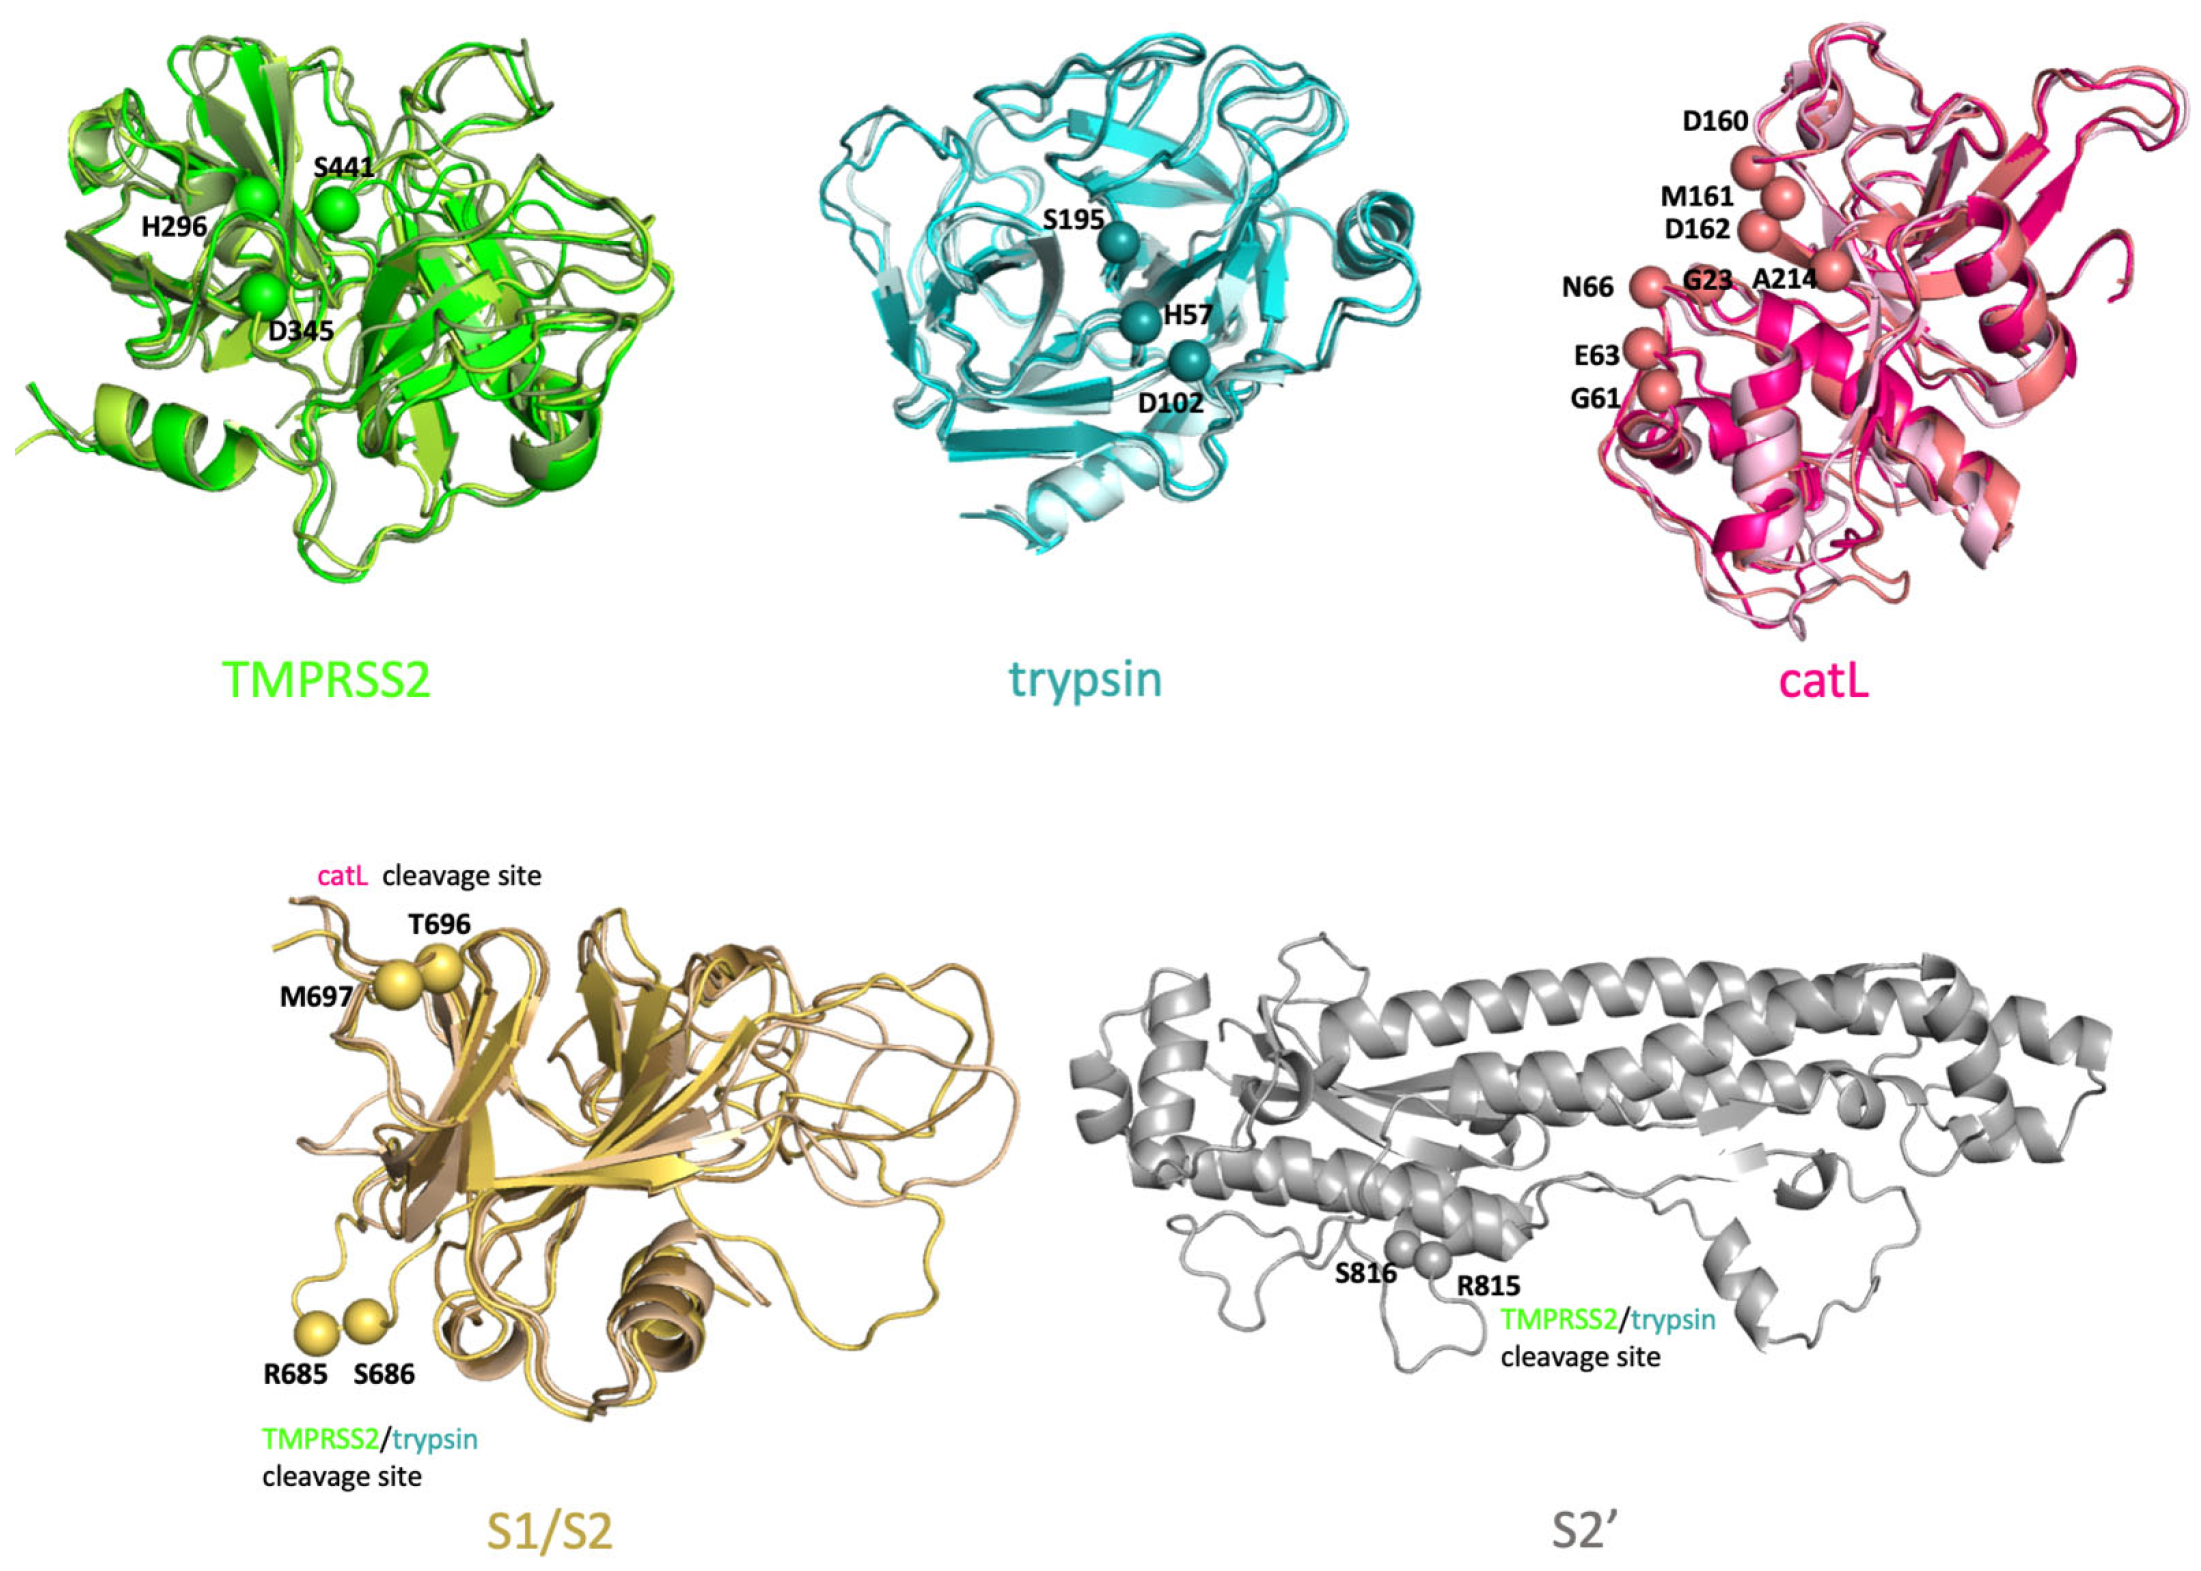
4.1.1. Initial Configurations of SARS-CoV-2 S Protein, TMPRSS2, Trypsin and catL
4.1.2. Replica Exchange MD Simulations
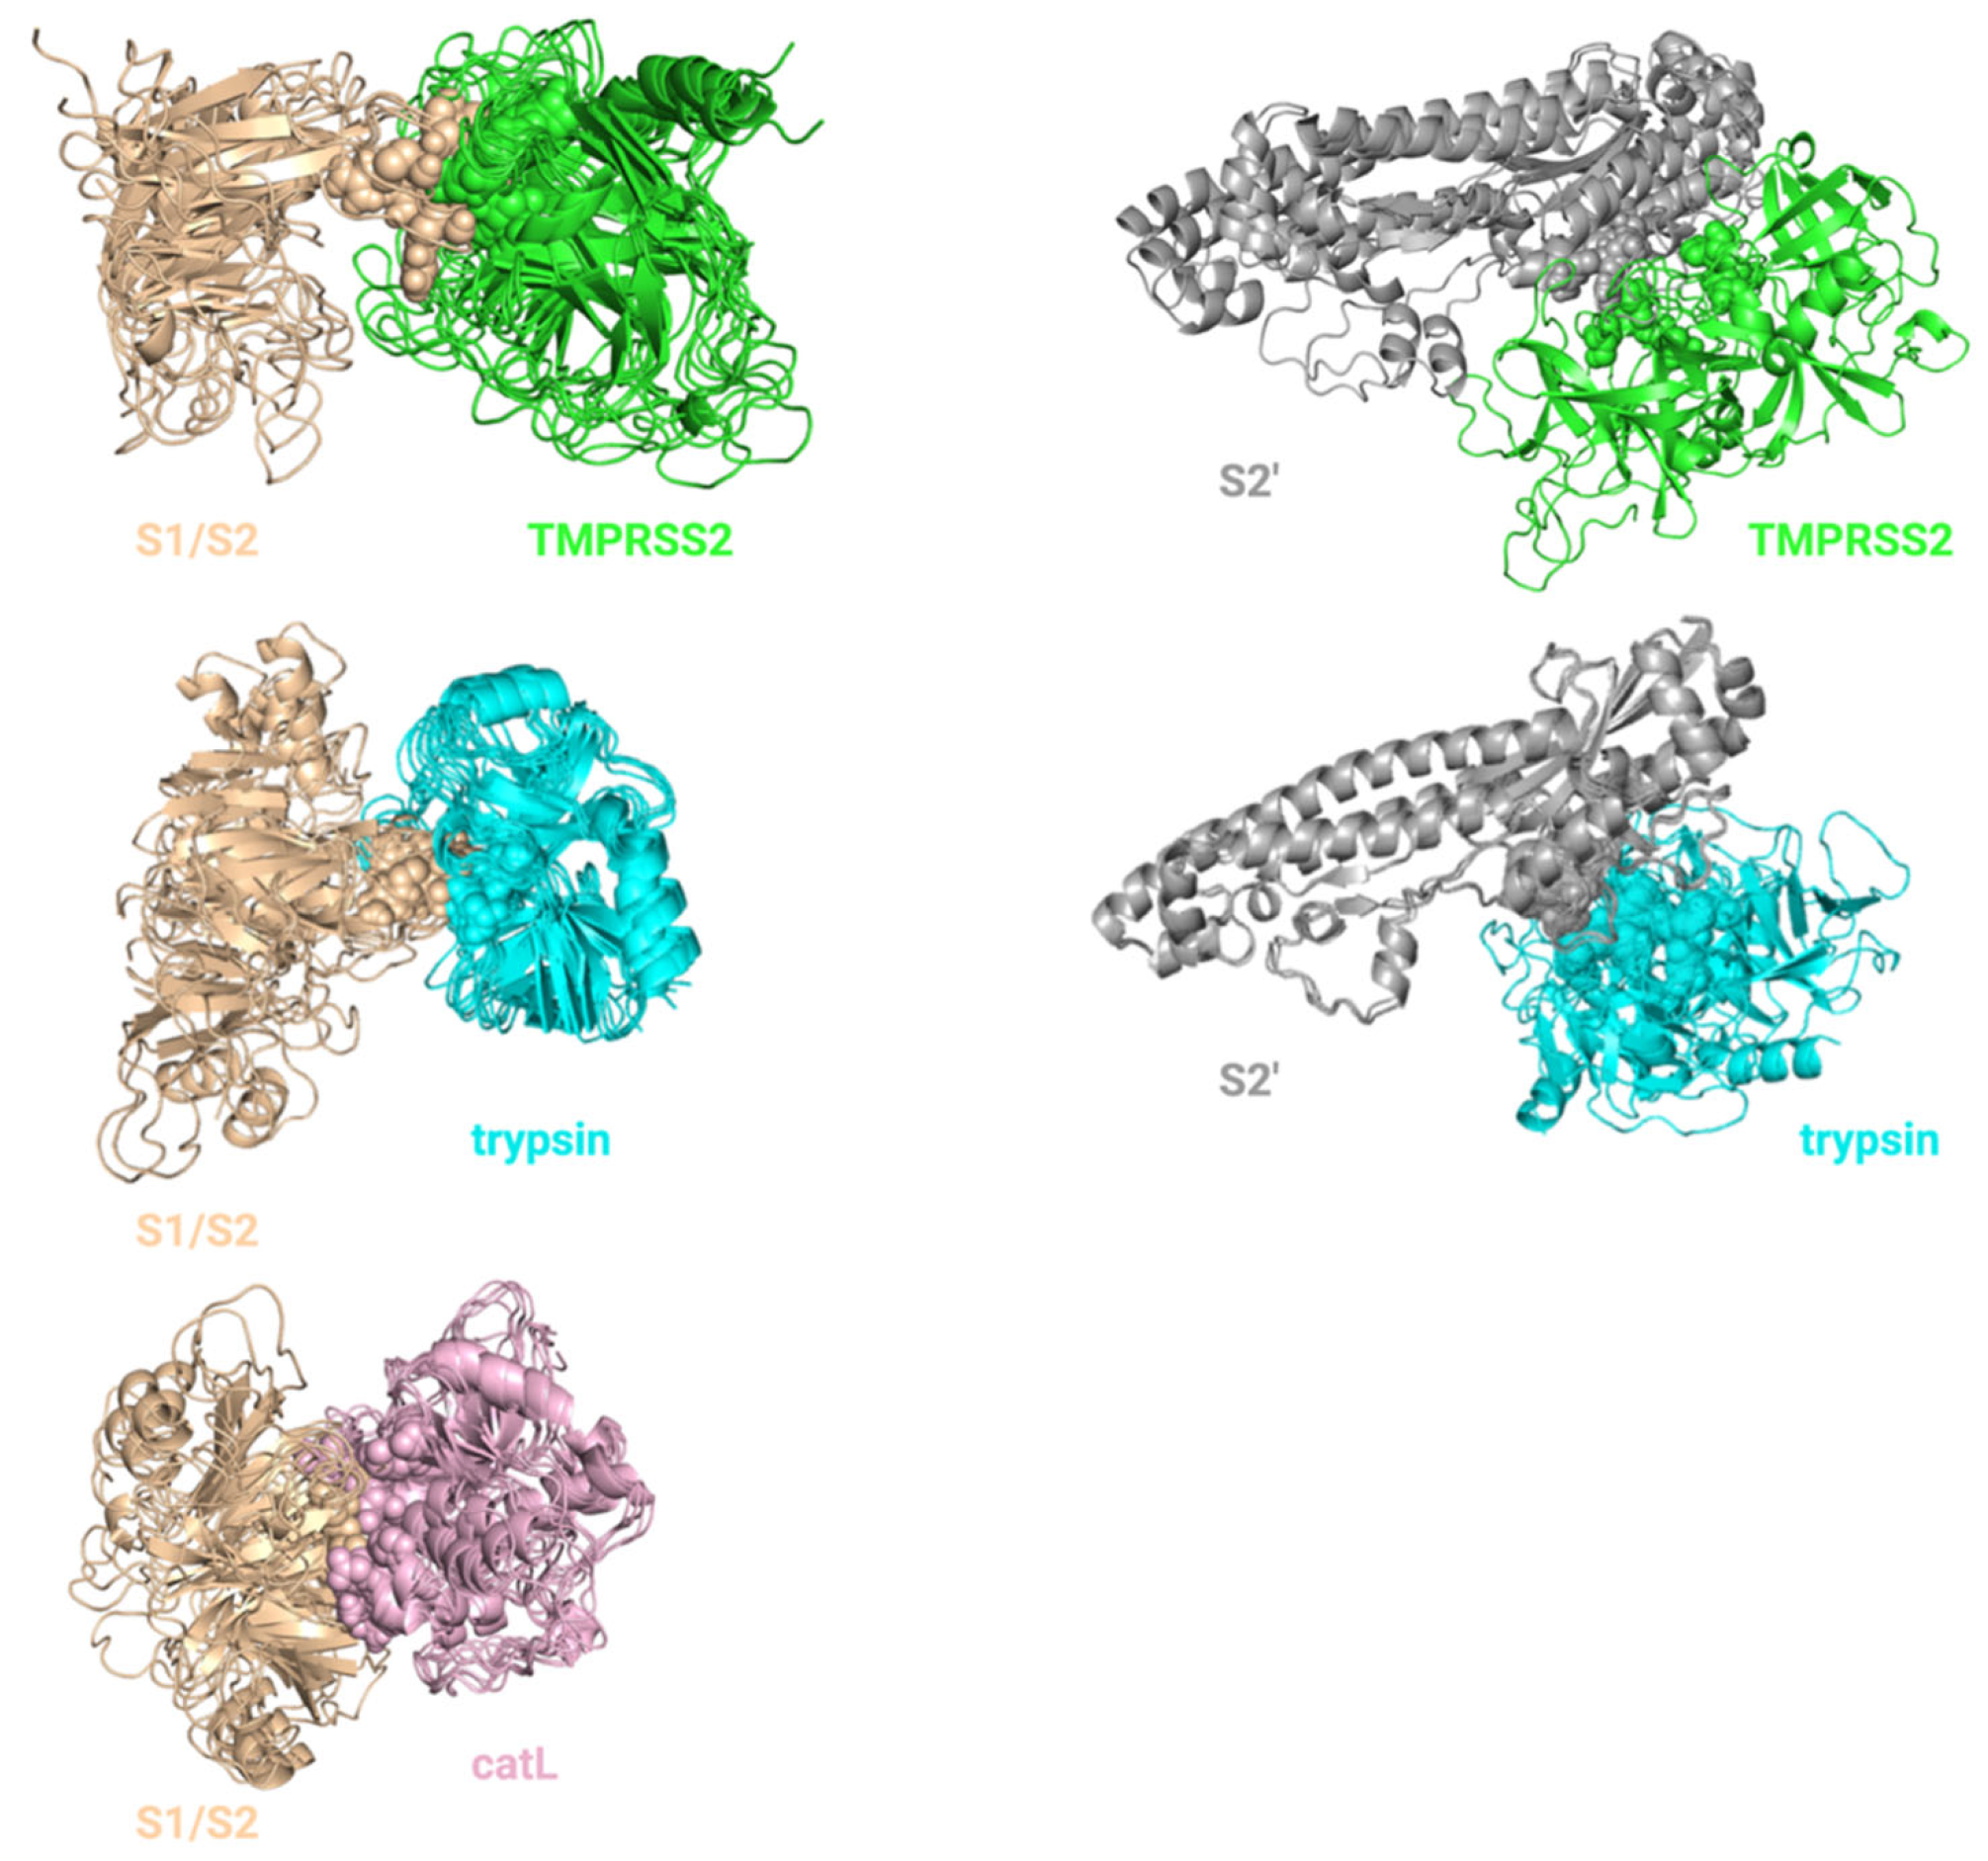
4.1.3. Ensemble Docking for S Protein–Protease Complex Modeling
4.1.4. Small Molecule Libraries and Structure Based in Silico Screening
4.1.5. Filtering
4.1.6. Force Field Generation
4.1.7. All-Atom MD Simulations
4.1.8. MM-PBSA Calculations
4.2. Experimental Methods
catL Activity Assay
Supplementary Materials
Author Contributions
Funding
Institutional Review Board Statement
Informed Consent Statement
Data Availability Statement
Acknowledgments
Conflicts of Interest
References
- Kissler, S.M.; Tedijanto, C.; Goldstein, E.; Grad, Y.H.; Lipsitch, M. Projecting the transmission dynamics of SARS-CoV-2 through the postpandemic period. Science 2020, 368, 860–868. [Google Scholar] [CrossRef]
- Wu, F.; Zhao, S.; Yu, B.; Chen, Y.M.; Wang, W.; Song, Z.G.; Hu, Y.; Tao, Z.W.; Tian, J.H.; Pei, Y.Y.; et al. A new coronavirus associated with human respiratory disease in China. Nature 2020, 579, 265–269. [Google Scholar] [CrossRef] [Green Version]
- Mackenzie, J.S.; Smith, D.W. COVID-19: A novel zoonotic disease caused by a coronavirus from China: What we know and what we don’t. Microbiol. Aust. 2020, 41, 45–50. [Google Scholar] [CrossRef]
- Van Norman, G.A. Drugs, devices, and the FDA: Part 2: An overview of approval processes: FDA approval of medical devices. JACC Basic Transl. Sci. 2016, 1, 277–287. [Google Scholar] [CrossRef] [Green Version]
- Lou, Z.; Sun, Y.; Rao, Z. Current progress in antiviral strategies. Trends Pharmacol. Sci. 2014, 35, 86–102. [Google Scholar]
- Choudhary, S.; Malik, Y.S.; Tomar, S. Identification of SARS-CoV-2 cell entry inhibitors by drug repurposing using in silico structure-based virtual screening approach. Front. Immunol. 2020, 11, 1664. [Google Scholar] [CrossRef]
- Acharya, A.; Agarwal, R.; Baker, M.B.; Baudry, J.; Bhowmik, D.; Boehm, S.; Byler, K.G.; Chen, S.Y.; Coates, L.; Cooper, C.J.; et al. Supercomputer-based ensemble docking drug discovery pipeline with application to COVID-19. J. Chem. Inf. Modeling 2020, 60, 5832–5852. [Google Scholar]
- Fehr, A.R.; Perlman, S. Coronaviruses: An overview of their replication and pathogenesis. In Coronaviruses: Methods and Protocols; Springer: Berlin/Heidelberg, Germany, 2015; Volume 1282, pp. 1–23. [Google Scholar]
- Xia, S.; Zhu, Y.; Liu, M.; Lan, Q.; Xu, W.; Wu, Y.; Ying, T.; Liu, S.; Shi, Z.; Jiang, S.; et al. Fusion mechanism of 2019-nCoV and fusion inhibitors targeting HR1 domain in spike protein. Cell Mol. Immunol. 2020, 17, 765–767. [Google Scholar]
- Yoshino, R.; Yasuo, N.; Sekijima, M. Identification of key interactions between SARS-CoV-2 main protease and inhibitor drug candidates. Sci. Rep. 2020, 10, 12493. [Google Scholar]
- Fischer, A.; Sellner, M.; Neranjan, S.; Smieško, M.; Lill, M.A. Potential inhibitors for novel coronavirus protease identified by virtual screening of 606 million compounds. Int. J. Mol. Sci. 2020, 21, 3626. [Google Scholar] [CrossRef]
- Frediansyah, A. The antiviral activity of iota-, kappa-, and lambda-carrageenan against COVID-19: A critical review. Clin. Epidemiol. Glob. Health 2021, 12, 100826. [Google Scholar] [CrossRef]
- Belouzard, S.; Chu, V.C.; Whittaker, G.R. Activation of the SARS coronavirus spike protein via sequential proteolytic cleavage at two distinct sites. Proc. Natl. Acad. Sci. USA 2009, 106, 5871–5876. [Google Scholar] [CrossRef] [Green Version]
- Reinke, L.M.; Spiegel, M.; Plegge, T.; Hartleib, A.; Nehlmeier, I.; Gierer, S.; Hoffmann, M.; Hofmann-Winkler, H.; Winkler, M.; Pöhlmann, S. Different residues in the SARS-CoV spike protein determine cleavage and activation by the host cell protease TMPRSS2. PLoS ONE 2017, 12, e0179177. [Google Scholar] [CrossRef] [Green Version]
- Elshabrawy, H.A.; Fan, J.; Haddad, C.S.; Ratia, K.; Broder, C.C.; Caffrey, M.; Prabhakar, B.S. Identification of a broad-spectrum antiviral small molecule against severe acute respiratory syndrome coronavirus and Ebola, Hendra, and Nipah viruses by using a novel high-throughput screening assay. J. Virol. 2014, 88, 4353–4365. [Google Scholar] [CrossRef] [Green Version]
- Zhou, Y.; Vedantham, P.; Lu, K.; Agudelo, J.; Carrion, R., Jr.; Nunneley, J.W.; Barnard, D.; Pöhlmann, S.; McKerrow, J.H.; Renslo, A.R.; et al. Protease inhibitors targeting coronavirus and filovirus entry. Antivir. Res. 2015, 116, 76–84. [Google Scholar] [CrossRef]
- Takeda, M. Proteolytic activation of SARS-CoV-2 spike protein. Microbiol. Immunol. 2022, 66, 15–23. [Google Scholar] [CrossRef]
- Boehr, D.D.; Nussinov, R.; Wright, P.E. The role of dynamic conformational ensembles in biomolecular recognition. Nat. Chem. Biol. 2009, 5, 789–796. [Google Scholar] [CrossRef] [Green Version]
- Oliva, R.; Shaikh, A.R.; Petta, A.; Vangone, A.; Cavallo, L. D936Y and other mutations in the fusion core of the SARS-CoV-2 spike protein heptad repeat 1: Frequency, geographical distribution, and structural effect. Molecules 2021, 26, 2622. [Google Scholar] [CrossRef]
- Mysinger, M.M.; Carchia, M.; Irwin, J.J.; Shoichet, B.K. Directory of useful decoys, enhanced (DUD-E): Better ligands and decoys for better benchmarking. J. Med. Chem. 2012, 55, 6582–6594. [Google Scholar] [CrossRef]
- Eberhardt, J.; Santos-Martins, D.; Tillack, A.F.; Forli, S. AutoDock Vina 1.2.0: New docking methods, expanded force field, and python bindings. J. Chem. Inf. Modeling 2021, 61, 3891–3898. [Google Scholar] [CrossRef]
- Kawase, M.; Shirato, K.; van der Hoek, L.; Taguchi, F.; Matsuyama, S. Simultaneous treatment of human bronchial epithelial cells with serine and cysteine protease inhibitors prevents severe acute respiratory syndrome coronavirus entry. J. Virol. 2012, 86, 6537–6545. [Google Scholar] [CrossRef] [Green Version]
- Glowacka, I.; Bertram, S.; Müller, M.A.; Allen, P.; Soilleux, E.; Pfefferle, S.; Steffen, I.; Tsegaye, T.S.; He, Y.; Gnirss, K.; et al. Evidence that TMPRSS2 activates the severe acute respiratory syndrome coronavirus spike protein for membrane fusion and reduces viral control by the humoral immune response. J. Virol. 2011, 85, 4122–4134. [Google Scholar] [CrossRef] [Green Version]
- Ou, T.; Mou, H.; Zhang, L.; Ojha, A.; Choe, H.; Farzan, M. Hydroxychloroquine-mediated inhibition of SARS-CoV-2 entry is attenuated by TMPRSS2. PLoS Pathog. 2021, 17, e1009212. [Google Scholar] [CrossRef]
- Hoffmann, M.; Hofmann-Winkler, H.; Smith, J.C.; Krüger, N.; Arora, P.; Sørensen, L.K.; Søgaard, O.S.; Hasselstrøm, J.B.; Winkler, M.; Hempel, T.; et al. Camostat mesylate inhibits SARS-CoV-2 activation by TMPRSS2-related proteases and its metabolite GBPA exerts antiviral activity. EBioMedicine 2021, 65, 103255. [Google Scholar] [CrossRef]
- Walls, A.C.; Park, Y.J.; Tortorici, M.A.; Wall, A.; McGuire, A.T.; Veesler, D. Structure, function, and antigenicity of the SARS-CoV-2 spike glycoprotein. Cell 2020, 181, 281–292.e6. [Google Scholar] [CrossRef]
- Schwede, T.; Kopp, J.; Guex, N.; Peitsch, M.C. SWISS-MODEL: An automated protein homology-modeling server. Nucleic Acids Res. 2003, 31, 3381–3385. [Google Scholar] [CrossRef] [Green Version]
- Herter, S.; Piper, D.E.; Aaron, W.; Gabriele, T.; Cutler, G.; Cao, P.; Bhatt, A.S.; Choe, Y.; Craik, C.S.; Walker, N.; et al. Hepatocyte growth factor is a preferred in vitro substrate for human hepsin, a membrane-anchored serine protease implicated in prostate and ovarian cancers. Biochem. J. 2005, 390 Pt. 1, 125–136. [Google Scholar] [CrossRef] [Green Version]
- Hardegger, L.A.; Kuhn, B.; Spinnler, B.; Anselm, L.; Ecabert, R.; Stihle, M.; Gsell, B.; Thoma, R.; Diez, J.; Benz, J.; et al. Systematic investigation of halogen bonding in protein-ligand interactions. Angew. Chem. Int. Ed. 2011, 50, 314–318. [Google Scholar] [CrossRef]
- Katona, G.; Berglund, G.I.; Hajdu, J.; Graf, L.; Szilagyi, L. Crystal structure reveals basis for the inhibitor resistance of human brain trypsin. J. Mol. Biol. 2002, 315, 1209–1218. [Google Scholar] [CrossRef]
- Daura, X.; Gademann, K.; Jaun, B.; Seebach, D.; van Gunsteren, W.F.; Mark, A.E. Peptide folding: When simulation meets experiment. Angew. Chem. Int. Ed. 1999, 38, 236–240. [Google Scholar] [CrossRef]
- Van Zundert, G.C.P.; Rodrigues, J.P.G.L.M.; Trellet, M.; Schmitz, C.; Kastritis, P.L.; Karaca, E.; Melquiond, A.S.J.; van Dijk, M.; De Vries, S.J.; Bonvin, A.M.J.J. The HADDOCK2.2 web server: User-friendly integrative modeling of biomolecular complexes. J. Mol. Biol. 2016, 428, 720–725. [Google Scholar] [CrossRef] [Green Version]
- Fujishima, A.; Imai, Y.; Nomura, T.; Fujisawa, Y.; Yamamoto, Y.; Sugawara, T. The crystal structure of human cathepsin L complexed with E-64. FEBS Lett. 1997, 407, 47–50. [Google Scholar] [CrossRef]
- Irwin, J.J.; Shoichet, B.K. ZINC—A free database of commercially available compounds for virtual screening. J. Chem. Inf. Modeling 2005, 45, 177–182. [Google Scholar] [CrossRef] [Green Version]
- Wishart, D.S.; Feunang, Y.D.; Guo, A.C.; Lo, E.J.; Marcu, A.; Grant, J.R.; Sajed, T.; Johnson, D.; Li, C.; Sayeeda, Z.; et al. DrugBank 5.0: A major update to the DrugBank database for 2018. Nucleic Acids Res. 2018, 46, D1074–D1082. [Google Scholar] [CrossRef]
- Chen, X.; Lin, Y.; Liu, M.; Gilson, M.K. The binding database: Data management and interface design. Bioinformatics 2002, 18, 130–139. [Google Scholar] [CrossRef] [Green Version]
- O’Boyle, N.M.; Banck, M.; James, C.A.; Morley, C.; Vandermeersch, T.; Hutchison, G.R. Open babel: An open chemical toolbox. J. Cheminform. 2011, 3, 33. [Google Scholar] [CrossRef] [Green Version]
- Trott, O.; Olson, A.J. AutoDock Vina: Improving the speed and accuracy of docking with a new scoring function, efficient optimization, and multithreading. J. Comput. Chem. 2010, 31, 455–461. [Google Scholar] [CrossRef] [Green Version]
- Kim, S.; Chen, J.; Cheng, T.; Gindulyte, A.; He, J.; He, S.; Li, Q.; Shoemaker, B.A.; Thiessen, P.A.; Yu, B.; et al. PubChem in 2021: New data content and improved web interfaces. Nucleic Acids Res. 2021, 49, 1388–1395. [Google Scholar] [CrossRef]
- Wang, J.; Wang, W.; Kollman, P.A.; Case, D.A. Automatic atom type and bond type perception in molecular mechanical calculations. J. Mol. Graph. Model. 2006, 25, 247–260. [Google Scholar] [CrossRef]
- Jakalian, A.; Jack, D.B.; Bayly, C.I. Fast, efficient generation of high-quality atomic charges. AM1-BCC model: II. Parameterization and validation. J. Comput. Chem. 2002, 23, 1623–1641. [Google Scholar] [CrossRef]
- Wang, J.; Wolf, R.M.; Caldwell, J.W.; Kollman, P.A.; Case, D.A. Development and testing of a general amber force field. J. Comput. Chem. 2004, 25, 1157–1174. [Google Scholar] [CrossRef]
- Bussi, G.; Donadio, D.; Parrinello, M. Canonical sampling through velocity rescaling. J. Chem. Phys. 2007, 126, 014101. [Google Scholar] [CrossRef] [Green Version]
- Darden, T.A.; Pedersen, L.G. Molecular modeling: An experimental tool. Environ. Health Perspect. 1993, 101, 410–412. [Google Scholar] [CrossRef]
- Genheden, S.; Ryde, U. The MM/PBSA and MM/GBSA methods to estimate ligand-binding affinities. Expert Opin. Drug Discov. 2015, 10, 449–461. [Google Scholar] [CrossRef]
- Baker, N.A.; Sept, D.; Joseph, S.; Holst, M.J.; McCammon, J.A. Electrostatics of nanosystems: Application to microtubules and the ribosome. Proc. Natl. Acad. Sci. USA 2001, 98, 10037–10041. [Google Scholar] [CrossRef] [Green Version]
- Kumari, R.; Kumar, R. Open Source Drug Discovery Consortium; Lynn, A. g_mmpbsa—A GROMACS tool for high-throughput MM-PBSA calculations. J. Chem. Inf. Modeling 2014, 54, 1951–1962. [Google Scholar] [CrossRef]
- Studer, G.; Rempfer, C.; Waterhouse, A.M.; Gumienny, R.; Haas, J.; Schwede, T. QMEANDisCo-distance constraints applied on model quality estimation. Bioinformatics 2020, 36, 2647. [Google Scholar] [CrossRef] [Green Version]
- Anderson, R.J.; Weng, Z.; Campbell, R.K.; Jiang, X. Main-chain conformational tendencies of amino acids. Proteins 2005, 60, 679–689. [Google Scholar] [CrossRef]


| Drug Name | LD50 (mg/kg/day) | Function | Drug Name | LD50 (mg/kg/day) | Function |
|---|---|---|---|---|---|
| Sirolimus | 2500 | Anti-inflammatory | Elbasvir | Antimicrobial | |
| Ciclesonide | 2000 | Cefpiramide | 12,500 | ||
| Deflazacort | 5200 | Saquinavir | 2500 | ||
| Dexamethasone M | 873 | Delamanid | |||
| Icatibant | 760 | Bictegravir | |||
| Triamcinolone | 5000 | Pibrentasvir | |||
| Antrafenine | 4000 | Ritonavir | |||
| Indacaterol | 1600 | Raltegravir | |||
| Dihydroergotamine | 8000 | Migraine disorders | Drospirenone | 2000 | Reproductive health |
| Lasmiditan | Dutasteride | 2000 | |||
| Ubrogepant | 175 | Estrone sulfate | |||
| Valrubicin | 109 | Chemotherapeutic | Ursodeoxycholic acid | Natural hormones | |
| Irinotecan | 765 | Oxytocin | 514 | ||
| Paclitaxel | FAD | ||||
| Axitinib | Promacta | Blood disorder | |||
| Gleevec | 120 | Edoxaban | |||
| Ibrutinib | Avatrombopag | 160 | |||
| Capmatinib | 2000 | Gliquidone | Anti-diabetic | ||
| Vemurafenib | Glimepiride | ||||
| Digoxin | 30 | Cardiovascular disease | Troglitazone | ||
| Candesartan cilexetil | 2000 | Vapsirol | 500 | Hyponatremia | |
| Telmisartan | Tolvaptan | ||||
| Irbesartan | Plecanatide | Laxative | |||
| Nystatin | 8000 | Antimicrobial | Droperidol | Antipsychotic | |
| Rifapentine | 3300 | Viibryd | |||
| Rifaximin | 2000 | Aprepitant | |||
| Simeprevir | 1000 | Mellaril-S | |||
| Daclatasvir |
| Protease–S Protein Complex | S Protein | Protease | |||
|---|---|---|---|---|---|
| Target | Drug | Target | Drug | Target | Drug |
| catL-S1/S2’ | Rifapentine | S1/S2 | Capmatinib | catL | Rifapentine |
| Digoxin | Avatrombopag | Drospirenone | |||
| Nystatin | Cefpiramide | Digoxin | |||
| Rifaximin | Rifapentine | Nystatin | |||
| trypsin-S1/S2 | Drospirenone | Rifaximin | trypsin | Saquinavir | |
| Digoxin | Ciclesonide | Rifapentine | |||
| Nystatin | Dihydroergotamine | Drospirenone | |||
| Ubrogepant | S2’ | Antrafenine | Digoxin | ||
| Capmatinib | Irbesartan * | TMPRSS2 | Saquinavir | ||
| TMPRSS2-S1/S2 | Digoxin | Nebivolol * | Dexamethasone M | ||
| Nystatin | Ubrogepant | ||||
| Dihydroergotamine | Nystatin | ||||
| TMPRSS2-S2’ | Ubrogepant | Digoxin | |||
| Antrafenine | Rifapentine | ||||
| SARS-CoV S Protein | SARS-CoV-2 S Protein | Cleaved by |
|---|---|---|
| R667-S668 | R685-S686 (S1/S2 boundary) | TMPRSS2 and trypsin |
| R797-S798 | R815-S816 (S2’) | TMPRSS2 and trypsin |
| T678-M679 | T696-M697 (S1/S2’ boundary) | catL |
Publisher’s Note: MDPI stays neutral with regard to jurisdictional claims in published maps and institutional affiliations. |
© 2022 by the authors. Licensee MDPI, Basel, Switzerland. This article is an open access article distributed under the terms and conditions of the Creative Commons Attribution (CC BY) license (https://creativecommons.org/licenses/by/4.0/).
Share and Cite
Ozdemir, E.S.; Le, H.H.; Yildirim, A.; Ranganathan, S.V. In Silico Screening and Testing of FDA-Approved Small Molecules to Block SARS-CoV-2 Entry to the Host Cell by Inhibiting Spike Protein Cleavage. Viruses 2022, 14, 1129. https://doi.org/10.3390/v14061129
Ozdemir ES, Le HH, Yildirim A, Ranganathan SV. In Silico Screening and Testing of FDA-Approved Small Molecules to Block SARS-CoV-2 Entry to the Host Cell by Inhibiting Spike Protein Cleavage. Viruses. 2022; 14(6):1129. https://doi.org/10.3390/v14061129
Chicago/Turabian StyleOzdemir, E. Sila, Hillary H. Le, Adem Yildirim, and Srivathsan V. Ranganathan. 2022. "In Silico Screening and Testing of FDA-Approved Small Molecules to Block SARS-CoV-2 Entry to the Host Cell by Inhibiting Spike Protein Cleavage" Viruses 14, no. 6: 1129. https://doi.org/10.3390/v14061129