
Walkability Indicators in the Aftermath of the COVID-19 Pandemic: A Systematic Review

NOVA Cidade—Urban Analytics Lab, NOVA Information Management School, 1070-312 Lisboa, Portugal
*
Author to whom correspondence should be addressed.
Sustainability 2022, 14(17), 10933; https://doi.org/10.3390/su141710933
Submission received: 21 July 2022
/
Revised: 25 August 2022
/
Accepted: 30 August 2022
/
Published: 1 September 2022
(This article belongs to the Special Issue Tendencies and Strategies of Active Mobility to Promote Urban Sustainable Transportation Systems)
Abstract
:Walkability indicators are a pivotal method to evaluate the role of the built environment in people’s decisions regarding active mobility, contributing to help promote more sustainable and equitable regions. Currently, there is a lack of literature describing the trends and findings from recent studies, and how research on this topic has responded to COVID-19. In this work, we apply the PRISMA methodology to perform a systematic literature review of studies that employed walkability indicators to uncover associations between walkability and different topics, such as physical activity, health and mobility, in the aftermath of the pandemic. Results show that the growth rate of studies in this period almost doubled compared to the three years prior to the outbreak. We explore the main subjects addressed in recent literature and found that most studies resorted to well-known indicators, predominantly to Walk Score®, while fewer works developed and applied new indicators. General findings point to a positive association between walkability and physical activity, overall health and active mobility. Moreover, in recent works, walkability’s relationship with environmental metrics is not clear and there is a lack of studies linking walkability indicators to COVID-19. More than two years after the worldwide outbreak of the COVID-19 virus, our work provides an effective resource for researchers to understand recent trends in studies employing walkability indicators.
1. Introduction
Active modes of transportation have become one of the beacons of Sustainability [1,2,3]. In the 2030 Agenda for Sustainable Development, the United Nations has determined that countries and regions should provide for safe, affordable, accessible and sustainable transportation for their citizens [4]. Hence, among other resolutions, promoting walking as a viable means of transportation has become the focus of sustainable development policies [5,6,7].
Active mobility can contribute to the reduction of the number of circulating private vehicles [2]. Consequently, this can help alleviate traffic congestion, as well as lead to a reduction in air pollutant emissions, thus promoting sustainability by reducing environmental degradation [8,9,10]. Likewise, walking is the most democratic method of mobility, so guaranteeing access to critical services for pedestrians also guarantees greater equality in the use of these services [11]. Moreover, pedestrian friendly public spaces promote physical activity [12,13], social interactions and recreation activities [14], resulting in benefits for physical and mental health [15], and social well-being [16].
Hence, it is crucial to identify and understand the factors influencing travel decisions and walking behavior and, in particular, the features of the environment that increase walking as the choice of mobility.
In that respect, the concept of walkability refers to how friendly the built environment is for pedestrians, considering both street conditions and the proximity and distribution of key services in the surrounding area [17,18]. This concept has been studied in different works that try to objectively measure the characteristics of the environment [19,20,21], generally through the application of a walkability indicator–a composite score encompassing the main features that contribute to walking [22,23]. These indicators allow assessment of the impact of the built environment on different phenomena [24]. Among other topics, researchers have studied the association between objectively measured walkability and physical activity [25,26,27,28], health [29,30,31,32], active commuting [33,34,35], pedestrian safety [36,37,38], pollution [39], and environmental well-being [5]. Hence, walkability indicators represent an efficient tool to support policy makers and urban designers in decision-making, by informing and gauging actions and initiatives [40,41].
Recently, the COVID-19 outbreak has brought more awareness to the general public about the topic of walkability [42]. Population lockdowns and social distancing have disturbed and altered mobility patterns to prevent and restrict the spread of the virus [43,44]. As a consequence, people resorted more often to active modes of transportation, such as walking and cycling [45,46,47,48,49]. In addition, people are spending more time in their residential area [50,51,52], which increases the importance given to the effect the built environment and urban design have on their mobility and overall quality of life [42]. Despite this, there is a lack of research systematizing the recent trends and findings of studies that resort to walkability indicators, and how they have been affected by the pandemic [1,49].
Therefore, the present study identifies and reviews works that employ walkability indicators and link walkability to objectively measured phenomena that are relevant to sustainable development. To fill the research gaps, our aim is to answer the following research questions:
- RQ1: What are the main subjects investigated in recent literature on walkability indicators?
- RQ2: What are the most used walkability indicators in recent literature?
- RQ3: What are the main findings from the recent literature?
- RQ4: How do these findings compare to those before the COVID-19 pandemic?
- RQ5: How do recent works on walkability indicators reflect the topic of the COVID-19 pandemic?
- RQ6: What are the main gaps identified in the reviewed literature?
We performed a systematic literature review following the PRISMA [53] methodology and conducted exploratory and bibliometric analysis of the selected works on the topic of walkability indicators in the aftermath of COVID-19. This study contributes to the literature by (1) identifying influential authors, papers, journals, and countries; (2) systematizing and synthesizing recent findings, methodologies, and results used in selected articles; (3) investigating the association between walkability indicators and the subject of the pandemic; and (4) identifying some of the limitations of recent literature.
The rest of this study proceeds as follows: Section 2 details the methodology employed in this research. In Section 3, we describe the results of the exploratory and bibliometric analysis and discuss and answer the research questions. Finally, in Section 4 we summarize and conclude the work conducted.
2. Methodology
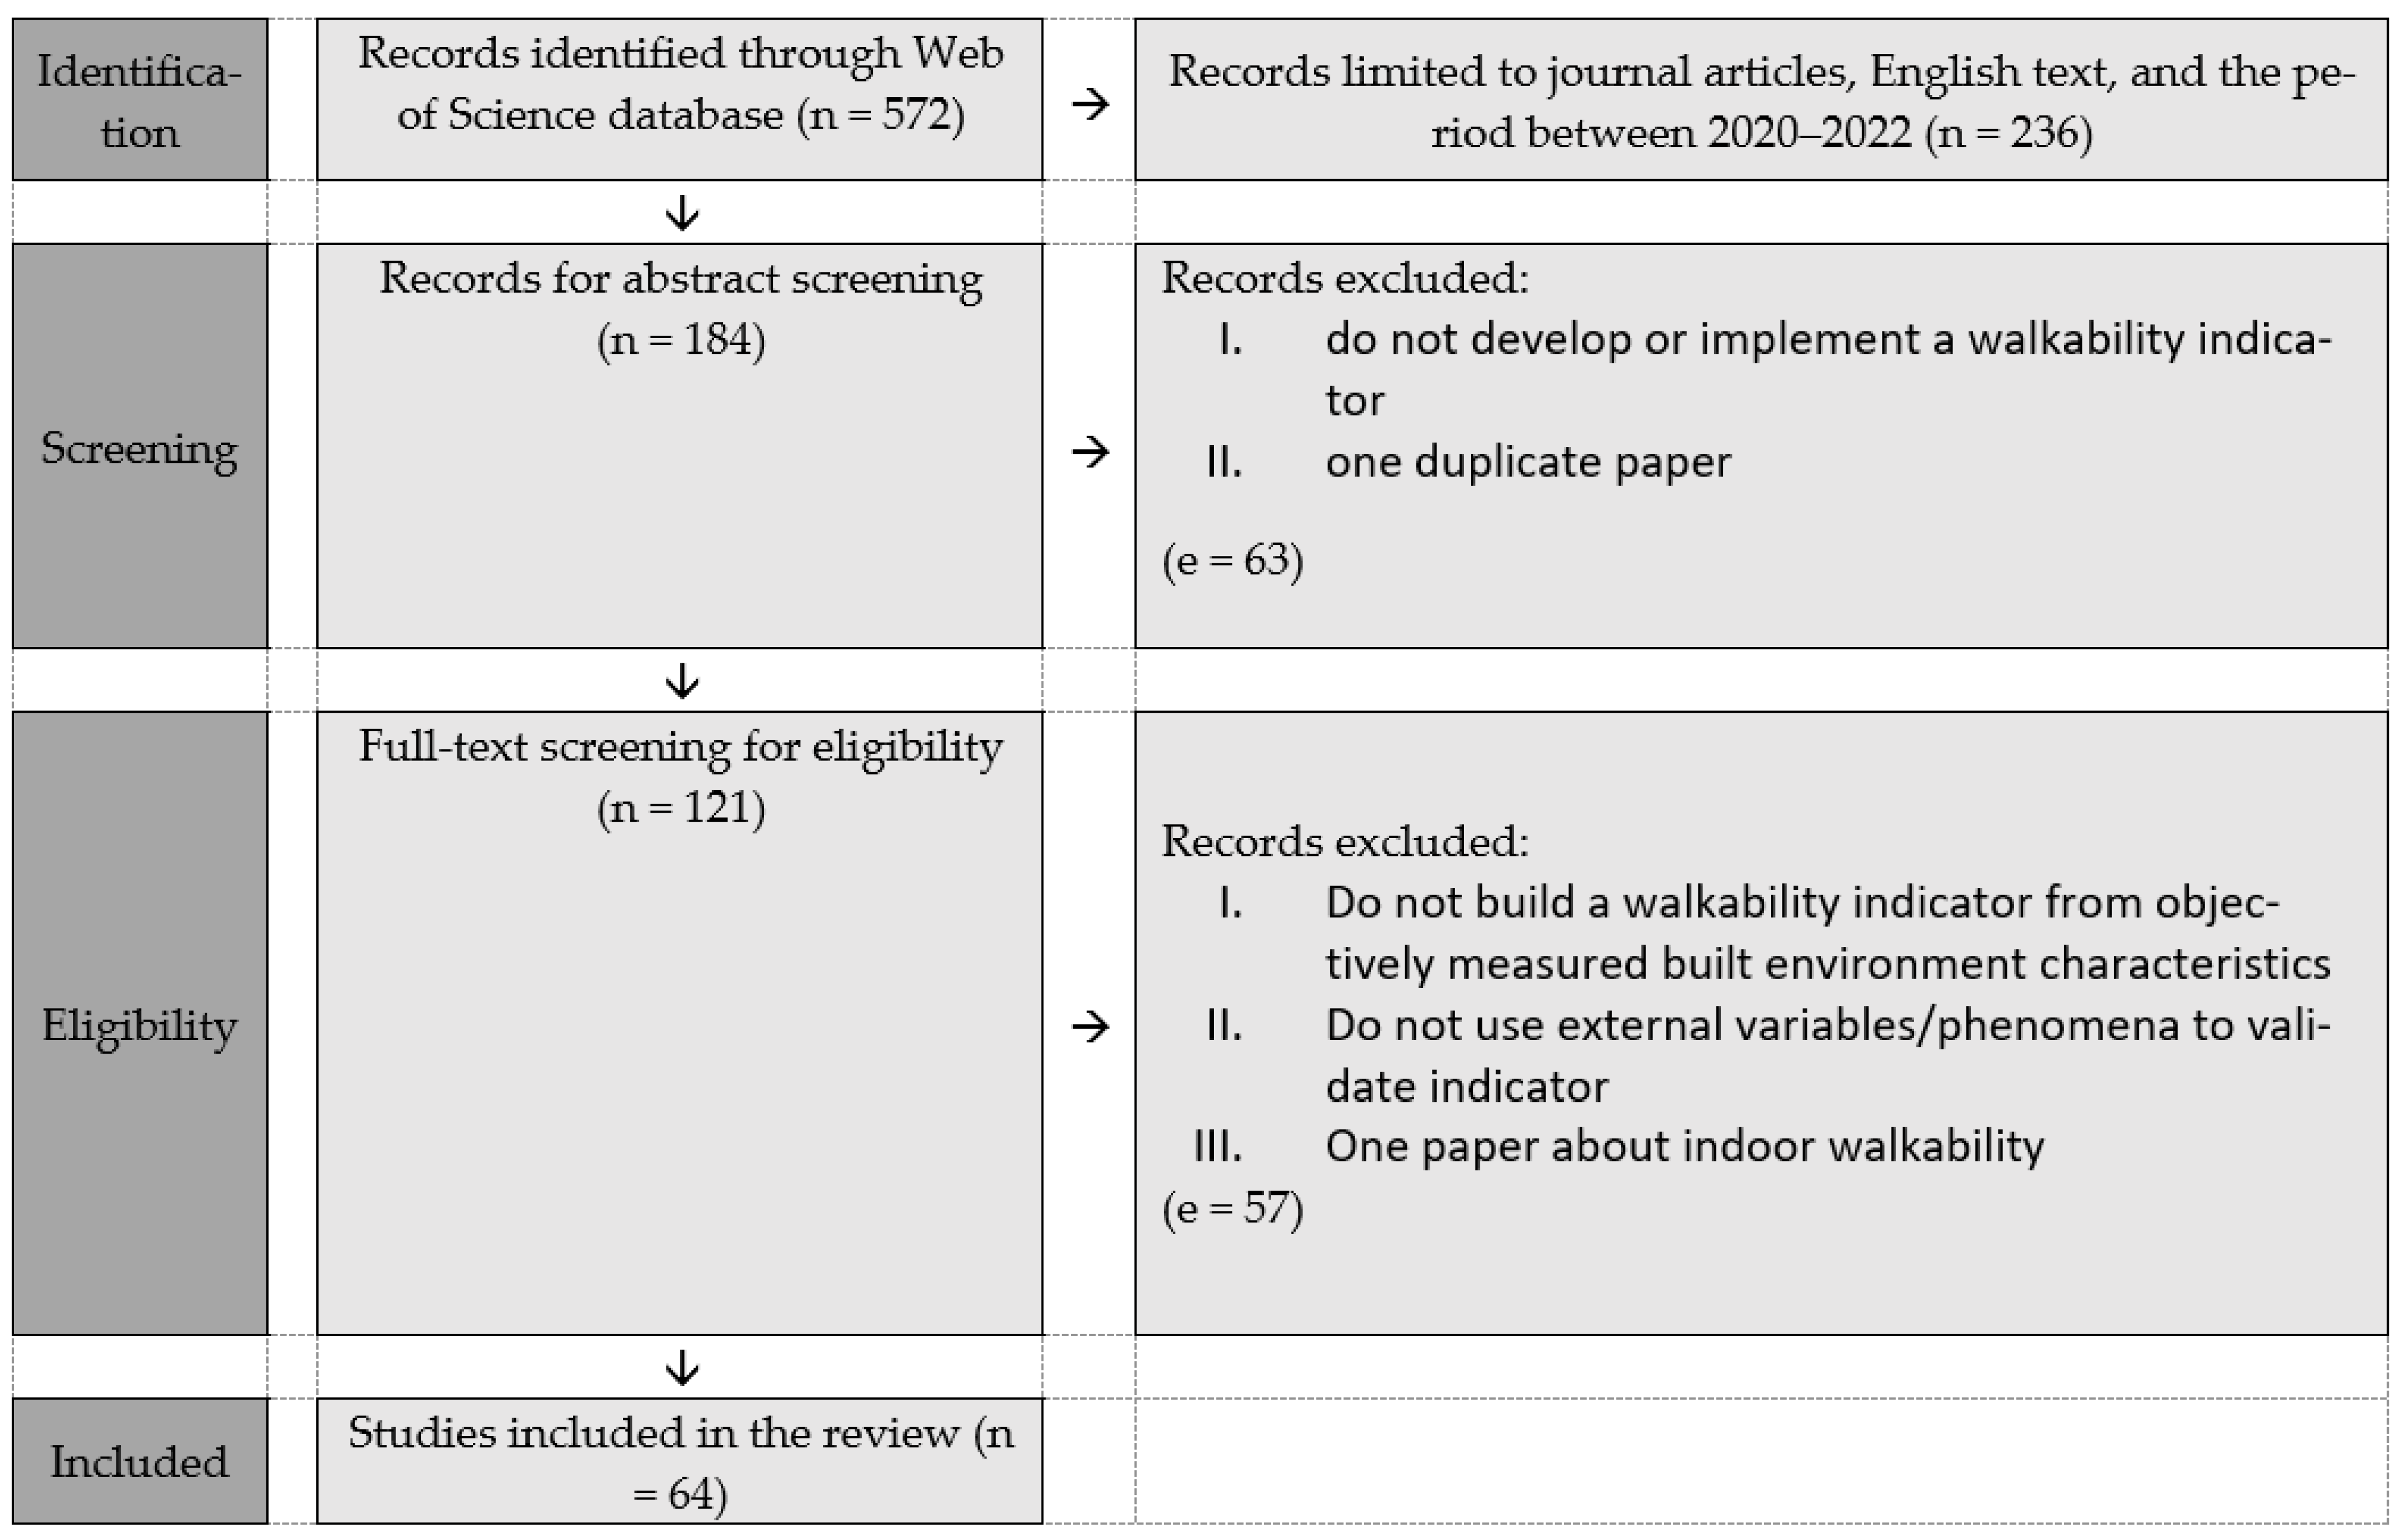
This systematic literature review aims at compiling, interpreting, and evaluating the methods and findings of relevant scientific work regarding walkability indicators and the way these are associated to different phenomena in the period after the outbreak of the COVID-19 pandemic. For that purpose, we resort to the well-established systematic literature review framework Preferred Reporting Items for Systematic reviews and Meta-Analyses (PRISMA) [53]. PRISMA is a four-phase framework for identifying, screening, and validating the eligibility of relevant documents for a research topic. In Figure 1, a diagram is displayed outlining the process through which relevant works were selected for inclusion in this study.
2.1. Database Search
Web of Science (WoS) [55] was the chosen online database for literature search, as it is one of the most used and well-known databases for that purpose and for supporting bibliometric analysis, having a broad coverage of most scientific work sources for different subjects. The user-friendly interface of WoS allows to define a search query based on keys words within the article content (title, abstract and keywords). We searched for the following keywords in the documents abstract: “walkability”, “indicator”, “score”, “index”. The word “walkability” ensured that all retrieved documents addressed this topic, while “indicator”, “score” and “index” guaranteed that the documents obtained used an indicator to measure walkability.
2.2. Eligibility Criteria
The research timeframe was set to the period after the outbreak of the COVID-19 pandemic, comprising the years of 2020, 2021 and 2022 (until June 2022), as our purpose was to analyze the patterns in literature during and after the health crisis. To guarantee the scientific credibility of this review, only articles published in peer-reviewed journals from quartile one and two, according to Journal Citation Report (JCR) [56], were selected. Hence, conference papers, review papers, books, book chapters and research notes were removed from the analysis. Furthermore, we filtered for English-written documents only. The resultant WoS search query was the following: (AB = walkability AND AB = (score OR indicator OR index) AND DOP = (2020-01-01/2022-01-05) AND DT = (Article) AND LA = (English)).
2.3. Screening
After the application of these criteria, from the initial number of 572 documents, a set of 236 works were identified. Furthermore, we proceeded to screen each article’s abstract to ensure that all retrieved papers were relevant for the topic under study. From this screening process, we removed 63 articles that, despite approaching the subject of walkability and using certain indicators, did not actually implement or develop a walkability indicator. Lastly, an integral screen (full-text screening) led us to remove 57 papers that did not fit the purpose of this review because: (1) they did not build a walkability indicator from objectively measured built environment characteristics; (2) they did not use external variables/phenomena to validate the built indicator; (3) one paper was measuring indoor walkability.
2.4. Bibliometric Analysis
A bibliometric analysis is a method for exploring and analyzing scientific data. It is used to uncover trends, collaboration patterns, research terms, and the overall intellectual structure of a research domain [57]. It does so by analyzing the data at different levels, from authors, to documents, publishers, journals, countries, keywords, and citations. In this work, we conduct a bibliometric analysis to derive conclusions regarding the main developments on walkability indicators and their context in the scientific intellectual environment. We run different forms of analysis, namely co-authorship, co-occurrence, citation, and co-citation analysis. To do so, we resort to VOSviewer [58], an open-source data-visualization software used to construct bibliometric maps based on literature datasets [54].
3. Results and Discussion
This section describes the work conducted and results obtained–first, for an exploratory analysis of the reviewed documents, in which we analyze the number of documents and citations per year, country, publisher, journal, author and document; and second, for a bibliometric analysis. The, this section answers and discusses the research questions specified in the introduction of this review.
3.1. Exploratory Analysis
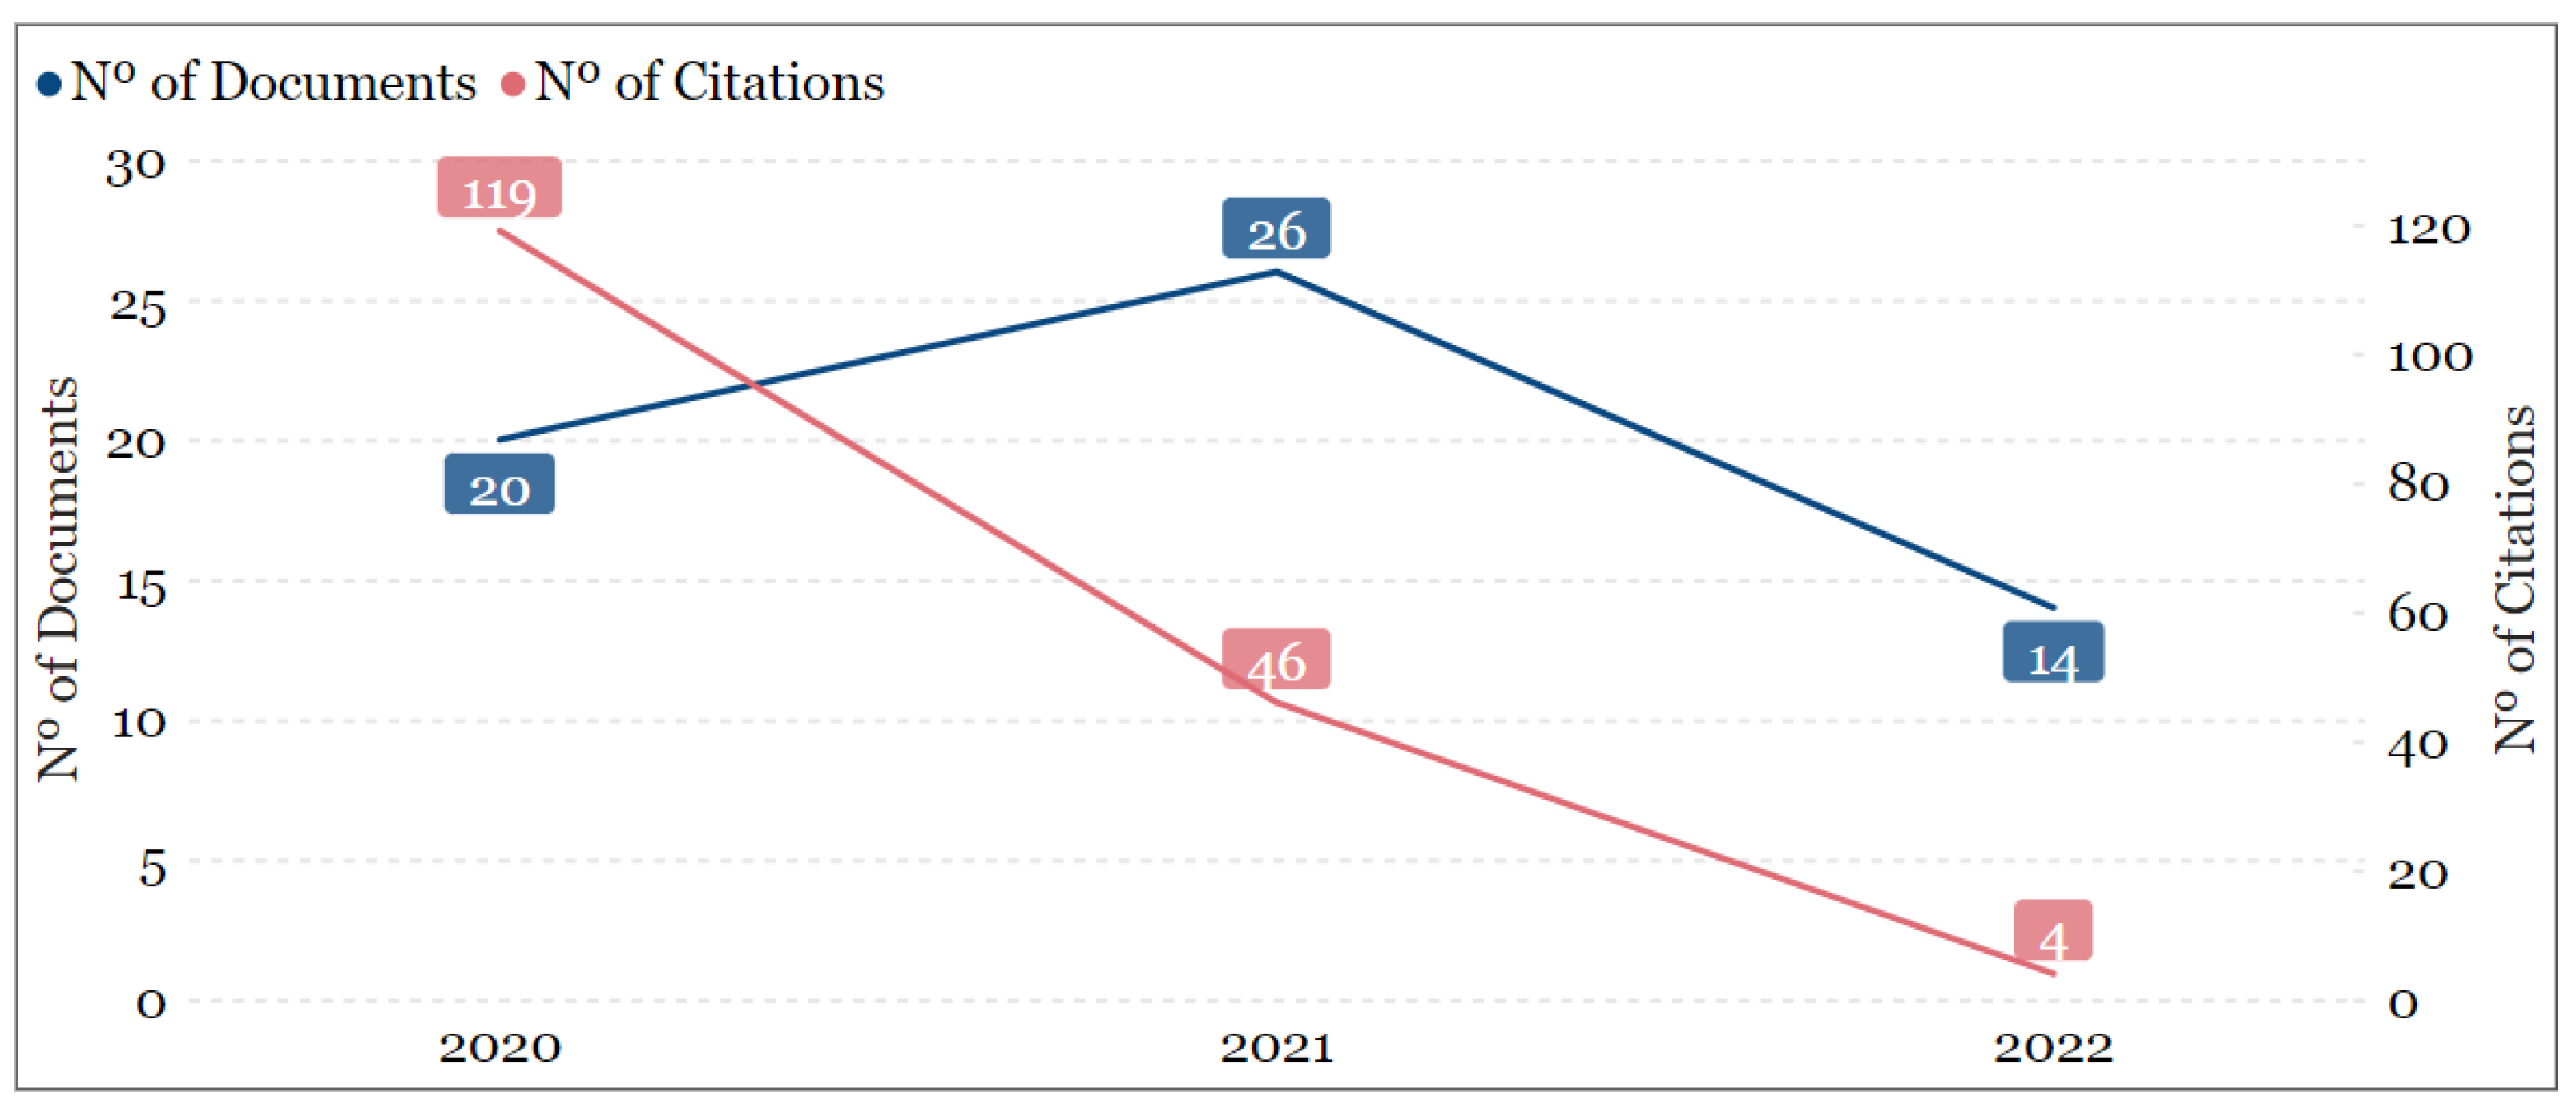
We start by analysing the yearly evolution of documents and citations during the period under study. From Figure 2, we can see that 2021 was the year with more publications, with 26, followed by 2020, with 20 and 2022, with 14. The timeframe considered for 2022 only encapsulates the first 5 months of that year, while both 2020 and 2021 have the entirity of the period evaluated. Thus, from the current trend it is likely that, by the end of 2022, this year will surpass the other two regarding the number of documents published. Naturally, the number of citations by year displays a different pattern, where 2020 stands out as the year with more citations, with 119, documents from 2021 have a total of 46 citations, and 2022 documents have 4 citations already.
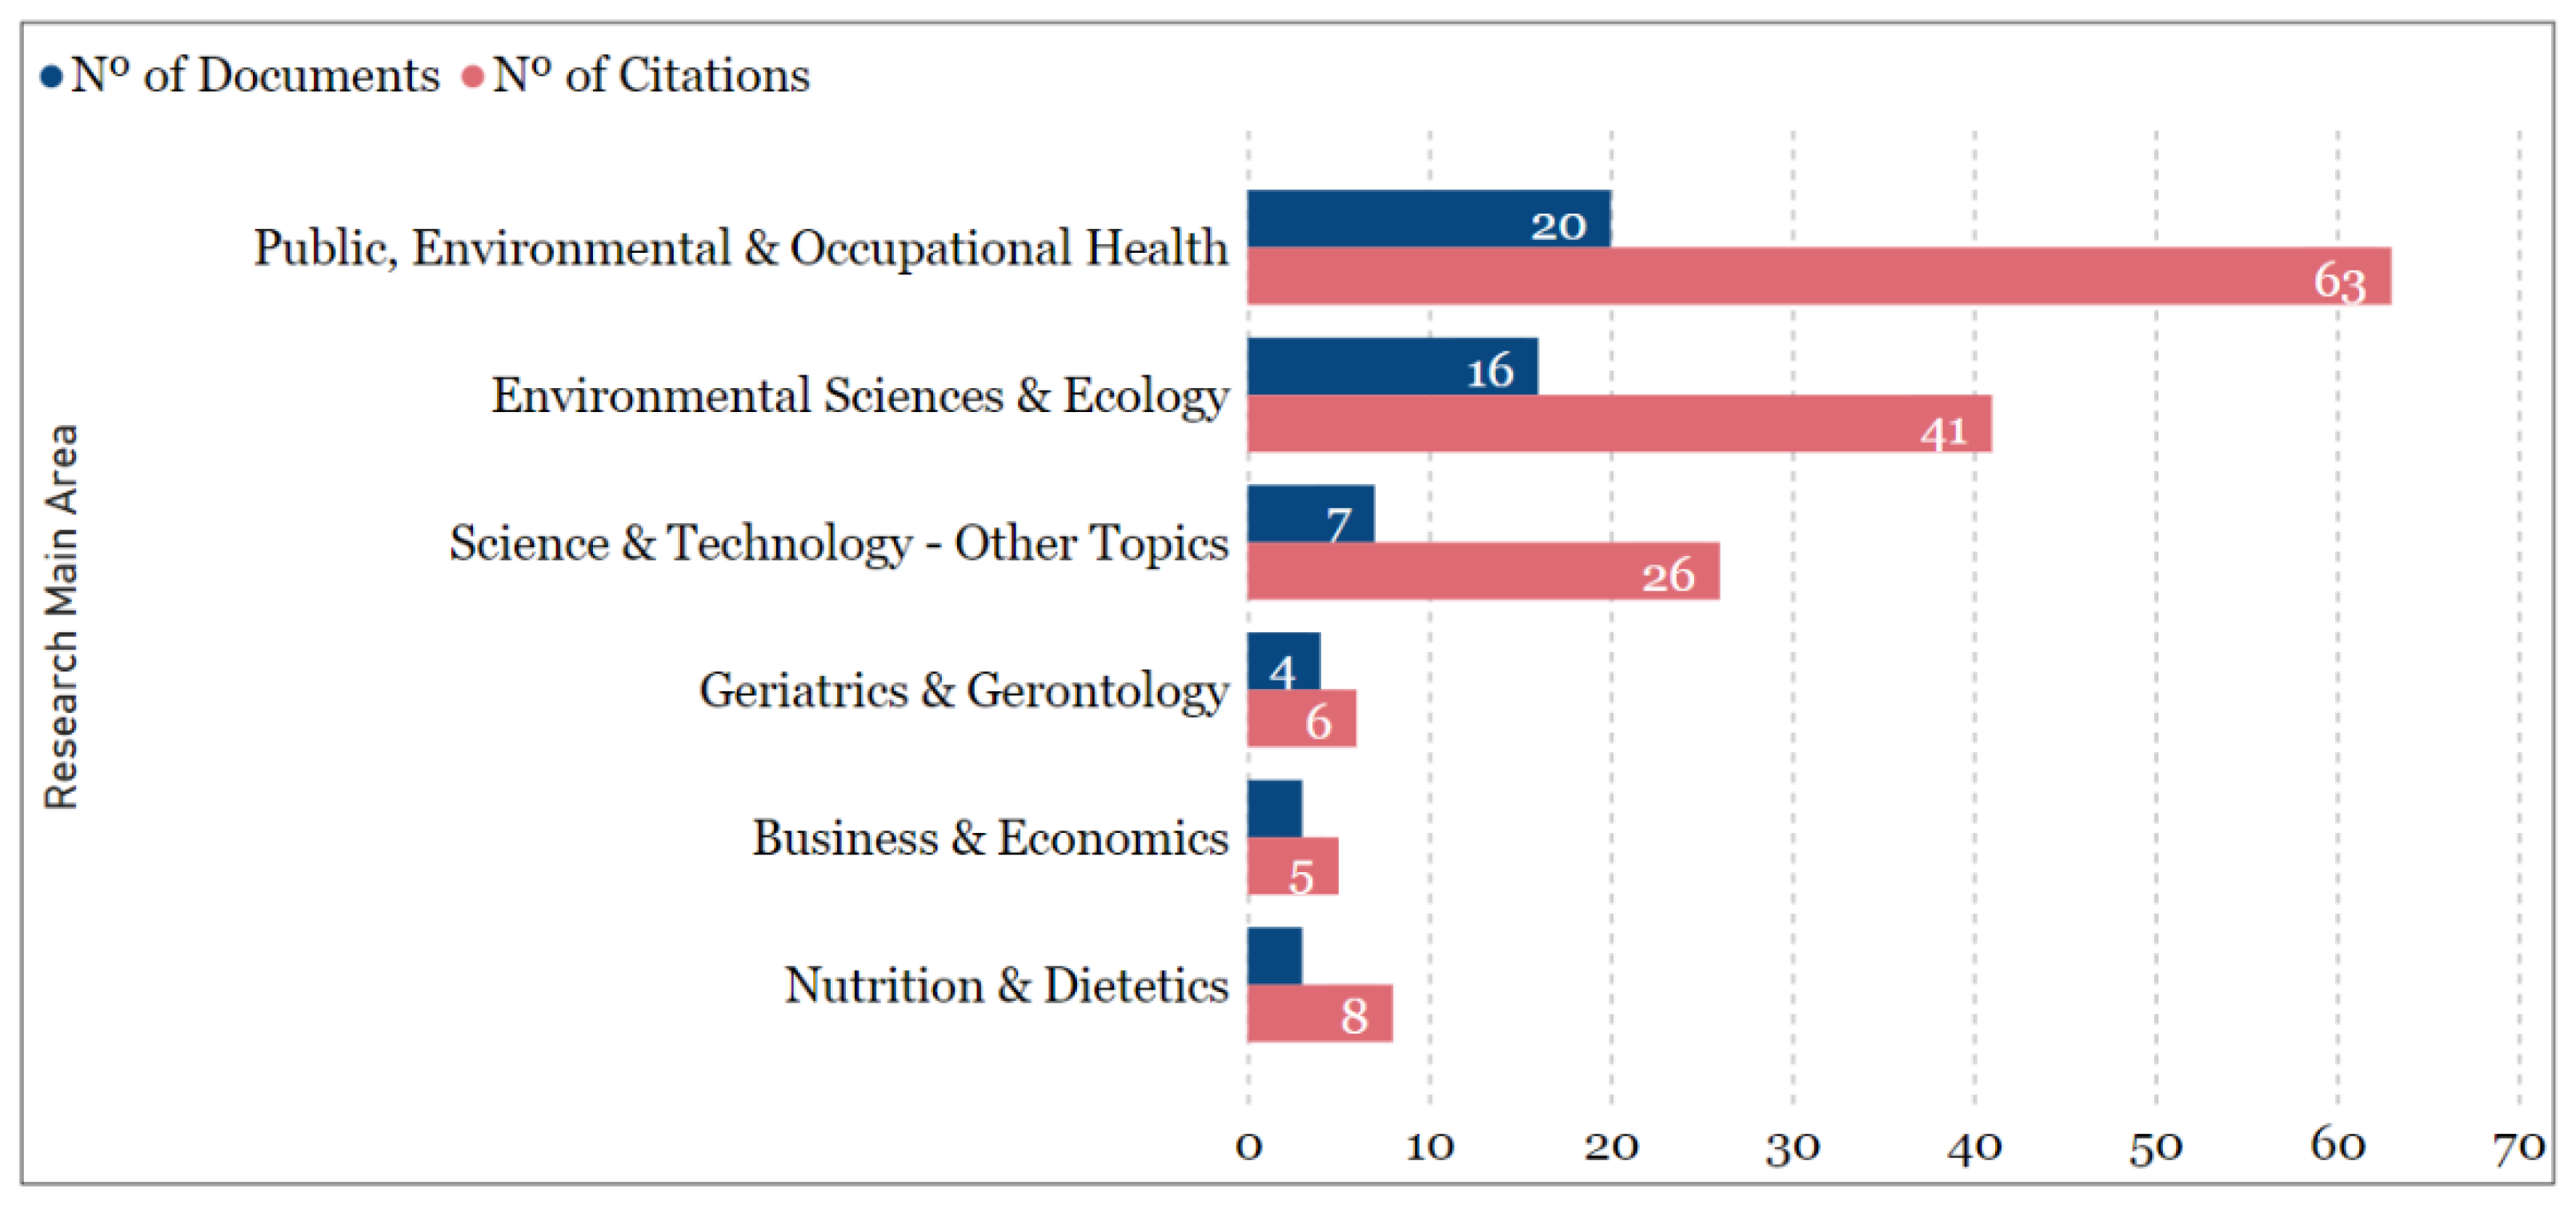
Next, Figure 3 displays the number of documents and citations per WoS research area. “Public, Environmental & Occupational Health” is the area with most documents (20), followed by “Environmental Sciences & Ecology” (16), while “Business & Economics” and “Nutrition & Dietetics” (3) are the areas with less documents. Regarding citations, the pattern found is similar, except for “Nutrition & Dietetics”, which is the fourth area with more citations (8), having, on average, 2.7 citations per article. Regarding this metric, “Science & Technology” is the area with more average citations per article, with 3.7 citations.
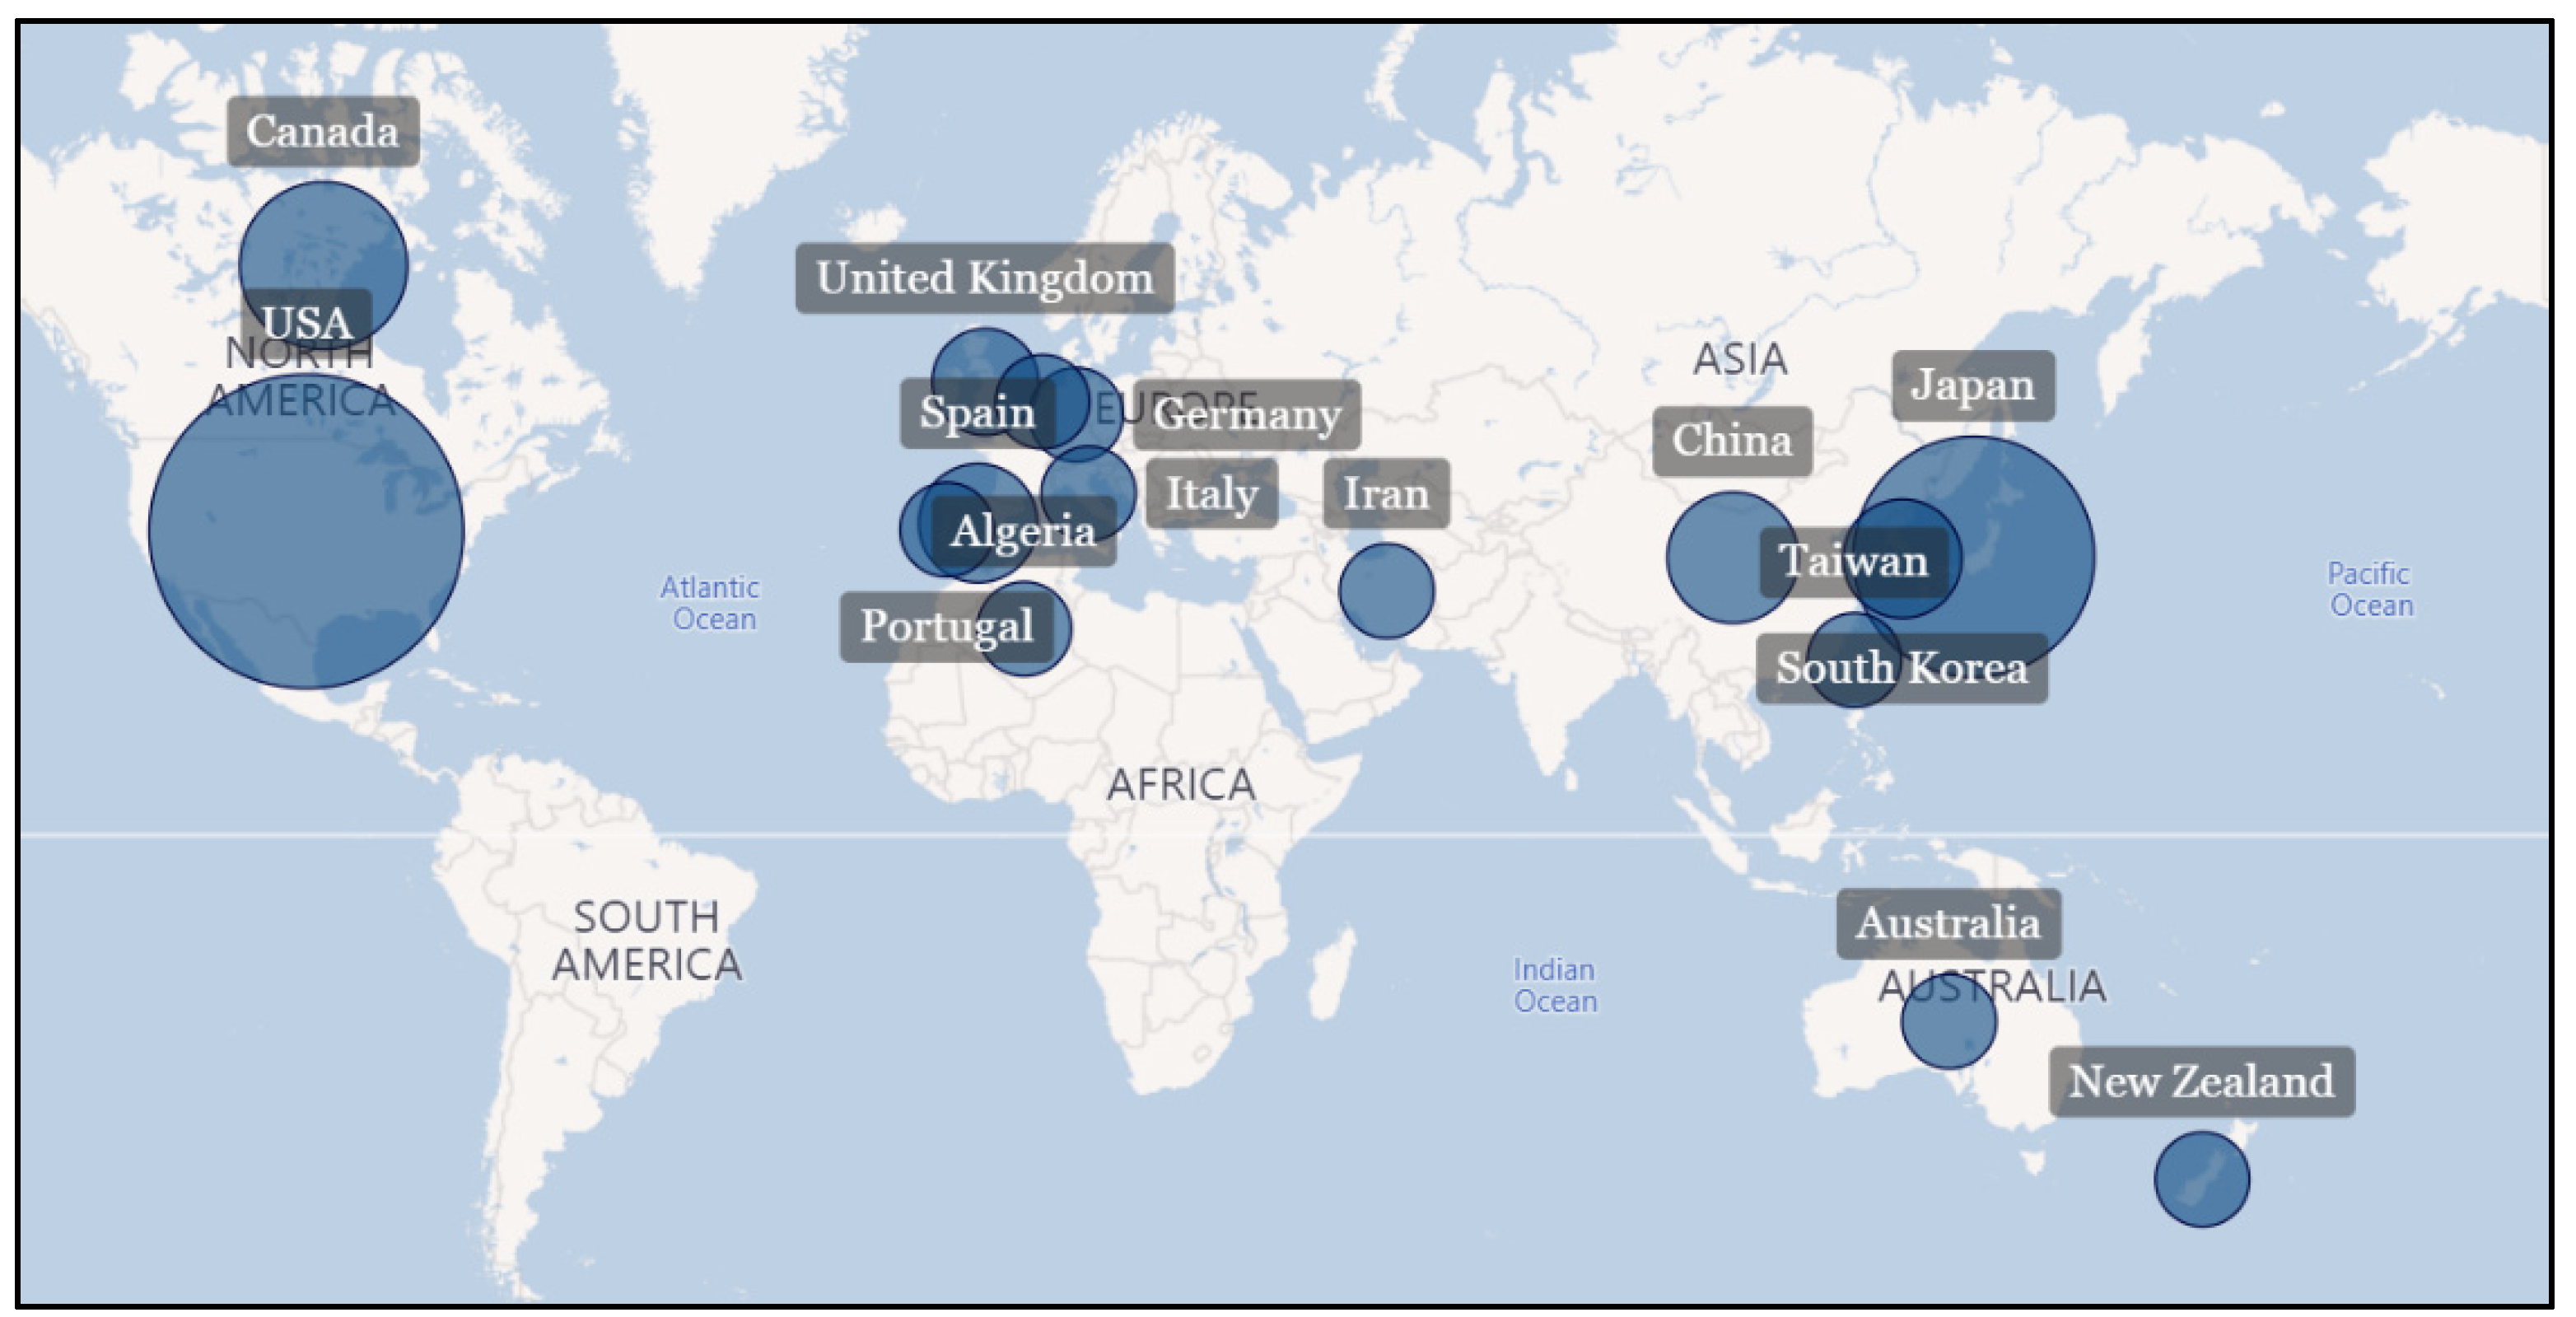
The distribution of documents per country where the indicators were implemented (Figure 4), shows that the USA is the country with more publications, with 19 documents, followed by Japan and Canada, with 13 and 7 documents, respectively. China, with 4 documents, and South Korea and Spain with 3 documents each, close the top 5. One walkability indicator was employed in Algeria, Australia, England, Germany, Iran, Italy, the Netherlands, Portugal, Scotland, Taiwan, and New Zealand.
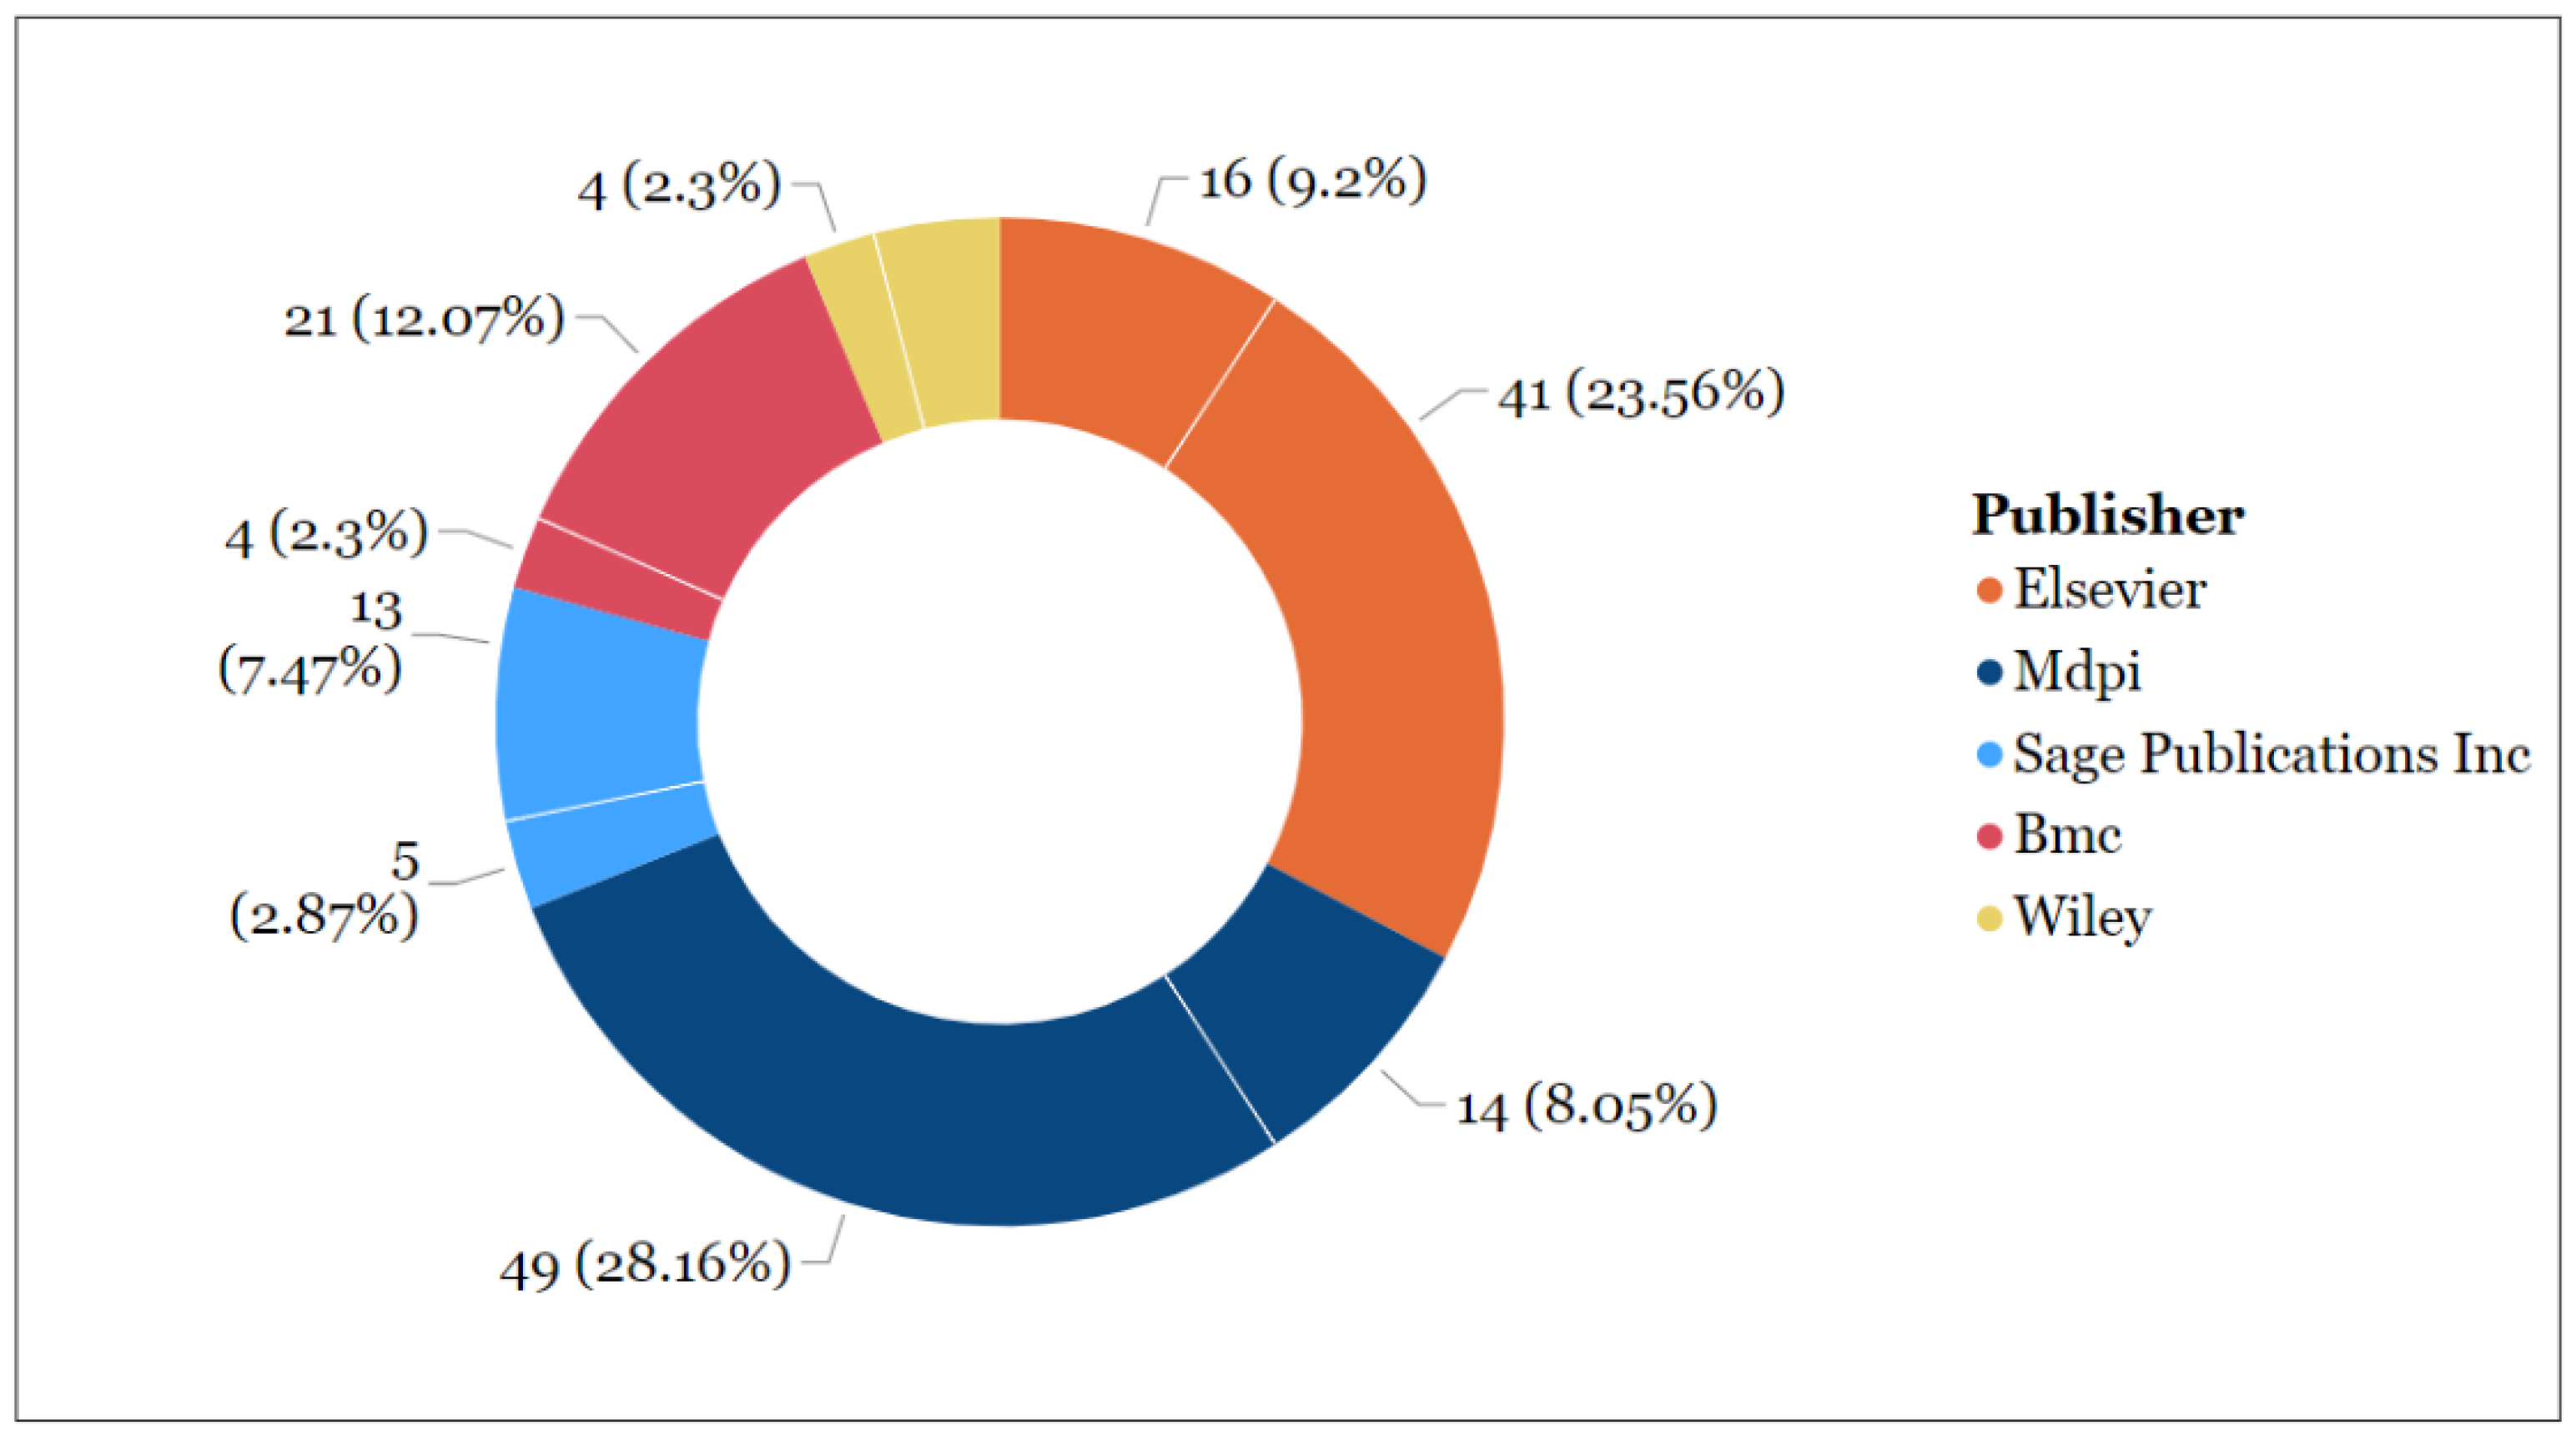
Looking into the previous metrics by publisher (journal) (see Figure 5), “Elsevier” is the publisher with more documents (16) and the second one with more citations (49). “MDPI”, with 14 documents and 49 citations, is the second publisher with more articles and the one with more citations. With regards to Journals (Figure 6), the “International Journal of Environmental Research and Public Health” is the one with more publications (8), as well as citations (25). “Sustainability” is the journal with more citations per document, with an average of 4.6.
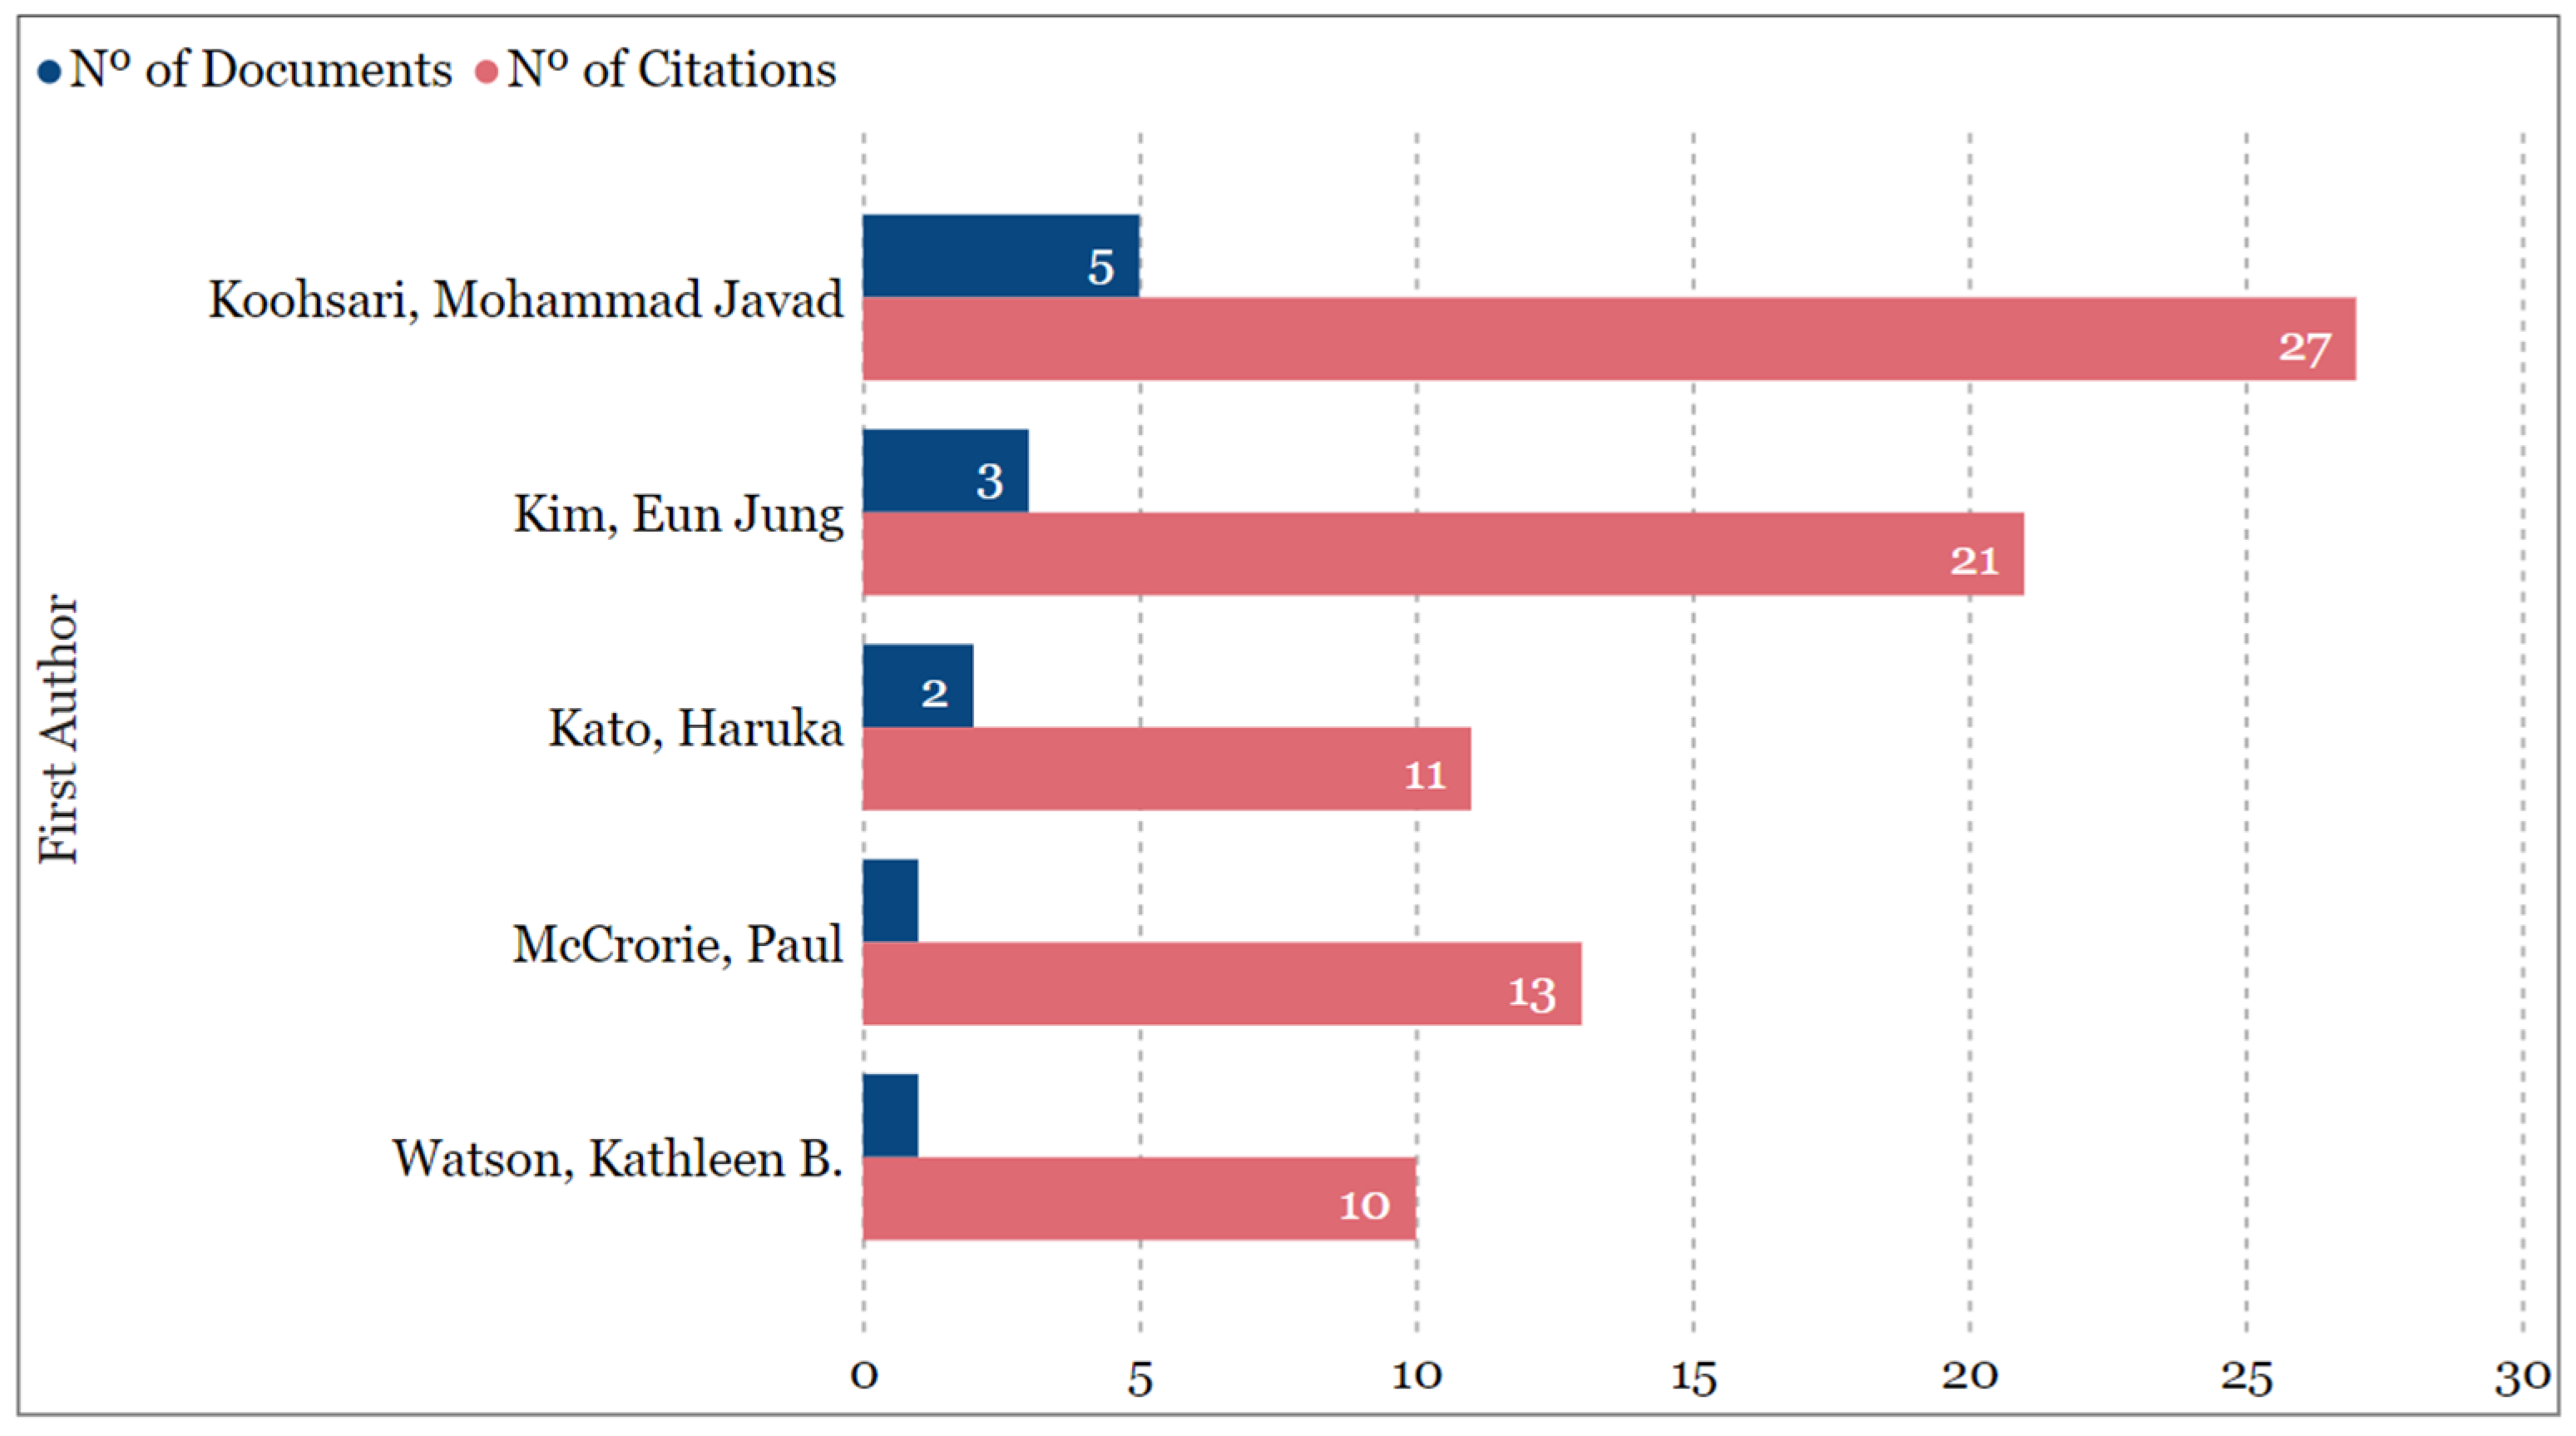
As for the authors analysis, Figure 7 compiles the top 5 authors per number of documents and citations. Mohammad Javad Koohsari, from Wasada University in Japan, stands out, with 5 documents published between 2020 and mid-2022, and 27 citations in the same period. Paul McCrorie is the author with more citations per document (13), with only 1 document published and 13 citations.
Likewise, we analyzed the five most cited documents. “The relationship between living in urban and rural areas of Scotland and children’s physical activity and sedentary levels: a country-wide cross-sectional analysis” by McCrorie et al. [28] is the most cited paper, with 13 citations. The indicator, based on Frank et al. [59] and Macdonald et al. [60], was implemented in Scotland to measure the association between walkability and children’s physical activity. Results show that walkability was not associated with any outcome of physical activity among children. Additional information regarding the documents that make up the most cited top 5 can be found in Table A1.
3.2. Bibliometric Analysis
In this section, we perform a bibliometric analysis over the selected documents for review. We conduct co-authorship analysis, co-occurrence analysis, citation and co-citation analysis.
3.2.1. Co-Authorship Analysis
Co-authorship analysis provides information regarding study collaboration between entities, namely authors, organizations, and countries. Figure 8 displays a network map of the full counting of co-authorship, considering a minimum of 3 documents per author. A total of 10 authors were identified, resulting in two clusters of collaborations. The red cluster (left) presents a more complex network, comprising mostly authors from Japanese institutions. The second cluster, in green (right), only contains two authors, both from Canadian institutions. The link between the two clusters is established by Gavin R. McCormack, who has worked with all authors from the red cluster. The collaborations expressed in this map implemented walkability indicators generally to measure the effect of walkability on health and physical activity.
With regards to organizational co-authorship (Figure 9), again two clusters were identified. The red one (left) comprises 4 Japanese schools, 2 Australian and 1 Canadian, all of which have developed walkability indicators studies on health and physical activity. The green cluster (right) contains only one institution from Australia. The study focus of documents from this affiliation is the relationship between walkability and urban greenness.
Countries’ co-authorship analysis results in 4 clusters (Figure 10). With exceptions, countries are grouped by language and geographical proximity. One cluster, in green, comprises South Korea, Taiwan and Japan. Japan is the main bridge between these and other clusters, namely the yellow one, which considers only Canada, the blue one containing Australia and Spain, as well as the red one, with the USA, England, and China. The relationship between this last cluster and the others is established through England.
3.2.2. Co-Occurrence Analysis
Co-occurrence analysis highlights the most common words in the documents’ text and their occurrence together. Figure 11 displays a network map of the fractional counting of author keyword co-occurrence, considering a minimum of 3 documents per keyword. The size of the nodes indicates the weight of the keywords, the connections between nodes represent the co-occurrence of keywords, and the thickness of the links and the distance between two nodes represent the frequency of the co-occurrence.
Three clusters were identified: in red keywords are related to the subject of health, the node for the word “health” being the one with the biggest size. The cluster in green related mostly with environmental factors, while the blue cluster seems to concern physical activity and its association with walkability and the built environment. Unsurprisingly, physical activity, built environment and walking are the most important keywords identified in terms of occurrence and generally appear together. This is indicative of the topic of most papers, which focus on the importance of the built environment (measured through a walkability indicator) in promoting walking and physical activity.
3.2.3. Citation Analysis
Next, we perform a citation analysis. This analysis inspects the frequency of citations of authors, organizations, and countries, in which a link between two nodes means a node cited the other.
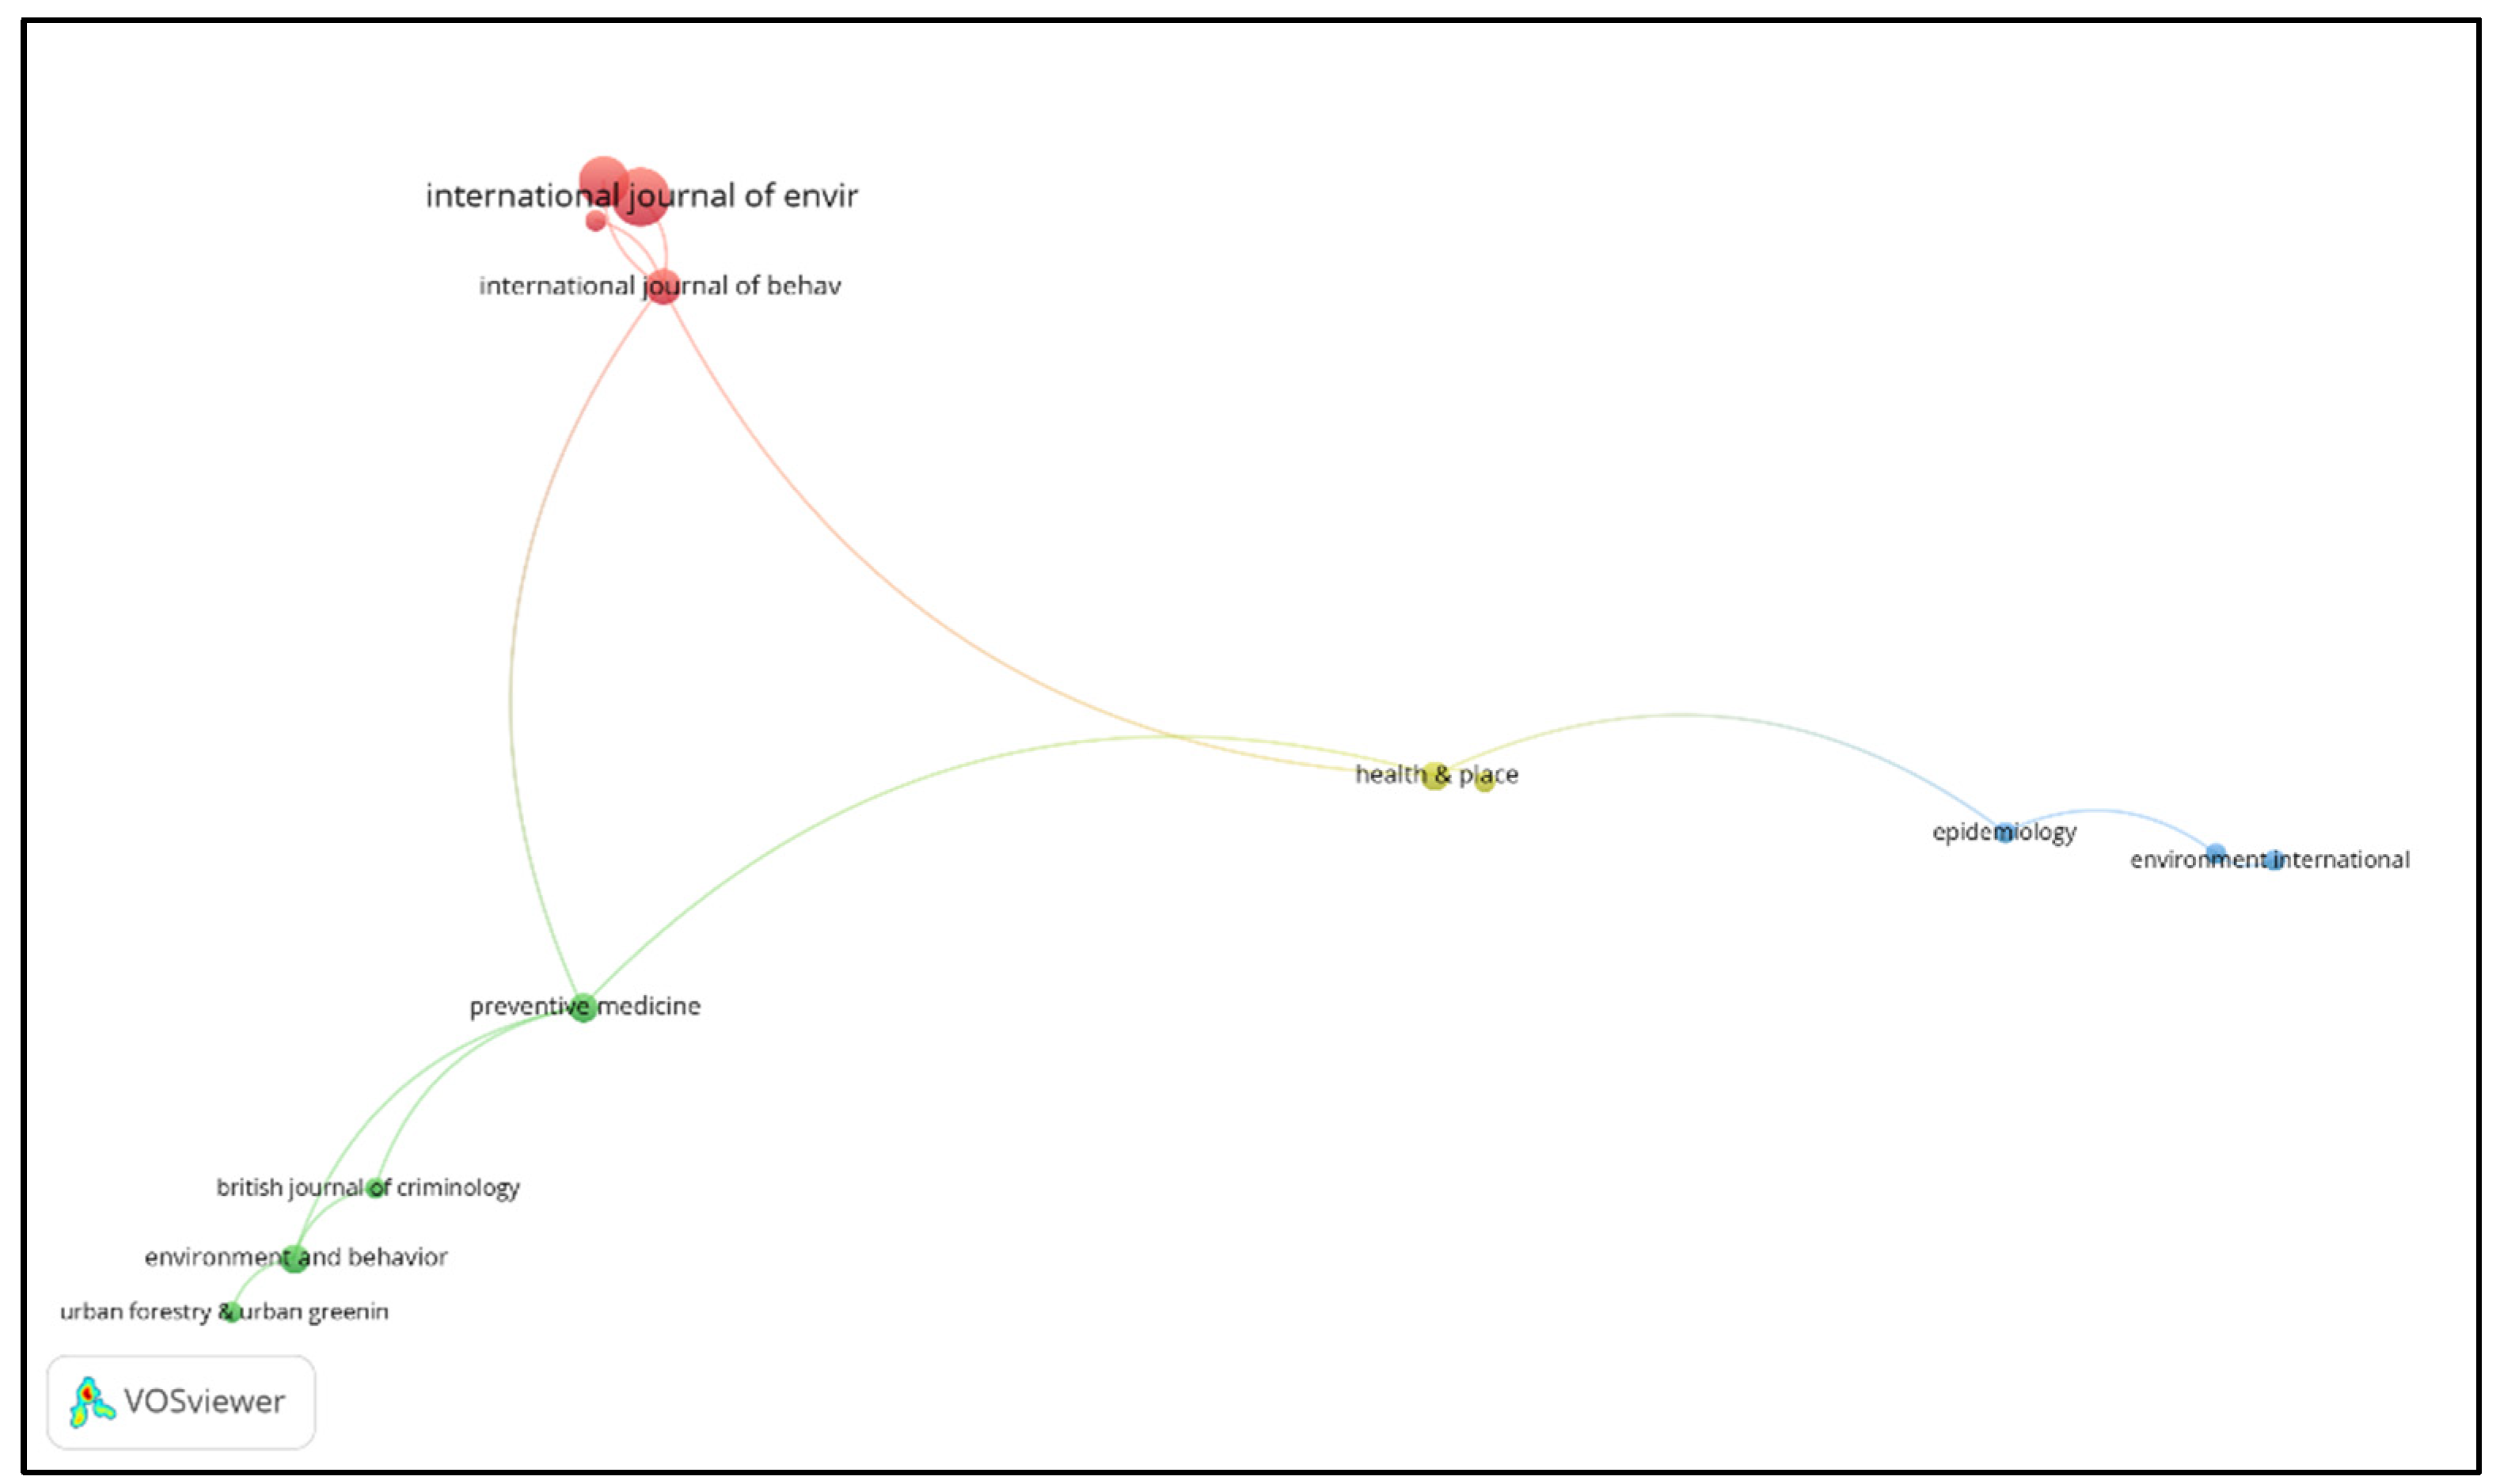
We evaluate source (journal) citations, with minimum number of documents per source set to one. The resulting network map can be seen in Figure 12. A total of 4 clusters were identified. In the blue cluster (bottom right) sources include works regarding relationship between walkability and risk of death. The cluster in yellow (comprising “Health & Place” and “Scientific Reports”) works as the bridge node between all other clusters. Documents published there investigate the relationship between walkability and sedentary behaviors. In the red cluster (top left), documents are generally focused on the correlation between active commuting and walkability. Lastly, the green cluster comprises sources with studies mostly focused on the relationship between walkability and physical activity, or walkability and crime patterns.
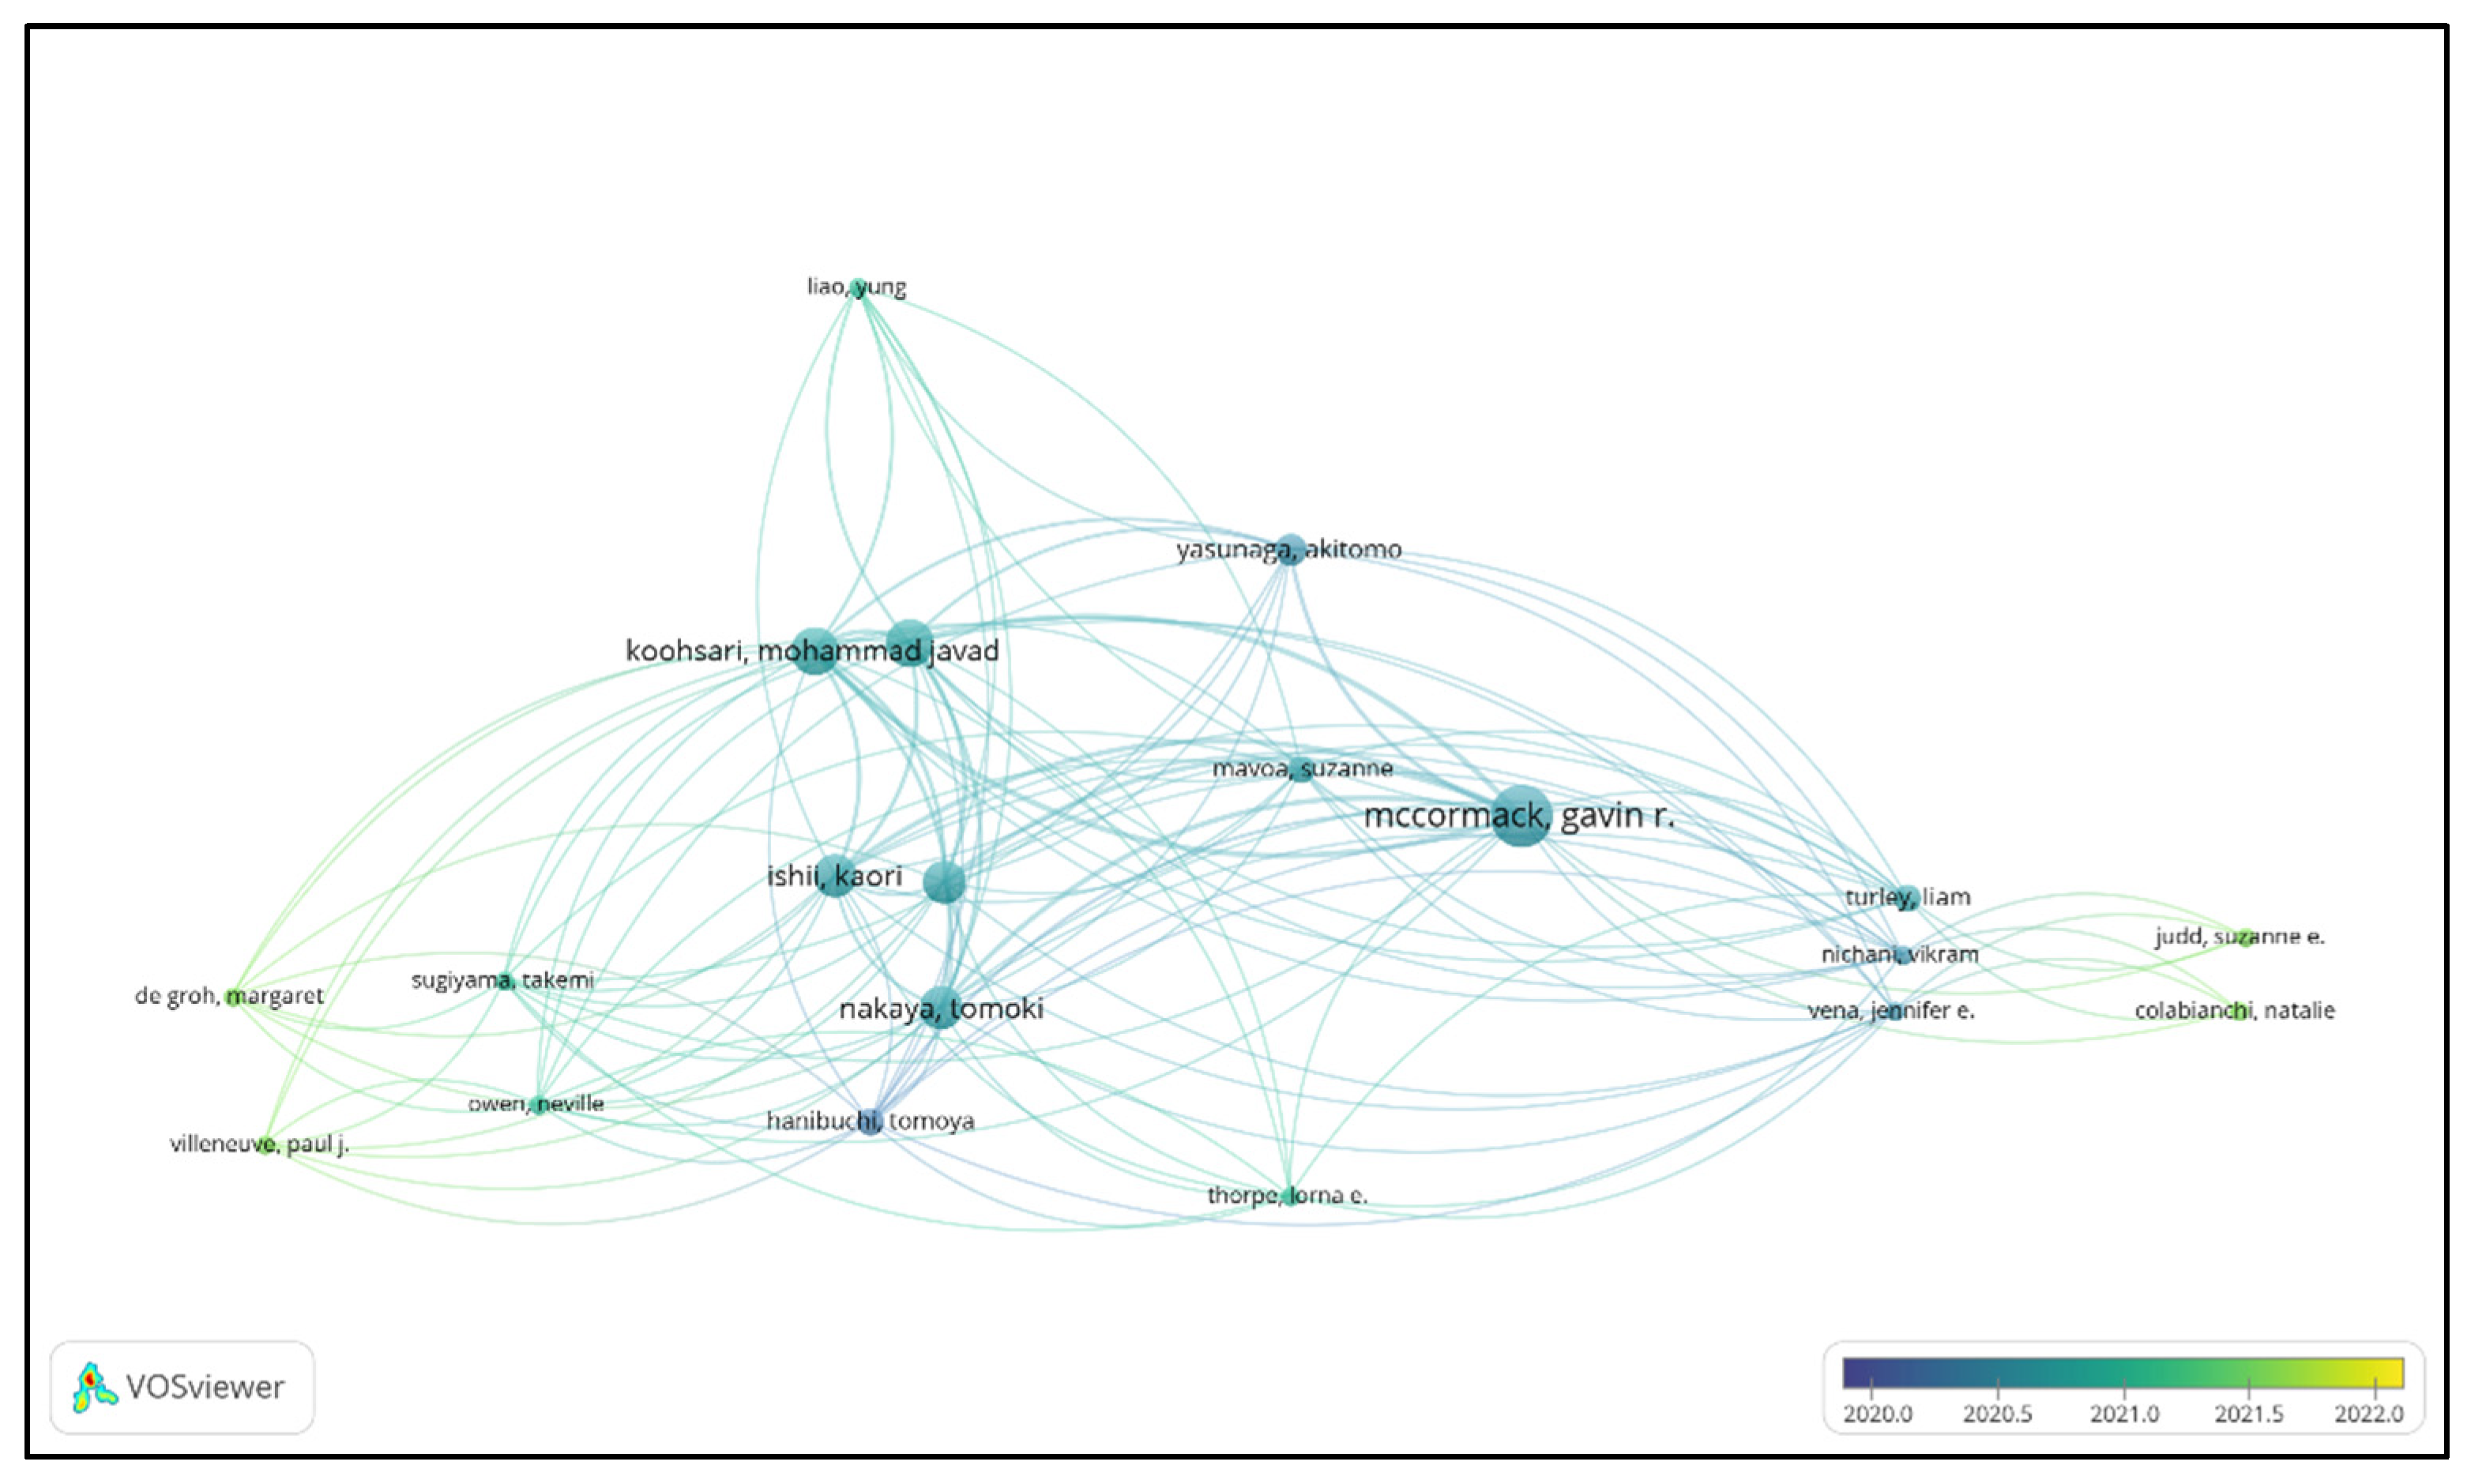
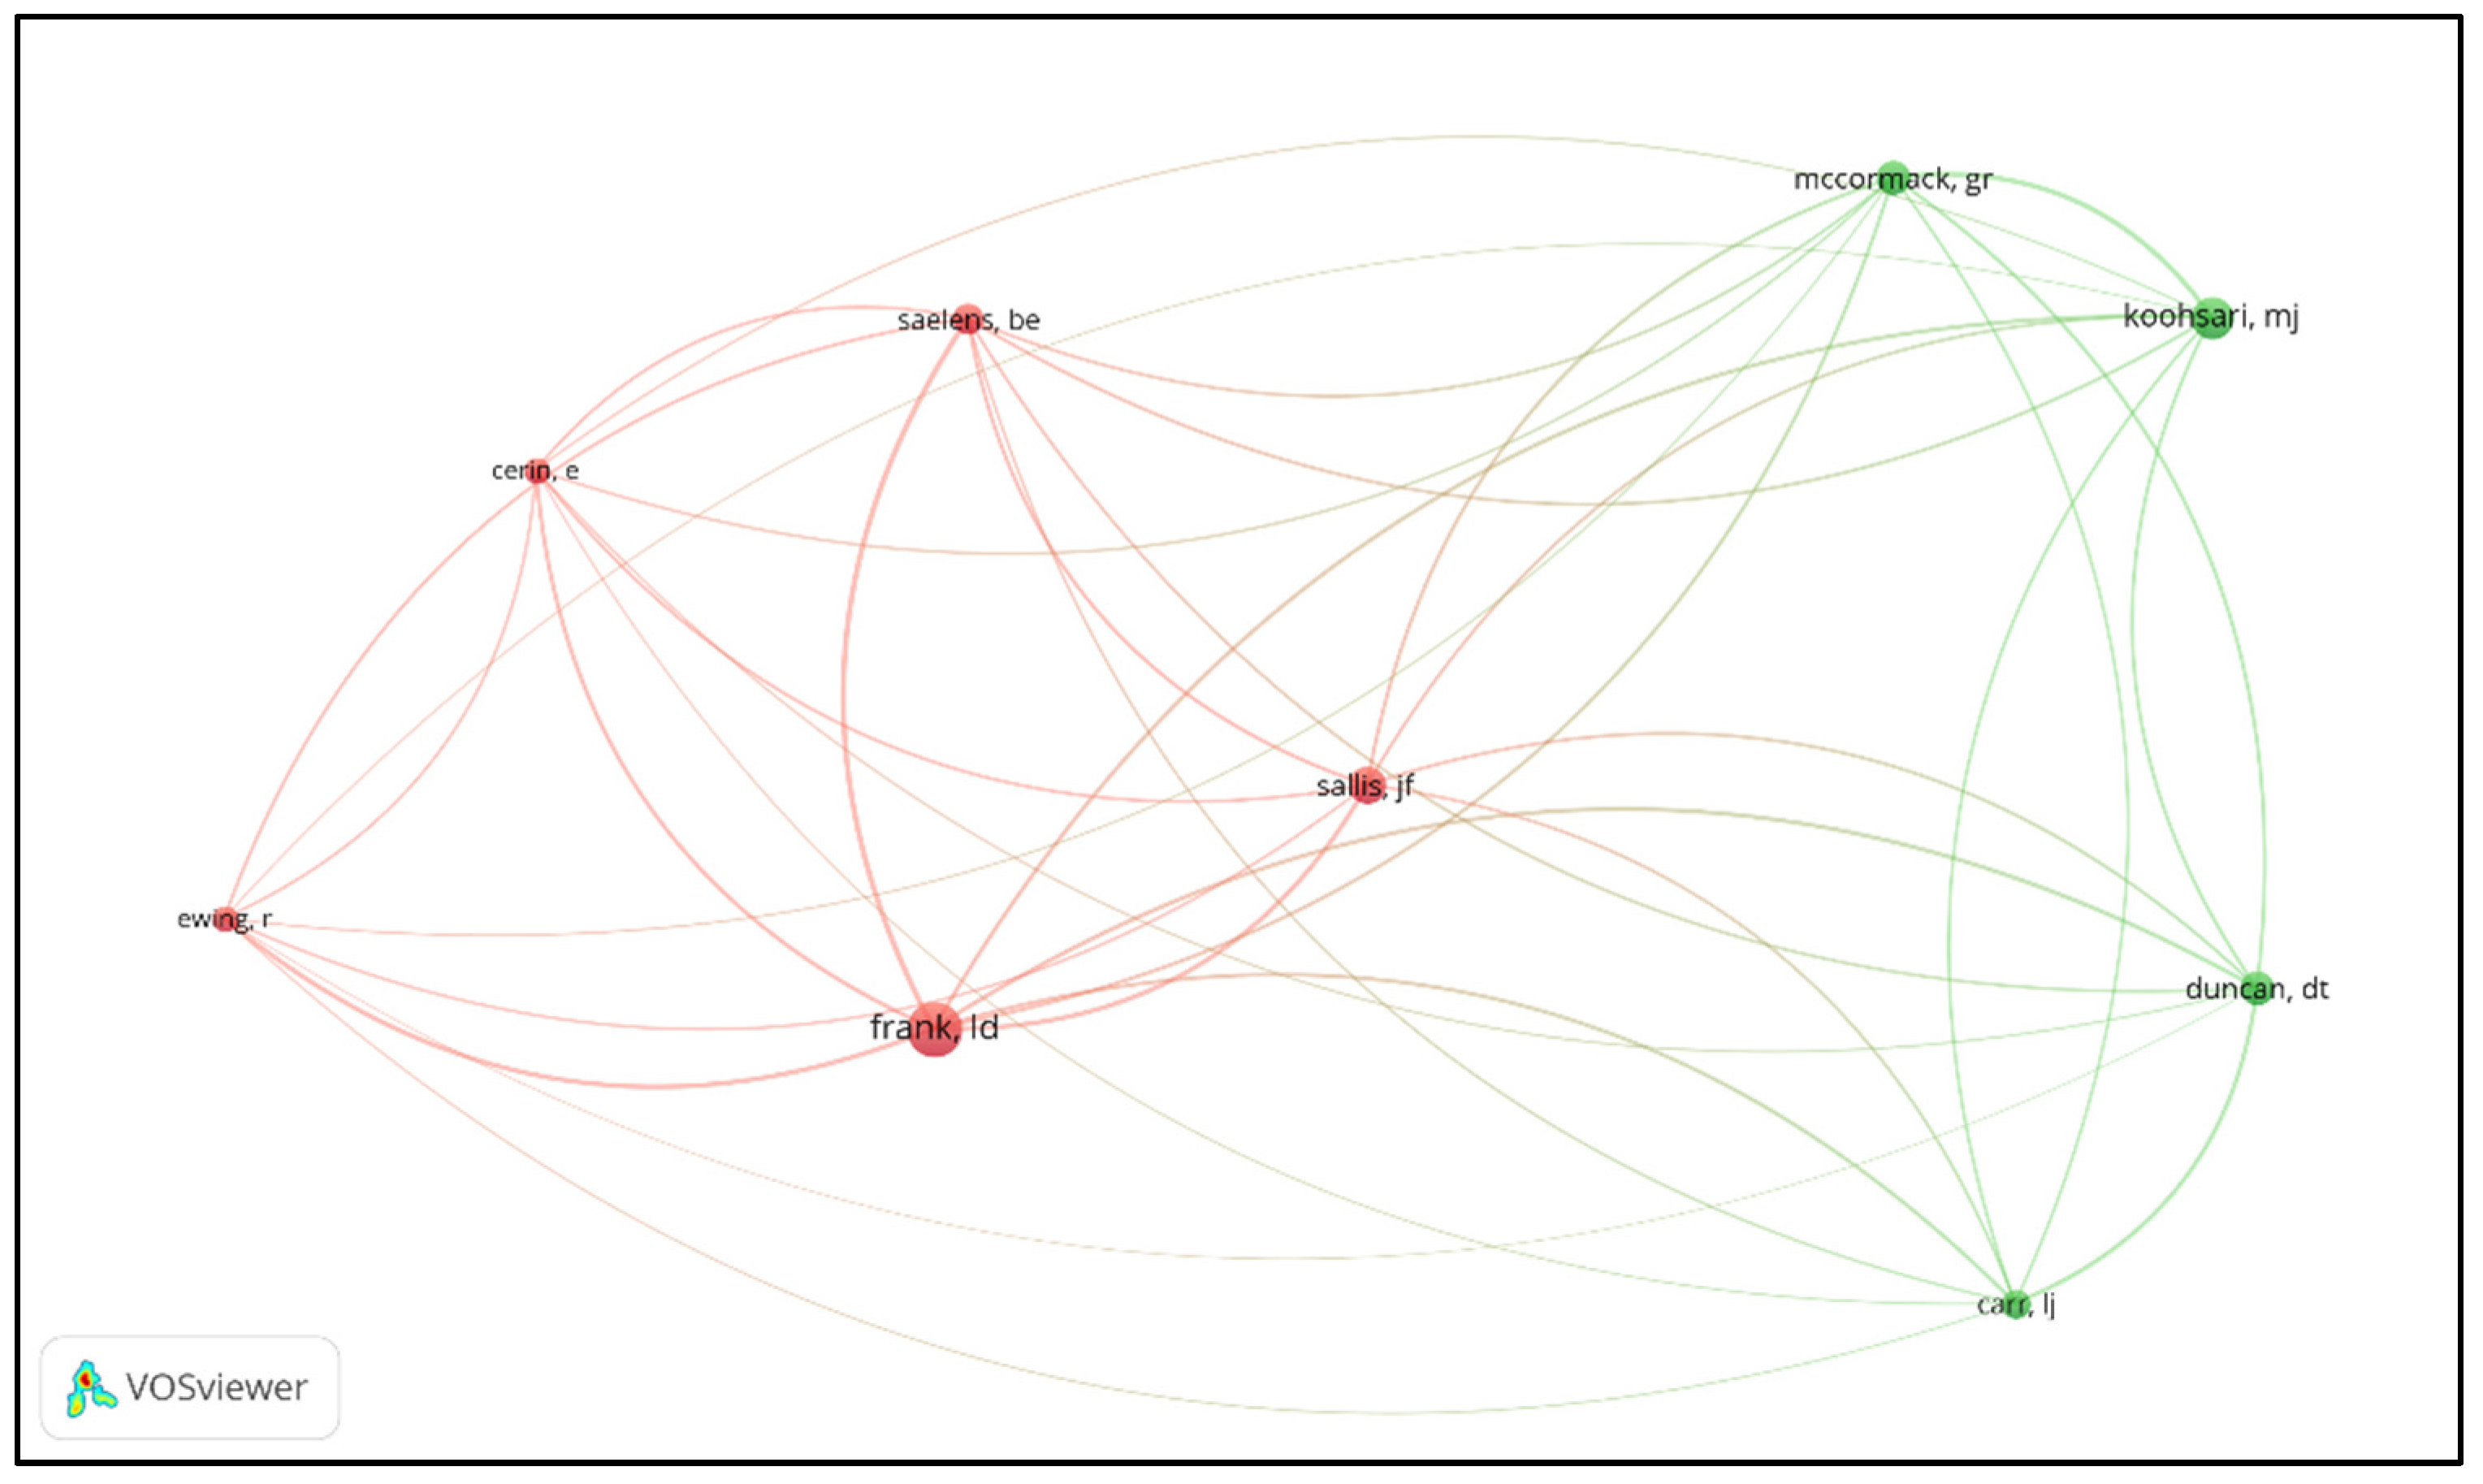
For author citation analysis, we selected only authors that had at least 2 documents published and one citation. As well, we added time as a dimension of analysis. Figure 13 displays the map obtained. We can see that, as previously observed, Gavin R. McCormack and Mohammad Javad Koohsari are the two first authors with the most influence in recent walkability indicator literature and bridge the work from more recent authors (yellow colored on the edges of the network).
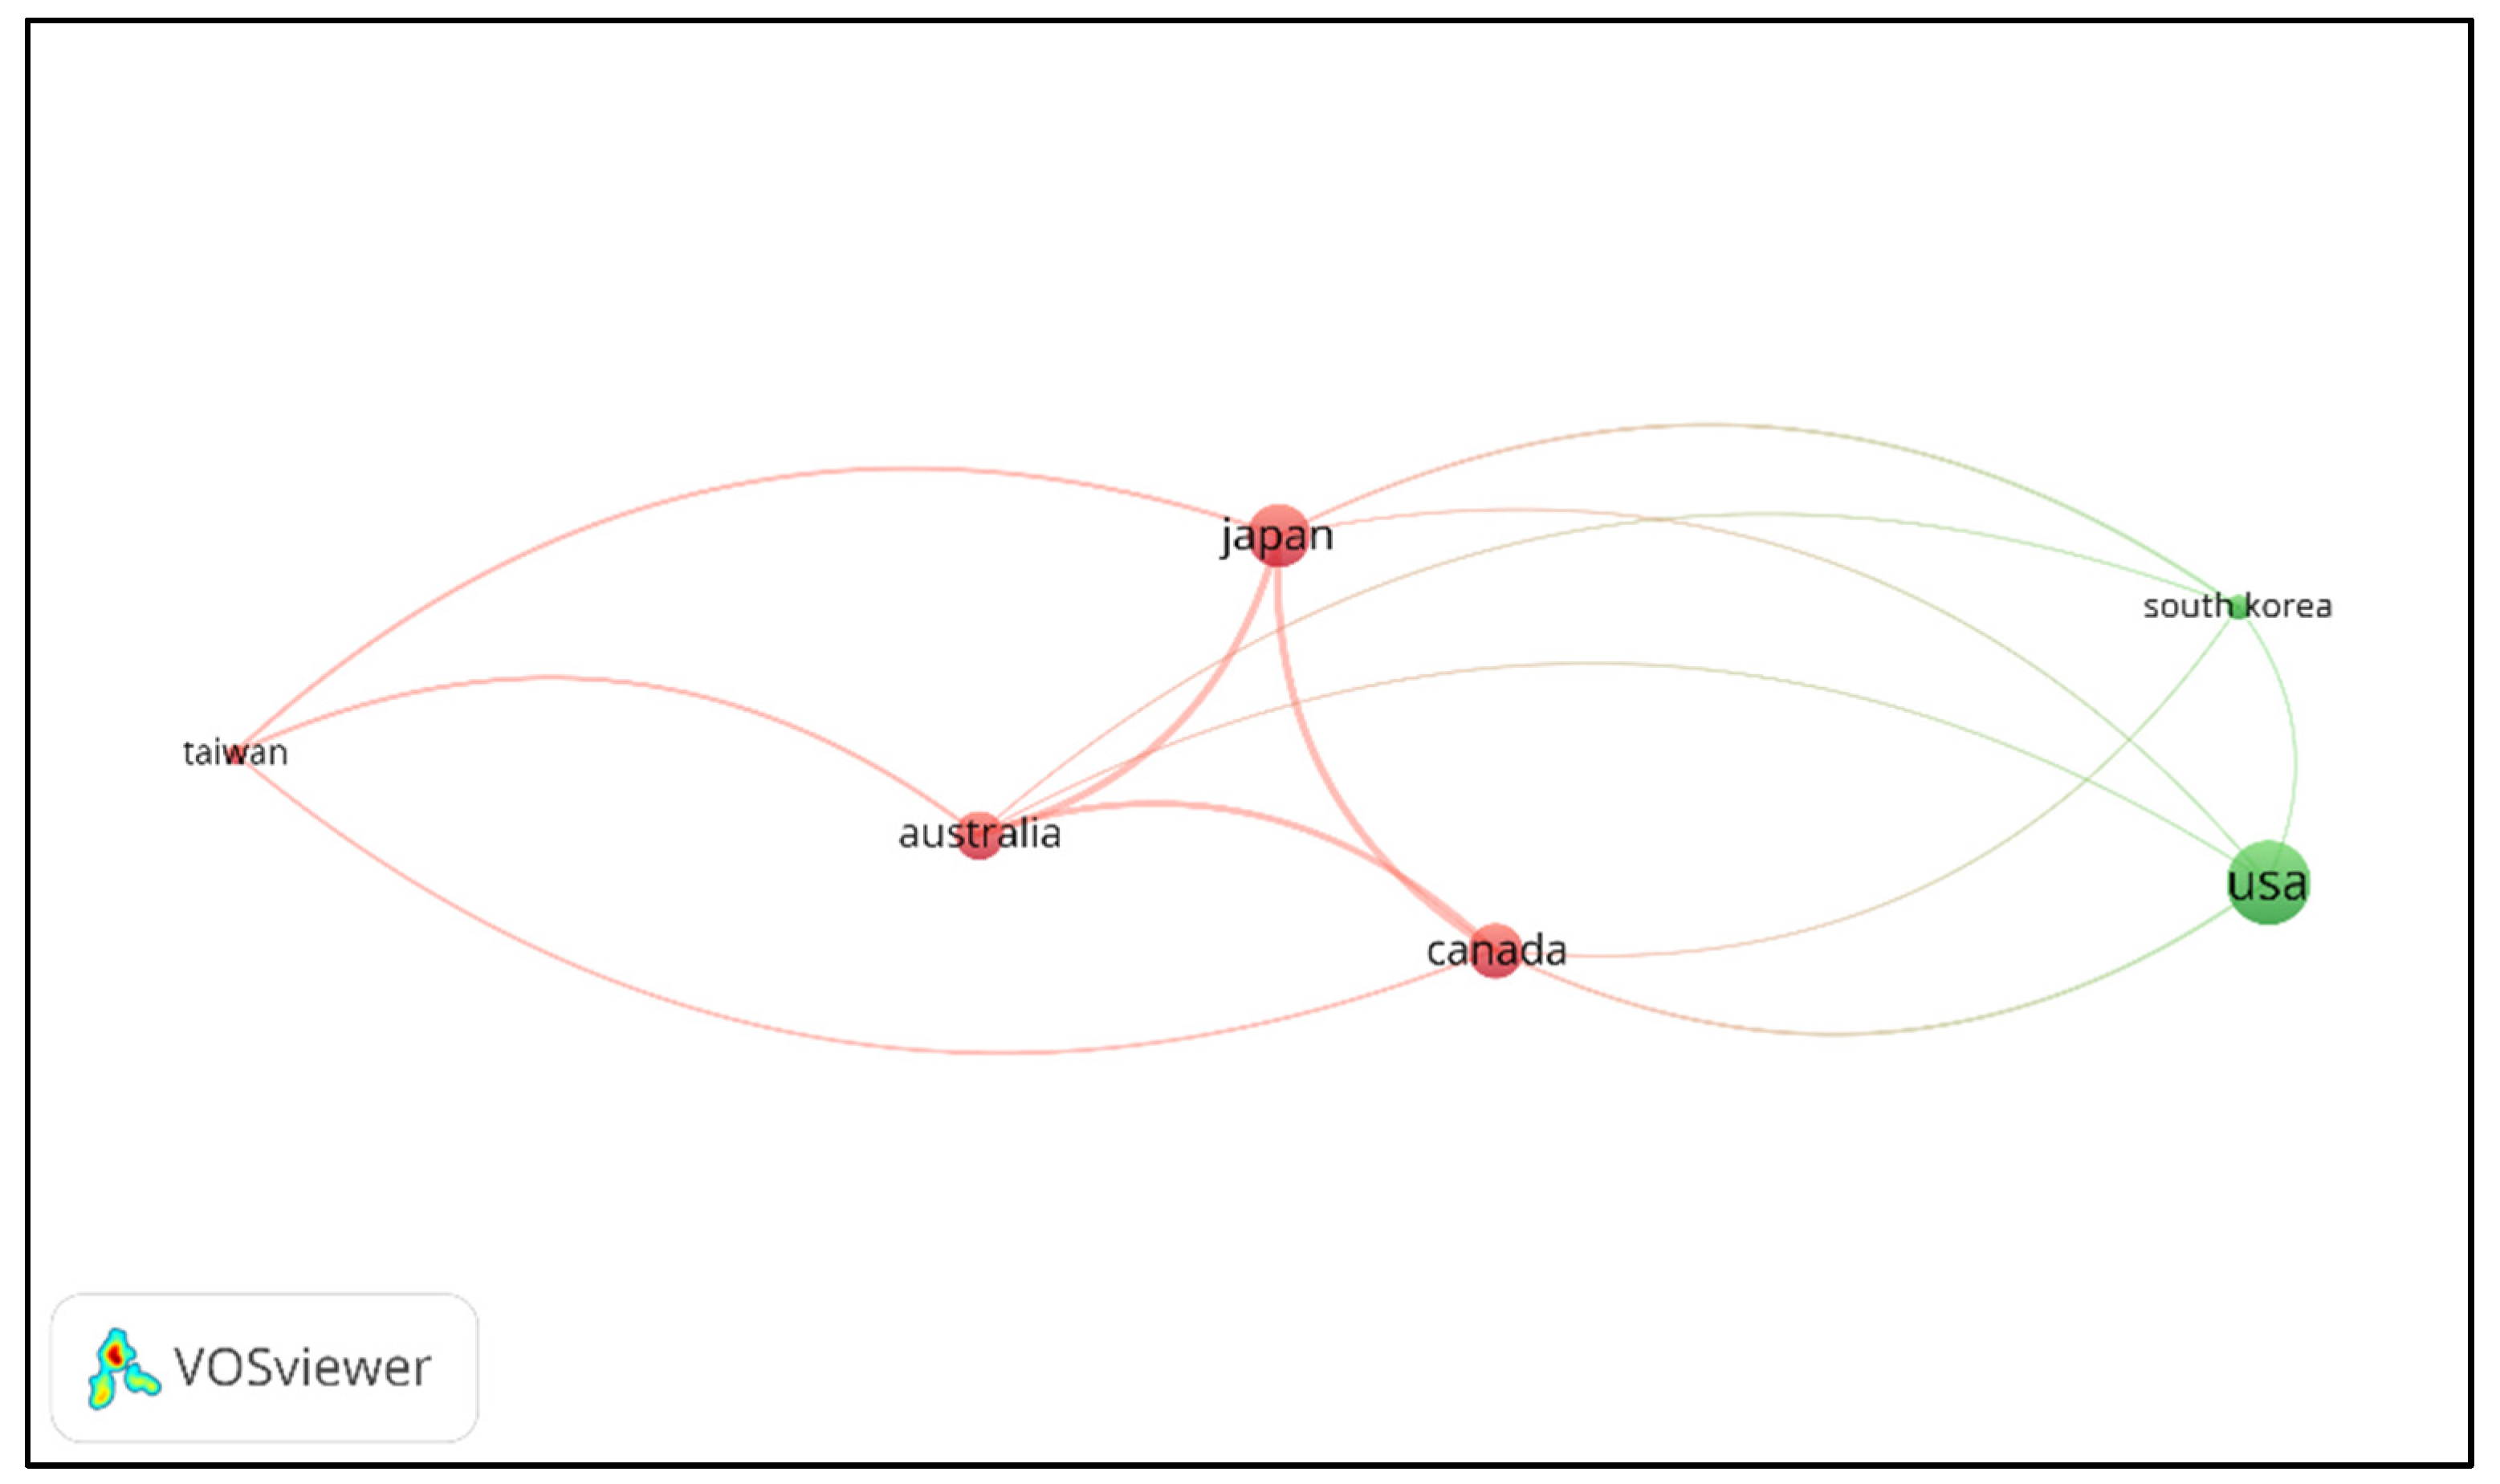
Country citation analysis revealed two main clusters (see Figure 14). On the left, red cluster countries’ works relate, in general, to the correlation between walkability and health, active commuting and the environment. On the right, the green cluster is composed by the USA and South Korea. Studies from these countries also cover the relationship between walkability and socio-demographic phenomena, like crime, income, ethnicity differences, or real estate prices.
Furthermore, we perform a co-citation analysis, in which the number of documents that are cited together by two nodes is evaluated, and a link between two nodes represents one document that was cited by the two. This type of analysis allows to access what are the most influential works and authors for the latest developments on a topic. We filtered the analysis for documents that received 10 or more citations and authors that received 20 or more citations.
From Figure 15, the most influential author is Frank D. Lawrence, with a total of 3 papers cited, released between 2005 and 2010. In terms of documents (Figure 16), the node with the greatest size, and thus the most popular among recent walkability indicator studies, is Duncan et al.’s work [61], which validates the Walk Score® [62] for estimating neighborhood walkability in 4 USA cities.
3.3. Research Questions
3.3.1. RQ1: What Are the Main Subjects Investigated in Recent Literature on Walkability Indicators?
After investigating and evaluating the recent literature on walkability indicators, based on the research issues being addressed we divided the documents into the 4 main categories: Public Health, Transportation, Socio-economic and Demographics, and Environment. On the subject of Public Health, most works study the association between neighborhood walkability and physical activity [26,27,28,63,64,65,66]. Another topic of general interest for Public Health is people’s physical health, manifested through obesity, overweight and frailty, and generally calculated using the Body Mass Index (BMI) or Waist Circumference (WC) [67,68,69,70,71]. Other studies focus on the correlation between walkability and prevalence of diseases or health complications, such as cancer [72,73], hypertension [30,74], cardiovascular problems [29,75,76], diabetes [32] and dementia [31]. Other topics addressed under this subject include sedentarism [77,78,79] and overall well-being [80].
On the subject of Transportation, most works evaluate the relationship between walkability and walking as a means of active transportation, and can be divided into general active transportation [34,81,82,83], school commuting [35,84,85], and pedestrian comfort and safety [38,86]. One work also addresses the role of walkability in influencing travel choices for people with disabilities [87].
Regarding Socio-economic and Demographics, topics of interest vary. Walkability has been associated with criminality, in the form of street crimes [37,88,89] and property incidents [40], housing availability and price [90,91], neighborhood residents’ social capital [92] and economic differences [93], personality traits [94], incidence of care insurance needs [95], as well as membership costs and service availability in fitness centers [96].
3.3.2. RQ2: What Are the Most Used Walkability Indicators in Recent Literature?
Most studies analyzed resort to well-established indicators from the literature on walkability, either using already known values of an indicator, for areas where previous work with that indicator was developed, or employing the indicator’s formulas and methodologies, sometimes with small adjustments, to calculate walkability for new areas of analysis.
In this context, Walk Score® (WS) [62] is the most commonly used indicator in the recent literature on walkability indicators. WS is a patented system available publicly in a website (https://www.walkscore.com/, accessed on 15 July 2022) and it is used to calculate the number of nearby walkable destinations or amenities [61]. It uses data retrieved from sources such as Google, Open Street Map, or the U.S. Census, and, for each address, analyses different routes to nearby amenities via a geographically based algorithm. The system considers 13 categories of amenities, namely grocery stores, coffee shops, restaurants, bars, movie theaters, schools, parks, libraries, book stores, fitness centers, drug stores, hardware stores, clothing and music stores [61]. For each address, it awards points based on the distance to the amenities in each category. It gives maximum points for amenities within a 5-minute walk (0.25 miles or 400 meters) and uses a decay function to give points to more distant amenities, with no points given after a 30-minute walk [62]. Furthermore, it also considers street friendliness metrics, such as block length and intersection density. Then, equally weighted category points are summed and normalized to yield a score from 0–100.
Currently, WS website provides walkability values for North America (USA and Canada) only, but due to its easy reproducibility it has been employed and validated by researchers in different contexts [61,99,100,101,102,103]. In this review, we found a total of 30 studies (47% of the sample) resorting to WS. In terms of countries where the WS was employed, 10 studies were done in the USA [29,38,67,73,86,88,89,90,93,104], 8 in Japan [78,79,81,92,94,95,105,106], 3 in South Korea [34,82,91], 3 in Canada [65,66,107], and 2 in Australia [31,97], while the following countries have only one study that used WS: China [30], Germany [108], Italy [68], Spain [96], and Taiwan [109]. Regarding the most common research topics, in recent years WS was employed more commonly in Public Health [29,30,31,66,67,68,73,78,79,105,107,109,110] and Socio-economic and Demographics [88,89,90,91,92,93,94,95,96,106], whereas it was used 4 times under the Transport subject [32,81,82,105], and one study focused on the Environment [97]. The only study covering the association between walkability and COVID-19 infections also used WS [104]. Additionally, 2 other studies used Street Smart Walk Score [40,74], a variation of the original WS that performs a distance decay and destination weighting calibration.
The second most used walkability indicator, with a total of 9 works (15% of the sample), is Frank et al.’s Walkability Index (WI) [59]. The WI was initially proposed to link objectively measured physical activity with urban form. The indicator’s formula consists of a weighted sum of z-scores for the variables land-use mix (evenness of distribution of square footage of residential, commercial, and office development), net residential density (number of residential units per residential acre), and street connectivity (number of intersections per square kilometer). The WI gives importance to the variable land-use mix, by multiplying its z-score by 2 in the indicator’s equation.
Since its initial development, the WI has been employed and validated in other studies [25,111]. From the documents analyzed in this review, the WI was employed 3 times in Japan [5,112,113], 2 in the USA [64,87], and once in China [76], New Zealand [84], Portugal [32], Spain [26] and Scotland [26]. As for the research areas where the WI is used, 5 documents are under the subject of Public Health [24,26,30,64,76], 3 concern Transportation [84,87,112], one comes under Socio-economic and Demographics [113] and one under the Environment category [5].
Besides the WS and the WI, other indicators from the literature that were employed in the works reviewed are: Neighborhood Environment Walkability Scale (NEWS) [13], applied in Canada, China and Japan under the Public Health category [27,70,80,114,115]; the Canadian Active Living Environments (Can-ALE) [116], applied in Canada for Public Health [117] and Transportation [35]; and the Built Environment and Health Neighborhood Walkability Index [118] and National Walkability Index [119], both applied in the USA under the subject of Public Health [83,117].
Fewer works developed and implemented their own indicators. The new indicators that were identified during the research are: the Dutch Walkability Index [120] and the Japanese Walkability Index [112], both falling under the Transportation category; the Walkability Index for London [63], used to measure the relationship between green spaces and physical activity; and the School Walkability Index [121] applied to understand walkability associations with active commuting to school (ACS).
3.3.3. RQ3: What Are the Main Findings from Recent Literature?
To better understand the results of the studies reviewed, we went through the main findings by subject category. On Public Health, most findings indicate a positive or neutral impact of walkability in contributing to people’s physical activity and health. Studies that associate walkability indicators with the level of physical activity of a community tend to agree that there are built environment characteristics that benefit walking and sports practicing, and thus, that walkability is positively related with moderate-to-vigorous physical activity [26,27,42,83,115]. On the contrary, some works did not find any link between the two [28,66] and others reported a positive association between walkability and sedentary behavior [78,79]. Likewise, on the subtopic of physical health, most studies have found walkability to be negatively linked with being overweight and obesity [67,69,70,71,72,105], while fewer studies did not find any association between walkability and physical health [29,107]. In general, walkability was reported as being negatively related with diseases, chronical health conditions and mortality [30,73,74,75,109,122] and positively associated with mental wellbeing [80]. This positive association between walkability and health does not seem to be significant for older adults (more than 65 years old) [122].
On the subject of Transportation, recent research points to a positive association between walkability and walking or active commuting [34,35,82,83,112,120,121], although with differences at the level of the built environment characteristics that contribute to active commuting, depending on the level of urbanization of a region and age groupA. For example, in children commuting intersection density, number of four-way intersections, and residential density were positively related to ACS in urban participants, but negatively in rural participants [85]. In Italy, urban children attended schools located in neighborhoods with a higher Walk Score® than rural children [68]. Furthermore, associations with minutes of non-discretionary walking and walkability were stronger in rural areas, and in middle-aged (36–49 years) compared to young (18–35 years old) and older adults (50–65 years old) [120]. On the contrary, a study found that US adults living in more walkable areas report more transportation and leisure walking, especially among urban areas [83], and another in Japan [112] notes a stronger association between walkability and step count in older adults (65 years old or older). A study also found that higher levels of walkability are positively associated with transit use of individuals with disabilities and that enhancing neighborhood walkability has a much larger effect on individuals with disabilities than on other groups. [87].
Regarding the Socio-economic and Demographics topic, a variety of results were reported: there was not an association between walkability and social capital [92]; neighborhoods with high income tend to have lower walkability [93]; areas with more subsidized housing have less walkability [90]; one study notes that housing prices are positively correlated with walkability in areas with low housing prices, whereas no significant association was observed in areas with high housing prices [91], while another points to a general positive correlation between walkability and real estate prices [123]; fitness centers are less expensive and have wide opening hours in areas with higher walkability [96]; walkability has a strong positive linear effect on robbery rates and predatory violence, particularly in low-income neighborhoods [37,88,89]; walkability did not affect long-term care insurance service needs [95]; and people tend to be more extrovert in neighborhoods with higher walkability [94].
Lastly, on the topic of the Environment, higher levels of walkability are related with neutral thermal sensation, while a warm thermal sensation is negatively related with walkability [98]. In Sydney, a study found that walkability and greenness (presence of natural areas) were negatively related [97]. Furthermore, walkability negatively affects the Ecological Footprint to Biocapacity (EF/BC) ratio in urban residential areas with a lack of urban infrastructure, but it can have a strong positive effect on the EF/BC ratio in the more urbanized areas [5].
3.3.4. RQ4: How Do These Findings Compare to Those before the COVID-19 Pandemic?
To compare recent and previous findings, we analyzed literature review studies released before 2020. In this regard, the work by Wang and Yang, 2019 [22] is one the most complete on this topic. The authors analyzed the period between 2008 to mid-2018, retrieving a total of 136 documents on the topic of walkability indicators. In 2016, a total of 21 papers were retrieved and 22 were identified in 2017. By mid-2018, seven works had already been published, and the authors expected that the total number for that year would resemble the previous two. Overall, the number of documents on these topics presents a continual growth pattern since 2008, which had only four documents. These values are in line with what we display in Figure 2, in which 2020 had 20 documents, 2021 had 26 and, by mid-2022, 14 documents have already been published–supporting the hypothesis that there is a continual increase in popularity of the subject of walkability. The work of Wang and Yang, 2019 [22] mentions that the American Journal of Preventive Medicine and the International Journal of Behavioral Nutrition and Physical Activity were the two prominent journals. This last one is also present in the top 5 journals for the post pandemic outbreak period. Just as in the years analyzed in this work, the USA is the country with more documents, and the WS and WI the two most used indicators. J.F. Sallis is the author who made the greatest contribution on research on walkability, with a total of 18 published papers and 14 co-authorships from 2008 to 2018. The author was also found to play an important role in recent literature, as per Figure 15 co-citation analysis, but it is Frank D. Lawrence who is the researcher with the most influence in recent works on the topic. In terms of main findings, the review study by Wang and Yang, 2019 [22] states that studies did not reach a clear agreement regarding whether higher neighborhood walkability leads to more physical activity, although some studies proved that there is a positive relation between the two. This is contrary to the overall findings of the current study, in which there is a general agreement regarding the positive impact of walkability on physical activity. Despite this, the authors point that high-income countries demonstrate that there is a positive relationship between walkability and physical activity among adults, which is particularly strong in older adults, has we have also seen in RQ3. Regarding the impact of walkability in health, in general previous studies also agree that built environment attributes that lead to high walkability are associated with lower levels of obesity and BMI. Regarding the impact of walkability factors in the environment, the authors mention one work by James, Hart, and Laden (2015), who demonstrated that neighbourhood walkability was positively correlated with modeled concentrations of the air pollutant PM2.5.
Another literature review study from 2019 addressed the topic of walkability factors associated with older adults’ walking behaviors [21]. A total of 70 studies were analyzed, and most of those articles were published in North America (45.7%). Again, the WS was found to be the most used indicator across the literature. The authors also found a strong relationship between the walking behaviors of older adults and neighborhood environment characteristics, and that walkability, as well as urbanization, are strongly associated with total and transport walking among older adults.
In both reviews it is mentioned that, just like in recent works, data for walking and health metrics are mostly objectively based on accelerometry and/or subjectively based on self-reported physical activity from questionnaire results.
3.3.5. RQ5: How Do Recent Works on Walkability Indicators Reflect the Topic of the COVID-19 Pandemic?
The COVID-19 pandemic brought more awareness to the general public about the topic of walkability [42]. People that commuted, and for whom private transportation was not an option and public transportation could be a possible vehicle of infection [48,124,125], resorted more often to active modes of transportation, like walking and cycling [45,46,47,48,49]. Hence, it would be expected that this would prompt a reaction on the scientific community to analyze, on one hand, the impact of the pandemic in choices of mobility and, on the other hand, the link between urban design and COVID-19 infection rates, the latter evaluated using walkability indicators. Nevertheless, from the final 64 works analyzed, only one study by Lima et al. [104] used the WS to measure the extent to which walkability was related with the spread of COVID-19. The study focused on the early stages of the pandemic in 93 United States counties, concluding that walkability and population density were positively correlated with COVID-19 infection rate. When extending the works analyzed to incorporate studies from the pre-screening phase, we found another work relating walkability and infection rate, by Wang et al. [126]. In this case, while the study does not employ a walkability indicator, it measures walkability through different aspects of the built environment, and it concluded, in opposition to Lima et al. [104], that walkability, biking services and higher socio-economic status were associated with lower infection during the peak of the COVID-19 pandemic in Massachusetts, Texas.
Alternatively, the impact of COVID-19 on walkability indicator studies can also be measured indirectly, based on the amount of work developed prior and post pandemic. Because people were and still are spending more time at their residential area [50,51], they are giving more importance to how the built environment and urban design affects their mobility and overall quality of life [42]. Consequently, this can also result in a raising interest from investigators. We ran our initial search query in WoS with the timeframe filter removed. The yearly pattern of documents published reveals a continual growth of publications, from 2013 to 2022. While it is true that this pattern precedes the pandemic, from 2017 to 2019 there was a 17% growth on the number of works related with walkability indicators, whereas from 2019 to 2021 that growth rate doubled to 33%. Although there could be many reasons motivating this increased interest in walkability, indirect effects from the COVID-19 pandemic are certainly possible causes.
3.3.6. RQ6: What Are the Main Gaps Identified in the Reviewed Literature?
From the previous research questions (RQ4), there is a lack of studies linking walkability indicators to COVID-19, while existing research is contradictory. As well, the relationship between walkability indicators and environmental metrics is not thoroughly analyzed. From the three works that studied this topic, only one focused on the environmental impact of walkability. It concludes that the relationship between walkability and EF/BC ratio is negative in urban residential areas with a lack of urban infrastructure, but it can have a strong positive effect on more urbanized areas [5]. Hence, there is a lot of space for further research on this topic. Studies could address, for example, the relationship between walkability and pollution, using NO2 as the variable of analysis, since it has been shown to be positively related with automobile traffic [52].
Moreover, most works rely on traditional methods to obtain the data for the phenomena being associated with walkability indicators. Across the different subjects of analysis, data collection for physical activity, health condition or travelling patterns is mostly done through the application of questionnaires and surveys [26,27,30,42,63,71,77,79,81,82,83,92,107,109,120,122], or pedometers/accelerometers [26,28,66,112]. The collection of this data is costly, not easily updated and difficult to scale [127]. This can lead to limitations when evaluating walkability associations in large urban environments. Moreover, the evaluation data used in recent literature was, in general, collected prior to the COVID-19 outbreak, since the data collection processes mentioned before are time consuming and difficult to reproduce for new population samples. From the literature analyzed, only five studies rely on data collected between 2020 and 2021 [68,76,97,104,115]. Some of the studies rely on longitudinal data collections methods, that require years of research, data treatment and analysis. For instance Lang et al. [67] resort to the Reasons for Geographic And Racial Differences in Stroke study, Martins et al. [70] use the Nagoya Longitudinal study and Matsumoto et al. [106] resort to the Keeping Active across Generations Uniting the Youth and the Aged study. All other studies rely on data collected between 2010 and 2019, for example [37,65,73,79,80,93,112]. This is a limiting issue for a thorough analysis of the pandemic direct impact on walkability, as the data collected on most studies does not reflect any COVID-19 influence.
To face this issue, big data, and information and communication technologies emerge as advantageous tools for the quantification and collection of relevant data on mobility, health and sustainability, helping to face challenges in the provision of public services and infrastructure [128]. For example, the widespread use of mobile devices and installation of environmental sensors can allow for the collection of large-scale data on human mobility behaviors [129] and air quality [130], respectively. These data can then provide a basis for investigating the associations between walkability indicators and human phenomena, allowing for faster data collection and update, which is especially crucial in critical times like the period under analysis.
4. Conclusions, Limitations and Future Work
We performed a systematic literature review of works that employed walkability indicators to uncover associations between walkability and different phenomena, in the aftermath of the COVID-19 pandemic. We resorted to the PRISMA methodology to search, evaluate, and select, these studies. Then, exploratory and bibliometric analysis were conducted. Studies on walkability indicators have increased in the aftermath of the pandemic, almost doubling the growth rate of the three years prior to the outbreak of the virus. Although studies on this topic were performed across the globe, North America (USA and Canada) and Japan are the prominent regions. The bibliometric analysis revealed that Gavin R. McCormack and Mohammad Javad Koohsari were the most influential researchers regarding works done in recent years, whereas Frank D. Lawrence is the overall most cited author. We found that the main subjects addressed in the recent literature are Public Health (52%), Transportation (23%), Socio-economic and Demographics (20%), and the Environment (5%). Most studies resort to well-known indicators, predominantly to Walk Score® (47%), but also to Frank’s Walkability Index (15%), while other works develop and apply new indicators (15%).
Findings point to a positive association between walkability and physical activity and fitness, and a negative correlation with health problems. Moreover, walkability is positively associated with active mobility and real estate prices. Only one document linked walkability indicators with COVID-19, concluding that walkability and population density were positively correlated with COVID-19 infection rate. On the Environment subject, the literature is also scarce and unclear. In general, most works rely on traditional methods to obtain the dataset for the phenomena being associated with walkability indicators. As such, there is room for the use of more modern and scalable methods of data collection, such as mobile phone GPS and environmental sensors. Furthermore, post COVID-19 works are closely aligned with previous ones, in terms of topics of research, methods of gathering evaluation data, as well as results and conclusions.
As limitations, we must note that the period covered by this literature review is not long (only two years and a half), and so it may not yet capture the long-term impact that the COVID-19 pandemic had and continues having in people’s life. It is also the case that studies published after the outbreak of the pandemic might have been completed before the outbreak. To mitigate this issue, when possible, we checked if the submission date of the documents was, at minimum, during 2020. We must also mention that despite being judicious during the process of document selection, we cannot entirely assure that no relevant work has been missed.
For the future, we believe that studies aiming at evaluating the impact of walkability factors on physical activity, transportation, and overall mobility, should resort to more modern data collection methods that rely on GPS, mobile and sensor data, which tend to be highly scalable and efficient.
Our work should help researchers to understand the trends in studies employing walkability indicators, and we hope it can support and foment further research in this area.
Author Contributions
Conceptualization, B.J. and M.d.C.N.; methodology, B.J.; formal analysis, B.J.; writing—original draft preparation, B.J.; writing—review and editing, B.J. and M.d.C.N.; supervision, M.d.C.N.; project administration, M.d.C.N.; funding acquisition, M.d.C.N. All authors have read and agreed to the published version of the manuscript.
Funding
This research was funded by the Project C-TECH—Climate Driven Technologies for Low Carbon Cities, grant number POCI-01-0247-FEDER-045919 | LISBOA-01-0247-FEDER-045919, co-financed by the ERDF—European Regional Development Fund through the Operational Program for Competitiveness and Internationalization—COMPETE 2020, the Lisbon Portugal Regional Operational Program—LISBOA 2020 and by the Portuguese Foundation for Science and Technology—FCT under MIT Portugal Program. This work was also supported by Portuguese national funds through the Portuguese Foundation for Science and Technology—FCT under research grant FCT UIDB/04152/2020–Centro de Investigação em Gestão de Informação (MagIC).
Institutional Review Board Statement
Not applicable.
Informed Consent Statement
Not applicable.
Data Availability Statement
Not applicable.
Conflicts of Interest
The authors declare no conflict of interest. The funders had no role in the design of the study; in the collection, analyses, or interpretation of data; in the writing of the manuscript, or in the decision to publish the results.
Appendix A

Table A1.
Five most cited papers from Web of Science during the period from 2020 to 2022 (May), as of June 2022.
Table A1.
Five most cited papers from Web of Science during the period from 2020 to 2022 (May), as of June 2022.
| Title | Authors | Country | Indicator | Subject | Main Findings | Citations |
|---|---|---|---|---|---|---|
| The relationship between living in urban and rural areas of Scotland and children’s physical activity and sedentary levels: a country-wide cross-sectional analysis | McCrorie et al. [28] | Scotland | Variation of WI [59,60] | Children physical activity | Walkability was not associated with any outcome of physical activity. | 13 |
| Neighborhood Walkability and Housing Prices: A Correlation Study | Kim et al. [91] | South Kore | WS [62] | Real estate price | Housing prices positively correlated with the walkability score in areas with low housing prices, whereas no significant association was observed in areas with high housing prices. | 12 |
| Walking-friendly built environments and objectively measured physical function in older adults | Koohsari et al. [105] | Japan | WS [62] | Elderly Physical function | Walkability factors significantly associated with better physical function performance in elderly man. | 11 |
| Associations between the National Walkability Index and walking among US Adults-National Health Interview Survey, 2015 | Watson et al. [83] | USA | NWI [119] | Active mobility | Walkability was associated with a higher likelihood of walking, especially for transportation. | 10 |
| Different neighborhood walkability indexes for active commuting to school are necessary for urban and rural children and adolescents | Molina-Gárcia et al. [85] | Spain | z Residential density + z Distance to school +z No. traffic lanes + z Intersection density + z Positive Streetscape characteristic | Active commuting to school (ACS) | Intersection density, number of four-way intersections, and residential density were positively related to ACS in urban participants, but negatively in rural participants. | 8 |
| Effect of Walkability on Urban Sustainability in the Osaka Metropolitan Fringe Area | Kato [5] | Japan | WI [59] | Ecological Footprint to Biocapacity (EF/BC) ratio | Walkability negatively affects the EF/BC ratio in the sprawl neighborhood cluster, and has a strong positive effect on the EF/BC ratio in the old new-town neighborhood cluster. | 8 |
References
- Zafri, N.; Khan, A.; Jamal, S.; Alam, B. Impacts of the COVID-19 Pandemic on Active Travel Mode Choice in Bangladesh: A Study from the Perspective of Sustainability and New Normal Situation. Sustainability 2021, 13, 6975. [Google Scholar] [CrossRef]
- Bellizzi, M.G.; Forciniti, C.; Mazzulla, G. A Stated Preference Survey for Evaluating Young Pedestrians’ Preferences on Walkways. Sustainability 2021, 13, 12434. [Google Scholar] [CrossRef]
- Kang, C.-D. The effects of spatial accessibility and centrality to land use on walking in Seoul, Korea. Cities 2015, 46, 94–103. [Google Scholar] [CrossRef]
- Assembly, U.G. Transforming our world: The 2030 Agenda for Sustainable Development. A/RES/70/1. 2015. Available online: https://www.un.org/ga/search/view_doc.asp?symbol=A/RES/70/1&Lang=E (accessed on 20 July 2022).
- Kato, H. Effect of Walkability on Urban Sustainability in the Osaka Metropolitan Fringe Area. Sustainability 2020, 12, 9248. [Google Scholar] [CrossRef]
- World Health Organization, Regional Office for Europe. Towards More Physical Activity in Cities: Transforming Public Spaces to Promote Physical Activity—A Key Contributor to Achieving the Sustainable Development Goals in Europe; World Health Organization. Regional Office for Europe: København, Denmark, 2018. [Google Scholar]
- Macioszek, E.; Karami, A.; Farzin, I.; Abbasi, M.; Mamdoohi, A.R.; Piccioni, C. The Effect of Distance Intervals on Walking Likelihood in Different Trip Purposes. Sustainability 2022, 14, 3406. [Google Scholar] [CrossRef]
- Hall, C.M.; Ram, Y. Walk score® and its potential contribution to the study of active transport and walkability: A critical and systematic review. Transp. Res. Part D Transp. Environ. 2018, 61, 310–324. [Google Scholar] [CrossRef]
- Talen, E.; Koschinsky, J. The Walkable Neighborhood: A Literature Review. Int. J. Sustain. Land Use Urban Plan. 2013, 1, 211. [Google Scholar] [CrossRef]
- Forsyth, A. What is a walkable place? The walkability debate in urban design. Urban Des. Int. 2015, 20, 274–292. [Google Scholar] [CrossRef]
- Kang, C.-D. The S + 5Ds: Spatial access to pedestrian environments and walking in Seoul, Korea. Cities 2018, 77, 130–141. [Google Scholar] [CrossRef]
- Sallis, J.F.; Bowles, H.R.; Bauman, A.; Ainsworth, B.E.; Bull, F.C.; Craig, C.L.; Sjöström, M.; De Bourdeaudhuij, I.; Lefevre, J.; Matsudo, V.; et al. Neighborhood Environments and Physical Activity Among Adults in 11 Countries. Am. J. Prev. Med. 2009, 36, 484–490. [Google Scholar] [CrossRef] [Green Version]
- Saelens, B.E.; Sallis, J.F.; Black, J.B.; Chen, D. Neighborhood-Based Differences in Physical Activity: An Environment Scale Evaluation. Am. J. Public Health 2003, 93, 1552–1558. [Google Scholar] [CrossRef]
- Leyden, K.M. Social Capital and the Built Environment: The Importance of Walkable Neighborhoods. Am. J. Public Health 2003, 93, 1546–1551. [Google Scholar] [CrossRef]
- Sallis, J.F.; Floyd, M.F.; Rodríguez, D.A.; Saelens, B.E. Role of Built Environments in Physical Activity, Obesity, and Cardiovascular Disease. Circulation 2012, 125, 729–737. [Google Scholar] [CrossRef]
- Rogers, S.H.; Halstead, J.M.; Gardner, K.; Carlson, C. Examining Walkability and Social Capital as Indicators of Quality of Life at the Municipal and Neighborhood Scales. Appl. Res. Qual. Life 2010, 6, 201–213. [Google Scholar] [CrossRef]
- Saelens, B.E.; Handy, S.L. Built Environment Correlates of Walking. Med. Sci. Sports Exerc. 2008, 40, S550–S566. [Google Scholar] [CrossRef]
- Fonseca, F.; Ribeiro, P.J.G.; Conticelli, E.; Jabbari, M.; Papageorgiou, G.; Tondelli, S.; Ramos, R.A.R. Built environment attributes and their influence on walkability. Int. J. Sustain. Transp. 2021, 16, 660–679. [Google Scholar] [CrossRef]
- Jabbar, M.; Yusoff, M.M.; Shafie, A. Assessing the role of urban green spaces for human well-being: A systematic review. GeoJournal 2021, 1–19. [Google Scholar] [CrossRef]
- Rachele, J.N.; Sugiyama, T.; Davies, S.; Loh, V.H.; Turrell, G.; Carver, A.; Cerin, E. Neighbourhood built environment and physical function among mid-to-older aged adults: A systematic review. Health Place 2019, 58, 102137. [Google Scholar] [CrossRef]
- Yun, H.Y. Environmental Factors Associated with Older Adult’s Walking Behaviors: A Systematic Review of Quantitative Studies. Sustainability 2019, 11, 3253. [Google Scholar] [CrossRef]
- Wang, H.; Yang, Y. Neighbourhood walkability: A review and bibliometric analysis. Cities 2019, 93, 43–61. [Google Scholar] [CrossRef]
- Shields, R.; da Silva, E.J.G.; e Lima, T.L.; Osorio, N. Walkability: A review of trends. J. Urban. Int. Res. Placemaking Urban Sustain. 2021, 1–23. [Google Scholar] [CrossRef]
- Brownson, R.C.; Hoehner, C.M.; Day, K.; Forsyth, A.; Sallis, J.F. Measuring the Built Environment for Physical Activity: State of the Science. Am. J. Prev. Med. 2009, 36, S99–S123. [Google Scholar] [CrossRef]
- Frank, L.D.; Sallis, J.F.; Conway, T.L.; Chapman, J.E.; Saelens, B.E.; Bachman, W. Many Pathways from Land Use to Health: Associations between Neighborhood Walkability and Active Transportation, Body Mass Index, and Air Quality. J. Am. Plan. Assoc. 2006, 72, 75–87. [Google Scholar] [CrossRef]
- Colom, A.; Mavoa, S.; Ruiz, M.; Wärnberg, J.; Muncunill, J.; Konieczna, J.; Vich, G.; Barón-López, F.J.; Fitó, M.; Salas-Salvadó, J.; et al. Neighbourhood walkability and physical activity: Moderating role of a physical activity intervention in overweight and obese older adults with metabolic syndrome. Age Ageing 2020, 50, 963–968. [Google Scholar] [CrossRef]
- Sun, Y.; He, C.; Zhang, X.; Zhu, W. Association of Built Environment with Physical Activity and Physical Fitness in Men and Women Living inside the City Wall of Xi’an, China. Int. J. Environ. Res. Public Health 2020, 17, 4940. [Google Scholar] [CrossRef]
- McCrorie, P.; Mitchell, R.; Macdonald, L.; Jones, A.; Coombes, E.; Schipperijn, J.; Ellaway, A. The relationship between living in urban and rural areas of Scotland and children’s physical activity and sedentary levels: A country-wide cross-sectional analysis. BMC Public Health 2020, 20, 304–311. [Google Scholar] [CrossRef]
- Roy, B.; Hajduk, A.M.; Tsang, S.; Geda, M.; Riley, C.; Krumholz, H.M.; Chaudhry, S.I. The association of neighborhood walkability with health outcomes in older adults after acute myocardial infarction: The SILVER-AMI study. Prev. Med. Rep. 2021, 23, 101391. [Google Scholar] [CrossRef]
- Xie, H.; Wang, Q.; Zhou, X.; Yang, Y.; Mao, Y.; Zhang, X. Built Environment Factors Influencing Prevalence of Hypertension at Community Level in China: The Case of Wuhan. Sustainability 2021, 13, 5580. [Google Scholar] [CrossRef]
- Bagheri, N.; Mavoa, S.; Tabatabaei-Jafari, H.; Knibbs, L.D.; Coffee, N.T.; Salvador-Carulla, L.; Anstey, K.J. The Impact of Built and Social Environmental Characteristics on Diagnosed and Estimated Future Risk of Dementia. J. Alzheimer’s Dis. 2021, 84, 621–632. [Google Scholar] [CrossRef]
- Pereira, M.F.; Almendra, R.; Vale, D.S.; Santana, P. The relationship between built environment and health in the Lisbon Metropolitan area—Can walkability explain diabetes’ hospital admissions? J. Transp. Health 2020, 18, 100893. [Google Scholar] [CrossRef]
- Grasser, G.; Van Dyck, D.; Titze, S.; Stronegger, W. Objectively measured walkability and active transport and weight-related outcomes in adults: A systematic review. Int. J. Public Health 2012, 58, 615–625. [Google Scholar] [CrossRef]
- Kim, E.J.; Kim, J.; Kim, H. Does Environmental Walkability Matter? The Role of Walkable Environment in Active Commuting. Int. J. Environ. Res. Public Health 2020, 17, 1261. [Google Scholar] [CrossRef]
- Cottagiri, S.A.; De Groh, M.; Srugo, S.A.; Jiang, Y.; Hamilton, H.A.; Ross, N.A.; Villeneuve, P.J. Are school-based measures of walkability and greenness associated with modes of commuting to school? Findings from a student survey in Ontario, Canada. Can. J. Public Health 2021, 112, 331–341. [Google Scholar] [CrossRef] [PubMed]
- Budd, E.L.; Giuliani, N.R.; Kelly, N.R. Perceived Neighborhood Crime Safety Moderates the Association Between Racial Discrimination Stress and Chronic Health Conditions Among Hispanic/Latino Adults. Front. Public Health 2021, 9, 585157. [Google Scholar] [CrossRef]
- Wo, J.C.; Kim, Y.A. Unintended consequences? The effects of neighbourhood walkability on crime in nine US cities. Br. J. Criminol. 2022, azac011. [Google Scholar] [CrossRef]
- Yin, L.; Zhang, H. Building walkable and safe neighborhoods: Assessing the built environment characteristics for pedestrian safety in buffalo, NY. J. Transp. Health 2021, 22, 101129. [Google Scholar] [CrossRef]
- James, P.; Hart, J.E.; Laden, F. Neighborhood walkability and particulate air pollution in a nationwide cohort of women. Environ. Res. 2015, 142, 703–711. [Google Scholar] [CrossRef]
- Talen, E. Pedestrian Access as a Measure of Urban Quality. Plan. Pr. Res. 2002, 17, 257–278. [Google Scholar] [CrossRef]
- Ewing, R.; Handy, S. Measuring the Unmeasurable: Urban Design Qualities Related to Walkability. J. Urban Des. 2009, 14, 65–84. [Google Scholar] [CrossRef]
- Frank, L.D.; Appleyard, B.S.; Ulmer, J.M.; Chapman, J.E.; Fox, E.H. Comparing walkability methods: Creation of street smart walk score and efficacy of a code-based 3D walkability index. J. Transp. Health 2021, 21, 101005. [Google Scholar] [CrossRef]
- Borowska-Stefańska, M.; Kowalski, M.; Kurzyk, P.; Sahebgharani, A.; Wiśniewski, S. Spatiotemporal Changeability of the Load of the Urban Road Transport System under Permanent and Short-Term Legal and Administrative Retail Restrictions. Sustainability 2022, 14, 5137. [Google Scholar] [CrossRef]
- Campisi, T.; Basbas, S.; Skoufas, A.; Akgün, N.; Ticali, D.; Tesoriere, G. The Impact of COVID-19 Pandemic on the Resilience of Sustainable Mobility in Sicily. Sustainability 2020, 12, 8829. [Google Scholar] [CrossRef]
- Monterde-I-Bort, H.; Sucha, M.; Risser, R.; Honzickova, K. A European-Wide Study on the Effects of the COVID-19 Threat on Active Transport Modes. Sustainability 2022, 14, 3482. [Google Scholar] [CrossRef]
- Bergantino, A.S.; Intini, M.; Tangari, L. Influencing factors for potential bike-sharing users: An empirical analysis during the COVID-19 pandemic. Res. Transp. Econ. 2021, 86, 101028. [Google Scholar] [CrossRef]
- Bucsky, P. Modal share changes due to COVID-19: The case of Budapest. Transp. Res. Interdiscip. Perspect. 2020, 8, 100141. [Google Scholar] [CrossRef] [PubMed]
- Eisenmann, C.; Nobis, C.; Kolarova, V.; Lenz, B.; Winkler, C. Transport mode use during the COVID-19 lockdown period in Germany: The car became more important, public transport lost ground. Transp. Policy 2021, 103, 60–67. [Google Scholar] [CrossRef]
- Kamelifar, M.J.; Ranjbarnia, B.; Masoumi, H. The Determinants of Walking Behavior before and during COVID-19 in Middle-East and North Africa: Evidence from Tabriz, Iran. Sustainability 2022, 14, 3923. [Google Scholar] [CrossRef]
- Chan, H.F.; Skali, A.; Savage, D.A.; Stadelmann, D.; Torgler, B. Risk attitudes and human mobility during the COVID-19 pandemic. Sci. Rep. 2020, 10, 1–13. [Google Scholar] [CrossRef]
- De Vos, J. The effect of COVID-19 and subsequent social distancing on travel behavior. Transp. Res. Interdiscip. Perspect. 2020, 5, 100121. [Google Scholar] [CrossRef]
- Jardim, B.; Neto, M.D.C.; Alpalhão, N.; Calçada, P. The daily urban dynamic indicator: Gauging the urban dynamic in Porto during the COVID-19 pandemic. Sustain. Cities Soc. 2022, 79, 103714. [Google Scholar] [CrossRef]
- Moher, D.; Liberati, A.; Tetzlaff, J.; Altman, D.G.; the PRISMA Group. Preferred reporting items for systematic reviews and meta-analyses: The PRISMA statement. BMJ 2009, 339, b2535. [Google Scholar] [CrossRef] [PubMed]
- Vong, C.; Rita, P.; António, N. Health-Related Crises in Tourism Destination Management: A Systematic Review. Sustainability 2021, 13, 13738. [Google Scholar] [CrossRef]
- Web of Science. Available online: https://www.webofscience.com/wos/woscc/basic-search (accessed on 14 June 2022).
- Journal Citation Reports. Available online: https://jcr.clarivate.com/jcr/home (accessed on 14 June 2022).
- Donthu, N.; Kumar, S.; Mukherjee, D.; Pandey, N.; Lim, W.M. How to conduct a bibliometric analysis: An overview and guidelines. J. Bus. Res. 2021, 133, 285–296. [Google Scholar] [CrossRef]
- VOSviewer VOSviewer—Visualizing Scientific Landscapes. Available online: https://www.vosviewer.com// (accessed on 19 July 2021).
- Frank, L.D.; Schmid, T.L.; Sallis, J.F.; Chapman, J.; Saelens, B.E. Linking objectively measured physical activity with objectively measured urban form: Findings from SMARTRAQ. Am. J. Prev. Med. 2005, 28, 117–125. [Google Scholar] [CrossRef]
- Macdonald, L.; McCrorie, P.; Nicholls, N.; Ellaway, A. Walkability around primary schools and area deprivation across Scotland. BMC Public Health 2016, 16, 328. [Google Scholar] [CrossRef]
- Duncan, D.T.; Aldstadt, J.; Whalen, J.; Melly, S.J.; Gortmaker, S.L. Validation of Walk Score® for Estimating Neighborhood Walkability: An Analysis of Four US Metropolitan Areas. Int. J. Environ. Res. Public Health 2011, 8, 4160–4179. [Google Scholar] [CrossRef]
- Walk Score. Walk Score Methodology. Available online: https://www.walkscore.com/methodology.shtml (accessed on 12 July 2022).
- Roscoe, C.; Sheridan, C.; Geneshka, M.; Hodgson, S.; Vineis, P.; Gulliver, J.; Fecht, D. Green Walkability and Physical Activity in UK Biobank: A Cross-Sectional Analysis of Adults in Greater London. Int. J. Environ. Res. Public Health 2022, 19, 4247. [Google Scholar] [CrossRef]
- Wali, B.; Frank, L.D.; Young, D.R.; Saelens, B.E.; Meenan, R.T.; Dickerson, J.F.; Keast, E.M.; Kuntz, J.L.; Fortmann, S.P. Pathways from Built Environment to Health Care Costs: Linking Objectively Measured Built Environment with Physical Activity and Health Care Expenditures. Environ. Behav. 2022, 54, 747–782. [Google Scholar] [CrossRef]
- McCormack, G.R.; Ghoneim, D.; Frehlich, L.; Blackstaffe, A.; Turley, L.; Bracic, B. A 12-month natural experiment investigating the impacts of replacing a traditional bus service with bus rapid transit on physical activity. J. Transp. Health 2021, 22, 101239. [Google Scholar] [CrossRef]
- Consoli, A.; Nettel-Aguirre, A.; Spence, J.C.; McHugh, T.-L.; Mummery, K.; McCormack, G.R. Associations between objectively-measured and self-reported neighbourhood walkability on adherence and steps during an internet-delivered pedometer intervention. PLoS ONE 2020, 15, e0242999. [Google Scholar] [CrossRef]
- Lang, I.-M.; Antonakos, C.L.; Judd, S.E.; Colabianchi, N. A longitudinal examination of objective neighborhood walkability, body mass index, and waist circumference: The REasons for Geographic And Racial Differences in Stroke study. Int. J. Behav. Nutr. Phys. Act. 2022, 19, 1–15. [Google Scholar] [CrossRef] [PubMed]
- Gallotta, M.C.; Zimatore, G.; Falcioni, L.; Migliaccio, S.; Lanza, M.; Schena, F.; Biino, V.; Giuriato, M.; Bellafiore, M.; Palma, A.; et al. Influence of Geographical Area and Living Setting on Children’s Weight Status, Motor Coordination, and Physical Activity. Front. Pediatr. 2022, 9, 794284. [Google Scholar] [CrossRef] [PubMed]
- Nichani, V.; Turley, L.; Vena, J.E.; McCormack, G.R. Associations between the neighbourhood characteristics and body mass index, waist circumference, and waist-to-hip ratio: Findings from Alberta’s Tomorrow Project. Health Place 2020, 64, 102357. [Google Scholar] [CrossRef]
- Martins, B.A.; Visvanathan, R.; Barrie, H.R.; Huang, C.H.; Matsushita, E.; Okada, K.; Satake, S.; Edwards, S.; Uno, C.; Kuzuya, M. Built Environment and Frailty: Neighborhood Perceptions and Associations With Frailty, Experience From the Nagoya Longitudinal Study. J. Appl. Gerontol. 2021, 40, 609–619. [Google Scholar] [CrossRef] [PubMed]
- Murillo, R.; Reesor-Oyer, L.M.; Hernandez, D.C.; Liu, Y.; Obasi, E.M. Neighborhood Walkability and Overweight/Obese Weight Status Among Latino Adults. Am. J. Health Promot. 2020, 34, 599–607. [Google Scholar] [CrossRef] [PubMed]
- Mph, J.R.M.R.; Beebe-Dimmer, J.L.; Schwartz, A.G.; Mph, J.J.R.; Baird, T.E.; Pandolfi, S.S.; Hastert, T.A.; Ma, J.W.Q.; Rundle, A.G. Neighborhood walkability and body mass index in African American cancer survivors: The Detroit Research on Cancer Survivors study. Cancer 2021, 127, 4687–4693. [Google Scholar] [CrossRef]
- Bhimla, A.; Zhu, L.; Twardus, S.; Lin, T.; Vo, S.; Do, P.; Ma, G.X. Examining multilevel neighborhood socioeconomic characteristics associated with colorectal cancer screening in Vietnamese Americans residing in Philadelphia County. Transl. Behav. Med. 2022, 12, 489–497. [Google Scholar] [CrossRef]
- Jones, A.C.; Chaudhary, N.S.; Patki, A.; Howard, V.J.; Howard, G.; Colabianchi, N.; Judd, S.E.; Irvin, M.R. Neighborhood Walkability as a Predictor of Incident Hypertension in a National Cohort Study. Front. Public Health 2021, 9, 611895. [Google Scholar] [CrossRef]
- Koohsari, M.J.; Nakaya, T.; Hanibuchi, T.; Shibata, A.; Ishii, K.; Sugiyama, T.; Owen, N.; Oka, K. Local-Area Walkability and Socioeconomic Disparities of Cardiovascular Disease Mortality in Japan. J. Am. Heart Assoc. 2020, 9, e016152. [Google Scholar] [CrossRef]
- Hu, H.-B.; Hou, Z.-H.; Huang, C.-H.; LaMonte, M.J.; Wang, M.; Lu, B. Associations of exposure to residential green space and neighborhood walkability with coronary atherosclerosis in Chinese adults. Environ. Pollut. 2021, 292, 118347. [Google Scholar] [CrossRef]
- Nichani, V.; Turley, L.; Vena, J.E.; McCormack, G.R. Associations between neighbourhood built characteristics and sedentary behaviours among Canadian men and women: Findings from Alberta’s Tomorrow Project. Prev. Med. 2021, 150, 106663. [Google Scholar] [CrossRef] [PubMed]
- Koohsari, M.J.; Shibata, A.; Ishii, K.; Kurosawa, S.; Yasunaga, A.; Hanibuchi, T.; Nakaya, T.; Mavoa, S.; McCormack, G.R.; Oka, K. Built environment correlates of objectively-measured sedentary behaviours in densely-populated areas. Health Place 2020, 66, 102447. [Google Scholar] [CrossRef] [PubMed]
- Lin, C.-Y.; Koohsari, M.J.; Liao, Y.; Ishii, K.; Shibata, A.; Nakaya, T.; McCormack, G.R.; Hadgraft, N.; Sugiyama, T.; Owen, N.; et al. Workplace neighbourhood built-environment attributes and sitting at work and for transport among Japanese desk-based workers. Sci. Rep. 2022, 12, 1–8. [Google Scholar] [CrossRef] [PubMed]
- Li, X.; Li, Y.; Xia, B.; Han, Y. Pathways between neighbourhood walkability and mental wellbeing: A case from Hankow, China. J. Transp. Health 2021, 20, 101012. [Google Scholar] [CrossRef]
- Koohsari, M.J.; McCormack, G.R.; Shibata, A.; Ishii, K.; Yasunaga, A.; Nakaya, T.; Oka, K. The relationship between walk score® and perceived walkability in ultrahigh density areas. Prev. Med. Rep. 2021, 23, 101393. [Google Scholar] [CrossRef]
- Kim, E.J.; Kim, J.; Kim, H. Neighborhood Walkability and Active Transportation: A Correlation Study in Leisure and Shopping Purposes. Int. J. Environ. Res. Public Health 2020, 17, 2178. [Google Scholar] [CrossRef]
- Watson, K.B.; Whitfield, G.P.; Thomas, J.V.; Berrigan, D.; Fulton, J.E.; Carlson, S.A. Associations between the National Walkability Index and walking among US Adults—National Health Interview Survey, 2015. Prev. Med. 2020, 137, 106122. [Google Scholar] [CrossRef]
- Rahman, M.L.; Pocock, T.; Moore, A.; Mandic, S. Active Transport to School and School Neighbourhood Built Environment across Urbanisation Settings in Otago, New Zealand. Int. J. Environ. Res. Public Health 2020, 17, 9013. [Google Scholar] [CrossRef]
- Molina-García, J.; Campos, S.; García-Massó, X.; Herrador-Colmenero, M.; Gálvez-Fernández, P.; Molina-Soberanes, D.; Queralt, A.; Chillón, P. Different neighborhood walkability indexes for active commuting to school are necessary for urban and rural children and adolescents. Int. J. Behav. Nutr. Phys. Act. 2020, 17, 1–11. [Google Scholar] [CrossRef]
- Chippendale, T. Outdoor Falls Prevention Strategy Use and Neighborhood Walkability Among Naturally Occurring Retirement Community Residents. Health Educ. Behav. 2020, 48, 899–906. [Google Scholar] [CrossRef]
- Kwon, K.; Akar, G. People with disabilities and use of public transit: The role of neighborhood walkability. J. Transp. Geogr. 2022, 100, 103319. [Google Scholar] [CrossRef]
- Lee, S. Does tree canopy moderate the association between neighborhood walkability and street crime? Urban For. Urban Green. 2021, 65, 127336. [Google Scholar] [CrossRef]
- Lee, N.; Contreras, C. Neighborhood Walkability and Crime: Does the Relationship Vary by Crime Type? Environ. Behav. 2020, 53, 753–786. [Google Scholar] [CrossRef]
- Yin, L.; Patterson, K.; Silverman, R.; Wu, L.; Zhang, H. Neighbourhood accessibility and walkability of subsidised housing in shrinking US cities. Urban Stud. 2020, 59, 323–340. [Google Scholar] [CrossRef]
- Kim, E.J.; Kim, H. Neighborhood Walkability and Housing Prices: A Correlation Study. Sustainability 2020, 12, 593. [Google Scholar] [CrossRef]
- Koohsari, M.J.; Nakaya, T.; McCormack, G.R.; Shibata, A.; Ishii, K.; Yasunaga, A.; Hanibuchi, T.; Oka, K. Traditional and novel walkable built environment metrics and social capital. Landsc. Urban Plan. 2021, 214, 104184. [Google Scholar] [CrossRef]
- Conderino, S.E.; Feldman, J.M.; Spoer, B.; Gourevitch, M.N.; Thorpe, L.E. Social and Economic Differences in Neighborhood Walkability Across 500 U.S. Cities. Am. J. Prev. Med. 2021, 61, 394–401. [Google Scholar] [CrossRef] [PubMed]
- Götz, F.M.; Yoshino, S.; Oshio, A. The association between walkability and personality: Evidence from a large socioecological study in Japan. J. Environ. Psychol. 2020, 69, 101438. [Google Scholar] [CrossRef]
- Mitsutake, S.; Ishizaki, T.; Yokoyama, Y.; Nishi, M.; Koohsari, M.; Oka, K.; Yano, S.; Abe, T.; Kitamura, A. Do Walking-Friendly Built Environments Influence Frailty and Long-Term Care Insurance Service Needs? Sustainability 2021, 13, 5632. [Google Scholar] [CrossRef]
- León-Quismondo, J.; Bonal, J.; Burillo, P.; Fernández-Luna, A. Walkability and Fitness Center Prices, Opening Hours, and Extra Services: The Case of Madrid, Spain. Int. J. Environ. Res. Public Health 2020, 17, 5622. [Google Scholar] [CrossRef]
- Shuvo, F.; Mazumdar, S.; Labib, S. Walkability and Greenness Do Not Walk Together: Investigating Associations between Greenness and Walkability in a Large Metropolitan City Context. Int. J. Environ. Res. Public Health 2021, 18, 4429. [Google Scholar] [CrossRef] [PubMed]
- Labdaoui, K.; Mazouz, S.; Moeinaddini, M.; Cools, M.; Teller, J. The Street Walkability and Thermal Comfort Index (SWTCI): A new assessment tool combining street design measurements and thermal comfort. Sci. Total Environ. 2021, 795, 148663. [Google Scholar] [CrossRef] [PubMed]
- Carr, L.J.; Dunsiger, S.I.; Marcus, B.H. Validation of Walk Score for estimating access to walkable amenities. Br. J. Sports Med. 2011, 45, 1144–1148. [Google Scholar] [CrossRef]
- Carr, L.J.P.; Dunsiger, S.I.P.; Marcus, B.H.P. Walk Score™ As a Global Estimate of Neighborhood Walkability. Am. J. Prev. Med. 2010, 39, 460–463. [Google Scholar] [CrossRef] [PubMed]
- Koohsari, M.J.; Sugiyama, T.; Hanibuchi, T.; Shibata, A.; Ishii, K.; Liao, Y.; Oka, K. Validity of Walk Score® as a measure of neighborhood walkability in Japan. Prev. Med. Rep. 2018, 9, 114–117. [Google Scholar] [CrossRef] [PubMed]
- Horak, J.; Kukuliac, P.; Maresova, P.; Orlikova, L.; Kolodziej, O. Spatial Pattern of the Walkability Index, Walk Score and Walk Score Modification for Elderly. ISPRS Int. J. Geo-Information 2022, 11, 279. [Google Scholar] [CrossRef]
- Méline, J.; Chaix, B.; Pannier, B.; Ogedegbe, G.; Trasande, L.; Athens, J.; Duncan, D.T. Neighborhood walk score and selected Cardiometabolic factors in the French RECORD cohort study. BMC Public Health 2017, 17, 960. [Google Scholar] [CrossRef]
- Lima, F.T.; Brown, N.C.; Duarte, J.P. Understanding the Impact of Walkability, Population Density, and Population Size on COVID-19 Spread: A Pilot Study of the Early Contagion in the United States. Entropy 2021, 23, 1512. [Google Scholar] [CrossRef]
- Koohsari, M.J.; McCormack, G.R.; Nakaya, T.; Shibata, A.; Ishii, K.; Yasunaga, A.; Liao, Y.; Oka, K. Walking-Friendly Built Environments and Objectively Measured Physical Function in Older Adults. J. Sport Health Sci. 2020, 9, 651–656. [Google Scholar] [CrossRef]
- Matsumoto, D.; Takatori, K.; Miyata, A.; Yamasaki, N.; Miyazaki, M.; Imanishi, A.; Moon, J.-S. Association between Neighborhood Walkability and Social Participation in Community-Dwelling Older Adults in Japan: A Cross-Sectional Analysis of the Keeping Active across Generations Uniting the Youth and the Aged Study. Geriatr. Gerontol. Int. 2022, 22, 350–359. [Google Scholar] [CrossRef]
- McCormack, G.R.; Frehlich, L.; Blackstaffe, A.; Turin, T.C.; Doyle-Baker, P.K. Active and Fit Communities. Associations between Neighborhood Walkability and Health-Related Fitness in Adults. Int. J. Environ. Res. Public Health 2020, 17, 1131. [Google Scholar] [CrossRef] [PubMed]
- Otsuka, N.; Wittowsky, D.; Damerau, M.; Gerten, C. Walkability assessment for urban areas around railway stations along the Rhine-Alpine Corridor. J. Transp. Geogr. 2021, 93, 103081. [Google Scholar] [CrossRef]
- Park, J.-H.; Lai, T.-F.; Chang, C.-S.; Huang, W.-C.; Cho, J.S.; Liao, Y. A Nonlinear Association between Neighborhood Walkability and Risks of Sarcopenia in Older Adults. J. Nutr. Health Aging 2021, 25, 618–623. [Google Scholar] [CrossRef]
- Barnett, T.A.; Ghenadenik, A.E.; Van Hulst, A.; Contreras, G.; Kestens, Y.; Chaix, B.; Cloutier, M.-S.; Henderson, M. Neighborhood built environment typologies and adiposity in children and adolescents. Int. J. Obes. 2021, 46, 588–596. [Google Scholar] [CrossRef] [PubMed]
- Frank, L.D.; Sallis, J.F.; Saelens, B.E.; Leary, L.; Cain, K.; Conway, T.L.; Hess, P.M. The development of a walkability index: Application to the Neighborhood Quality of Life Study. Br. J. Sports Med. 2010, 44, 924–933. [Google Scholar] [CrossRef]
- Hino, K.; Baba, H.; Kim, H.; Shimizu, C. Validation of a Japanese walkability index using large-scale step count data of Yokohama citizens. Cities 2022, 123, 103614. [Google Scholar] [CrossRef]
- Kato, H.; Takizawa, A. Which Residential Clusters of Walkability Affect Future Population from the Perspective of Real Estate Prices in the Osaka Metropolitan Area? Sustainability 2021, 13, 13413. [Google Scholar] [CrossRef]
- Qureshi, S.; Memon, I.A.; Talpur, M.A.H. Association between Objectively Measured Neighbourhood Built Environment and Walkability. Mehran Univ. Res. J. Eng. Technol. 2022, 41, 157–168. [Google Scholar] [CrossRef]
- Cheng, J.; Yu, H. The relationship between neighborhood environment and physical activity in Chinese youth: A retrospective cross-sectional study. J. Public Health 2021, 1–8. [Google Scholar] [CrossRef]
- Ross, N.; Wasfi, R.; Herrmann, T.; Gleckner, W. Canadian Active Living Environments Database (Can-ALE) User Manual \& Technical Document. Geo-Social Determ; Geo-Social Determinants of Health Research Group Department of Geography, McGill University: Montreal, QC, Canada, 2018. [Google Scholar]
- Lang, J.J.; Pinault, L.; Colley, R.C.; Prince, S.A.; Christidis, T.; Tjepkema, M.; Crouse, D.L.; de Groh, M.; Ross, N.; Villeneuve, P.J. Neighbourhood walkability and mortality: Findings from a 15-year follow-up of a nationally representative cohort of Canadian adults in urban areas. Environ. Int. 2022, 161, 107141. [Google Scholar] [CrossRef]
- Rundle, A.G.; Chen, Y.; Quinn, J.W.; Rahai, N.; Bartley, K.; Mooney, S.J.; Bader, M.D.; Zeleniuch-Jacquotte, A.; Lovasi, G.S.; Neckerman, K.M. Development of a Neighborhood Walkability Index for Studying Neighborhood Physical Activity Contexts in Communities across the U.S. over the Past Three Decades. J. Hered. 2019, 96, 583–590. [Google Scholar] [CrossRef] [PubMed]
- Thomas, J.; Zeller, L. National Walkability Index User Guide and Methodology; Environ. Prot. Agency: Washington, DC, USA, 2017. [Google Scholar]
- Lam, T.M.; Wang, Z.; Vaartjes, I.; Karssenberg, D.; Ettema, D.; Helbich, M.; Timmermans, E.J.; Frank, L.D.; Braver, N.R.D.; Wagtendonk, A.J.; et al. Development of an objectively measured walkability index for the Netherlands. Int. J. Behav. Nutr. Phys. Act. 2022, 19, 1–16. [Google Scholar] [CrossRef] [PubMed]
- Lee, S.; Lee, C.; Nam, J.W.; Abbey-Lambertz, M.; Mendoza, J.A. School walkability index: Application of environmental audit tool and GIS. J. Transp. Health 2020, 18, 100880. [Google Scholar] [CrossRef] [PubMed]
- Moin, J.S.; Glazier, R.H.; Kuluski, K.; Kiss, A.; Upshur, R. Impact of neighbourhood walkability on the onset of multimorbidity: A cohort study. BMJ Open 2021, 11, e045890. [Google Scholar] [CrossRef]
- Motieyan, H.; Kaviari, F.; Mostofi, N. Quantifying walking capability: A novel aggregated index based on spatial perspective and analyses. Pap. Reg. Sci. 2022, 101, 483–503. [Google Scholar] [CrossRef]
- Yıldırım, M.; Geçer, E.; Akgül, O. The impacts of vulnerability, perceived risk, and fear on preventive behaviours against COVID-19. Psychol. Health Med. 2020, 26, 35–43. [Google Scholar] [CrossRef]
- Borkowski, P.; Jażdżewska-Gutta, M.; Szmelter-Jarosz, A. Lockdowned: Everyday mobility changes in response to COVID-19. J. Transp. Geogr. 2020, 90, 102906. [Google Scholar] [CrossRef]
- Wang, Y.; Tsai, T.C.; Duncan, D.; Ji, J. Association of city-level walkability, accessibility to biking and public transportation and socio-economic features with COVID-19 infection in Massachusetts, USA: An ecological study. Geospat. Health 2022, 17, 1017. [Google Scholar] [CrossRef]
- Yang, X.; Fang, Z.; Yin, L.; Li, J.; Zhou, Y.; Lu, S. Understanding the Spatial Structure of Urban Commuting Using Mobile Phone Location Data: A Case Study of Shenzhen, China. Sustainability 2018, 10, 1435. [Google Scholar] [CrossRef]
- de Castro Neto, M.; de Melo Cartaxo, T. Algorithmic Cities: A Dystopic or Utopic Future. In How Smart Is Your City? Technological Innovation, Ethics and Inclusiveness; Ferreira, M.I.A., Ed.; Springer International Publishing: Cham, Switzerland, 2021; pp. 59–73. ISBN 978-3-030-56926-6. [Google Scholar]
- Balzotti, C.; Bragagnini, A.; Briani, M.; Cristiani, E. Understanding Human Mobility Flows from Aggregated Mobile Phone Data. IFAC-PapersOnLine 2018, 51, 25–30. [Google Scholar] [CrossRef]
- Reis, S.; Seto, E.; Northcross, A.; Quinn, N.W.; Convertino, M.; Jones, R.; Maier, H.; Schlink, U.; Steinle, S.; Vieno, M.; et al. Integrating modelling and smart sensors for environmental and human health. Environ. Model. Softw. 2015, 74, 238–246. [Google Scholar] [CrossRef] [PubMed] [Green Version]
Figure 1.
Application of PRISMA four-phase flow diagram (n = included e = excluded). Adapted from Vong et al. [54].
Figure 1.
Application of PRISMA four-phase flow diagram (n = included e = excluded). Adapted from Vong et al. [54].

Figure 2.
Number of documents (blue) and number of citations (red) by year. For the year 2022, only the period until May is considered.
Figure 2.
Number of documents (blue) and number of citations (red) by year. For the year 2022, only the period until May is considered.

Figure 3.
Number of documents (blue) and number of citations (red) by research area (top 5).

Figure 4.
Number of documents by country of author.

Figure 5.
Percentage of documents (left of slice) and citations (right of slice) per publisher (top 5).
Figure 5.
Percentage of documents (left of slice) and citations (right of slice) per publisher (top 5).

Figure 6.
Number of documents and citations per journal (top 4).

Figure 7.
Number of documents and citations per first author (top 5 by documents).

Figure 8.
Network map of author co-authorship analysis.

Figure 9.
Network map of organization co-authorship analysis.

Figure 10.
Network map of country co-authorship analysis.

Figure 11.
Network map of keyword co-occurrence analysis.

Figure 12.
Network map of source citation analysis.

Figure 13.
Network map of author citation analysis.

Figure 14.
Network map of country citation analysis.

Figure 15.
Network map of author co-citation analysis.

Figure 16.
Network map of document co-citation analysis.

Publisher’s Note: MDPI stays neutral with regard to jurisdictional claims in published maps and institutional affiliations. |
© 2022 by the authors. Licensee MDPI, Basel, Switzerland. This article is an open access article distributed under the terms and conditions of the Creative Commons Attribution (CC BY) license (https://creativecommons.org/licenses/by/4.0/).
Share and Cite
MDPI and ACS Style
Jardim, B.; de Castro Neto, M. Walkability Indicators in the Aftermath of the COVID-19 Pandemic: A Systematic Review. Sustainability 2022, 14, 10933. https://doi.org/10.3390/su141710933
AMA Style
Jardim B, de Castro Neto M. Walkability Indicators in the Aftermath of the COVID-19 Pandemic: A Systematic Review. Sustainability. 2022; 14(17):10933. https://doi.org/10.3390/su141710933
Chicago/Turabian StyleJardim, Bruno, and Miguel de Castro Neto. 2022. "Walkability Indicators in the Aftermath of the COVID-19 Pandemic: A Systematic Review" Sustainability 14, no. 17: 10933. https://doi.org/10.3390/su141710933
Note that from the first issue of 2016, this journal uses article numbers instead of page numbers. See further details here.