
A Light Deep Learning Algorithm for CT Diagnosis of COVID-19 Pneumonia
by
 , and
, and
Adhvan Furtado
1 ,
,
Carlos Alberto Campos da Purificação
1,
Roberto Badaró
2 and
Erick Giovani Sperandio Nascimento
1,* 1
Supercomputing Center SENAI CIMATEC, Av. Orlando Gomes, 1845, Piatã, Salvador 41560-010, Brazil
2
Instituto SENAI de Inovação em Saúde, Av. Orlando Gomes, 1845, Piatã, Salvador 41560-010, Brazil
*
Author to whom correspondence should be addressed.
Diagnostics 2022, 12(7), 1527; https://doi.org/10.3390/diagnostics12071527
Submission received: 4 June 2022
/
Revised: 20 June 2022
/
Accepted: 20 June 2022
/
Published: 23 June 2022
(This article belongs to the Section Machine Learning and Artificial Intelligence in Diagnostics)
Abstract
:A large number of reports present artificial intelligence (AI) algorithms, which support pneumonia detection caused by COVID-19 from chest CT (computed tomography) scans. Only a few studies provided access to the source code, which limits the analysis of the out-of-distribution generalization ability. This study presents Cimatec-CovNet-19, a new light 3D convolutional neural network inspired by the VGG16 architecture that supports COVID-19 identification from chest CT scans. We trained the algorithm with a dataset of 3000 CT Scans (1500 COVID-19-positive) with images from different parts of the world, enhanced with 3000 images obtained with data augmentation techniques. We introduced a novel pre-processing approach to perform a slice-wise selection based solely on the lung CT masks and an empirically chosen threshold for the very first slice. It required only 16 slices from a CT examination to identify COVID-19. The model achieved a recall of 0.88, specificity of 0.88, ROC-AUC of 0.95, PR-AUC of 0.95, and F1-score of 0.88 on a test set with 414 samples (207 COVID-19). These results support Cimatec-CovNet-19 as a good and light screening tool for COVID-19 patients. The whole code is freely available for the scientific community.
1. Introduction
COVID-19 still affects public health services. Until 17 June 2022, there have been 535,863,950 confirmed cases of COVID-19 and 6,314,972 deaths all over the world, reported to WHO [1]. Despite the declining curve of new cases throughout the world, it is paramount to identify suspicious cases, differentiate them from other respiratory diseases, and to define appropriate isolation and treatment strategies [2]. In healthcare units, mechanisms for screening and monitoring the evolution of the disease are essential. The “Gold Standard” for diagnosing a COVID-19 infection is a reverse transcription-polymerase chain reaction (RT-PCR) test. Although RT-PCR is a reliable test, it needs trained people to perform the nasopharyngeal swab collection and a specialized laboratory for analysis. Results can take a few hours or days, and there is a significant and not yet fully explained variation in the proportion of false-negative results [3,4]. There are many healthcare facilities, especially in developing countries, where mechanisms for patient assessment and management are essential and RT-PCR is not completely available.
The SARS-CoV-2 infection generates characteristic abnormalities in chest image examinations. Chest radiography and computed tomography (CT) scans are the most common methods to support the diagnosis of pneumonia in symptomatic patients [5]. These examinations have been widely used as part of the initial screening and in situations where the patient has strong respiratory symptoms [6]. Even with the appearance of new variants less aggressive to lungs, it is still necessary to detect and monitor COVID-19 pneumonia, as we do not know how the disease will evolve in the next years to come.
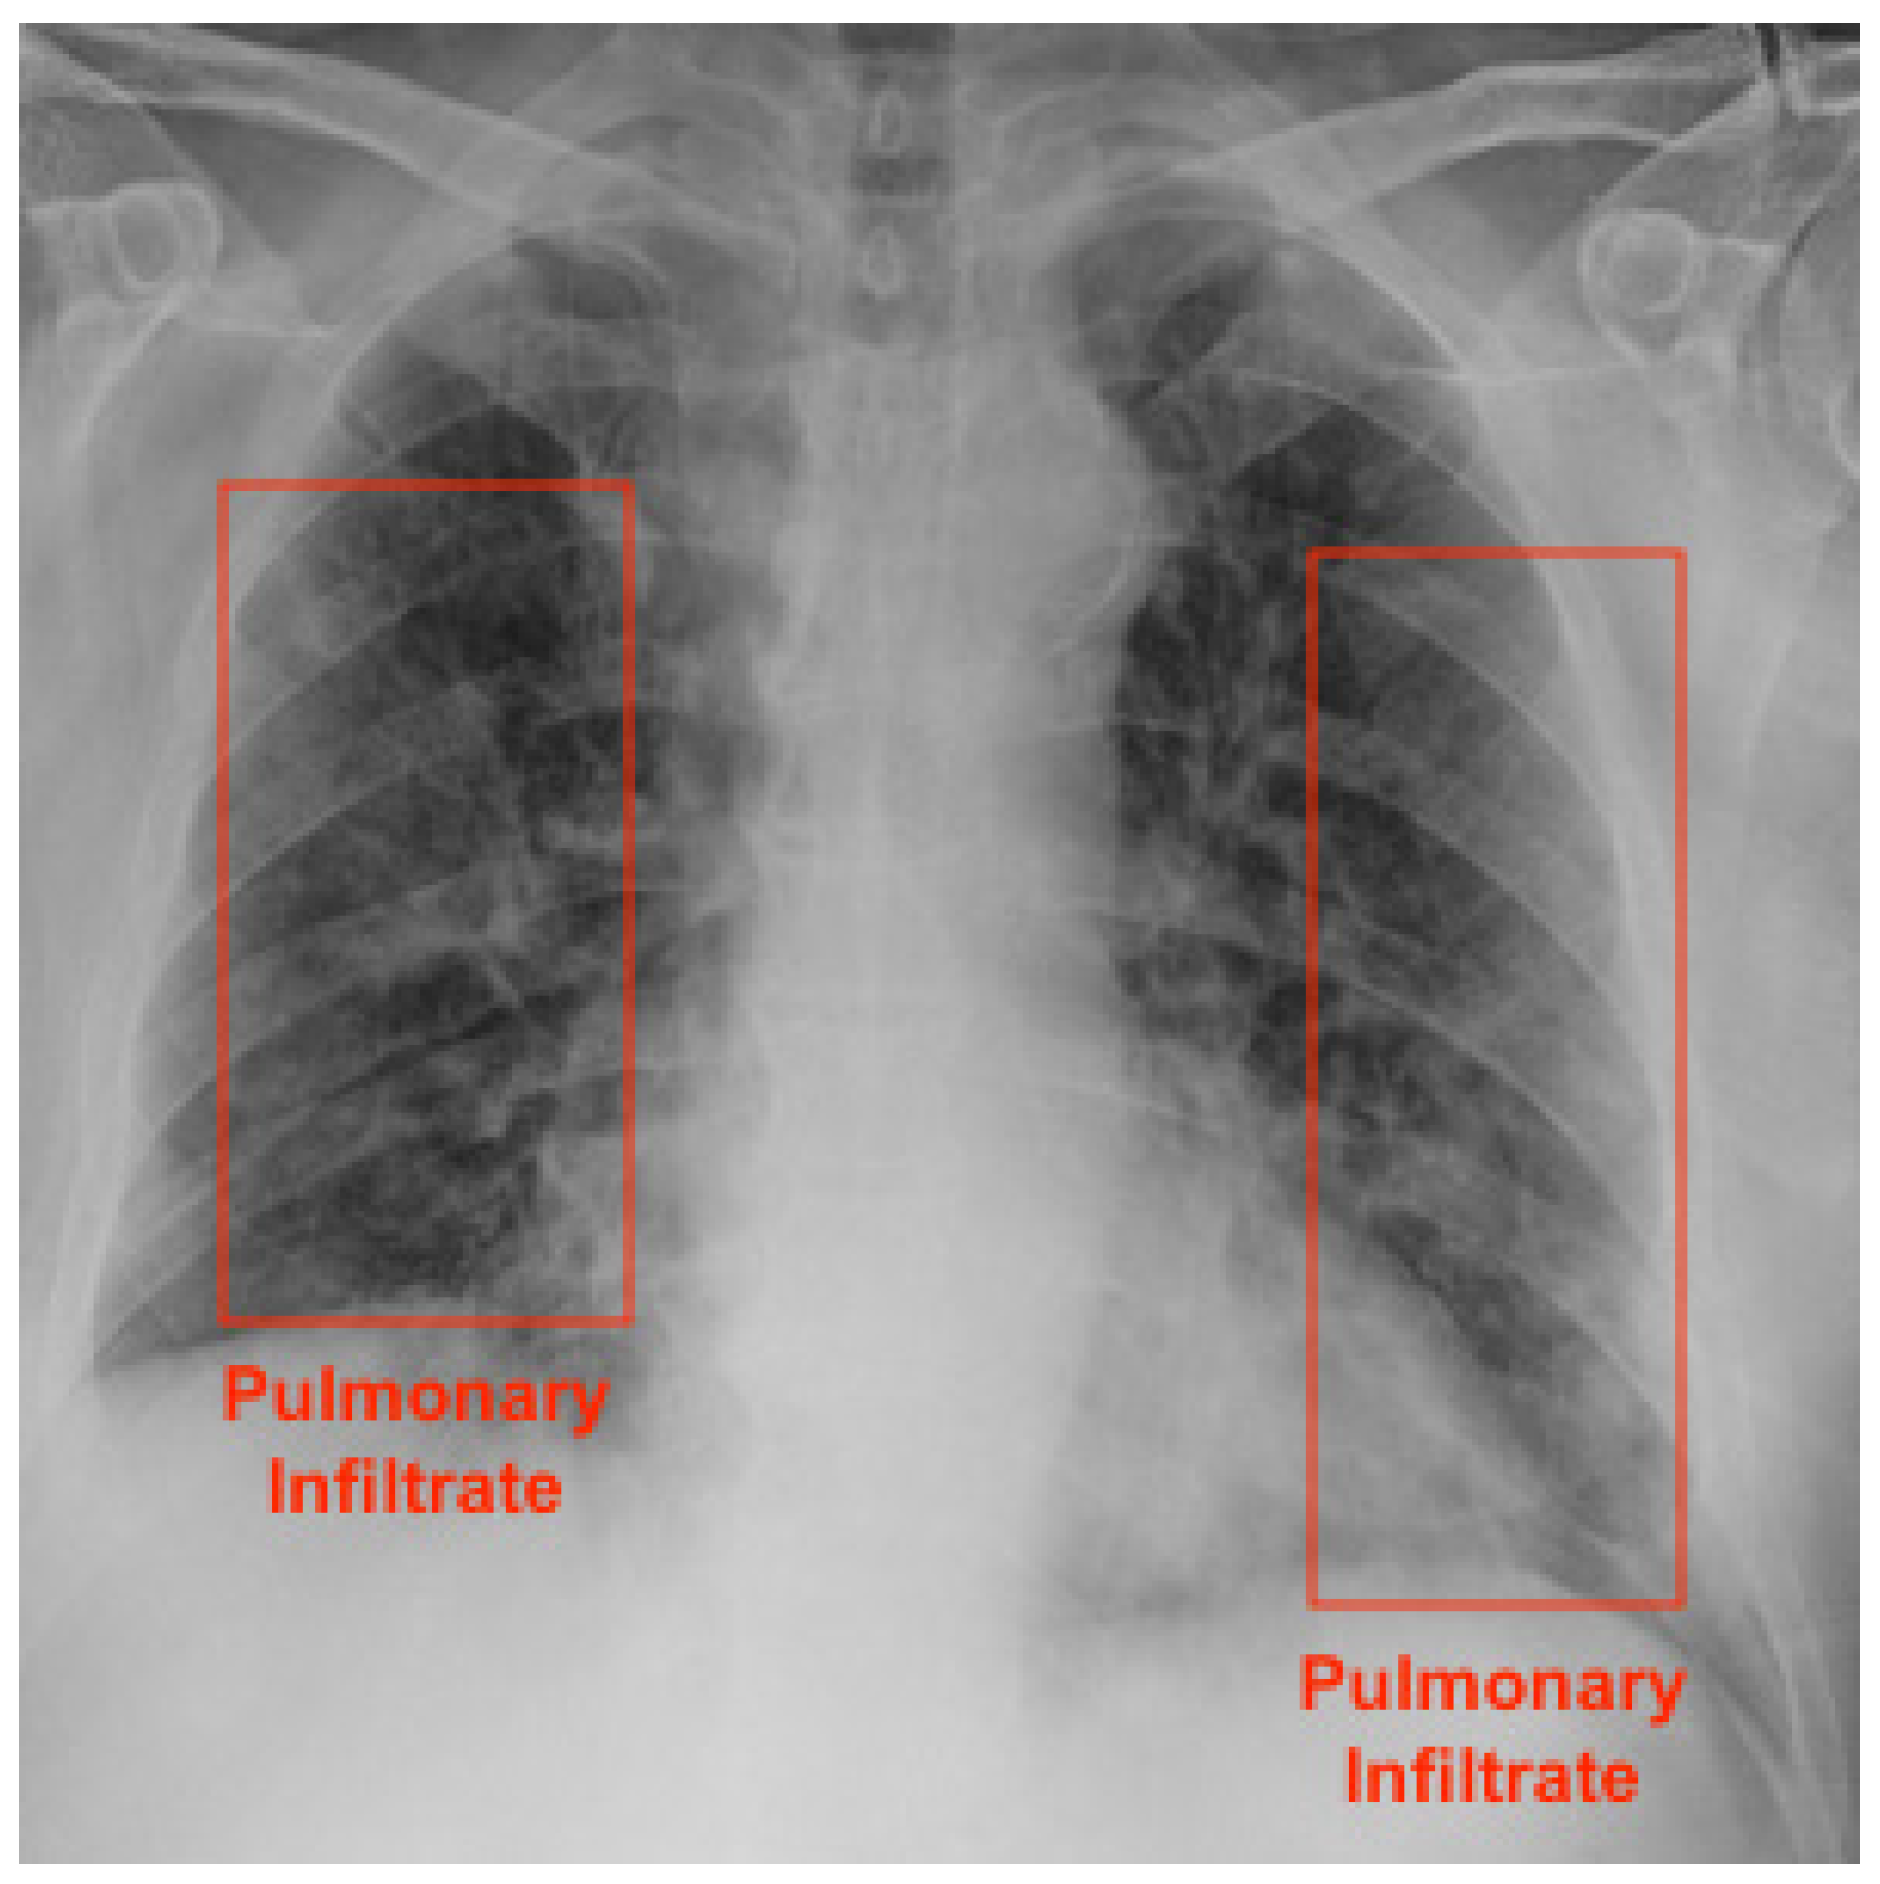
An X-ray machine is the most commonly available imaging tool for patients with respiratory complaints. It is especially useful to identify severe cases of COVID-19 patients, as there might not be any findings on exams in mild or early-stage patients [7]. It is a simple, fast, and safe examination procedure. AI algorithms can support the detection of pneumonia caused by COVID-19 in chest radiographs [8]. Figure 1 presents a COVID-19 patient’s radiography highlighting pulmonary infiltrates.
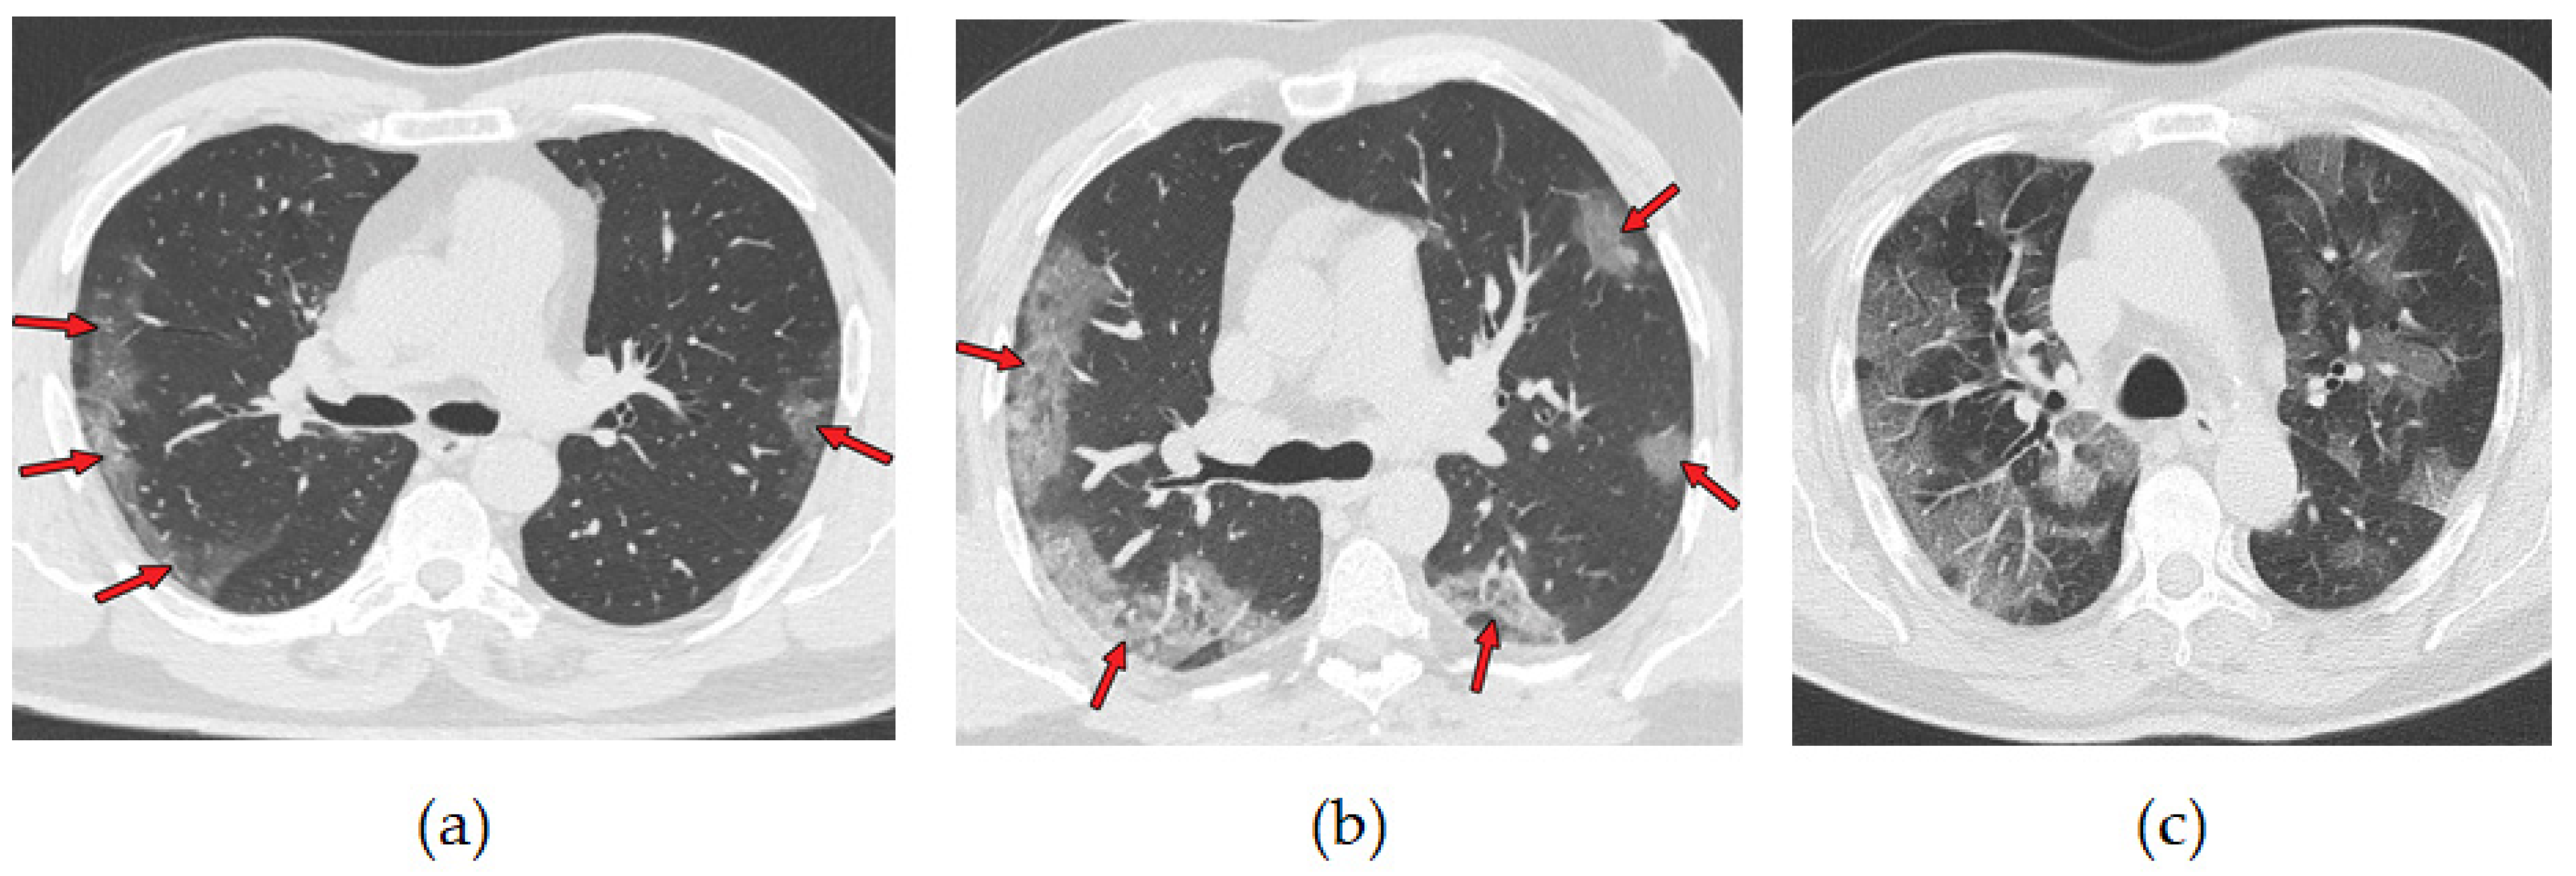
A chest CT scan combines data from multiple X-rays taken from different angles, which produces a detailed image of the lungs. CT scans are more effective than chest X-ray in early stages of COVID-19 disease detection. They have been used as a tool to diagnose and monitor the progression of the disease [9]. More than 70% of chest CT scans in patients with RT-PCR test-proven COVID-19 cases report ground-glass opacities, vascular enlargement, bilateral abnormalities, lower lobe involvement, and posterior predilection [10]. Figure 2 illustrates those abnormalities. Studies by [11,12] confirm that patients with COVID-19 pneumonia have ground-glass opacities in the earlier stages of the disease and pulmonary consolidation in later stages. Eventually, a rounded morphology and a peripheral pulmonary distribution are observed. Those abnormalities are analogous to those observed in other coronavirus infections, such as SARS-CoV-1 and MERS-CoV [13].
Although typical images can help in the early screening of suspected cases, images of various viral pneumonias are similar and overlap with other infectious and inflammatory lung diseases. Therefore, it is not trivial for radiologists to distinguish COVID-19 pneumonia from other viral pneumonias. AI algorithms are a valuable tool to support this task. It is important to notice that the WHO and the American Society of Radiology do not recommend the use of radiology images as the principal diagnostic method for COVID-19 [14,15,16].
The perspective of using deep learning algorithms as a fast and widely available alternative for the diagnosis of COVID-19 by RT-PCR has expanded the quantity and quality of research in this area. A research done on 1 May 2022 for articles with the words: “Deep Learning” and “CT” and “COVID-19” and “Diagnosis” in the abstract resulted in 287 findings in the PubMed database, being 52 in the MDPI repository. Despite the availability of studies, there are strong obstacles for the regular application of the proposed algorithms in clinical practice. A study by [17] systematically reviewed publications of machine learning models for the diagnosis or prognosis of COVID-19 from X-ray or CT images, concluding that all identified models had methodological flaws and/or underlying biases preventing their use in clinical practice. A review by [18] identified that most of the studies have utilized small datasets and lacked comparative analysis with other existing research, and the codes and data were not available. In our review, we also identified fundamental problems that limit the adoption of algorithms in healthcare centers. There is limited access to the complete source code, train, and test data. Thus, it is not possible to replicate the results and to evaluate the AI algorithm on different data sets. Most of the studies used a limited number of images from local sources or used only well-known public databases, and therefore, their models were not stressed enough to generalize properly to other phenotypes and geographic regions contexts. For instance, we only identified a few publications that used chest CT images from Brazilian hospitals. The work by [19] used data from 130 patients from two hospitals in Rio de Janeiro and one in Porto, Portugal, to develop an algorithm to identify and quantify the extent of lung involvement in patients with COVID-19 pneumonia. The study by [20] developed an algorithm for segmenting COVID lesions on CT using a base of 40 patients from a hospital in Rio de Janeiro. Both studies used small databases. In this work, we avoided repeating the most common flaws identified in the available studies and sought to advance the knowledge necessary to support the use of such algorithms in clinical practice, preparing it for use in a hospital in Brazil, a country with resources constraints to combat COVID-19. Table 1 categorizes the mapped problems and solutions developed in this work.
A review study by [21] highlighted the widespread use of convolutional neural networks for extracting relevant features from CT scans and noted that most classification models for COVID-19 use pre-trained networks. Another extensive review done by [22] showed that many 2D and 3D models were used to support the identification of pneumonia, mainly based on Inception, VGG, and ResNet architectures.
The work of [23,24] used 2D networks to analyze each CT slice image individually and adopted voting methods to classify the patient outcome. Another popular approach using 2D networks was to generate embedding feature vectors for every image, pool them to a single global feature vector, and use fully-connection layers for classification [25,26]. Some studies used 3D CNN networks, where a subset or all the available CT slice images per examinations were used as input [27,28]. Most of the 3D CNN algorithms used a fixed number of images from CT examinations as input because using all available images can be very memory-consuming. The work by [29] studied and compared various deep learning techniques applied to both chest radiographs and CT scans images for the detection of COVID-19 and validated VGG16 and ResNet50 as good architectures for classification. In order to develop a new model for the COVID-19 diagnosis, the study by [30] tested multiple architectures: DenseNet-169, VGG-16, ResNet-50, InceptionV3, and VGG-19. The VGG-19 proved to be superior with an accuracy of 94.52% when compared to all other deep learning models. The similarity of COVID-19-generated pulmonary lesions with the ones generated by other respiratory diseases reinforces the necessity of the algorithm to have an excellent feature extraction ability. A study by [31] proposed the use of a bag of deep visual words (BoDVW) on the VGG-16 architecture. The method removes the feature-map normalization step and adds a deep feature normalization step on the raw feature maps, preserving the semantics of each feature map that might have importance in differentiating COVID-19 from other forms of pneumonia on radiographies. This method was improved by including a multi-scale BoDVW [32] and an attention module to capture the spatial relationship between the regions of interest in CXR images [33].
In our work, we decided to adapt the VGG architecture for a 3D CNN. The input is a set of slices of a patient’s CT. The objective is to preserve the embedded information of the CT examination on the frame stack, thus mimicking the behavior of a radiologist’s analysis. We used a fixed set of 16 slices per CT scan examination to reduce hardware consumption and avoid lack of memory problems. We developed a novel pre-processing technique to choose and prepare the best slices for training and validation.
There are many regions in Brazil and in the world that do not have access to RT-PCR exams in the quantity and time needed or specialized physicians. In these cases, alternatives that facilitate the diagnosis of COVID-19 are very important. In this paper, we present Cimatec-CovNet-19, a fast, VGG-based CNN algorithm for COVID-19 diagnosis in chest CT scans. We developed our system on a set of 3000 chest CT scans, from which 734 examinations were from Brazilian hospitals. This study confirms the hypothesis that AI systems are able to correctly classify COVID-19 and non-COVID-19 classes from CT scans. We evaluated and compared the performance of the algorithm with data from geographically distributed datasets and data from a Brazilian hospital. The main innovations of this study are:
- Proposing a novel 3D VGG-based CNN architecture for accurately diagnosing COVID-19 on chest CT scans. The 3D network is able to identify correlations between adjacent slices, while 2D networks are limited to intra-slice spatial voxel information.
- Introducing a novel pre-processing technique, which reduces the number of slices required for training the algorithm: Processing fewer slices demands less computational power, prevents communications bottlenecks, and reduces time and cost constraints. Since the model only requires 16 slices per CT examination, it is also well-suited for a large number of CT machines.
- Evaluating the algorithm’s diagnosis performance in both geographically distributed and Brazilian datasets: Brazil has more than 300,000,000 inhabitants. It was one of the worst-affected countries in the world by the COVID-19 pandemic. Despite that fact, there are few studies with data from this country. It was important to include images from Brazilian hospitals and confirm the algorithm’s ability to generalize well for this phenotype. We plan to test the algorithm in a controlled environment in a Brazilian hospital in the near future.
- Disposing the algorithm as an open software for public use and future enhancements: This guarantees reproducibility.
2. Materials and Methods
2.1. Dataset Preparation
In the retrospective study, we gathered 5787 CT scans from nine different datasets sources. We used seven public datasets containing CT scans from all over the world: Medical Segmentation Decathlon, LNDb, LCTSC, MOSMEDDATA, COVID-19 CT Lung and Infection Segmentation, COVID-19 CT Segmentation Dataset, BIMCV-COVID19, and two private datasets from Brazilian hospitals: HCUSP and HSI. We included in this study only images in the axial plane and from patients with a diagnosis issued by a radiologist from well-known hospitals. All patient information was already anonymized in the data source. The ground truth for a positive COVID-19 outcome was a positive RT-PCR test associated with the CT-scan examination. We performed a visual inspection of the central slice in each of the 5787 CT scans and manually discarded all data that were in sagittal or coronal planes, had low-quality resolution, or were masks of CT scans instead of the CT scan itself. Altogether, this procedure removed 1108 samples. Table 2 presents the complete list of databases used in this work.
Considering a variety of CT scanners available worldwide, it would be natural to expect that the source datasets had different number of slices and resolutions, which, in fact, happened. Additionally, the data were unbalanced regarding the presence of COVID-19-positive CT scans. The demographic information from the patients was not consistent and thus not used in this work. From the remaining 4679 CT scans, we prepared a random, balanced subset with 3000 samples (1500 COVID-19, 1500 non-COVID-19), which were then split into training and validation sets.
2.2. Dataset Description
- Medical Segmentation Decathlon: The Medical Segmentation Decathlon is a collection of annotated medical image datasets for the development and evaluation of segmentation algorithms. The lung dataset has 96 preoperative thin-section CT scans performed without use of contrast and from patients with non-small cell lung cancer from Stanford University (Palo Alto, CA, USA) publicly available through TCIA [34].
- LNDb: This dataset contains 294 CT scans collected retrospectively at the Centro Hospitalar e Universitário de São João (CHUSJ) in Porto, Portugal, between 2016 and 2018. All data were acquired under approval from the CHUSJ Ethical Committee and was anonymized. Among the 294 patients scanned, 164 (55.8%) were male. The average age was 66, and the minimum and maximum ages were 19 and 98, respectively [35].
- LCTSC: This dataset was provided in association with a challenge competition and related conference session conducted at the American Association of Physicists in Medicine 2017 Annual Meeting. There are CT scans of 60 patients undergoing treatment simulation for thoracic radiotherapy from three institutions: MD Anderson Cancer Center, Memorial Sloan-Kettering Cancer Center, and the MAASTRO clinic. Each institution provided CT scans from 20 patients, including mean intensity projection (4D CT), exhale phase (4D CT), or free-breathing CT scans depending on their clinical practice. All CT scans covered the entire thoracic region with a 50 cm field of view and slice spacing of 1 mm, 2.5 mm, or 3 mm [36].
- MOSMEDDATA: This dataset contains 1110 anonymized lung CT scans obtained between 1 March 2020 and 25 April 2020 from public medical hospitals in Moscow, Russia. Among the patients scanned, there were 42% males, 56% females, and 2% other/unknown with ages from 18 to 97 years, with an average of 47 years. They were distributed according to a classification table of the severity of lung tissue abnormalities with COVID-19 and routing rules. There were five categories ranging from CT-0, zero, not consistent with pneumonia (including COVID-19) up to CT-4, severe, with diffuse ground glass opacities, with consolidations and reticular changes, and pulmonary parenchymal involvement ≥ 75%. The number of cases by category was: CT-0, 254 (22.8%); CT-1, 684 (61.6%); CT-2, 125 (11.3%); CT-3, 45 (4.1%); and CT-4, 2 (0.2%) [37].
- HC USP: The data were obtained through a collaboration between SENAI CIMATEC and the Medical School of the University of São Paulo (HC USP). Altogether, we obtained 439 COVID-19-positive exams and 506 COVID-19-negative exams.
- HSI: The data were acquired from a partnership between SENAI CIMATEC and the Santa Izabel Hospital (HSI). This database has 1294 COVID-19-positive exams and 512 COVID-19-negative exams.
- COVID-19 CT Lung and Infection Segmentation: This dataset contains 20 labeled COVID-19 lung-infection CT scans collected from the Coronacases Initiative and Radiopaedia, which can be freely downloaded with CC BY-NC-SA license. The proportion of infections in the lungs ranges from 0.01% to 59%. The left lung, right lung, and infection segmentation were firstly delineated by junior annotators (1 to 5 years of experience), then refined by two radiologists with 5 to 10 years of experience. All the annotations were verified and refined by a senior radiologist (>10 years of experience) [38].
- COVID-19 CT Segmentation Dataset: This dataset contains 100 axial CT images from more than 40 patients with COVID-19 converted from openly accessible JPG images provided by the Società Italiana di Radiologia Medica e Inteventistica. The images were segmented by a radiologist using three labels: ground glass, consolidation, and pleural effusion [39].
- BIMCV-COVID19: A large dataset from the Valencian Region Medical ImageBank (BIMCV) containing chest X-ray images CXR (CR, DX) and computed tomography (CT) imaging of COVID-19+ patients along with their radiological findings and locations, pathologies, radiological reports (in Spanish), DICOM metadata, polymerase chain reaction (PCR), immunoglobulin G (IgG), and Immunoglobulin M (IgM) diagnostic antibody tests was also used. This database includes 1380 CX, 885 DX, and 163 CT studies from 1311 COVID-19 patients [40].
2.3. Slice-Wise Selection
In order to normalize the input resolution, we used the Clara Training framework, part of the Clara Image software suite, to resample all DICOM and NIfTI data to a voxel spacing resolution of 1 × 1 × 1 mm NIfTI format. Clara is an application framework optimized for healthcare and life sciences developers. It contains software development kits, full-stack GPU-accelerated libraries, and pre-tested reference applications [41]. We also used the Clara framework to obtain lung masks from each chest CT scan. We used the clara_train_covid19_ct_lung_seg model, a voxel-wise binary classification for lung region segmentation. Each voxel is predicted as either foreground (lung) or background. The output is a binary mask, where the lung is assigned 1, and the background is assigned 0. We noticed that the sum of pixels in the lung masks grows in a Gaussian-like pattern from the first to the last slice, peaking around the central slice. Using this information, we did a slice-wise selection in order to collect data from different areas of the lung. After experimenting with 64, 32 and 16 slices, the results did not have any significant statistical differences, so we used 16 slices from each CT scan in order to save computational resources. The slice-wise selection was performed according to the following expression:
where F is the first slice in the mask whose sum of pixels is greater than 1000, and G is the step size given by:
with µ being the central slice.
slicei = F + G × i, with i in [0, 1, 2, …, 15],
G = ⌈(µ − F)/8)⌉,
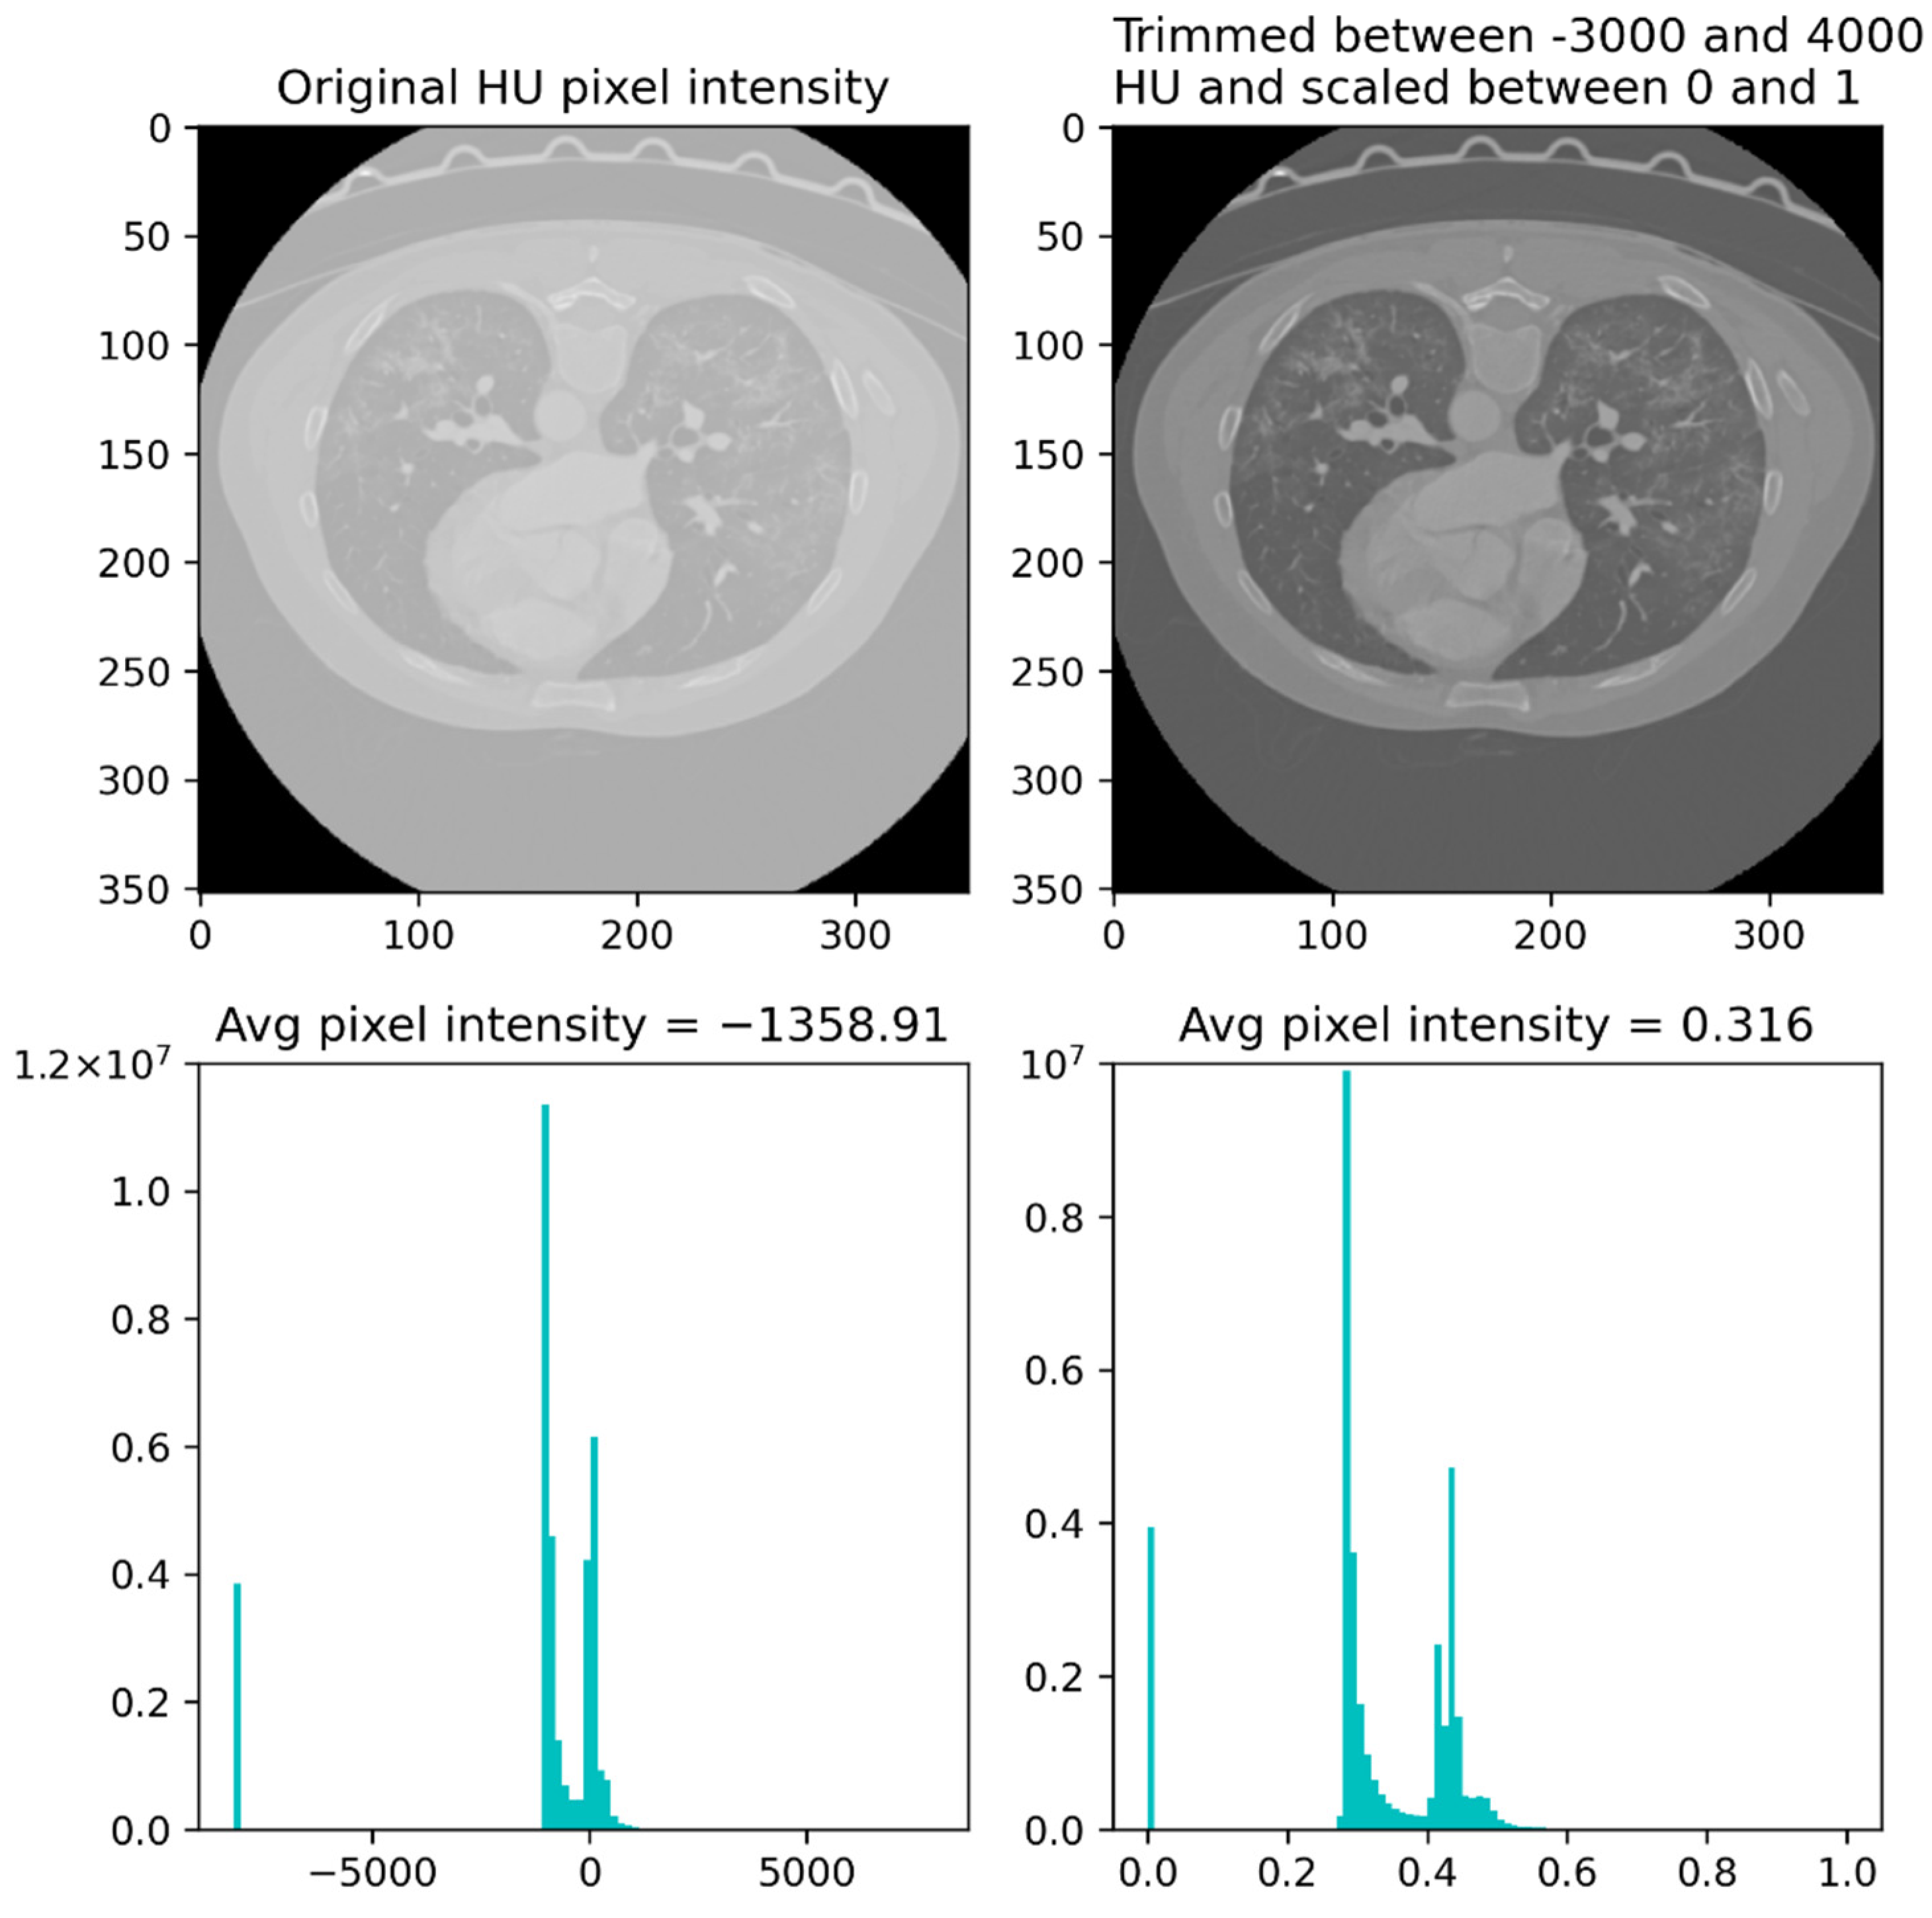
Before executing the described slice-wise selection, the CT scans were trimmed between –3000 and 4000 Housefield units (HU) and scaled between 0 and 1. We reshaped the 16 slices chosen from each CT scan to a 512 × 512 × 16 × 1 format. Figure 3 depicts a single slice from an exam both before and after being pre-processed.
2.4. Algorithm Architecture
Cimatec-CovNet-19 has an architecture inspired by the VGG-16 neural network. The VGG-16 was developed in 2014 and is one of the best CNN architectures to deal with 2D large-scale image recognition tasks. The image passes through a stack of convolutional layers with very small receptive fields (3 × 3 kernels), which is the smallest size possible to capture pixel position notions (left/right, up/down, center). The spatial resolution is preserved with paddings. After some of the convolutional layers, there are max pooling layers (2 × 2 window, stride 2) to guarantee spatial pooling. The stack of convolutional layers is followed by three fully connected (FC) layers. The last layer is a softmax layer, which is a function to represent the network output as a categorical distribution [42].
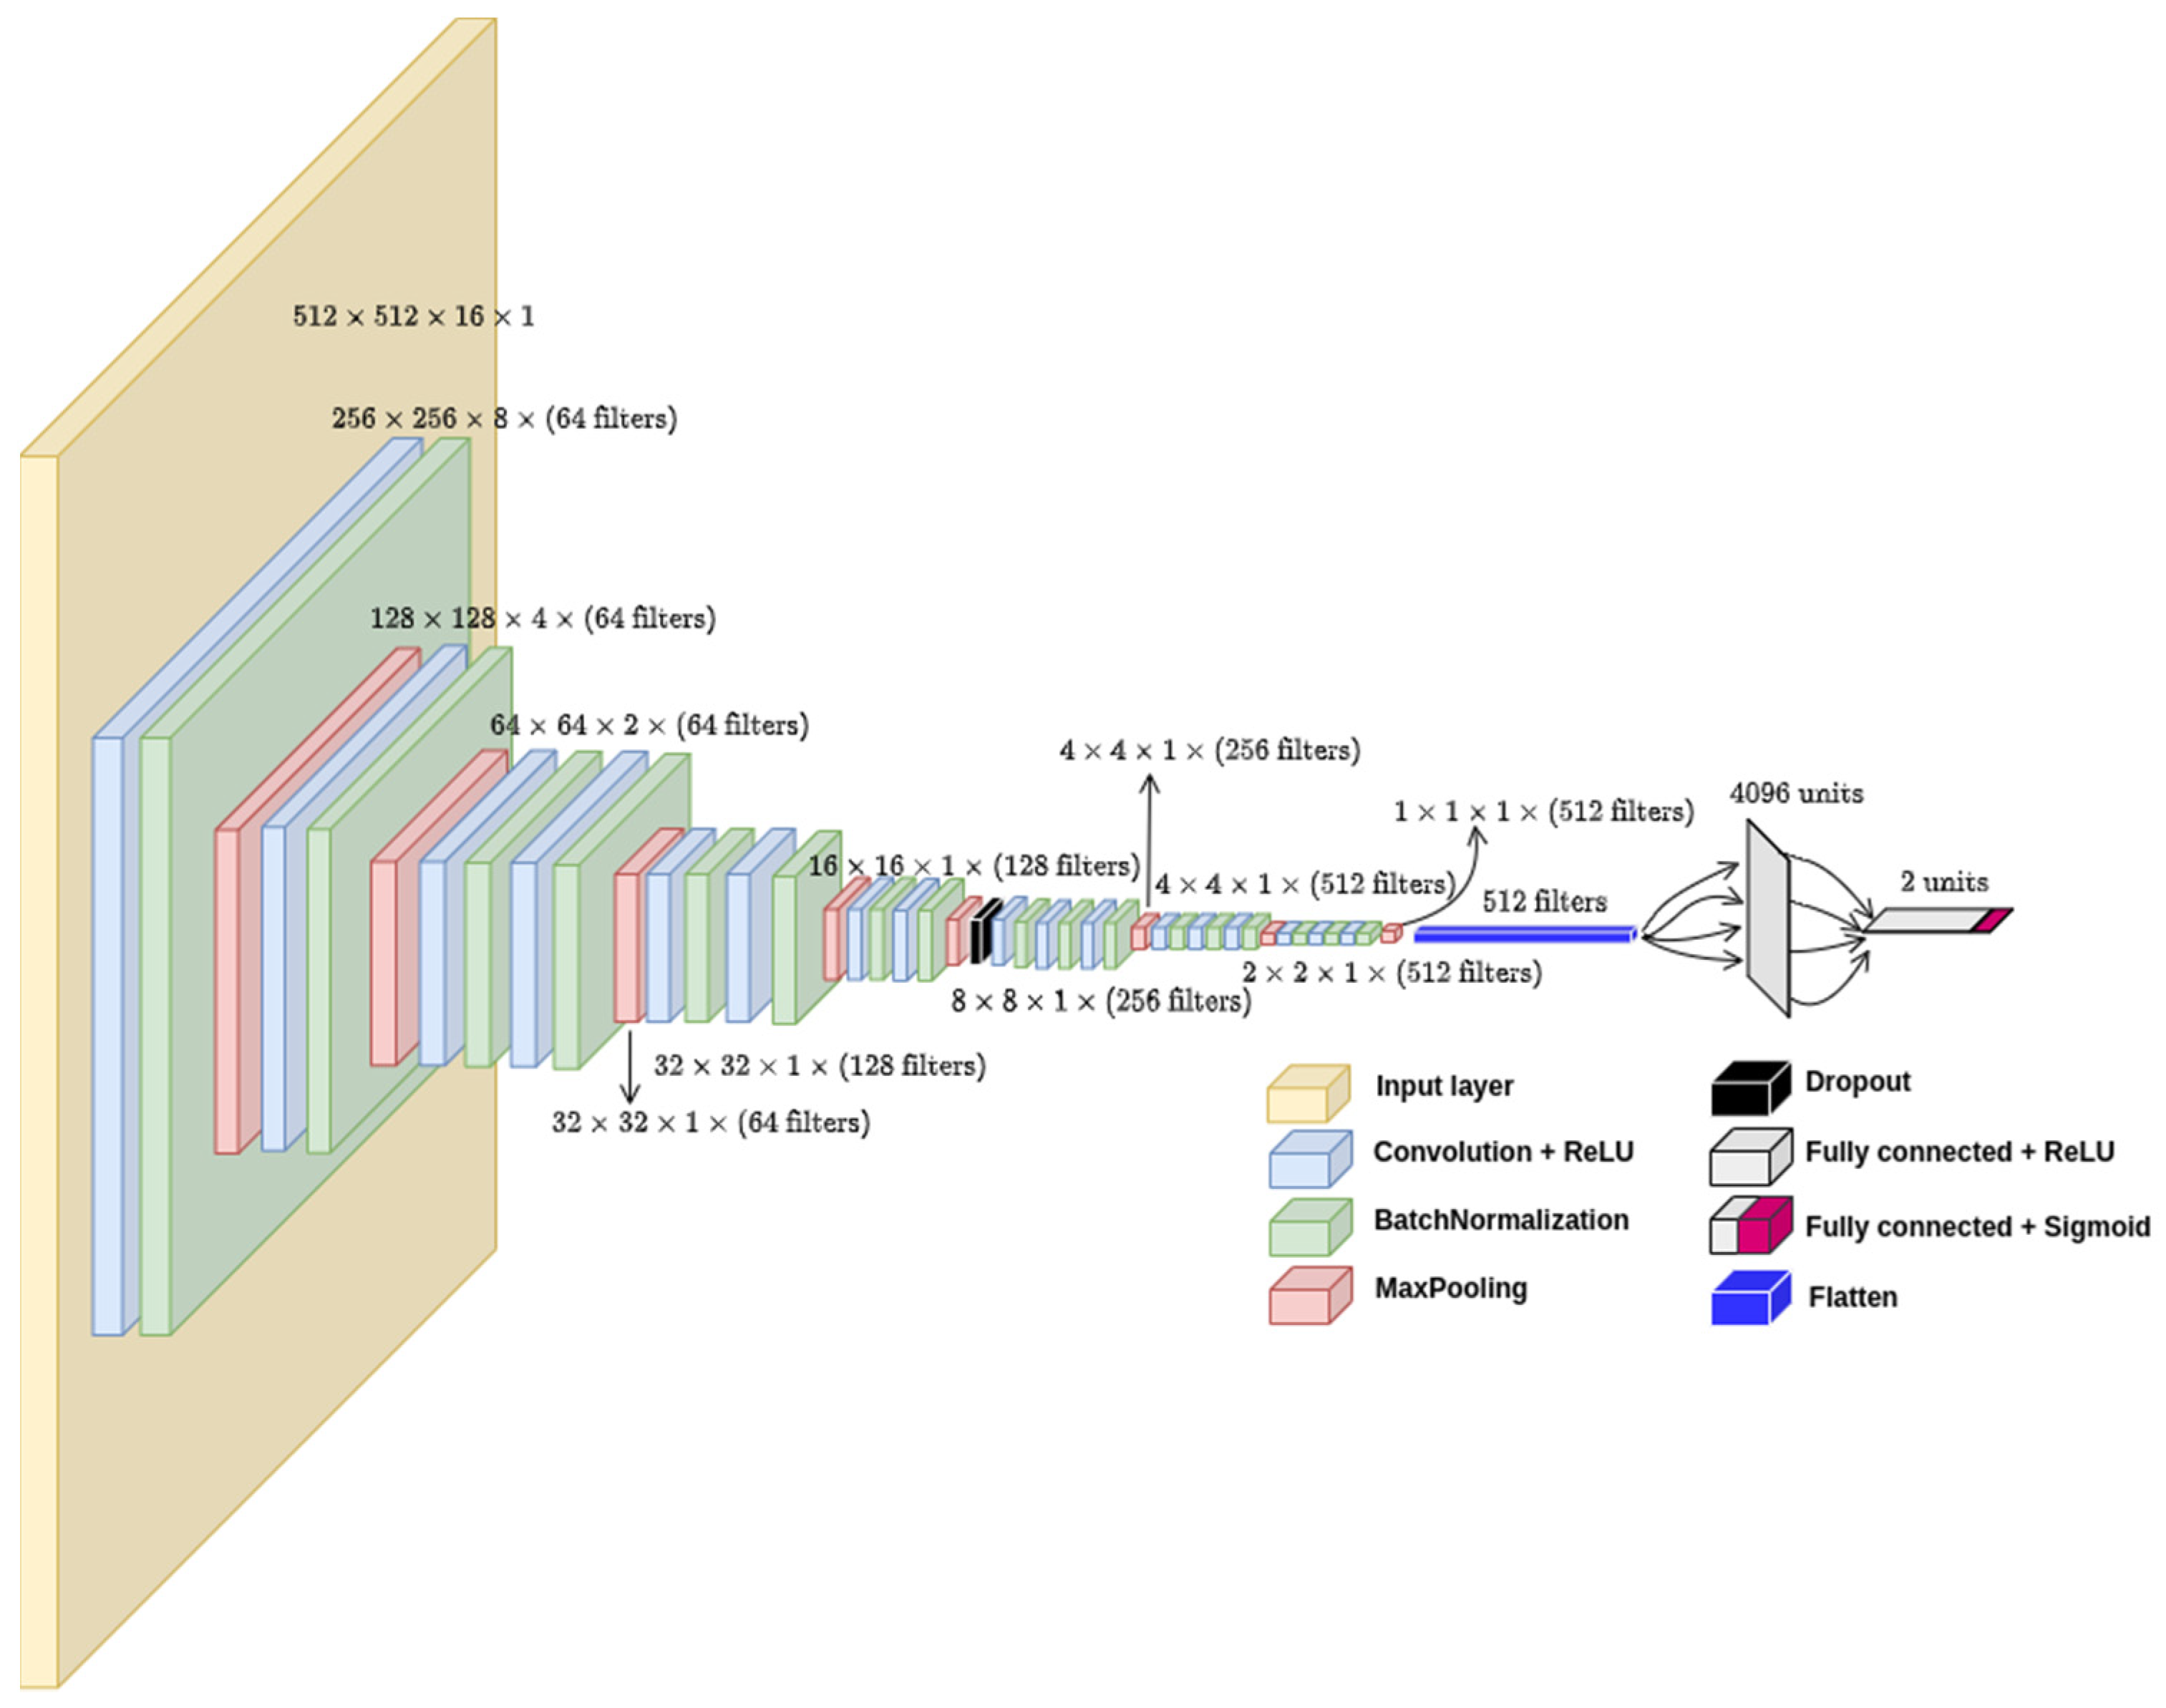
In our model, there are 17 convolutional layers split into 5 convolutional blocks with different filter sizes, as can be seen in more detail in Figure 4.
The model takes CT slices as input and combines the features extracted from the slices in a sequence of convolutions and pooling operations. The number of input slices can vary. Typically, it can be 64, 32, or 16 slices. It requires an analysis and validation of the approach to select the lowest number of slices without losing accuracy, which will be presented in the following section.
There are more pooling layers in the two initial convolutional blocks than in the final ones. We chose this approach to reduce the tensors size and fit them in the available GPU memory. We also added batch normalization layers after every convolutional layer and a single dropout layer with a 0.5 dropout rate to enhance the training performance and prevent overfitting. The final feature map runs through two FC layers, the first with 4096 neurons and the second being the output layer with a sigmoid activation function to generate a binary output, namely COVID-19 or non-COVID-19. All hidden layers are built with the rectified linear unit (ReLU) [43] activation function. The model had 47.3 million parameters, was trained in a computing node with four NVIDIA GPUs V100 32 GB SXM2, and took 9313 s to train 56 epochs.
2.5. Model Training
We randomly initiated the weights and trained the neural network with a batch size of 16 using the Adamax optimizer and learning rate of 10−3. We used early stopping with a patience of seven epochs based on the validation loss. During model development, 2000 samples were used for training and 1000 samples for validation as observed in Table 3.
In order to fine-tune the CNN architecture, we started the experiment with a different number of convolutional and pooling layers, following the VGG-16 pattern (increasing the filter size as the layers went deeper). Then, we tried different number of neurons in the FC layers and a sequence of three FC layers. Finally, we tried different regularization techniques:
- Batch normalization layer in different positions after the convolutional layers,
- Dropout layers in different positions and different dropout rates,
- L2 regularization in different layers, resulting in regularizations to the fourth, eleventh, and fourteenth convolutional layers and to the penultimate FC layer.
All the experiments were performed with the keras tuner API [44], which is an easy-to-use, scalable, hyperparameter optimization framework. We performed the hyperparameter search with the built-in hyperband optimization algorithm [45].
We used two datasets for model assessment: (1) data from Medical School of the University of São Paulo and (2) data randomly taken from the full dataset. Both test sets were balanced (50% for each class: COVID-19, non-COVID-19). We reached a plateau for model assessment after experimenting with several different hyperparameters settings and model architectures.
In order to evaluate the model variability in different portions of the data, we used a stratified 10-fold cross-validation on the 3000 samples. Finally, we combined the training and validation datasets into a single training dataset and added data augmentation to each of the 3000 examples, bringing the total number of samples in the training dataset to 6000, as observed in Table 4.
Five different data augmentation techniques were tried: vertical and horizontal flip, changing brightness and contrast, shear, zoom-in and zoom-out, and small rotations. For each technique, we trained the model with a pair-wise combination of the 3000 original images with 3000 augmented images. Finally, we combined all augmented images with the original images and found that augmented rotated images showed the best results. In this technique, every image suffered small rotations. The algorithm randomly rotates the images with one of the angles in the set (−15, −10, 10, 15). For the final training, there were neither validation data nor automatic early stoppage. We defined the number of epochs to train the algorithm as 56. It was the same number of epochs achieved for the best model weights reached during model development.
3. Results
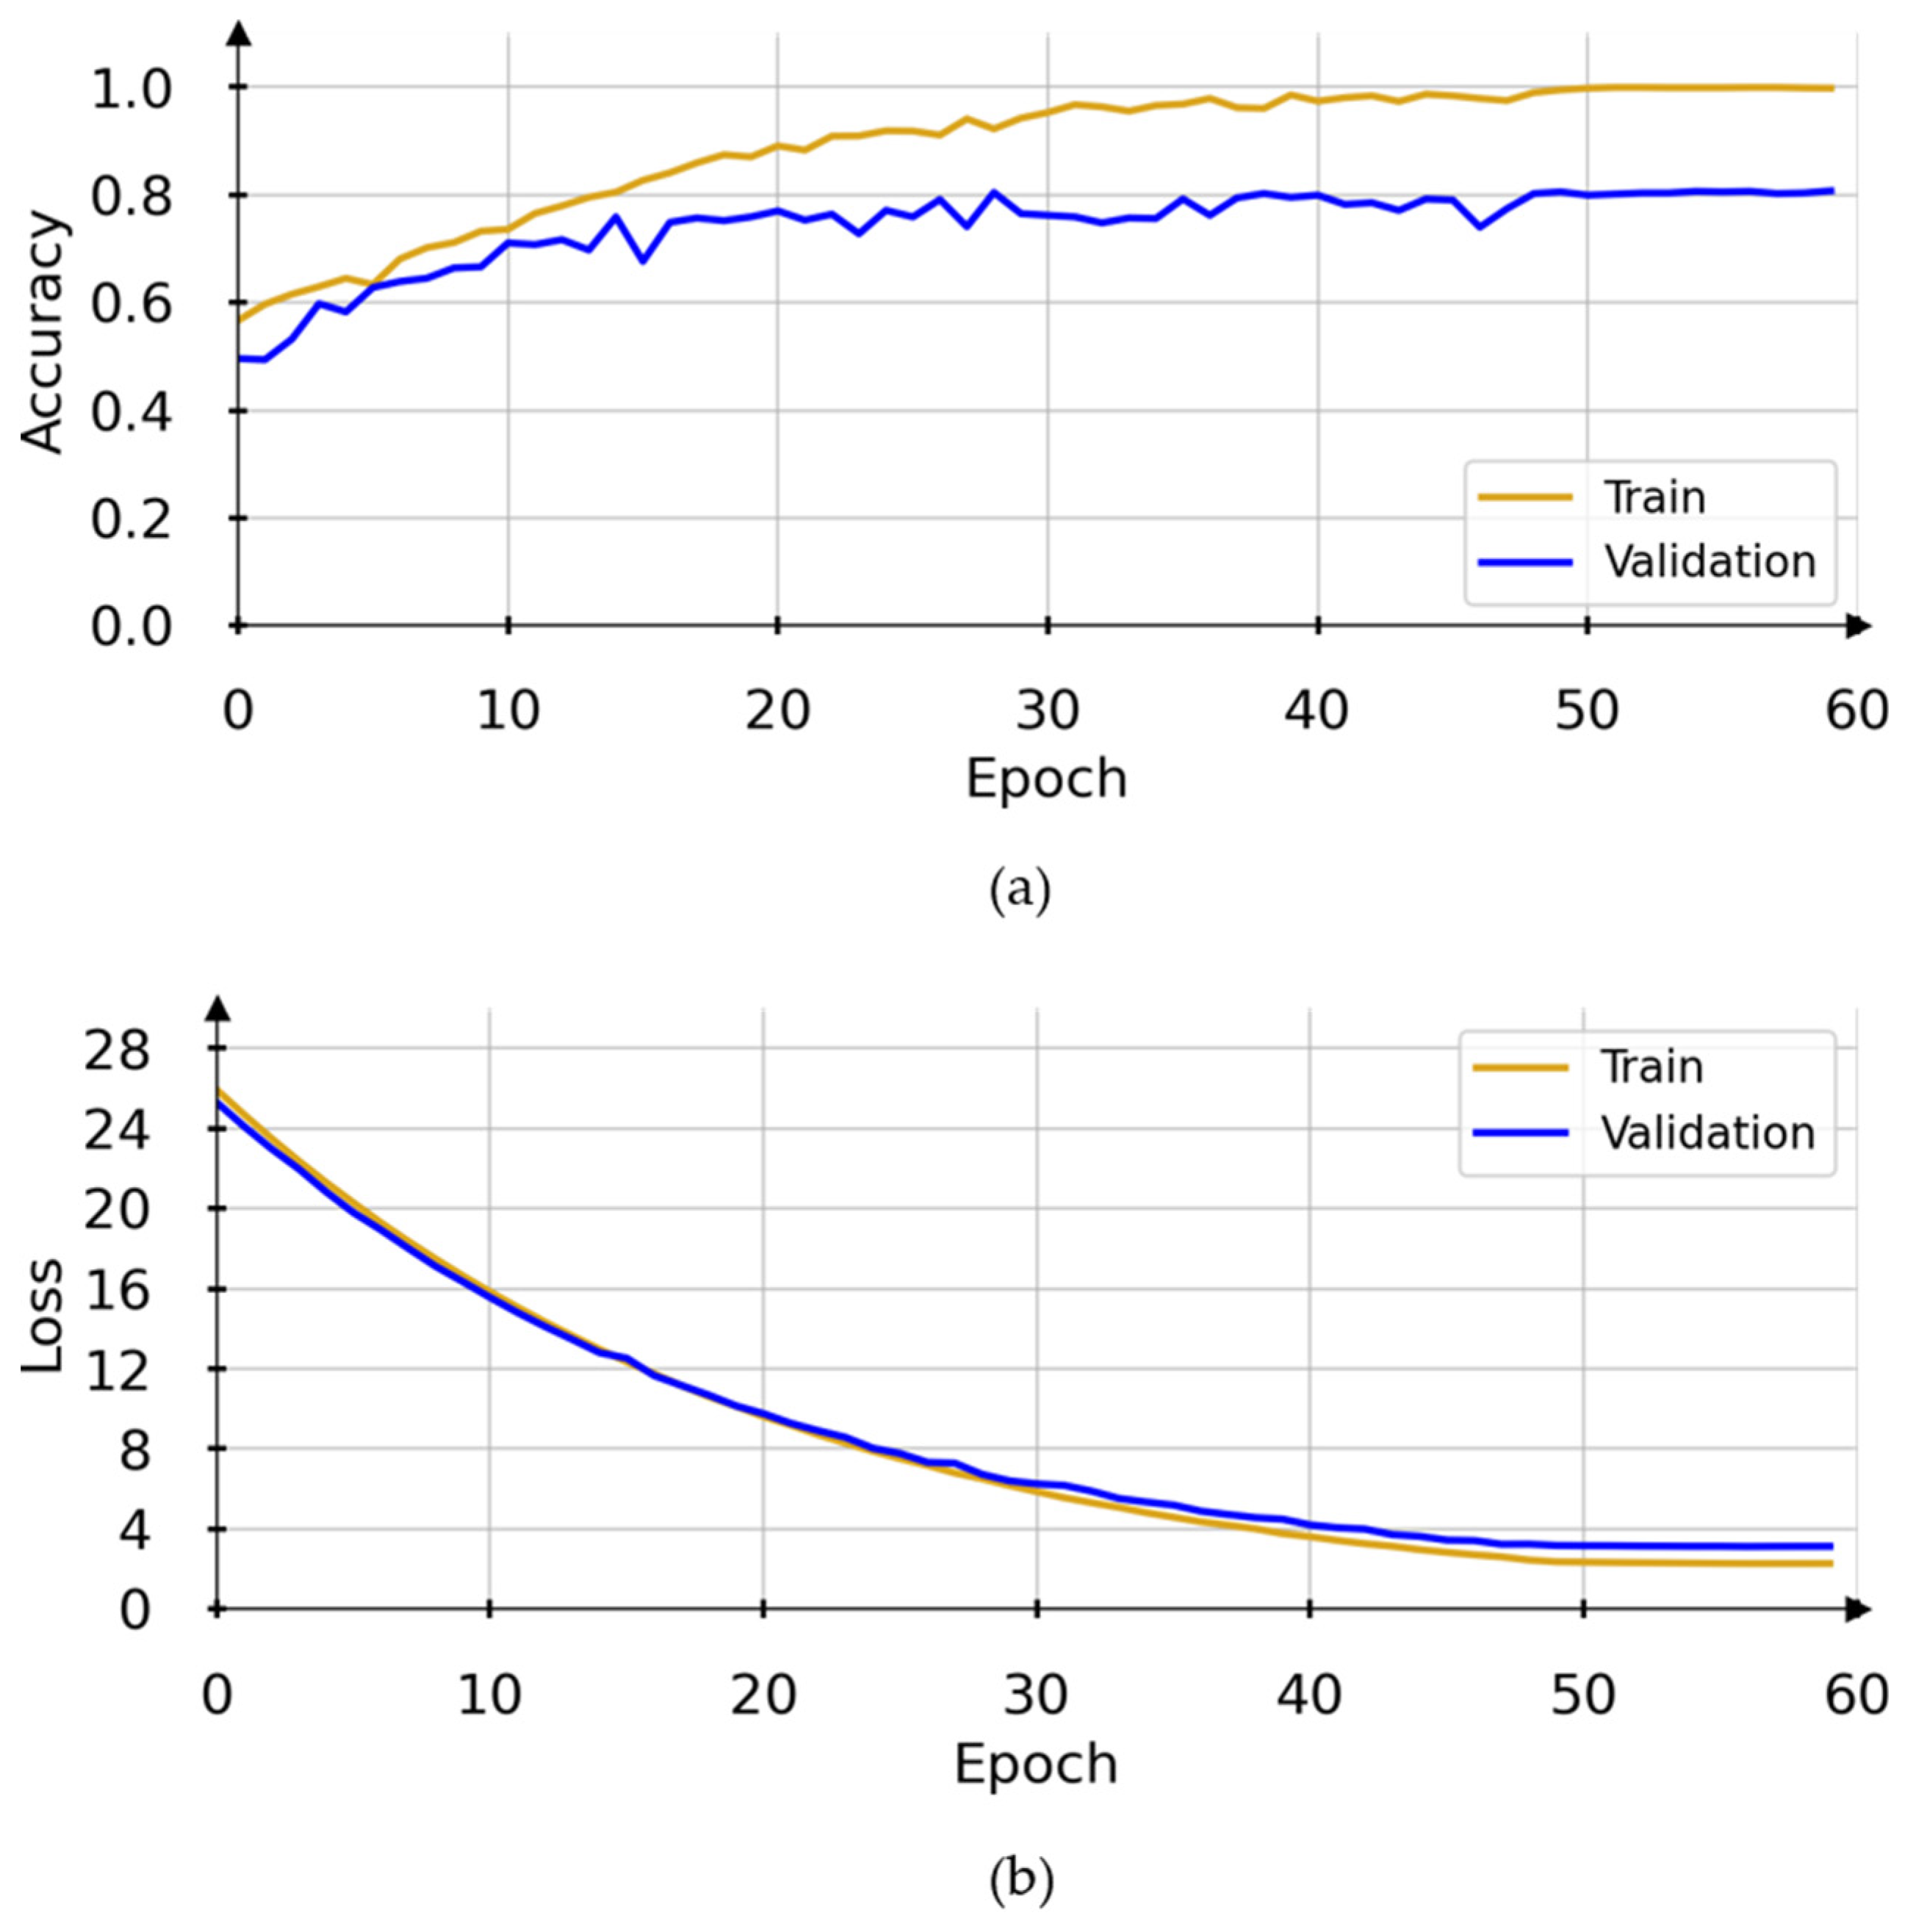
After trying different hyperparameters setups throughout model development, we achieved the results presented on Figure 5. Notice that the validation curves reach an accuracy plateau around 0.80 by the 50th epoch. The model weights stabilize, and the accuracy for both training and validation data show little changes. The loss for the training and validation sets also stabilizes around epoch 50.
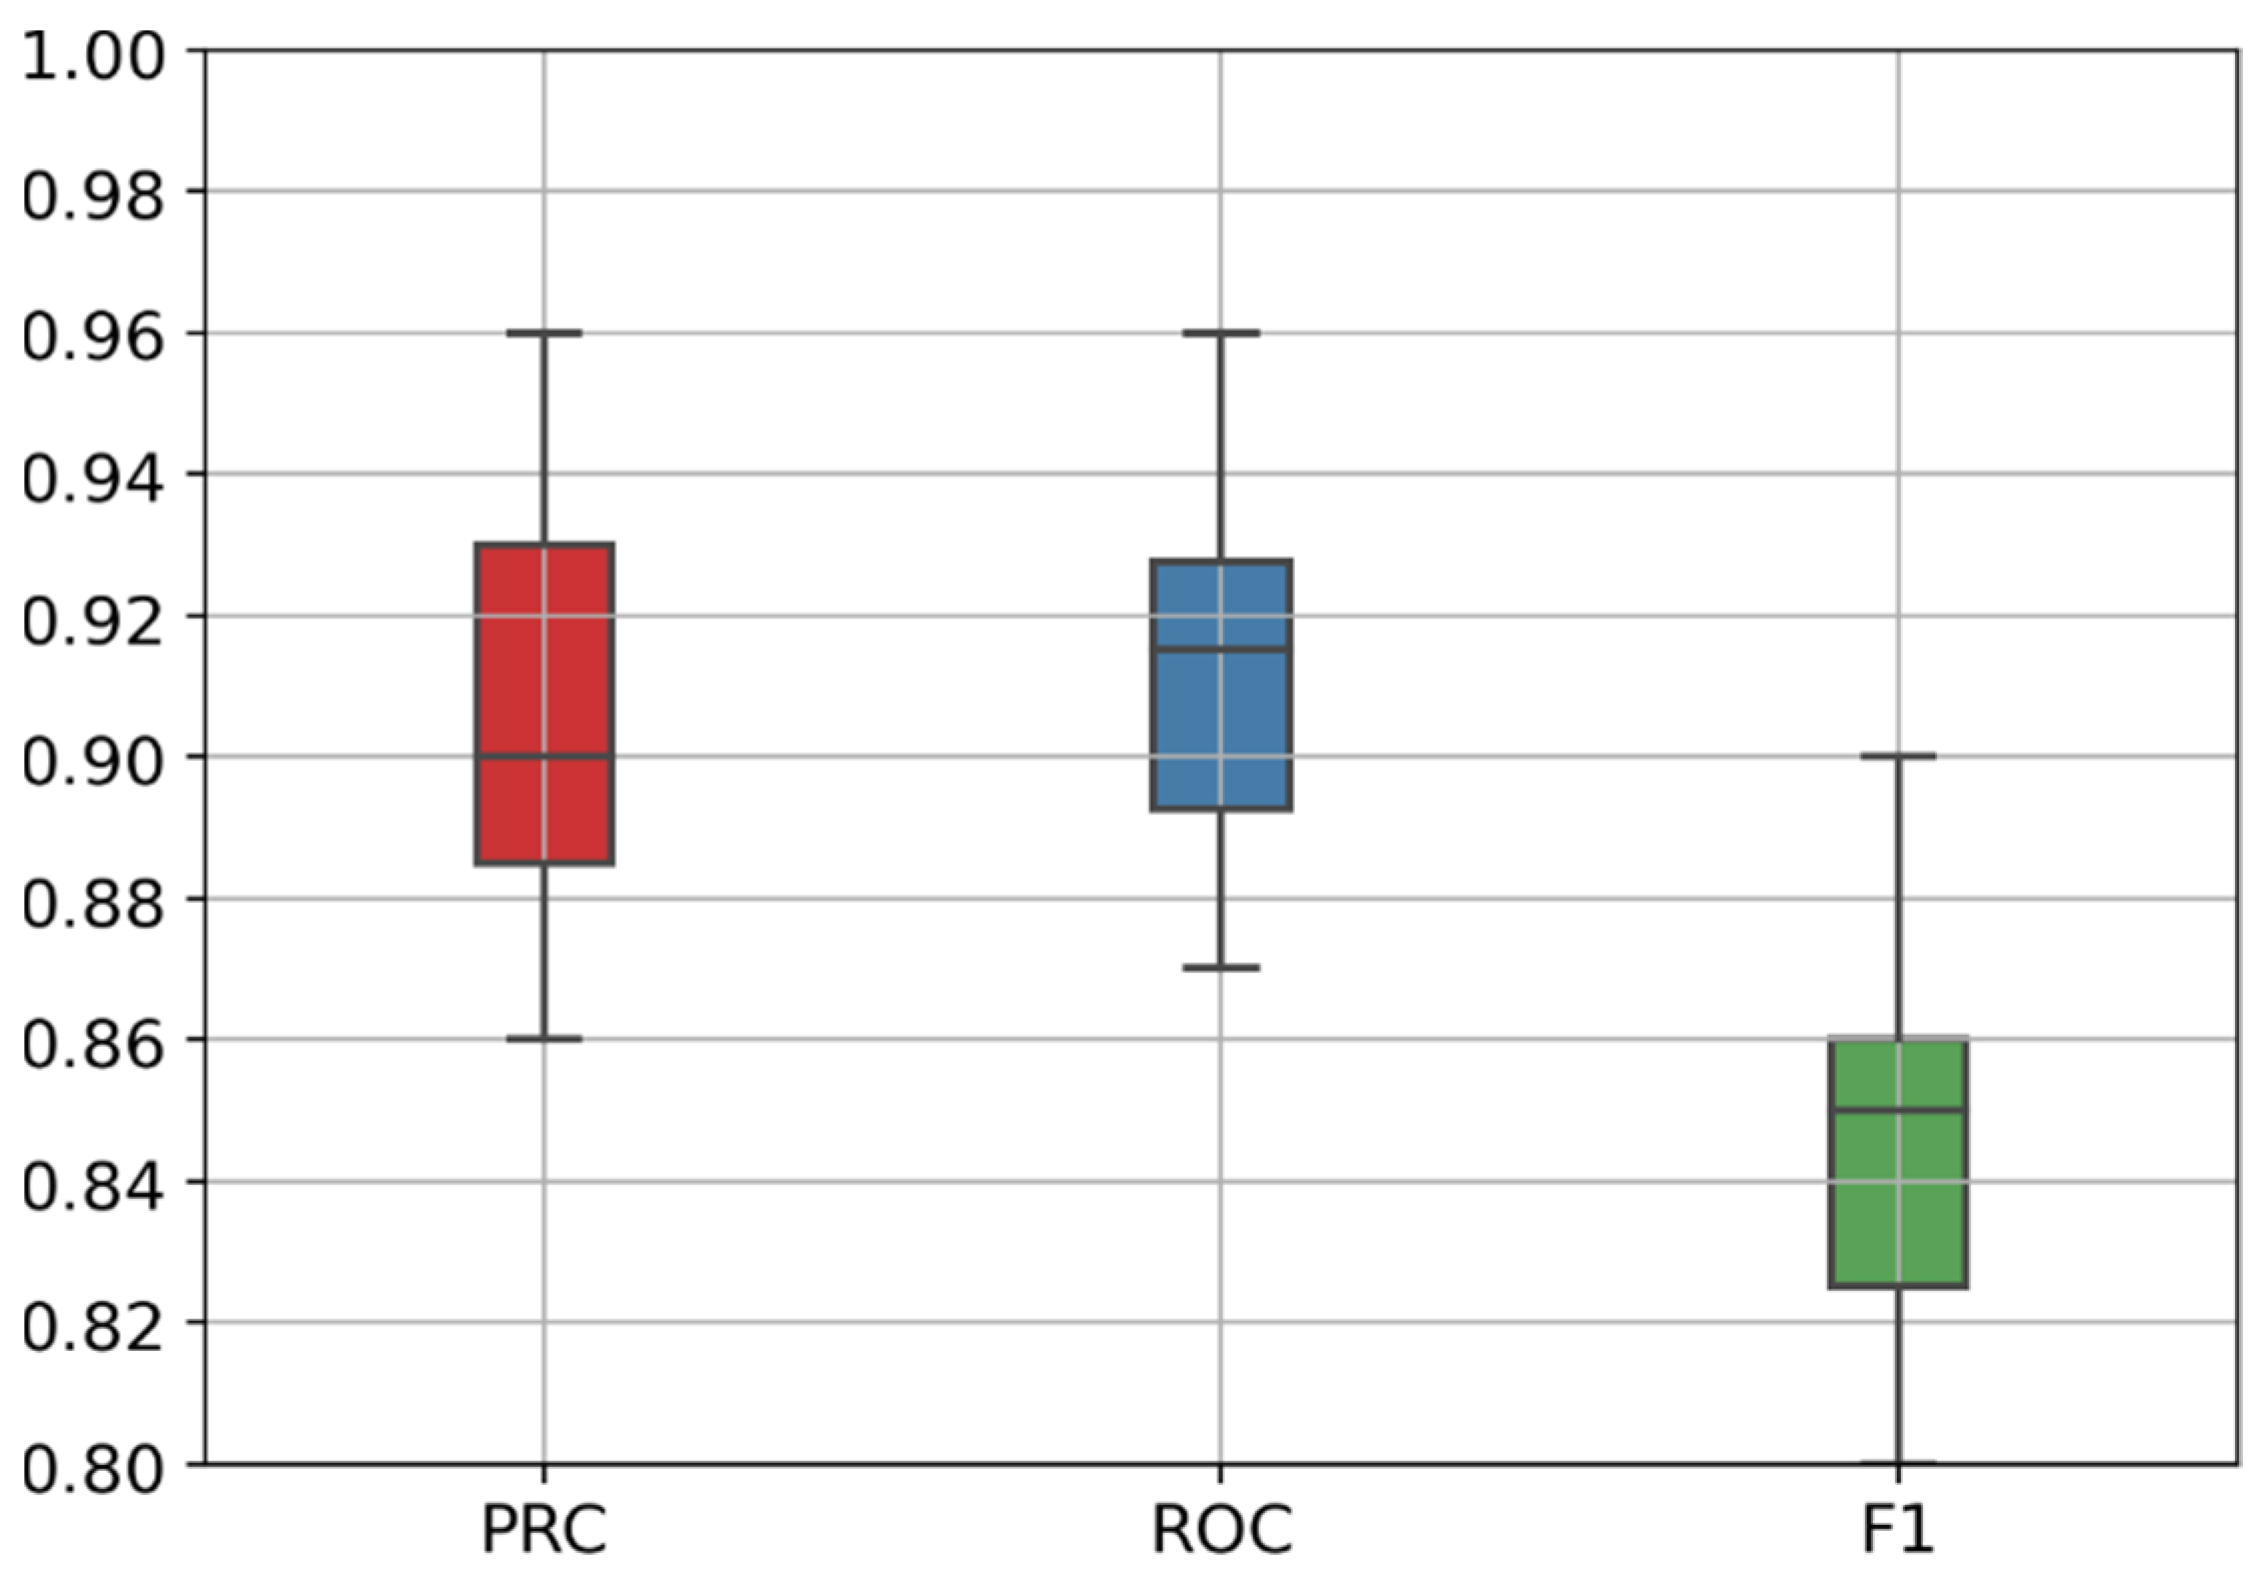
Figure 6 presents the boxplot of the stratified 10-fold cross-validation results, and Table 5 presents the evaluation results for each validation fold in more detail. We can observe that the PR-AUC varies from 0.86 to 0.96, the ROC-AUC varies from 0.87 to 0.96, and the F1-score varies from 0.80 to 0.90. Those results represent a good overall performance when compared to several recent related works [21,46,47].
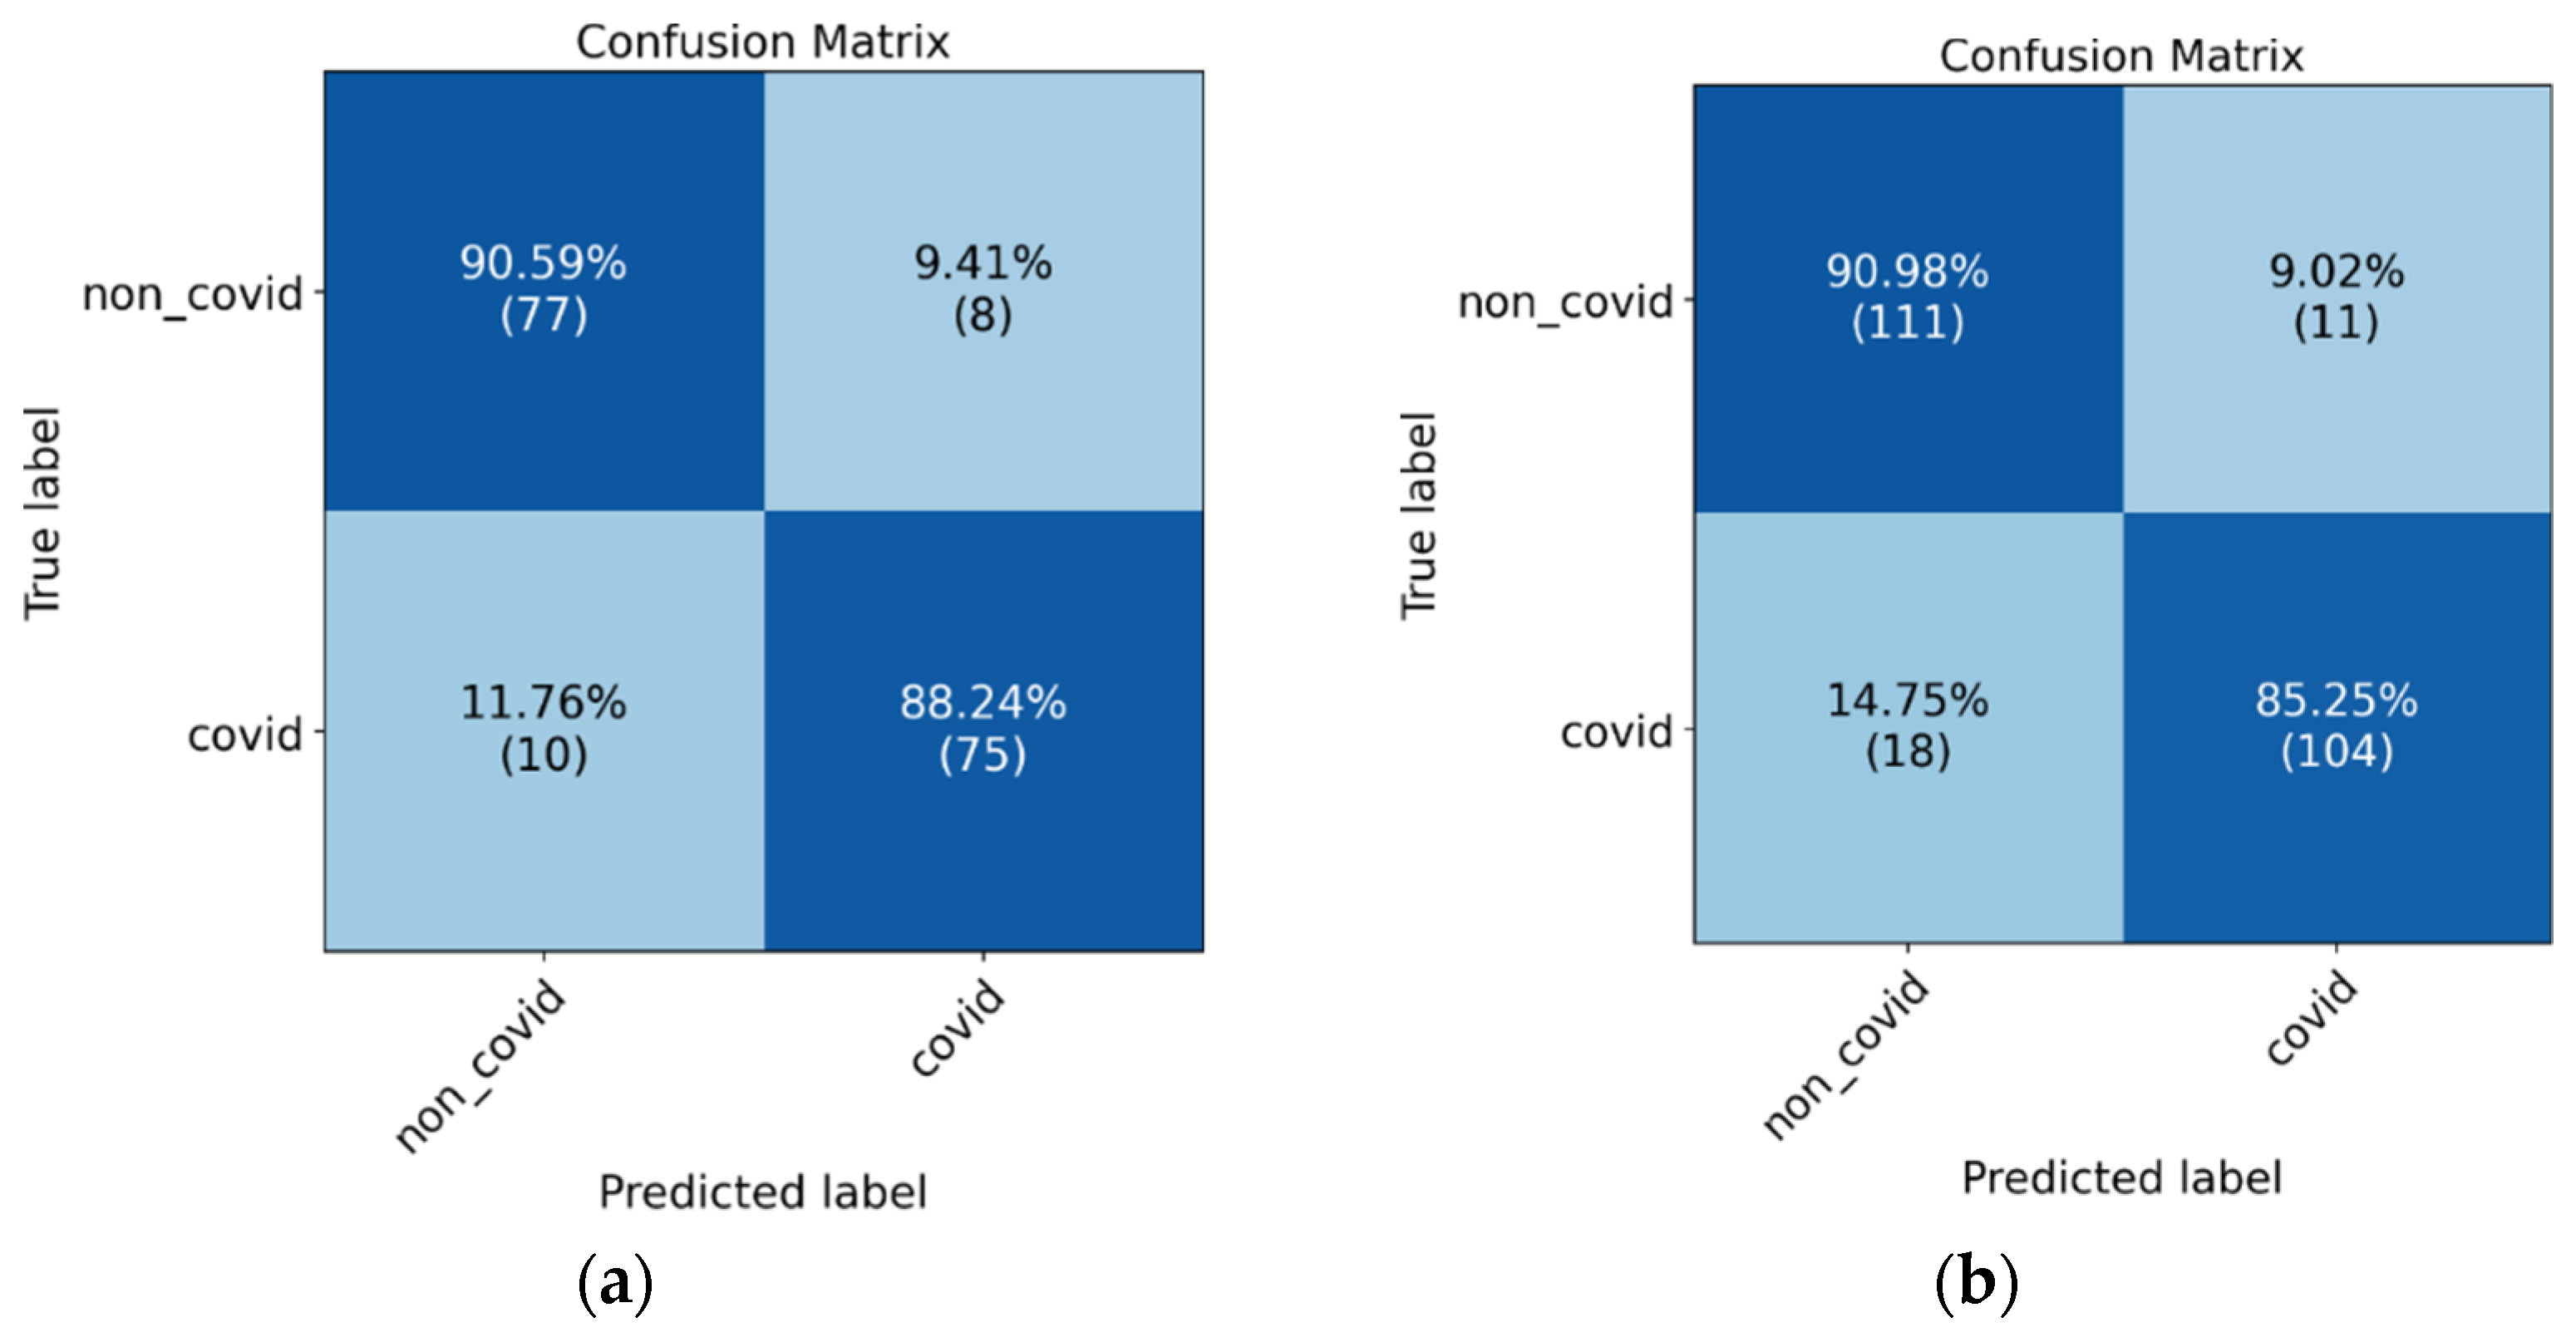
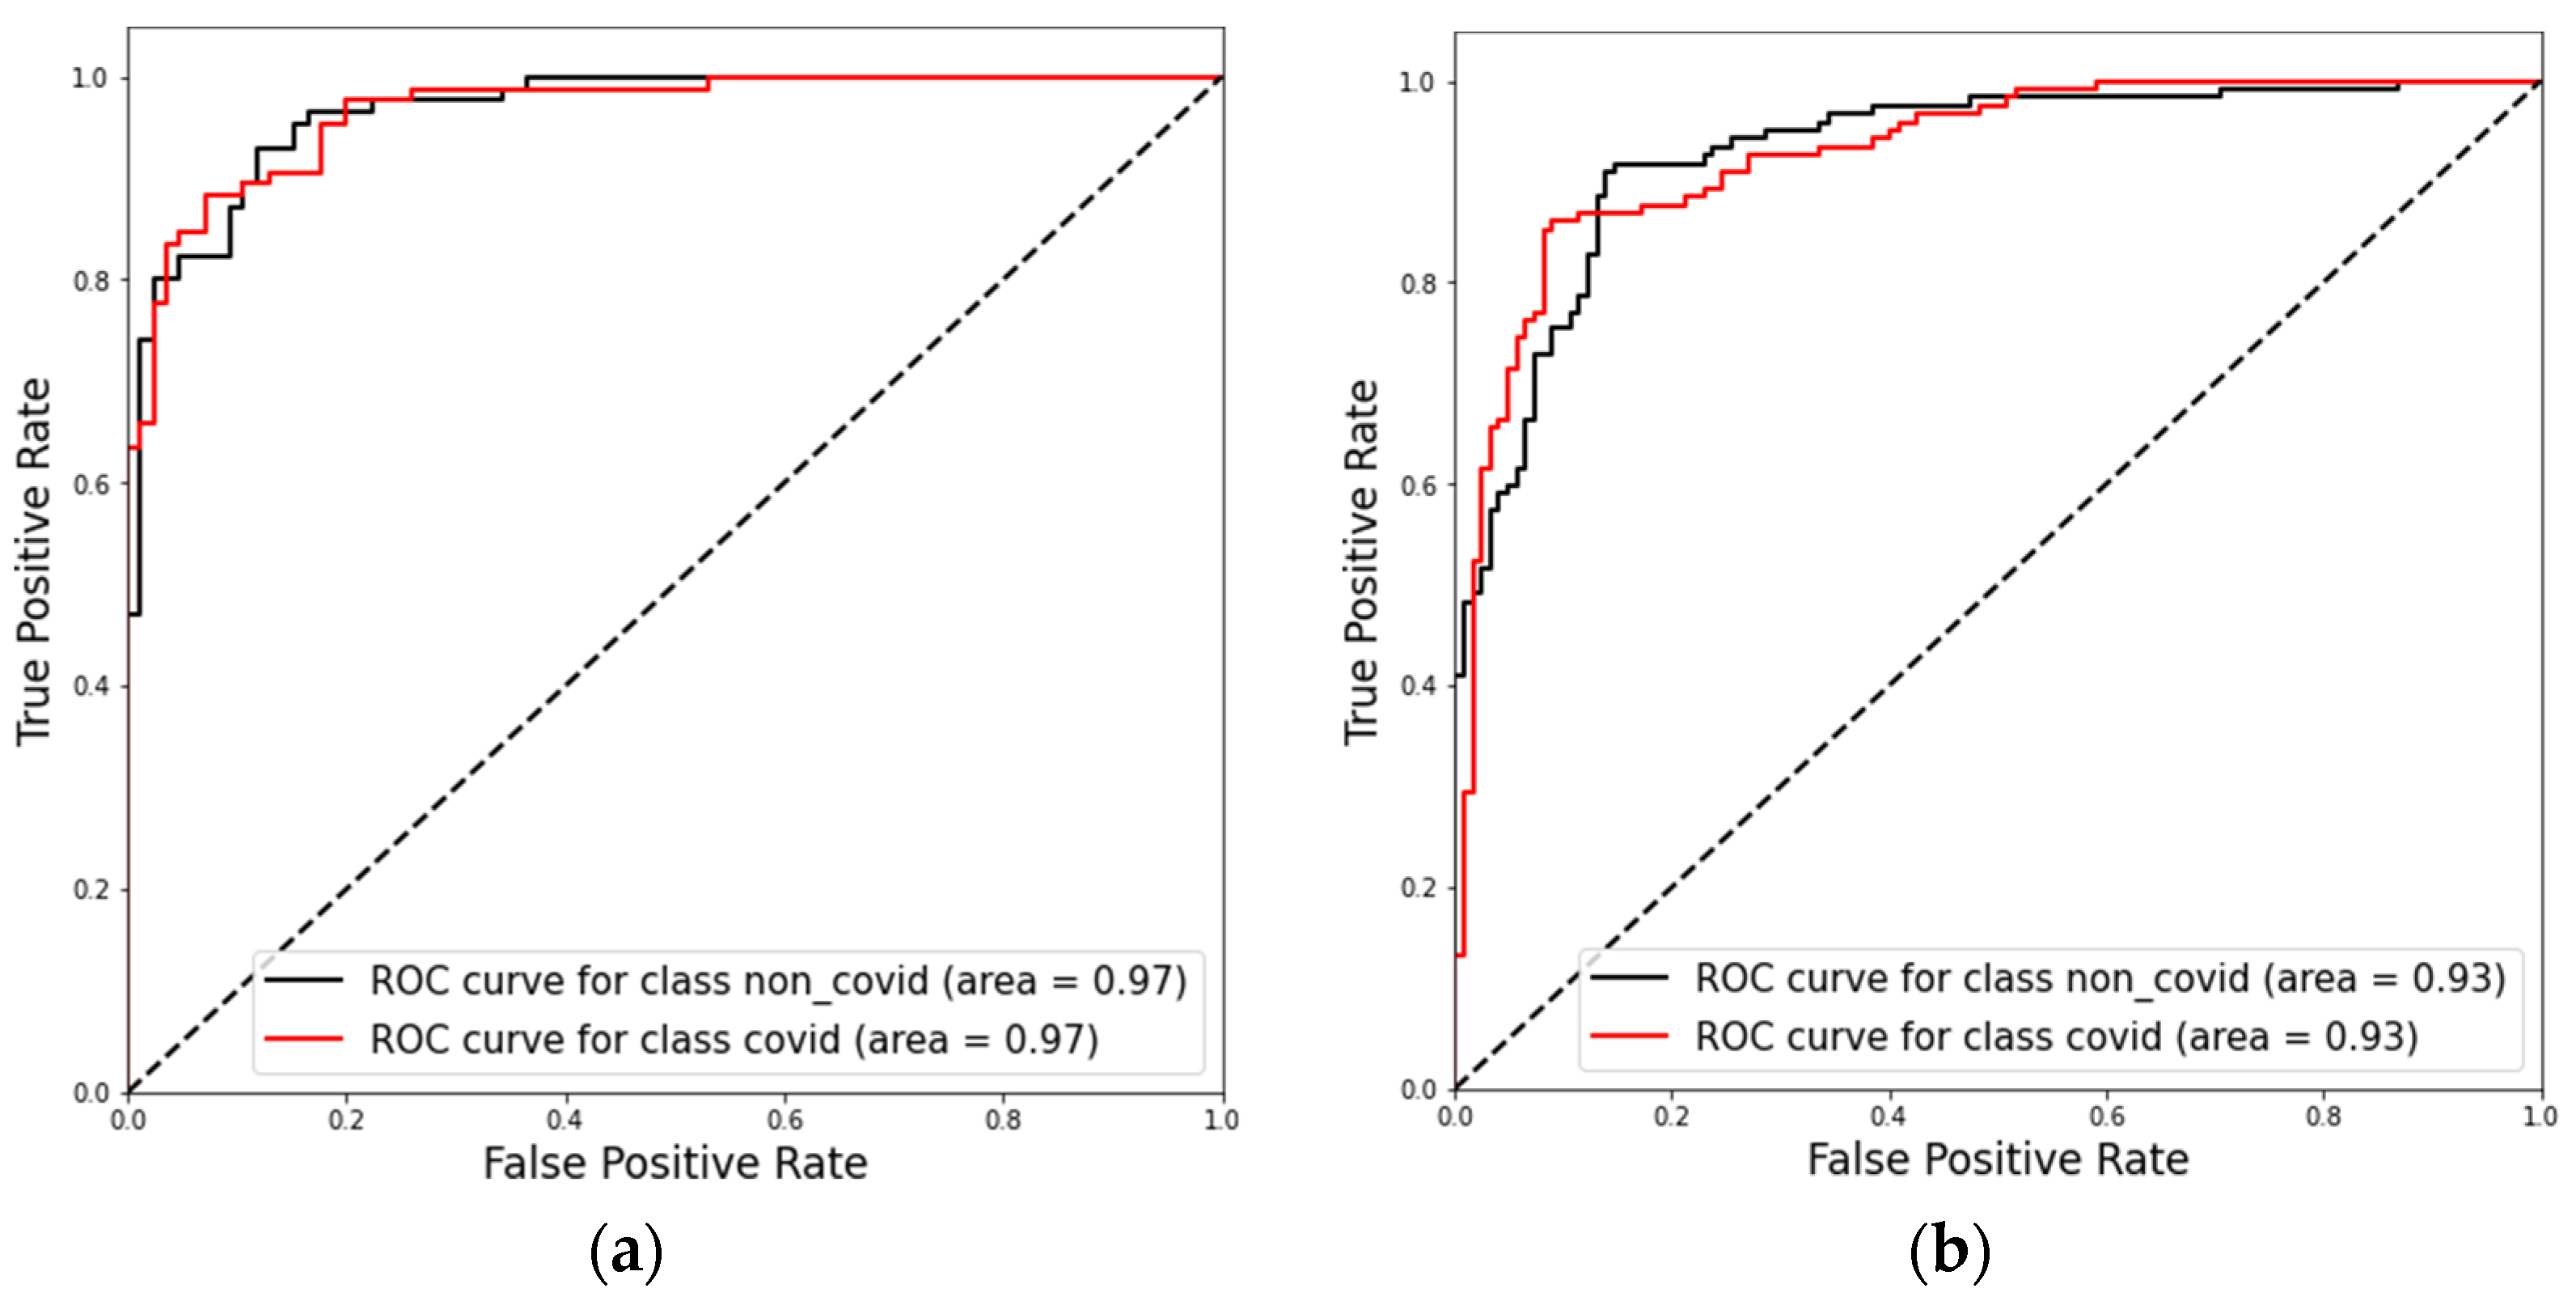
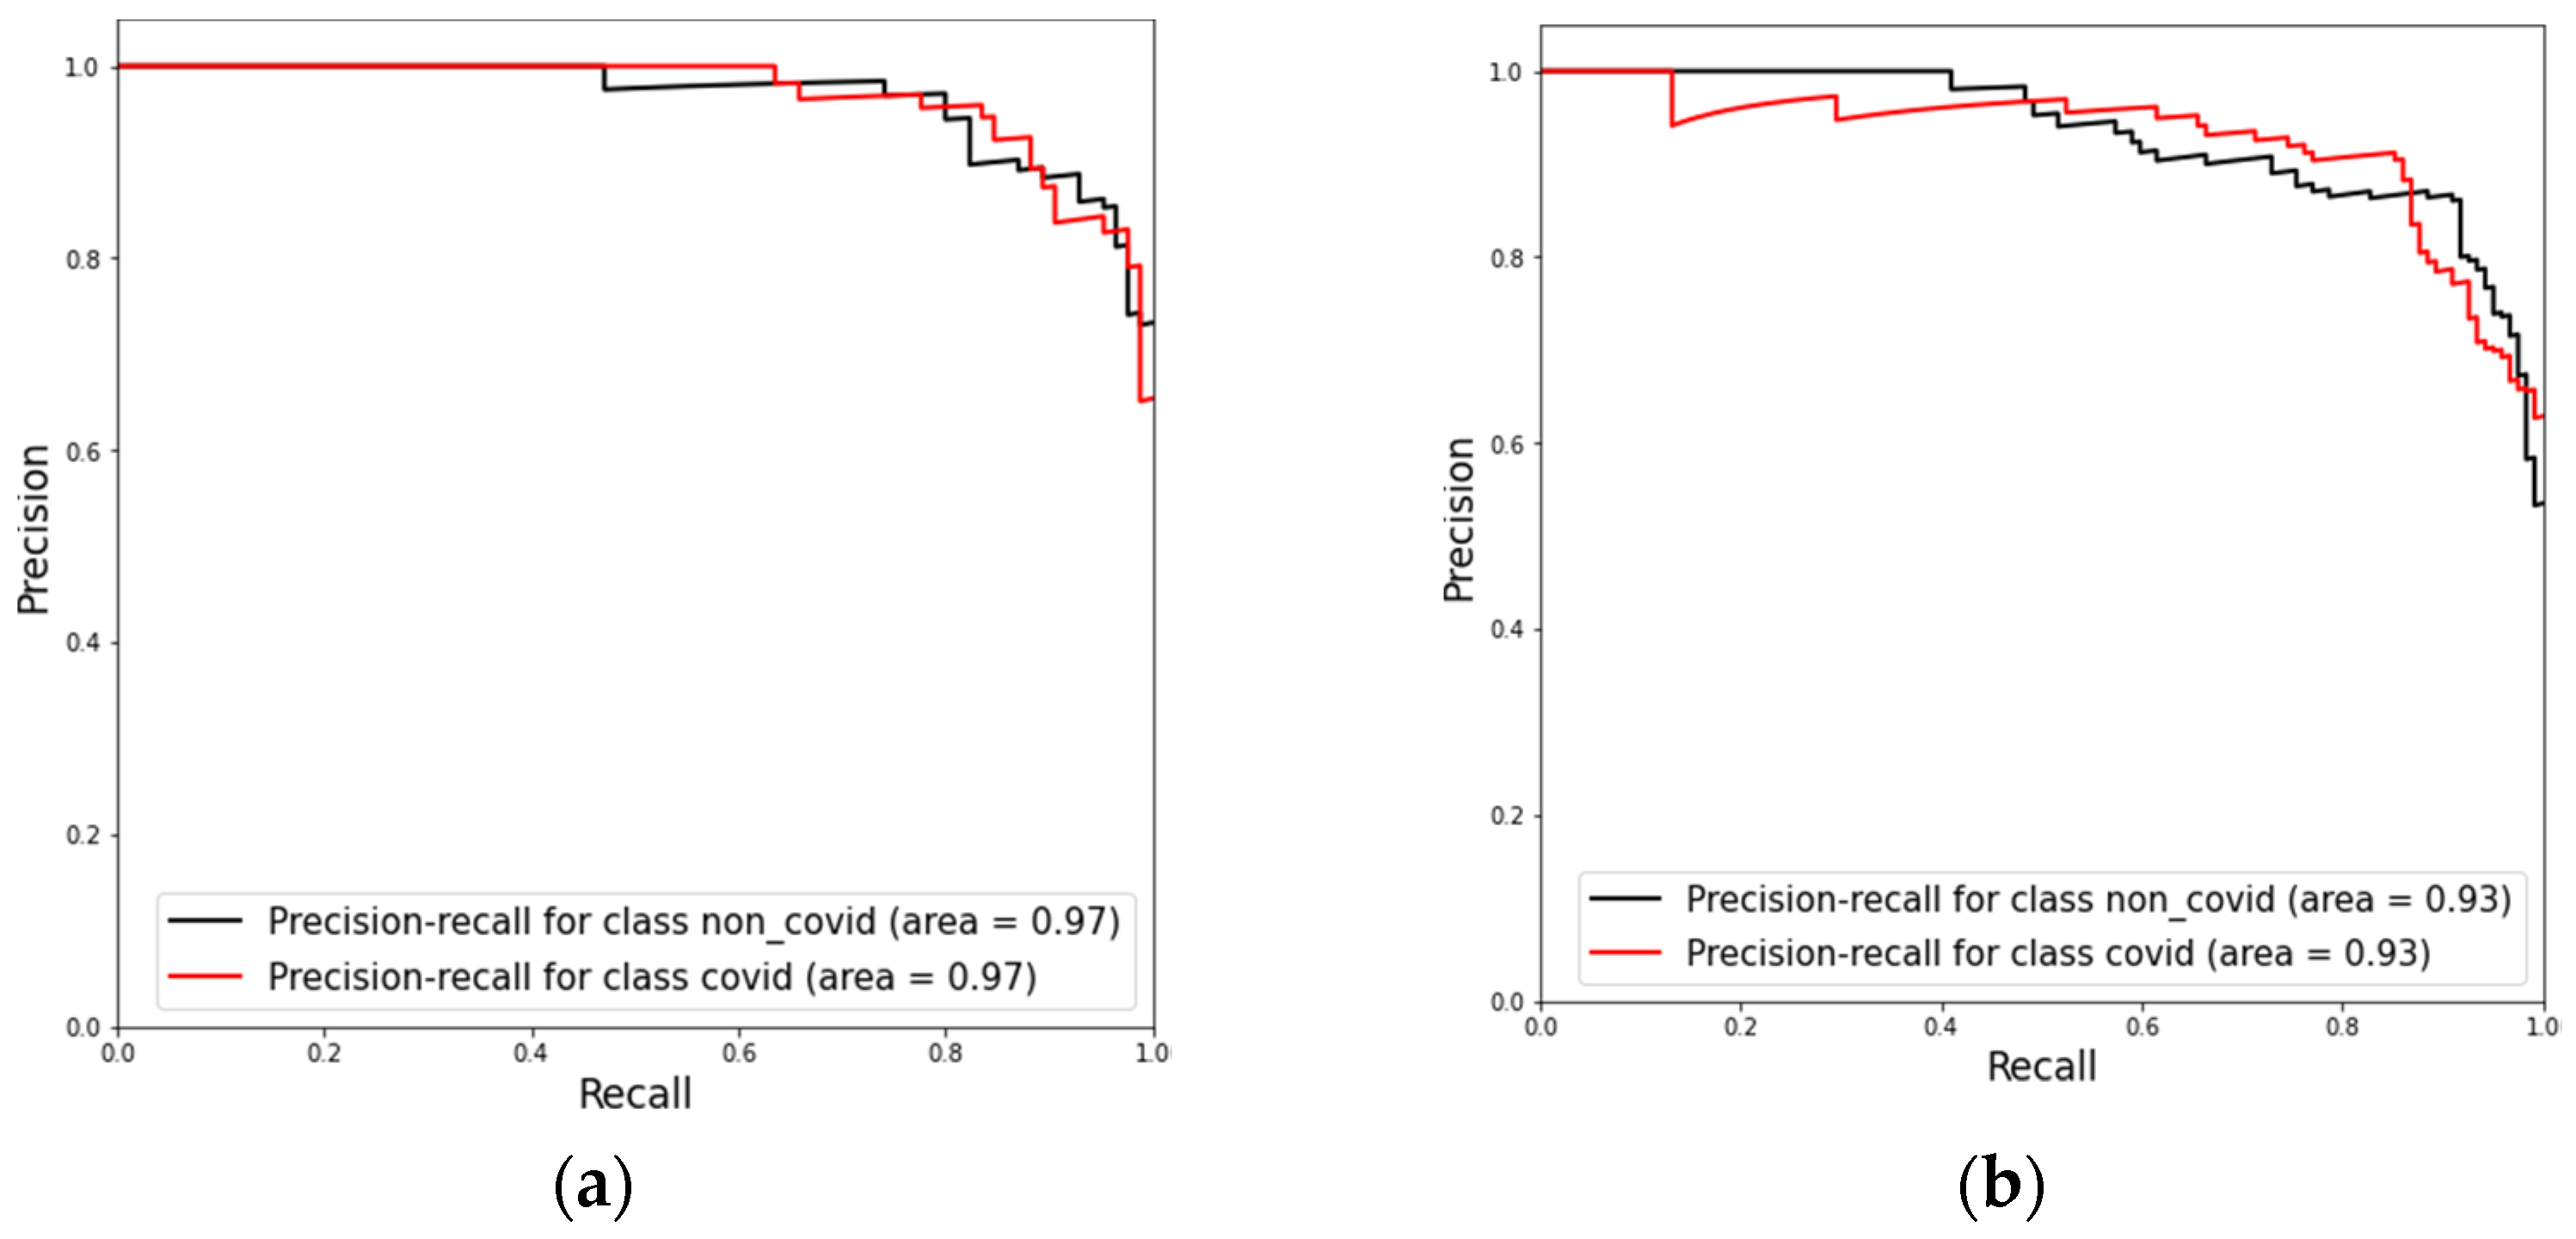
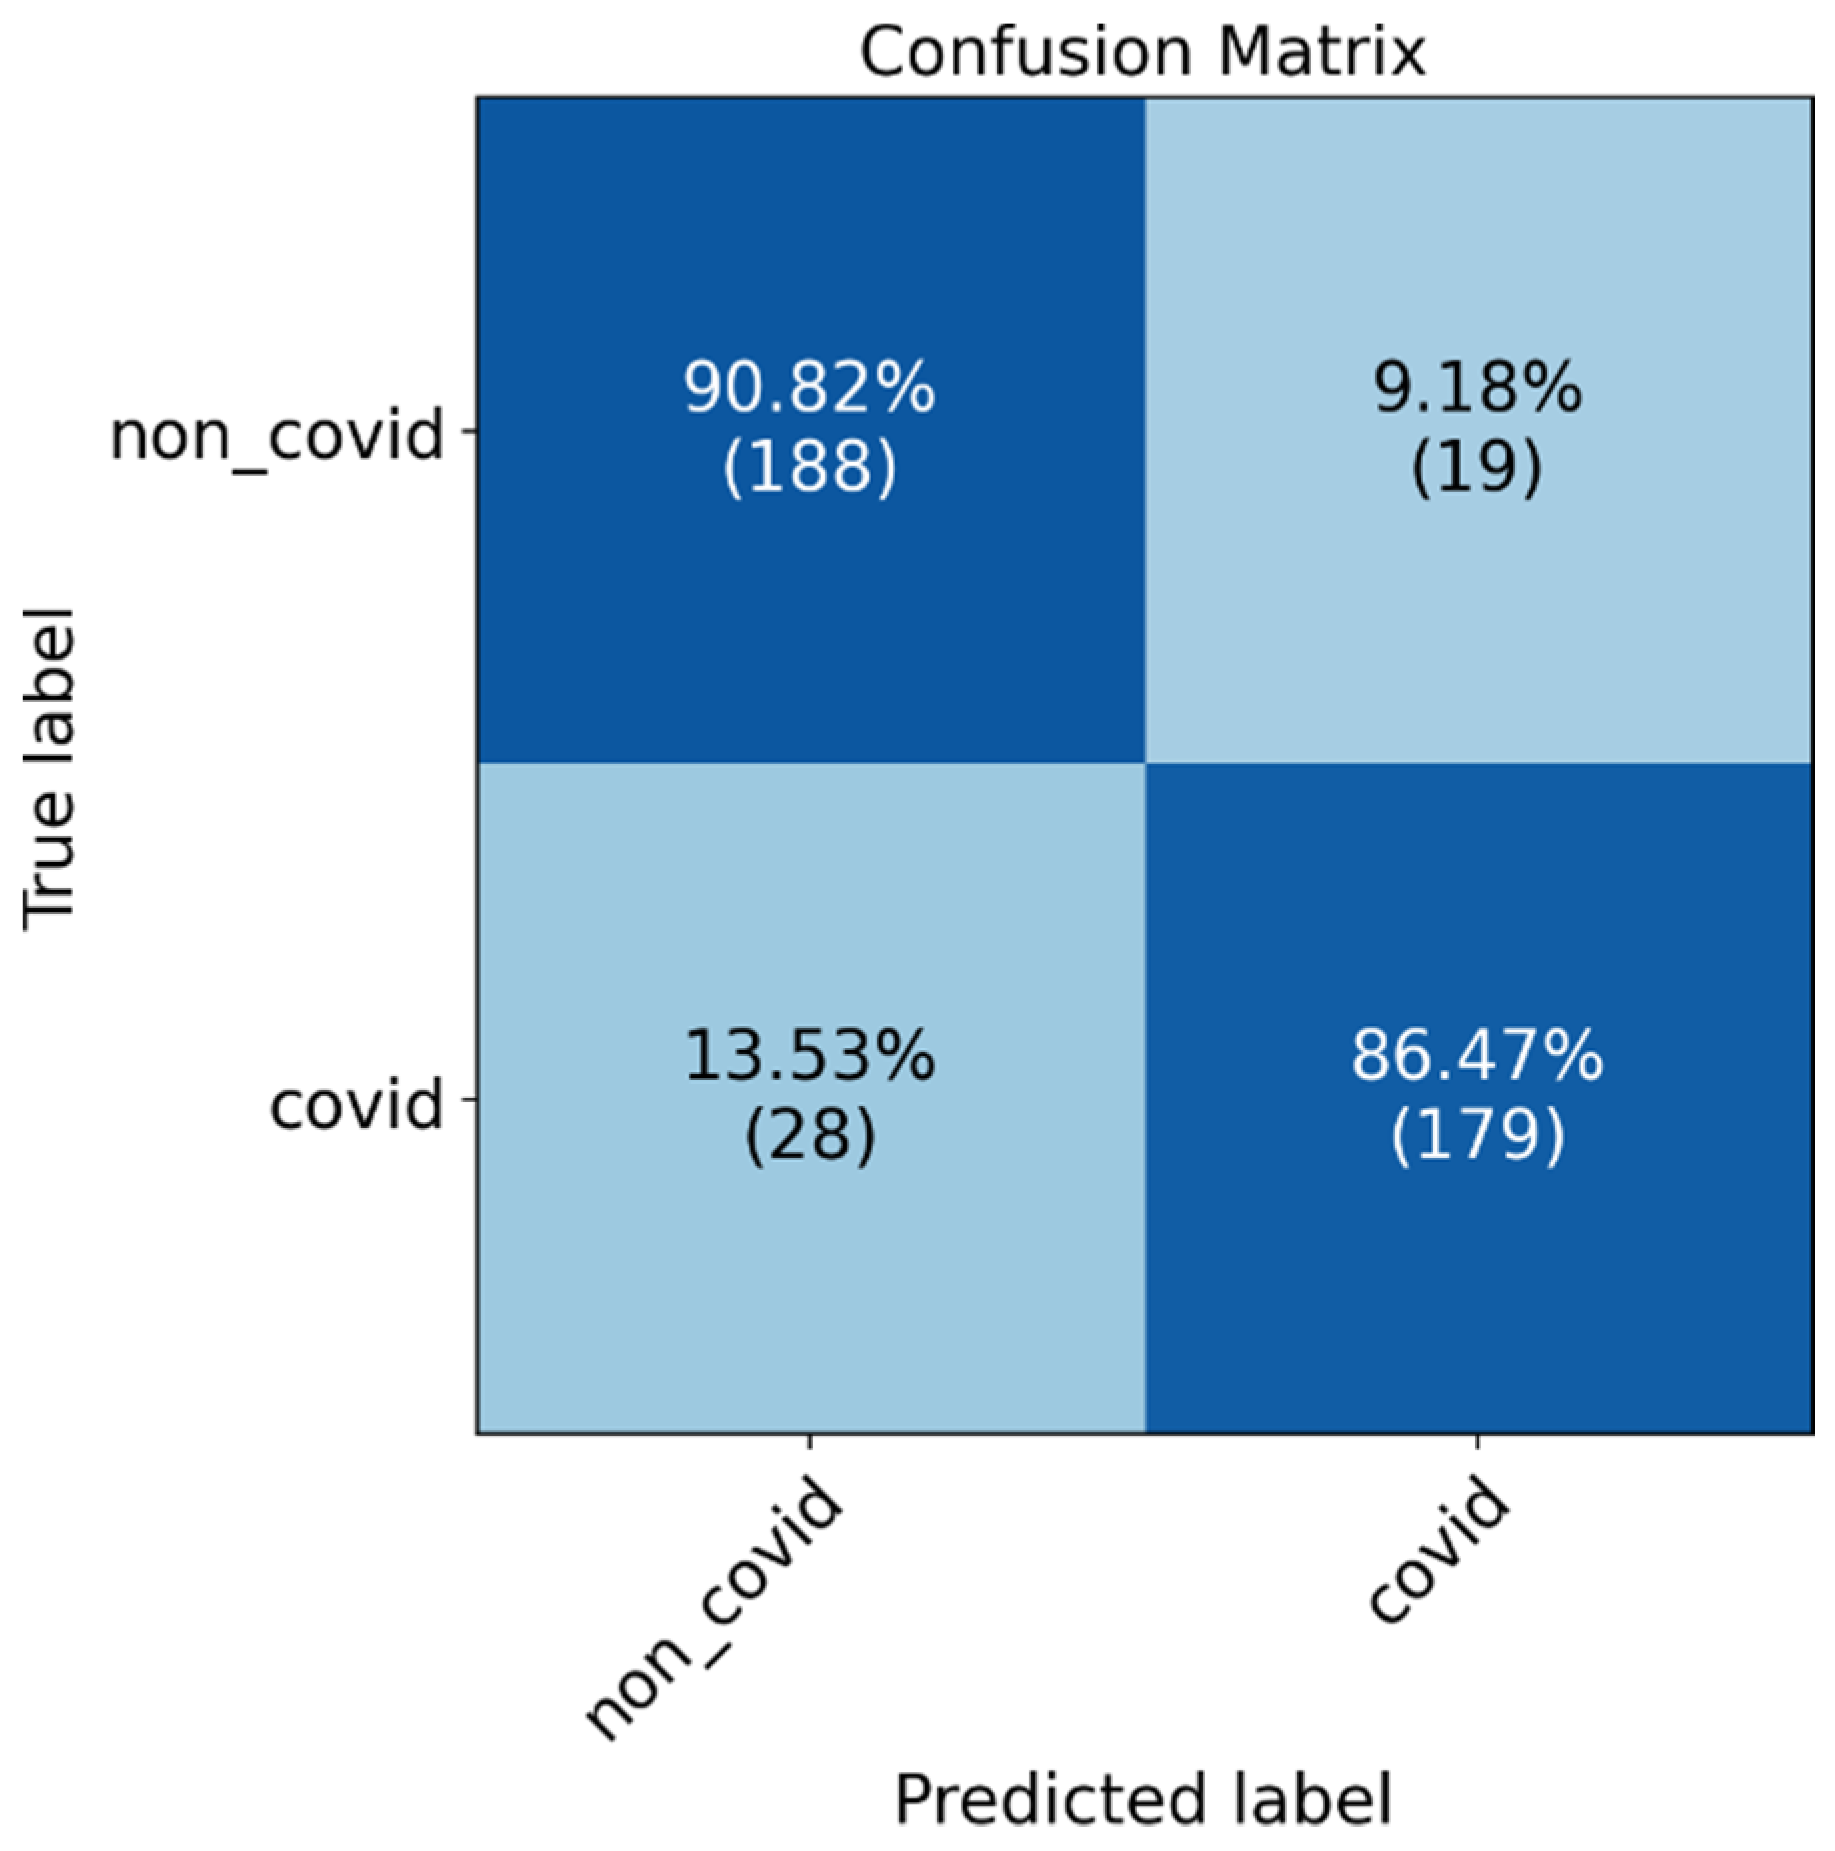
The confusion matrices in Figure 7 the ROC-AUC in Figure 8 and PR-AUC in Figure 9 show the model performance in both test datasets. For test dataset 1, the model assessment shows a recall of 88.51% (95% CI, 79.88% to 94.35%), specificity of 90.36% (95% CI, 81.89% to 95.75%), accuracy of 89.41% (95% CI, 83.78% to 93.60%), and ROC-AUC and PR-AUC of 97%. Test dataset 2 shows a recall of 85.25% (95% CI, 77.69% to 91.02%), specificity 90.98% (95% CI, 84.44% to 95.41%), accuracy of 88.11% (95% CI, 83.38% to 91.89%), and ROC-AUC and PR-AUC of 93%.
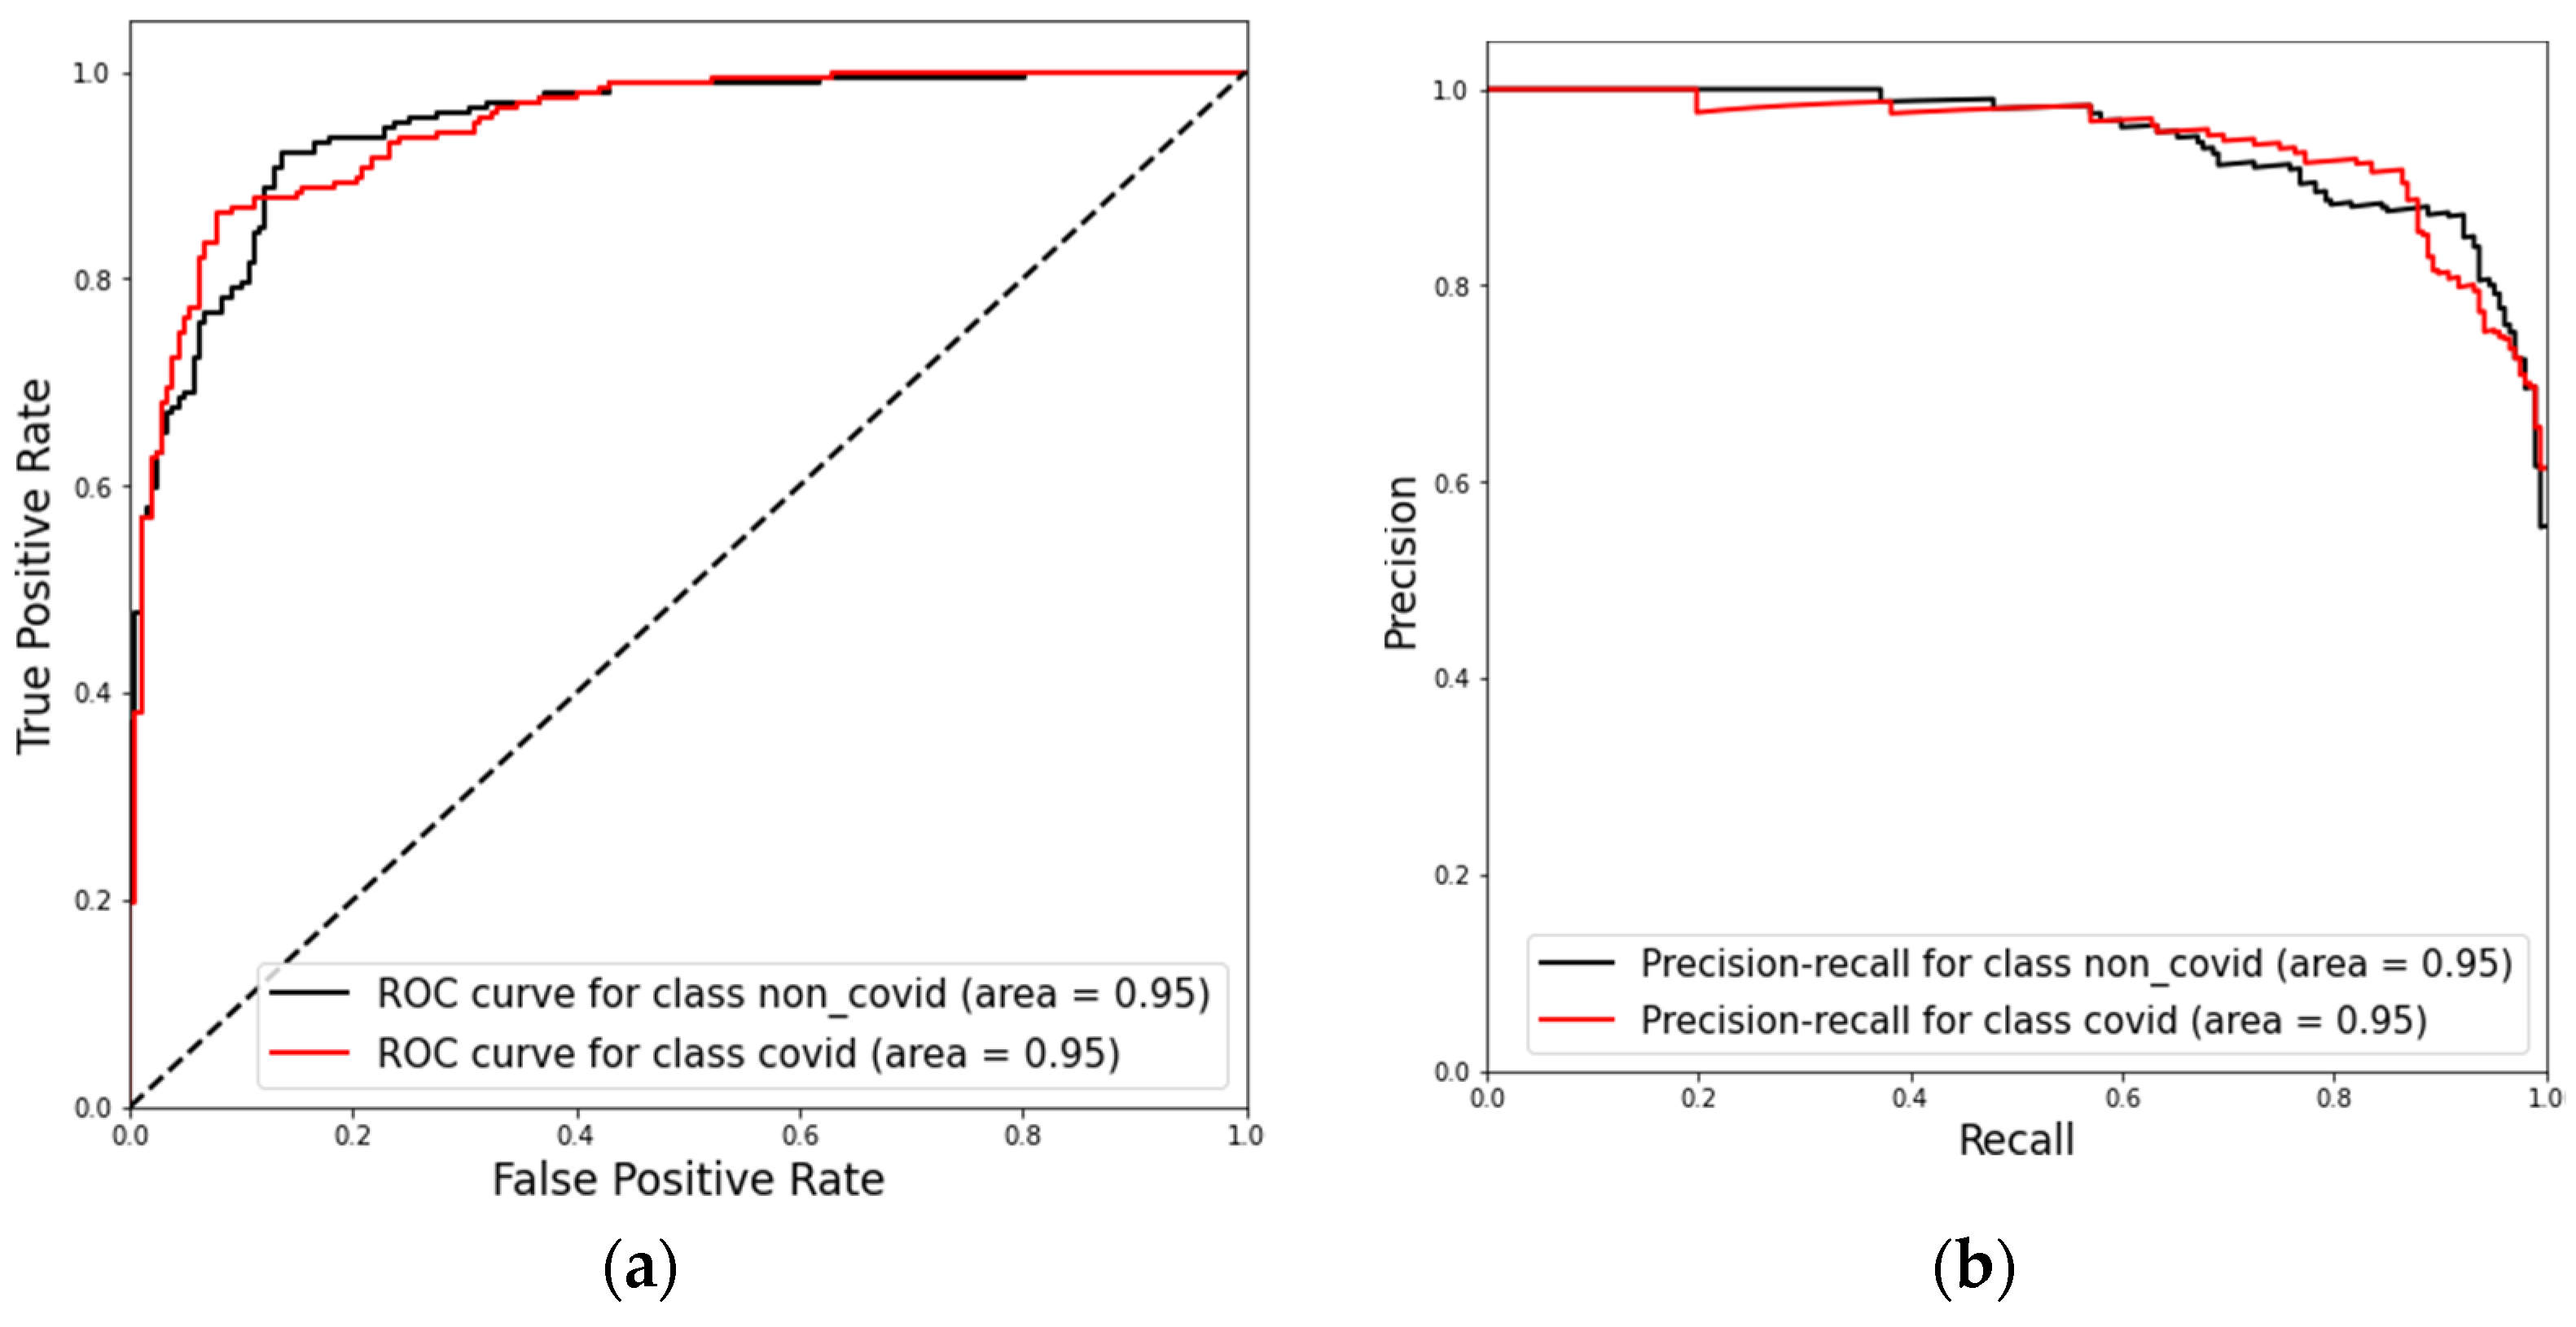
Finally, we present the results with the combined datasets (test dataset 1 and test dataset 2) in Figure 10 and Figure 11 as an overall performance assessment. The model assessment shows a recall of 88% (95% CI, 79.88% to 94.35%), specificity of 88% (95% CI, 81.89% to 95.75%), and accuracy of 89% (95% CI, 83.78% to 93.60%). We can see a ROC AUC and PR AUC of 95% for the combined test dataset. The model’s performance in both dataset and in the combined set confirms its ability to generalize well for new data.
4. Discussion
In the lack of a specialized radiologist, AI models may support the identification of COVID-19 pneumonia characteristics in CT scans. With this objective in mind, we developed the Cimatec-CovNet-19 neural network and evaluated its performance using two test datasets: one being a subset of a global public dataset and the other a set of 170 patients served by a hospital in São Paulo. Generalization for different datasets is a known problem in AI applied to medical images [48]. We did not observe major differences in the algorithm performance over the two tests datasets, which suggests that the algorithm generalizes well.
One limitation of this study is the use of a diverse public dataset, which lacks demographic information to train the algorithm. Those datasets might contain unknown biases and contaminate the model.
The importance of CT scans examinations to evaluate suspected COVID-19 patients and support the management of known patients is evident. The ROC-AUC and PR-AUC showed in this study validated that Cimatec-CovNet-19 is a good screening tool for COVID-19 pneumonia from CT scans. The algorithm has a new approach for processing the images, requiring the use of fewer slices per examination and thus reducing training and inference times. This is important, especially for centers with low computing resources. The code is open for further enhancement. We encourage future works to compare this algorithm with other publicly available algorithms and explore its use in clinical practice in a controlled environment. In the near future, we plan to test Cimatec_CovNet-19 in a hospital in Brazil.
The methodology used to build and test the algorithm and the developed model can quickly be adapted and applied to other lung infections in new potential pandemics.
Author Contributions
Conceptualization, A.F. and E.G.S.N.; data curation, A.F. and C.A.C.d.P.; formal analysis, E.G.S.N.; funding acquisition, A.F. and E.G.S.N.; investigation, A.F. and C.A.C.d.P.; methodology, A.F., C.A.C.d.P., R.B. and E.G.S.N.; project administration, A.F. and E.G.S.N.; resources, A.F. and C.A.C.d.P.; software, C.A.C.d.P.; supervision, A.F. and E.G.S.N.; validation, R.B. and E.G.S.N.; writing—original draft, A.F. and C.A.C.d.P.; writing—review and editing, A.F., C.A.C.d.P., R.B. and E.G.S.N. All authors have read and agreed to the published version of the manuscript.
Funding
This research was funded by ABDI, SENAI, EMBRAPII, REPSOL SINOPEC BRASIL grant “Missão contra a COVID-19 do Edital de Inovação para a Indústria”.
Institutional Review Board Statement
The retrospective study was conducted in accordance with the Declaration of Helsinki and approved by the Institutional Review Board (or Ethics Committee) of “Serviço Nacional de Aprendizagem Industrial—SENAI CIMATEC” (STU# 36389820.6.0000.9287) on 9 August 2020 and was granted a waiver of written informed consent.
Informed Consent Statement
Patient consent was waived in accordance with the evaluation of the Institutional Review Board considering that researchers undertake to maintain confidentiality, not disclosing the names of the participants, and using codes to identify the data generated by them to avoid violating participant privacy.
Data Availability Statement
The model’s source code is freely available on the research group GitHub page at https://github.com/CRIA-CIMATEC/COVID-19 (accessed on 1 May 2022).
Acknowledgments
We gratefully acknowledge the support of SENAI CIMATEC AI Reference Center and the SENAI CIMATEC/NVDIA AI Joint Center for scientific and technical support; the SENAI CIMATEC Supercomputing Center for Industry Innovation for granting access to the necessary hardware and technical support; Repsol Sinopec Brazil, ABDI, SENAI, and EMBRAPII for providing the funding for this research; HP Brazil for providing support; and Hospital Santa Izabel, MedSenior and HM Hospitales for providing data for this research.
Conflicts of Interest
The authors declare no conflict of interest. The funders had no role in the design of the study; in the collection, analyses, or interpretation of data; in the writing of the manuscript, or in the decision to publish the results.
References
- WHO Coronavirus (COVID-19) Dashboard|WHO Coronavirus (COVID-19) Dashboard with Vaccination Data. Available online: https://covid19.who.int/ (accessed on 19 June 2022).
- Zhu, N.; Zhang, D.; Wang, W.; Li, X.; Yang, B.; Song, J.; Zhao, X.; Huang, B.; Shi, W.; Lu, R.; et al. A Novel Coronavirus from Patients with Pneumonia in China, 2019. N. Engl. J. Med. 2020, 382, 727–733. [Google Scholar] [CrossRef] [PubMed]
- Arevalo-Rodriguez, I.; Buitrago-Garcia, D.; Simancas-Racines, D.; Achig, P.Z.; Del Campo, R.; Ciapponi, A.; Sued, O.; Martinez-García, L.; Rutjes, A.W.; Low, N.; et al. False-negative results of initial RT-PCR assays for COVID-19: A systematic review. PLoS ONE 2020, 15, e0242958. [Google Scholar]
- Woloshin, S.; Patel, N.; Kesselheim, A.S. False Negative Tests for SARS-CoV-2 Infection—Challenges and Implications. N. Engl. J. Med. 2020, 383, e38. [Google Scholar] [CrossRef] [PubMed]
- Pontone, G.; Scafuri, S.; Mancini, M.E.; Agalbato, C.; Guglielmo, M.; Baggiano, A.; Muscogiuri, G.; Fusini, L.; Andreini, D.; Mushtaq, S.; et al. Role of computed tomography in COVID-19. J. Cardiovasc. Comput. Tomogr. 2020, 15, 27–36. [Google Scholar] [CrossRef] [PubMed]
- Sandri, T.L.; Inoue, J.; Geiger, J.; Griesbaum, J.-M.; Heinzel, C.; Burnet, M.; Fendel, R.; Kremsner, P.G.; Held, J.; Kreidenweiss, A. Complementary methods for SARS-CoV-2 diagnosis in times of material shortage. Sci. Rep. 2021, 11, 11899. [Google Scholar] [CrossRef]
- Shi, H.; Han, X.; Jiang, N.; Cao, Y.; Alwalid, O.; Gu, J.; Fan, Y.; Zheng, C. Radiological findings from 81 patients with COVID-19 pneumonia in Wuhan, China: A descriptive study. Lancet Infect. Dis. 2020, 20, 425–434. [Google Scholar] [CrossRef]
- Furtado, A.; Andrade, L.; Frias, D.; Maia, T.; Badaró, R.; Nascimento, E.G.S. Deep Learning Applied to Chest Radiograph Classification—A COVID-19 Pneumonia Experience. Appl. Sci. 2022, 12, 3712. [Google Scholar] [CrossRef]
- Zu, Z.Y.; Di Jiang, M.; Xu, P.P.; Chen, W.; Ni, Q.Q.; Lu, G.M.; Zhang, L.J. Coronavirus Disease 2019 (COVID-19): A Perspective from China. Radiology 2020, 296, E15–E25. [Google Scholar] [CrossRef] [Green Version]
- Kwee, T.C.; Kwee, R.M. Chest ct in COVID-19: What the radiologist needs to know. Radiographics 2020, 40, 1848–1865. [Google Scholar] [CrossRef]
- Chung, M.; Bernheim, A.; Mei, X.; Zhang, N.; Huang, M.; Zeng, X.; Cui, J.; Xu, W.; Yang, Y.; Fayad, Z.A.; et al. CT Imaging Features of 2019 Novel Coronavirus (2019-nCoV). Radiology 2020, 295, 202–207. [Google Scholar] [CrossRef] [Green Version]
- Huang, C.; Wang, Y.; Li, X.; Ren, L.; Zhao, J.; Hu, Y.; Zhang, L.; Fan, G.; Xu, J.; Gu, X.; et al. Clinical features of patients infected with 2019 novel coronavirus in Wuhan, China. Lancet 2020, 395, 497–506. [Google Scholar] [CrossRef] [Green Version]
- Koo, H.J.; Lim, S.; Choe, J.; Choi, S.-H.; Sung, H.; Do, K.-H. Radiographic and CT features of viral pneumonia. Radiographics 2018, 38, 719–739. [Google Scholar] [CrossRef] [PubMed] [Green Version]
- Akl, E.A.; Blažić, I.; Yaacoub, S.; Frija, G.; Chou, R.; Appiah, J.A.; Fatehi, M.; Flor, N.; Hitti, E.; Jafri, H.; et al. Use of chest imaging in the diagnosis and management of COVID-19: A WHO rapid advice guide. Radiology 2021, 298, E63–E69. [Google Scholar] [CrossRef] [PubMed]
- Rubin, G.D.; Ryerson, C.J.; Haramati, L.B.; Sverzellati, N.; Kanne, J.; Raoof, S.; Schluger, N.W.; Volpi, A.; Yim, J.-J.; Martin, I.B.K.; et al. The role of chest imaging in patient management during the COVID-19 pandemic: A multinational consensus statement from the fleischner society. Radiology 2020, 296, 172–180. [Google Scholar] [CrossRef] [Green Version]
- Simpson, S.; Kay, F.U.; Abbara, S.; Bhalla, S.; Chung, J.H.; Chung, M.; Henry, T.S.; Kanne, J.P.; Kligerman, S.; Ko, J.P.; et al. Radiological society of North America expert consensus document on reporting chest CT findings related to COVID-19: Endorsed by the society of thoracic radiology, the American college of radiology, and RSNA. Radiol. Cardiothorac. Imaging 2020, 2, e200152. [Google Scholar] [CrossRef] [Green Version]
- Roberts, M.; Covnet, A.; Driggs, D.; Thorpe, M.; Gilbey, J.; Yeung, M.; Ursprung, S.; Aviles-Rivero, A.I.; Etmann, C.; McCague, C.; et al. Common pitfalls and recommendations for using machine learning to detect and prognosticate for COVID-19 using chest radiographs and CT scans. Nat. Mach. Intell. 2021, 3, 199–217. [Google Scholar] [CrossRef]
- Aggarwal, P.; Mishra, N.K.; Fatimah, B.; Singh, P.; Gupta, A.; Joshi, S.D. COVID-19 image classification using deep learning: Advances, challenges and opportunities. Comput. Biol. Med. 2022, 144, 105350. [Google Scholar] [CrossRef]
- Carvalho, A.R.S.; Guimarães, A.; Garcia, T.D.S.O.; Werberich, G.M.; Ceotto, V.F.; Bozza, F.A.; Rodrigues, R.S.; Pinto, J.S.F.; Schmitt, W.R.; Zin, W.A.; et al. Estimating COVID-19 Pneumonia Extent and Severity From Chest Computed Tomography. Front. Physiol. 2021, 12, 617657. [Google Scholar] [CrossRef]
- Diniz, J.O.B.; Quintanilha, D.B.P.; Neto, A.C.S.; da Silva, G.L.F.; Ferreira, J.L.; Netto, S.M.B.; Araújo, J.D.L.; Da Cruz, L.B.; Silva, T.F.B.; Martins, C.M.D.S.; et al. Segmentation and quantification of COVID-19 infections in CT using pulmonary vessels extraction and deep learning. Multimed. Tools Appl. 2021, 80, 29367–29399. [Google Scholar] [CrossRef]
- Ozsahin, I.; Sekeroglu, B.; Musa, M.S.; Mustapha, M.T.; Ozsahin, D.U. Review on Diagnosis of COVID-19 from Chest CT Images Using Artificial Intelligence. Comput. Math. Methods Med. 2020, 2020, 9756518. [Google Scholar] [CrossRef]
- Liu, F.; Tang, J.; Ma, J.; Wang, C.; Ha, Q.; Yu, Y.; Zhou, Z. The application of artificial intelligence to chest medical image analysis. Intell. Med. 2021, 1, 104–117. [Google Scholar] [CrossRef]
- Heidarian, S.; Afshar, P.; Enshaei, N.; Naderkhani, F.; Rafiee, M.J.; Fard, F.B.; Samimi, K.; Atashzar, S.F.; Oikonomou, A.; Plataniotis, K.N.; et al. COVID-FACT: A Fully-Automated Capsule Network-Based Framework for Identification of COVID-19 Cases from Chest CT Scans. Front. Artif. Intell. 2021, 4, 65. [Google Scholar] [CrossRef] [PubMed]
- Rahimzadeh, M.; Attar, A.; Sakhaei, S.M. A fully automated deep learning-based network for detecting COVID-19 from a new and large lung CT scan dataset. Biomed. Signal Process. Control. 2021, 68, 102588. [Google Scholar] [CrossRef] [PubMed]
- Heidarian, S.; Afshar, P.; Mohammadi, A.; Rafiee, M.J.; Oikonomou, A.; Plataniotis, K.N.; Naderkhani, F. Ct-caps: Feature extraction-based automated framework for COVID-19 disease identification from chest ct scans using capsule networks. In Proceedings of the ICASSP 2021–2021 IEEE International Conference on Acoustics, Speech and Signal Processing, Toronto, ON, Canada, 6–11 June 2021; pp. 1040–1044. [Google Scholar] [CrossRef]
- Li, L.; Qin, L.; Xu, Z.; Yin, Y.; Wang, X.; Kong, B.; Bai, J.; Lu, Y.; Fang, Z.; Song, Q.; et al. Using Artificial Intelligence to Detect COVID-19 and Community-acquired Pneumonia Based on Pulmonary CT: Evaluation of the Diagnostic Accuracy. Radiology 2020, 296, E65–E71. [Google Scholar] [CrossRef] [PubMed]
- Xue, S.; Abhayaratne, C. COVID-19 diagnostic using 3D deep transfer learning for classification of volumetric computerised tomography chest scans. In Proceedings of the ICASSP 2021—2021 IEEE International Conference on Acoustics, Speech and Signal Processing, Toronto, ON, Canada, 6–11 June 2021; pp. 8573–8577. [Google Scholar] [CrossRef]
- Wang, X.; Deng, X.; Fu, Q.; Zhou, Q.; Feng, J.; Ma, H.; Liu, W.; Zheng, C. A Weakly-Supervised Framework for COVID-19 Classification and Lesion Localization from Chest CT. IEEE Trans. Med. Imaging 2020, 39, 2615–2625. [Google Scholar] [CrossRef]
- Yang, D.; Martinez, C.; Visuña, L.; Khandhar, H.; Bhatt, C.; Carretero, J. Detection and analysis of COVID-19 in medical images using deep learning techniques. Sci. Rep. 2021, 11, 19638. [Google Scholar] [CrossRef]
- Yang, D.; Martinez, C.; Visuña, L.; Khandhar, H.; Bhatt, C.; Carretero, J. Diagnosis of COVID-19 using CT scan images and deep learning techniques. Emerg. Radiol. 2021, 28, 497–505. [Google Scholar] [CrossRef]
- Sitaula, C.; Aryal, S. New bag of deep visual words based features to classify chest x-ray images for COVID-19 diagnosis. Health Inf. Sci. Syst. 2021, 9, 24. [Google Scholar] [CrossRef]
- Sitaula, C.; Shahi, T.B.; Aryal, S.; Marzbanrad, F. Fusion of multi-scale bag of deep visual words features of chest X-ray images to detect COVID-19 infection. Sci. Rep. 2022, 11, 23914. [Google Scholar] [CrossRef]
- Sitaula, C.; Hossain, M.B. Attention-based VGG-16 model for COVID-19 chest X-ray image classification. Appl. Intell. 2021, 51, 2850–2863. [Google Scholar] [CrossRef]
- Simpson, A.L.; Antonelli, M.; Bakas, S.; Bilello, M.; Farahani, K.; Van Ginneken, B.; Kopp-Schneider, A.; Landman, B.A.; Litjens, G.; Menze, B.; et al. A large annotated medical image dataset for the development and evaluation of segmentation algorithms. Meml. Sloan Kettering Cancer Cent. 2019, 12. [Google Scholar] [CrossRef]
- Pedrosa, J.; Aresta, G.; Ferreira, C.; Rodrigues, M.; Leitão, P.; Carvalho, A.S.; Rebelo, J.; Negrão, E.; Ramos, I.; Cunha, A.; et al. LNDb: A Lung Nodule Database on Computed Tomography. arXiv 2019, arXiv:1911.08434. [Google Scholar] [CrossRef]
- Yang, J. Data from lung CT segmentation challenge. Cancer Imaging Arch. 2017, 20. Available online: https://wiki.cancerimagingarchive.net/display/Public/Lung+CT+Segmentation+Challenge+2017 (accessed on 21 June 2022).
- Morozov, S.P.; Andreychenko, A.E.; Blokhin, I.A.; Gelezhe, P.B.; Gonchar, A.P.; Nikolaev, A.E.; Pavlov, N.A.; Chernina, V.Y.; Gombolevskiy, V.A. MosMedData: Data set of 1110 chest CT scans performed during the COVID-19 epidemic. Digit. Diagn. 2020, 1, 49–59. [Google Scholar] [CrossRef]
- Jun, M.; Cheng, G.; Yixin, W.; Xingle, A.; Jiantao, G.; Ziqi, Y.; Minqing, Z.; Xin, L.; Xueyuan, D.; Shucheng, C.; et al. COVID-19 CT Lung and Infection Segmentation Dataset. 2020. Available online: https://zenodo.org/record/3757476#.YrPIcOxByUk (accessed on 21 June 2022).
- MedSeg, H.; Jenssen, B.; Sakinis, T. MedSeg COVID Dataset 1. May 2021. Available online: https://figshare.com/articles/dataset/MedSeg_Covid_Dataset_1/13521488/2 (accessed on 21 June 2022).
- de la Iglesia Vayá, M.; Saborit, J.M.; Montell, J.A.; Pertusa, A.; Bustos, A.; Cazorla, M.; Galant, J.; Barber, X.; Orozco-Beltrán, D.; García-García, F.; et al. BIMCV COVID-19+: A large annotated dataset of RX and CT images from COVID-19 patients. IEEE Dataport 2021. [Google Scholar] [CrossRef]
- NVIDIA Clara Imaging|NVIDIA Developer. Available online: https://developer.nvidia.com/clara-medical-imaging (accessed on 12 January 2022).
- Simonyan, K.; Zisserman, A. Very deep convolutional networks for large-scale image recognition. arXiv 2014, arXiv:1409.1556. [Google Scholar] [CrossRef]
- Krizhevsky, A.; Sutskever, I.; Hinton, G.E. Imagenet classification with deep convolutional neural networks. Adv. Neural Inf. Process. Syst. 2012, 25, 1097–1105. [Google Scholar] [CrossRef]
- O’Malley, T.; Bursztein, E.; Long, J.; Chollet, F.; Jin, H.; Invernizzi, L. Keras Tuner. Available online: https://github.com/keras-team/keras-tuner (accessed on 21 May 2019).
- Li, L.; Jamieson, K.; DeSalvo, G.; Rostamizadeh, A.; Talwalkar, A. Hyperband: A Novel Bandit-Based Approach to Hyperparameter Optimization. J. Mach. Learn. Res. 2018, 18, 6765–6816. [Google Scholar] [CrossRef]
- Laino, M.; Ammirabile, A.; Posa, A.; Cancian, P.; Shalaby, S.; Savevski, V.; Neri, E. The Applications of Artificial Intelligence in Chest Imaging of COVID-19 Patients: A Literature Review. Diagnostics 2021, 11, 1317. [Google Scholar] [CrossRef]
- Abelaira, M.D.C.; Abelaira, F.C.; Ruano-Ravina, A.; Fernández-Villar, A. Use of Conventional Chest Imaging and Artificial Intelligence in COVID-19 Infection. A Review of the Literature. Open Respir. Arch. 2021, 3, 100078. [Google Scholar] [CrossRef]
- Rajpurkar, P.; Joshi, A.; Pareek, A.; Ng, A.Y.; Lungren, M.P. CheXternal: Generalization of deep learning models for chest X-ray interpretation to photos of chest X-rays and external clinical settings. In Proceedings of the Conference on Health, Inference, and Learning, New York, NY, USA, 8–10 April 2021; pp. 125–132. [Google Scholar] [CrossRef]
Figure 1.
COVID-19 patient is male and 73 years old. Bounding box highlights infiltrates.

Figure 2.
Axial nonenhanced chest CT images (lung window) in a 59-year-old man (a) and a 47-year-old man (b) show bilateral areas of ground-glass opacities (arrows) in a peripheral distribution; (c) shows bilateral ground-glass opacities and dilated segmental and subsegmental vessels, mainly on the right, in a 70-year-old man, each with positive RT-PCR test results for SARS-CoV-2. Adapted from [10].

Figure 3.
Example of a single slice before and after the pre-processing routine.

Figure 4.
3D-CNN model architecture developed on top of the standard VGG-16 2D model.

Figure 5.
Model performance achieved during the development. In (a), training and validation accuracy. In (b), training and validation loss.
Figure 5.
Model performance achieved during the development. In (a), training and validation accuracy. In (b), training and validation loss.

Figure 6.
Boxplot of the stratified 10-fold cross-validation results showing PR-AUC, ROC-AUC, and F1-score ranges.
Figure 6.
Boxplot of the stratified 10-fold cross-validation results showing PR-AUC, ROC-AUC, and F1-score ranges.

Figure 7.
Confusion matrix results for model evaluation on the test datasets, (a) test dataset 1, and (b) test dataset 2.
Figure 7.
Confusion matrix results for model evaluation on the test datasets, (a) test dataset 1, and (b) test dataset 2.

Figure 8.
ROC curves obtained for model evaluation on the test dataset 1 (a) and on the test dataset 2 (b).
Figure 8.
ROC curves obtained for model evaluation on the test dataset 1 (a) and on the test dataset 2 (b).

Figure 9.
Precision-recall curves for model evaluation on both test datasets. (a) Results for test dataset 1 and (b) results for test dataset 2.
Figure 9.
Precision-recall curves for model evaluation on both test datasets. (a) Results for test dataset 1 and (b) results for test dataset 2.

Figure 10.
Confusion matrix for model evaluation on the combined test dataset.

Figure 11.
Present the ROC-AUC (a) and PR-AUC (b) results for model evaluations on the combined test dataset.
Figure 11.
Present the ROC-AUC (a) and PR-AUC (b) results for model evaluations on the combined test dataset.


Table 1.
Assessment of the main problems found in the literature review.
| Category | Problem | Solution |
|---|---|---|
| Dataset | Few images for training the algorithm | Algorithm trained with 3000 chest CT examinations |
| Dataset | Data collected from only one geographical region | Data collected from a set of curated international public databases summed up with images from 2 Brazilian hospitals |
| Dataset | Poor image bank quality: non-standard scans, too many images of children, or excess of data from China patients | Attention to the selection of the best public bases; automatic and visual cleaning. |
| Methodology | Use of unbalanced datasets | Attention to balancing the COVID-19, non-COVID, and normal categories prior to training and testing. |
| Methodology | Lack of statistical rigor or bias | We used the CLAIM [10] checklist for AI in medical imaging. Available as a supplement. |
| Transparency | Non-replicable projects. | The whole code is open. |
Table 2.
CT scans databases used in this study.
| Dataset ID | Dataset Name | Public (Y/N) | Number of CT Scans after Data Cleaning | Avg Number of Slices per CT Scan | Number of CT Scans Positive for COVID-19 | Training/Val Dataset | Test Dataset 1 | Test Dataset 2 |
|---|---|---|---|---|---|---|---|---|
| i | Medical Segmentation Decathlon | Y | 94 | 279 | 0 | 50 | 0 | 9 |
| ii | LNDb | Y | 139 | 322 | 0 | 78 | 0 | 13 |
| iii | LCTSC | Y | 94 | 279 | 0 | 25 | 0 | 3 |
| iv | MOSMEDDATA | Y | 1105 | 42 | 1105 | 449 | 0 | 56 |
| v | HCUSP | N | 935 | 337 | 431 | 384 | 170 | 51 |
| vi | HSI | N | 1806 | 308 | 1294 | 766 | 0 | 79 |
| vii | COVID-19 CT Lung and Infection Segmentation | Y | 10 | 176 | 10 | 8 | 0 | 1 |
| viii | COVID-19 CT Segmentation Dataset | Y | 10 | 280 | 10 | 3 | 0 | 1 |
| ix | BIMCV-COVID19 | Y | 486 | 288 | 308 | 222 | 0 | 31 |
Table 3.
Dataset split during model development.
| Training | Validation | Test Dataset 1 | Test Dataset 2 | |
|---|---|---|---|---|
| COVID-19 | 1000 | 500 | 85 | 122 |
| Non-COVID-19 | 1000 | 500 | 85 | 122 |
| Total | 2000 | 1000 | 170 | 244 |
Table 4.
Final training dataset with data augmentation.
| Original | Augmented | Test Dataset 1 | Test Dataset 2 | |
|---|---|---|---|---|
| COVID-19 | 1500 | 1500 | 85 | 122 |
| Non-COVID-19 | 1500 | 1500 | 85 | 122 |
| Total | 3000 | 3000 | 170 | 244 |
Table 5.
Evaluation results for each validation fold.
| Fold | PR-AUC | ROC-AUC | F1-Score |
|---|---|---|---|
| 0 | 0.94 | 0.93 | 0.86 |
| 1 | 0.86 | 0.87 | 0.80 |
| 2 | 0.88 | 0.89 | 0.82 |
| 3 | 0.90 | 0.91 | 0.84 |
| 4 | 0.94 | 0.93 | 0.86 |
| 5 | 0.90 | 0.92 | 0.87 |
| 6 | 0.88 | 0.89 | 0.84 |
| 7 | 0.96 | 0.96 | 0.90 |
| 8 | 0.90 | 0.92 | 0.86 |
| 9 | 0.90 | 0.90 | 0.82 |
| Average | 0.906 | 0.912 | 0.847 |
| Std | 0.031 | 0.026 | 0.029 |
Publisher’s Note: MDPI stays neutral with regard to jurisdictional claims in published maps and institutional affiliations. |
© 2022 by the authors. Licensee MDPI, Basel, Switzerland. This article is an open access article distributed under the terms and conditions of the Creative Commons Attribution (CC BY) license (https://creativecommons.org/licenses/by/4.0/).
Share and Cite
MDPI and ACS Style
Furtado, A.; da Purificação, C.A.C.; Badaró, R.; Nascimento, E.G.S. A Light Deep Learning Algorithm for CT Diagnosis of COVID-19 Pneumonia. Diagnostics 2022, 12, 1527. https://doi.org/10.3390/diagnostics12071527
AMA Style
Furtado A, da Purificação CAC, Badaró R, Nascimento EGS. A Light Deep Learning Algorithm for CT Diagnosis of COVID-19 Pneumonia. Diagnostics. 2022; 12(7):1527. https://doi.org/10.3390/diagnostics12071527
Chicago/Turabian StyleFurtado, Adhvan, Carlos Alberto Campos da Purificação, Roberto Badaró, and Erick Giovani Sperandio Nascimento. 2022. "A Light Deep Learning Algorithm for CT Diagnosis of COVID-19 Pneumonia" Diagnostics 12, no. 7: 1527. https://doi.org/10.3390/diagnostics12071527
Note that from the first issue of 2016, this journal uses article numbers instead of page numbers. See further details here.