
Evaluation of dynamic lung changes during coronavirus disease 2019 (COVID-19) by quantitative computed tomography
Abstract
OBJECTIVES:
This study aims to trace the dynamic lung changes of coronavirus disease 2019 (COVID-19) using computed tomography (CT) images by a quantitative method.
METHODS:
In this retrospective study, 28 confirmed COVID-19 cases with 145 CT scans are collected. The lesions are detected automatically and the parameters including lesion volume (LeV/mL), lesion percentage to lung volume (LeV%), mean lesion density (MLeD/HU), low attenuation area lower than – 400HU (LAA-400%), and lesion weight (LM/mL*HU) are computed for quantification. The dynamic changes of lungs are traced from the day of initial symptoms to the day of discharge. The lesion distribution among the five lobes and the dynamic changes in each lobe are also analyzed.
RESULTS:
LeV%, MLeD, and LM reach peaks on days 9, 6 and 8, followed by a decrease trend in the next two weeks. LAA-400% (mostly the ground glass opacity) declines to the lowest on days 4–5, and then increases. The lesion is mostly seen in the bilateral lower lobes, followed by the left upper lobe, right upper lobe and right middle lobe (p < 0.05). The right middle lobe is the earliest one (on days 6–7), while the right lower lobe is the latest one (on days 9–10) that reaches to peak among the five lobes.
CONCLUSIONS:
Severity of COVID-19 increases from the day of initial symptoms, reaches to the peak around on day 8, and then decreases. Lesion is more commonly seen in the bilateral lower lobes.
1Introduction
Coronavirus disease 2019 (COVID-19) is an emergent respiratory disease caused by a novel coronavirus (SARS-CoV-2, previously known as 2019-nCoV), and is widespread throughout China and many other places outside China [1–4]. SARS-CoV-2 has high transmission ability from person to person, and all populations were susceptible to it [5, 6]. As of 30 June, 2020, a total of 10, 434, 835 cases of COVID-19, including 509, 779 deaths (in accordance with the applied case definitions and testing strategies in the affected countries) have been reported. On 30 January 2020, the World Health Organization (WHO) has officially declared the COVID-19 epidemic that is rapidly spreading as a public health emergency of international concern. On 12 March 2020, the WHO announced that COVID-19 had reached pandemic status.
Chest computed tomography (CT) has been widely used during the initial screening process [7], pneumonia diagnosis [8], severity assessment [9], and for differential diagnosis [10] of COVID-19 diseases. As an emergent public health concern, COVID-19 patients were followed up with multiple CT examination, as this aids in recognizing the dynamic changes of COVID-19 [11]. Traditionally, the evaluation of pneumonia severity and its distribution were based on CT scores assessed by physicians [12]. For example, both sides of the lung were divided into three zones (the upper zone, the middle zone, and the lower zone), and each zone was provided with a score of four degrees. The lesion degree for each zone was assessed and the total scores were summed up, which was reported to be of high consistency among the observers and showed an area under the curve (AUC) of 0.918 (95% CI 0.843–0.994) in predicting the severe-critical type [12].
However, the evaluation conducted by radiologists is time-consuming and there is a shortage of radiological experts for precise interpretation of lesion burden on CT images, and thus, computer-aided lesion detection and quantification systems showed to be helpful in this regard [13]. Hence, in this study, to evaluate the dynamic changing features of COVID-19 better, a computer tool was used to delineate the lesion regions on multiple follow-up CT examinations, and draw the dynamic changing curve of the lesion size and lesion density during hospitalization.
2Materials and methods
2.1Patients
This study was approved by the ethics committees of our hospitals. Informed consent was waived off due to the retrospective nature of the study. A total of 46 cases diagnosed with COVID-19 (positive in real-time polymerase chain reaction test or showed a high homogeneity with known coronavirus in gene sequencing) from January 23, 2020 to February 25, 2020 were retrospectively reviewed. COVID-19 diagnoses were comprehensively confirmed based on the history of epidemiology and clinical manifestations according to the Diagnosis and Treatment Protocols of the National Health Commission of the People’s Republic of China5. The history of epidemiology included cases: (1) with a travel history to Wuhan and its surrounding areas, or to other communities with reported COVID-19 cases within the latest 14 days; (2) contact history with confirmed COVID-19 cases within the latest 14 days; (3) contact history with someone from Wuhan and its surrounding areas, or other cases with fever or respiratory symptoms within the latest 14 days; or (4) have symptoms after an aggregation for 2 weeks. The clinical manifestations were as follows: (1) fever and/or respiratory symptoms; (2) COVID-19 radiographic features; and (3) normal or low white blood cell and lymphocyte count.
The end point was observation on the day of discharge. The discharge criteria5 were as follows: (1) afebrile for more than 3 days; (2) significant improvement in respiratory symptoms; (3) significant reduction in acute opacities on chest CT images; and (4) two consecutive negative nucleic acid tests (at least 24 h apart).
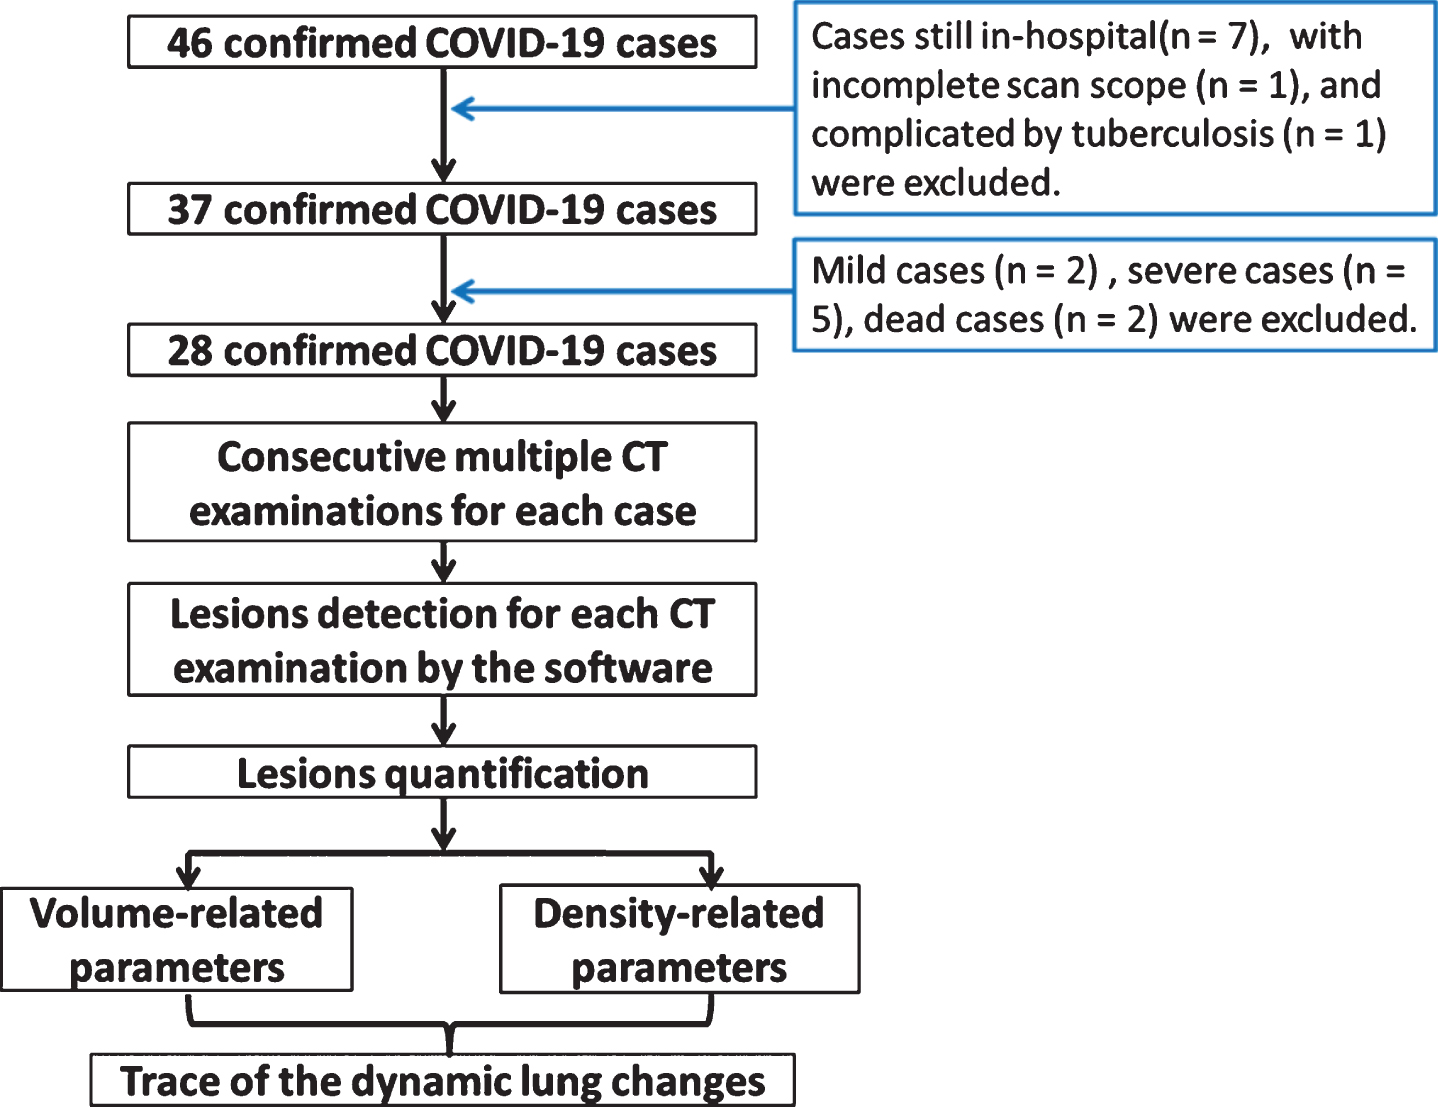
The exclusion criteria of this study were as follows: (1) in-hospital cases at the end of the collecting time-point (n = 7); (2) cases with incomplete scan scope of the entire lung (n = 1); (3) mild type (n = 2) cases without any abnormal signs on CT scan; (4) severe cases (n = 5) with longer hospitalization duration and slower reduction of lung opacity when compared to those of moderate type; (5) dead cases (n = 2); and (6) complicated by pulmonary tuberculosis manifestations (n = 1) in CT. Severe cases were defined as those cases with respiratory dyspnea (>30 breaths/min), low SpO2 (<93%) at rest, PaO2/FiO2≤300 mmHg, progressed to more than 50% within 24–48 h, and the cases with respiratory failure and failure of other organs.
Based on the eligibility criteria, 28 cases (17 male and 11 female) were finally included in this study, and the study flowchart was shown in Fig. 1. The average age was 44.35±14.15 years-old, the media scan times was 5. All CT scans were analyzed by the in-home software. The lesion region was detected automatically (details in the Method part). The volume-related parameters (including the lesion volume, lung volume and their ratio) and density-related parameters (including mean lesion density and lesion density lower than –400HU) were calculated quantitatively. The dynamic changes of the lung were traced from the day of initial symptoms to the day of discharge according to these parameters.
Fig. 1
The study flowchart.
2.2Acquisition of CT images
CT examinations were performed using multi-detector CT scanners (MX 16, Phillips, Cleveland, Netherlands; BrightSpeed, SOMATOM Perspective, and Emotion 16, all from Siemens, Erlangen, Germany; Optima CT680 Series, GE MEDICAL SYSTEMS, America; Aquilion, TOSHIBA, Japan) without any contrast media on all scans. Volumetric CT acquisitions were implemented. Patients were requested to place in the supine position with their breath held for undergoing scanning. The scan was performed at the end of inspiration from the apex of the lung to the base of the lung. The tube voltage was 120 kVp with auto current ranging from 30 mA to100 mA. The field of view was 31 cm∼31 cm×36 cm∼36 cm. CT images were reconstructed with a matrix size of 512×512. The scan thickness and the increment were both 5 mm, the reconstruction thickness was 1 mm∼1.5 mm in transverse slice orientation. All the images were reconstructed by the standard kernel.
2.3Quantitative CT Evaluation
2.3.1Automatically lesion segmentation
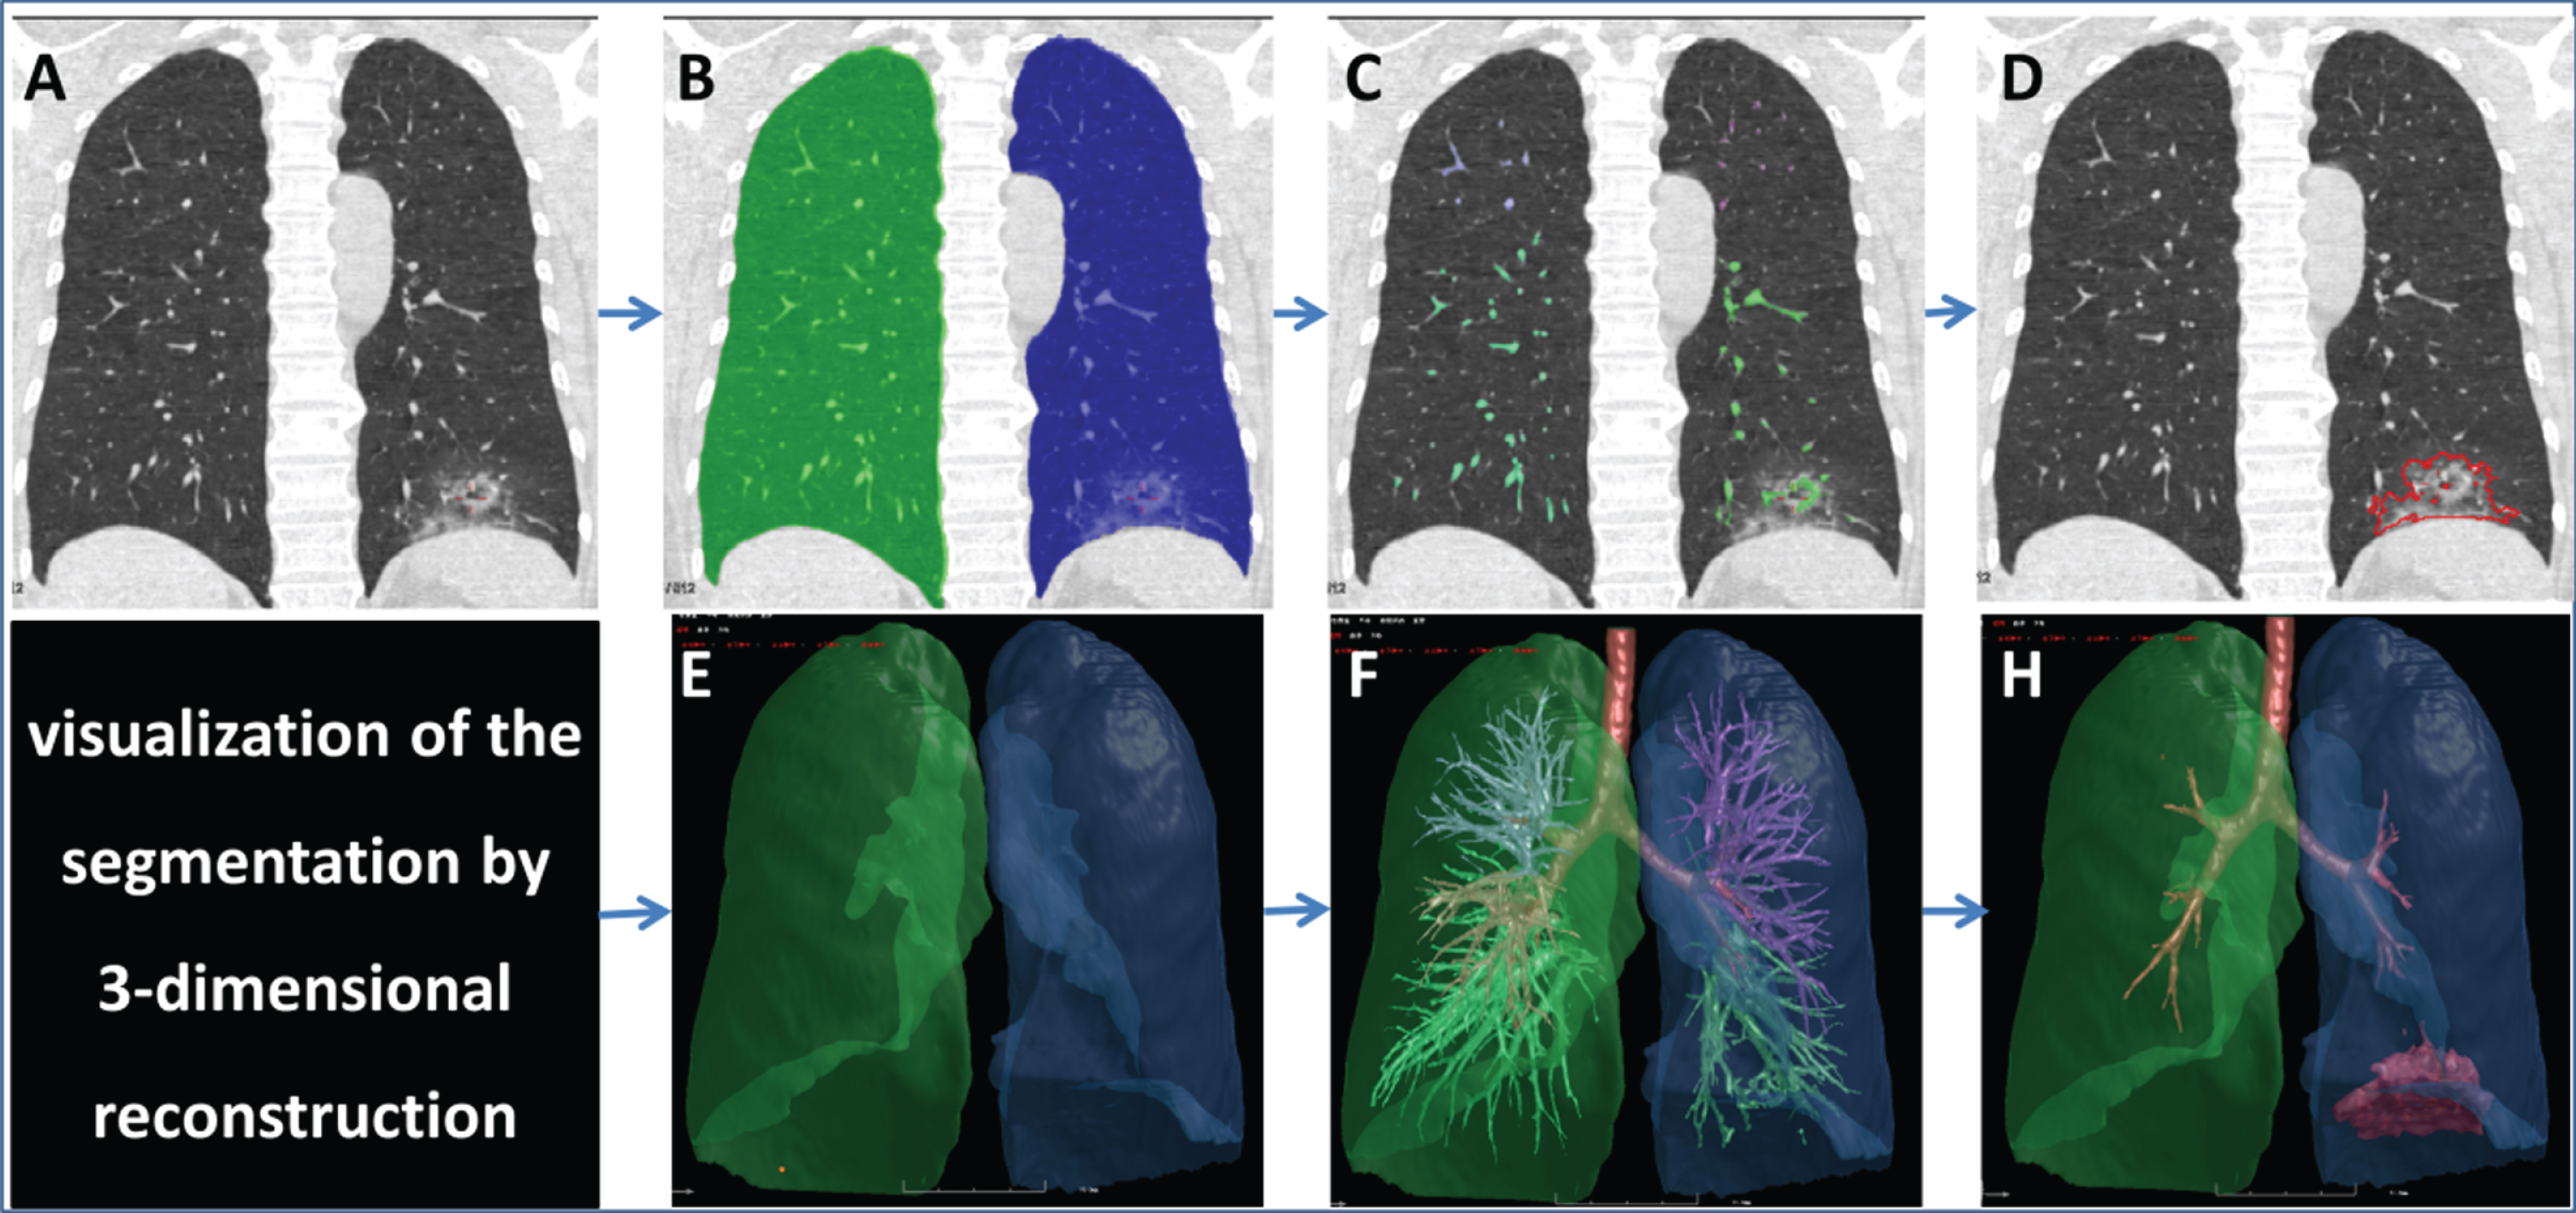
A computerized quantitative approach was used to evaluate the severity of COVID-19 [14]. The scheme consisted of four primary phases: (1) segmentation of the whole lung and 5 lobes by a well-established thresholding operation and adaptive boundary method based on intensity histogram analysis [15, 16]; (2) segmentation of the bronchus and pulmonary vessels by a differential geometric approach and a “puzzle game” procedure acting as a “correction” operation for filtering false identifications [17, 18]; (3) subtraction of the bronchial and pulmonary vessels from the lung region; and (4) detection of pneumonia based on the thresholds and adaptive regions growing (Fig. 2). The results of segmentation were reviewed by a radiologist with more than 10 years’ experience. The false positive pixels were deleted, and the false negative pixels were added manually.
Fig. 2
Illustrations of the steps of image segmentation. A 46-years-old male diagnosed with COVID-19 underwent initial chest CT examination, and showed sub-pleural ground-glass-opacity mixed with consolidation (A) in the left lower lobe. Four primary steps were conducted for segmentation. The first step includes segmentation of the lung (B) and 3-D reconstruction (E), the second step includes the segmentation of pulmonary vessels (C) and its 3-D reconstruction (F), the third step includes subtraction of the pulmonary vessels from the lung region, and finally the lesion border was identified and (D) visualized by 3-D technology (H). The LV, LeV, RLeV/LV, MLeD, MLD, and LAA-400% were 5607.31 ml, 53.42 ml, 0.95%, – 543.06HU, and 25.9%, respectively. Note: LV, lung volume; LeV, lesion volume; RLeV/LV, the ratio of lesion volume to lung volume; MLeD, mean lesion density; MLD, mean lung density; LAA-400%, percentage of low attenuation area lower than – 350HU.
2.3.2Automatically lesion quantification
The computerized parameters included the lung volume (LV/mL), lesion volume (LeV/mL), the ratio of lesion volume to lung volume (LeV%), mean lesion density (MLeD/HU), mean lung density (MLD/HU), and the percentage of pixels between – 400HU and – 600HU of the whole lung and each of the 5 lobes. As the volume and density were two independent factors in the severity assessment of COVID-19, a new index that includes both lesion percentage and lesion density into account was defined as the mass of lesion (LM/mL*HU). According to the autopsy studies [19], the lung weight was heavier than normal. The index of “lesion weight” is trying to quantify the lesion weight in living bodies combined with both the lesion scope (lesion volume) and lesion quality (lesion density).The formation was calculated using the formula: Lesion Weight = LeV% ×MLeD (HU). The dynamic changes of lesion parameters were evaluated for each patient, as illustrated in Fig. 3.
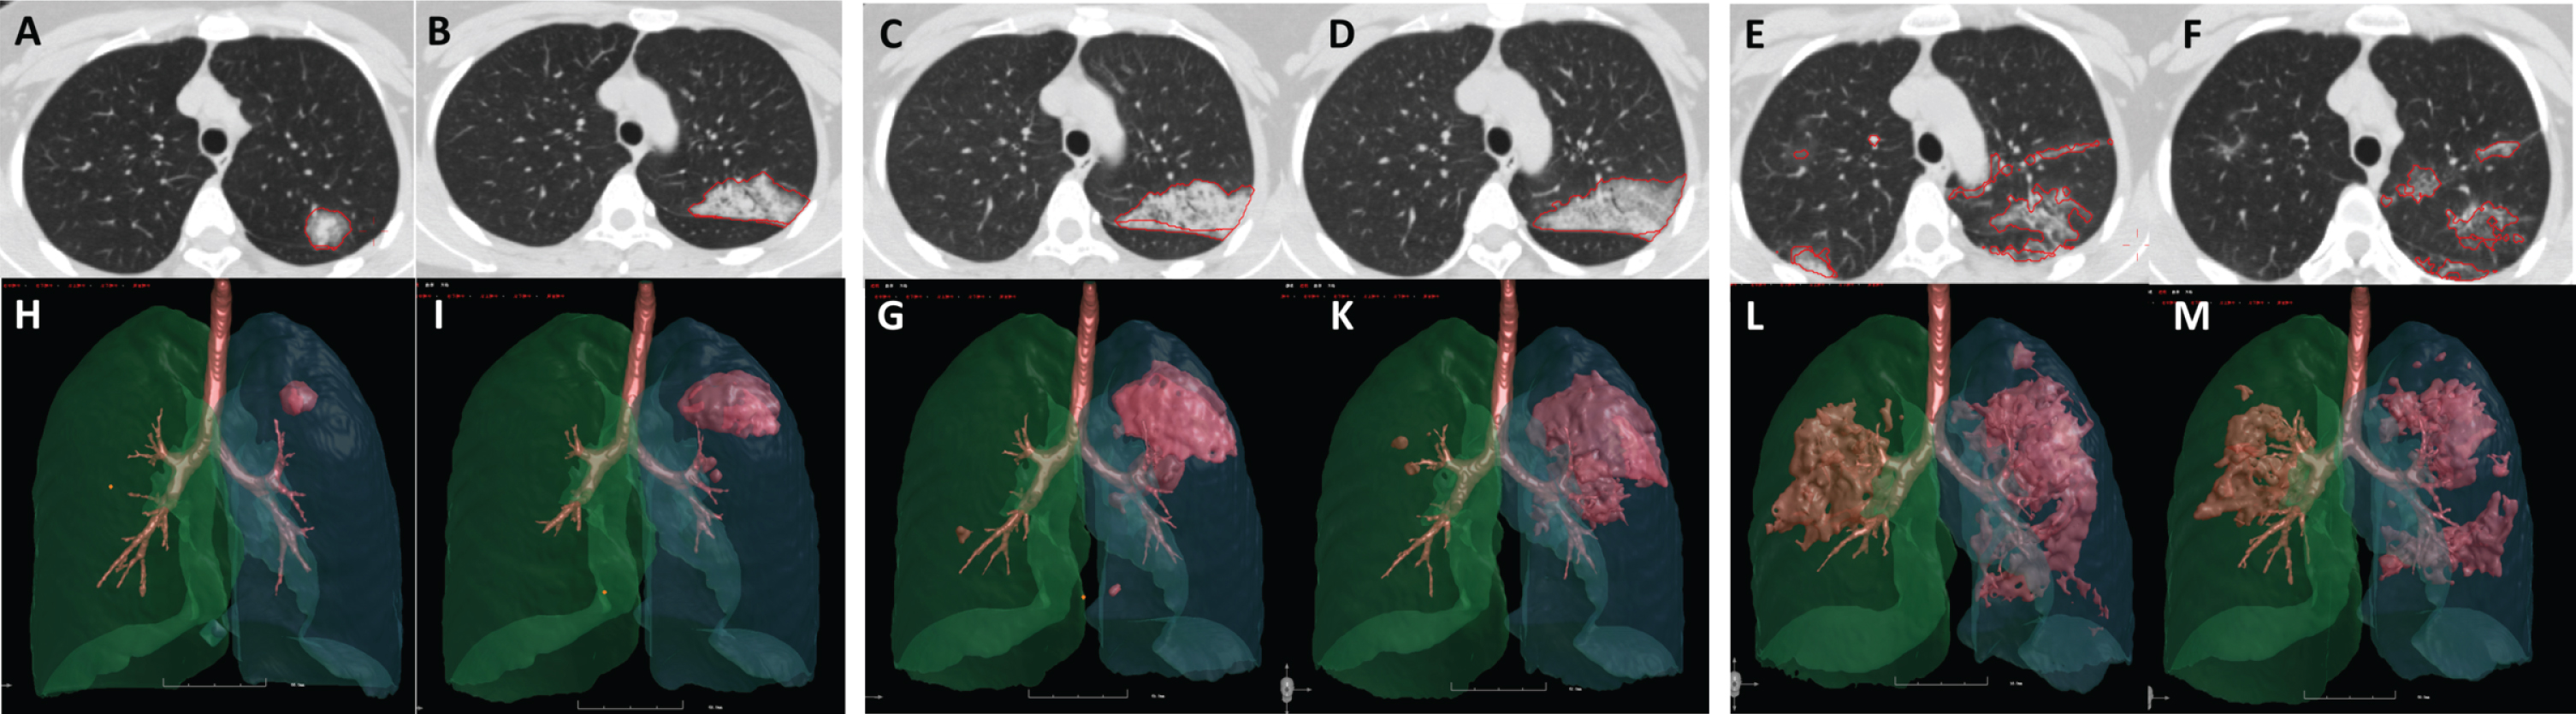
Fig. 3
The dynamic lung changes in a 38-year-old female COVID-19 patient. Images (from A to M) were obtained from a 38-year-old female COVID-19 patient. The chest CT images of day 1 (A, H), day 3 (B, I), day 5 (C, G), day 7 (D, K), day 12 (E, L) and day 28 (F, M) showed the dynamic changes of the lesions. The lesion volume reached the highest on day 12 (8.18 ml, 32.99 ml, 77.05 ml, 110.95 ml, 174.67 ml, 112.48 ml, respectively), and the lesion density reached the highest on day 5 (– 491.15HU, – 361.79HU, – 320.23HU, – 406.33HU, – 437.28HU, – 594.02HU, respectively). The standardized mass reached the highest on day 12 (0.0634, 0.1884, 0.3896, 0.7119, 1.2061, and 1.0550, respectively). This trend was consistent with that of the radiologists’ interpretation.
2.4Statistical analysis
Statistical analyses were performed using IBM SPSS Statistics (version 21; IBM, New York, USA). Discrete variables were presented as the number of cases and its percentage (%). Continuous data were presented as means±standard deviation (minimum-maximum). The spline insert function was used to fit the curves for each patient to clarify the trend of the volume and density changes. In the mathematical field of numerical analysis, spline interpolation [20] is a form of interpolation where the interpolant is a special type of piecewise polynomial called a spline. Spline interpolation is often preferred over polynomial interpolation because the interpolation error can be made small even when using low degree polynomials for the spline. The third order polynomial function was used to fit the curve in general patients.
3Results
3.1General lung characteristics of the enrolled patients
All enrolled patients were of moderate type of COVID-19 infected diseases according to the Diagnosis and Treatment Protocols of the National Health Commission [5]. The general demographic and clinical characteristics of all 28 enrolled patients were presented in Table 1.
Table 1
General characteristics of the enrolled 28 patients
| Items | All COVID-19 cases |
| Age/y | 44.35±14.15 |
| Gender (male/female) | 17/11 |
| Scan times (3/4/5/6/7/8) | 3/4/11/7/1/2 |
| Duration of hospitalization/days | 23.17±4.23 |
| Interval from the initial symptoms to the first admission | 3.57±2.84 |
| Symptoms | |
| fever | 24 (85.7%) |
| fatigue | 10 (35.7%) |
| cough | 20 (71.4%) |
| sputum | 17 (60.6%) |
| dyspnea | 15 (53.6%) |
| History | |
| high blood pressure | 3 (10.9%) |
| diabetes | 2 (7.1%) |
| smoking | 4 (14.28%) |
3.2The dynamic changes of the lesion volumes
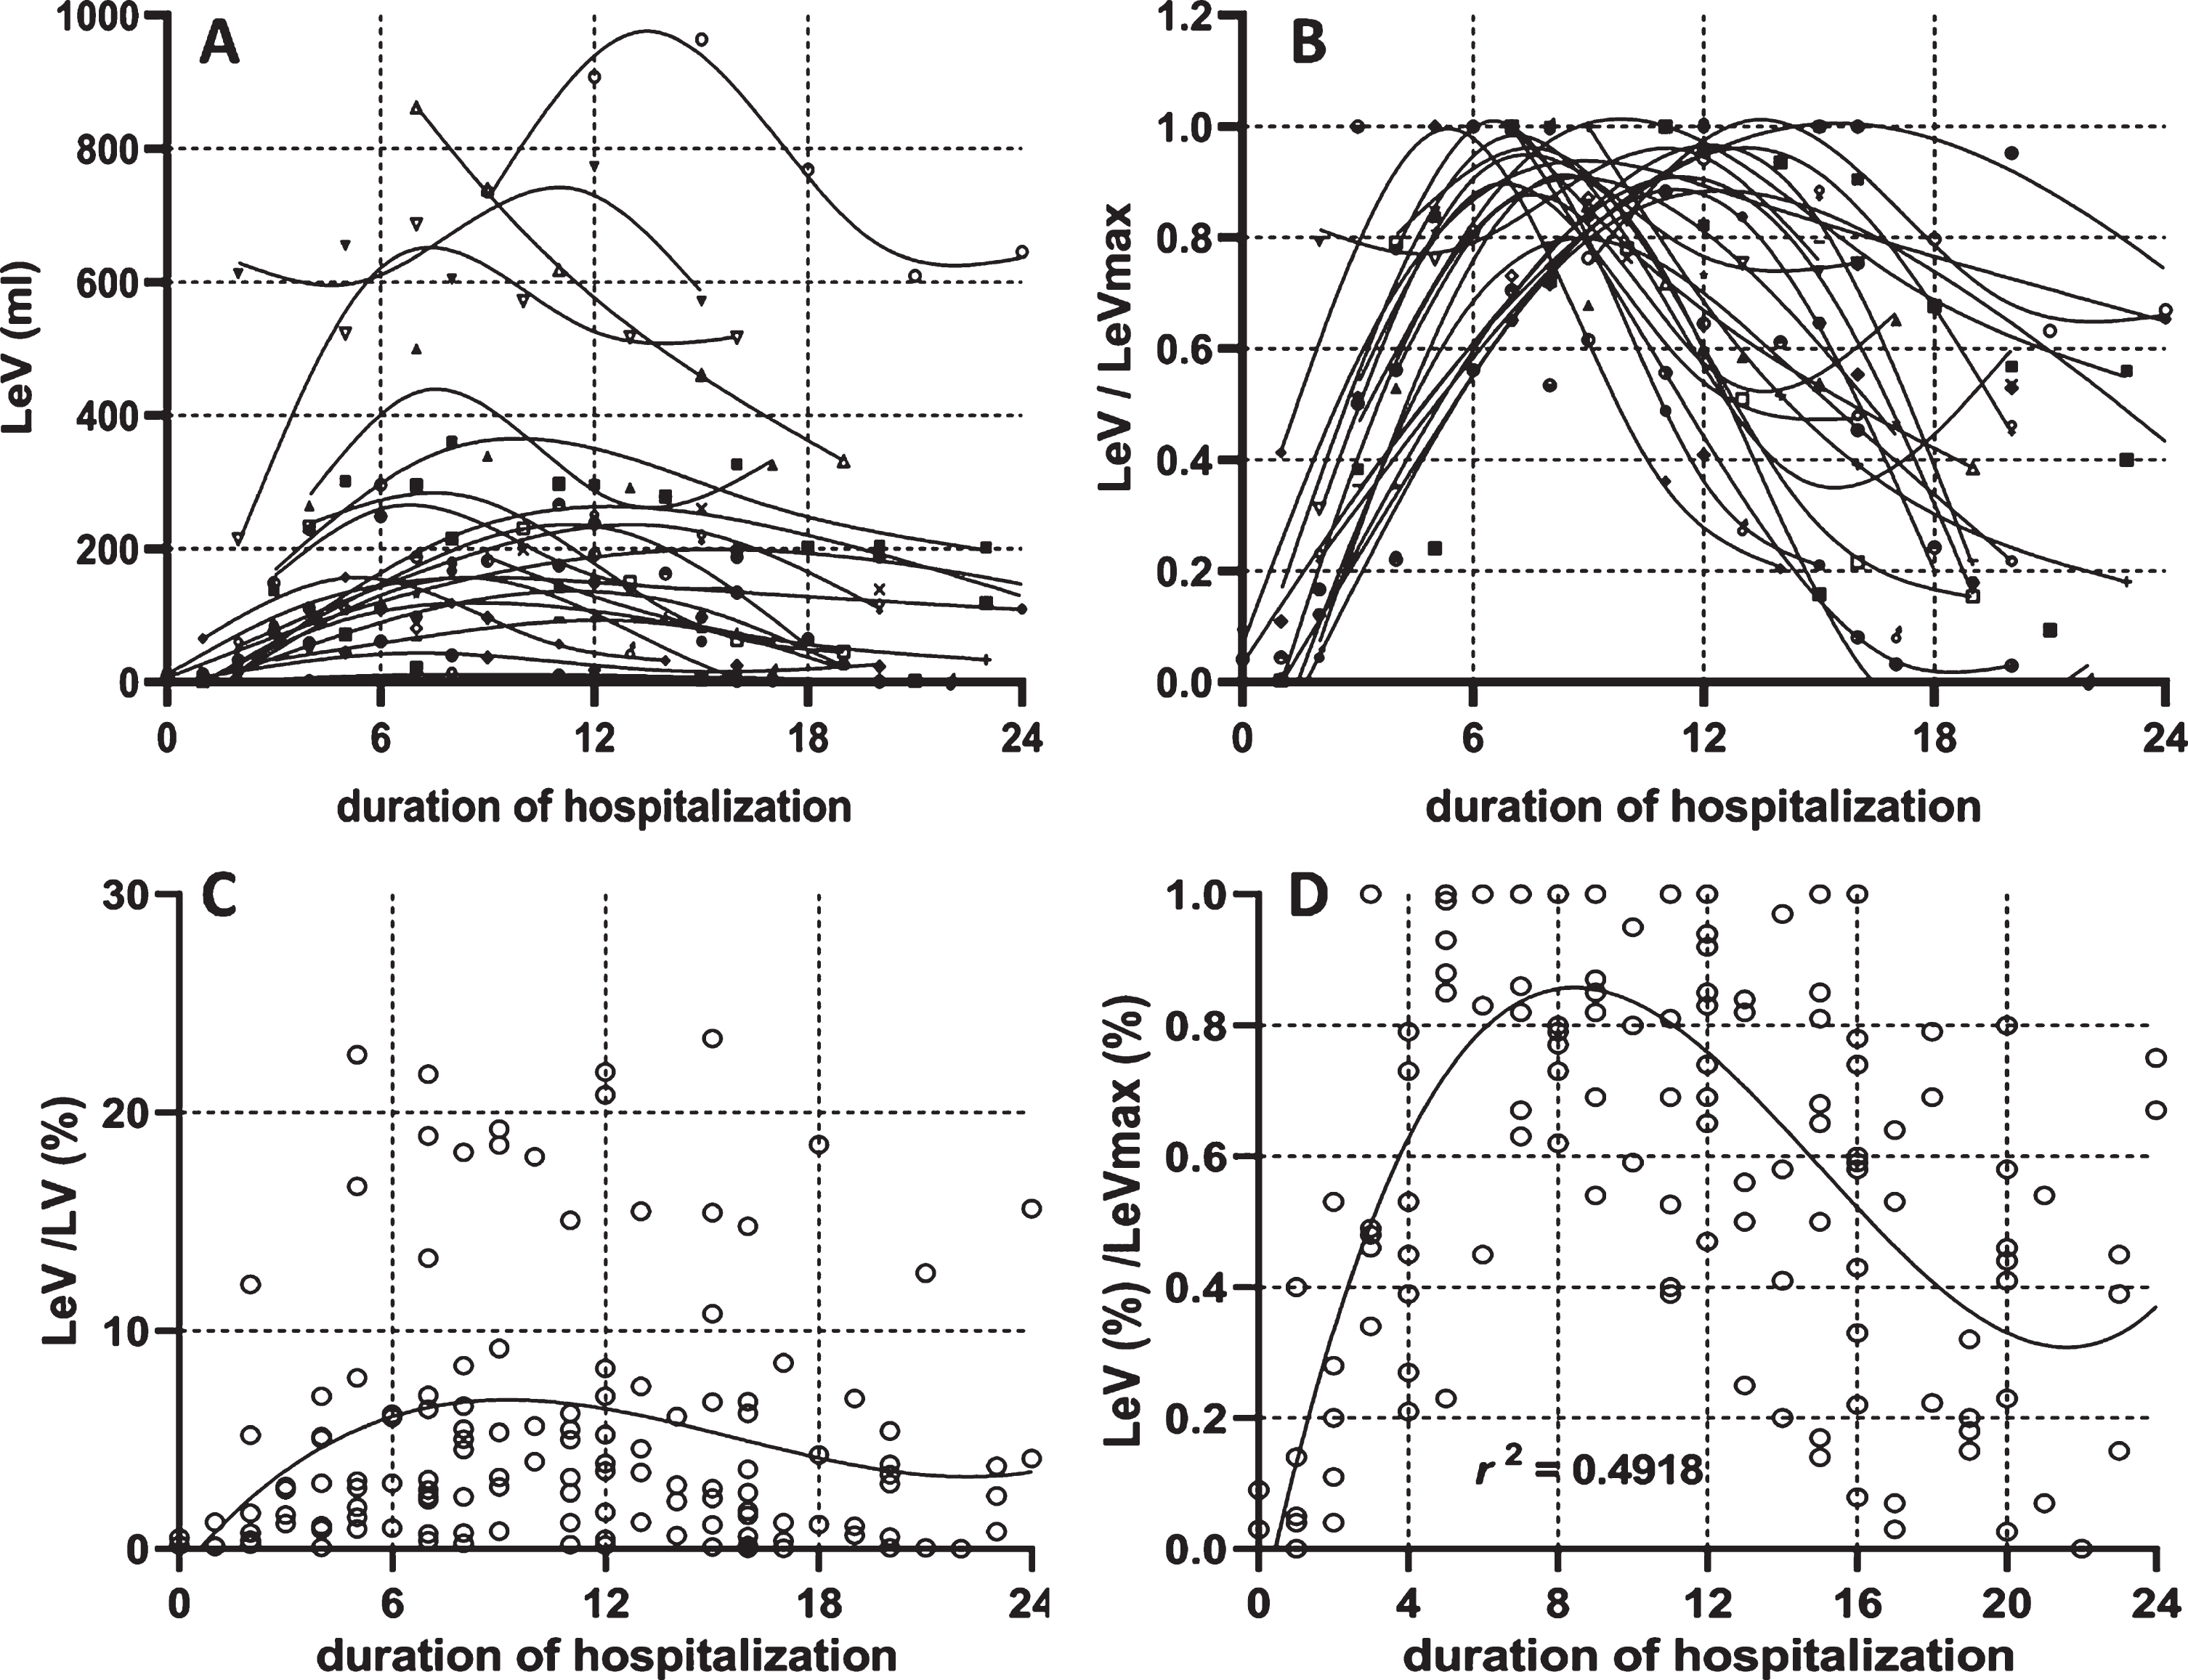
The dynamic changes in the lesion volume for each patient were plotted according to the course of the disease and were learned by the spline insertion method, as shown in Fig. 4-A. To show the dynamic changing trend without the effect of the lesion volume itself, all the lesion volumes were standardized by the patients’ largest lesion volume during the hospitalization (Fig. 4-B). The lesion percentage of general patients was plotted in Fig. 4-C and was standardized by each patient’s largest lesion percentage (Fig. 4-D). All scattered points were fitted using a third order polynomial with the R square reached to a level of 0.4918. From Fig. 4-D, it was deduced that the lesion reached its peak on day 9 from the day of initial symptom presentation, and then decreased within the next two weeks.
Fig. 4
Dynamic changes of the lesion volume. The dynamic changes of lesion volume in each patient (4-A) was plotted with a specific symbol according to the scan timing within the whole course. The lesion volume was divided by its maximal value among the entire duration (4-B). The dynamic changes of lesion percentage in general patients were plotted in Fig. 4-C according to the scan time during the whole course. The lesion percentage was standardized by its maximal value in the entire duration (4-D).
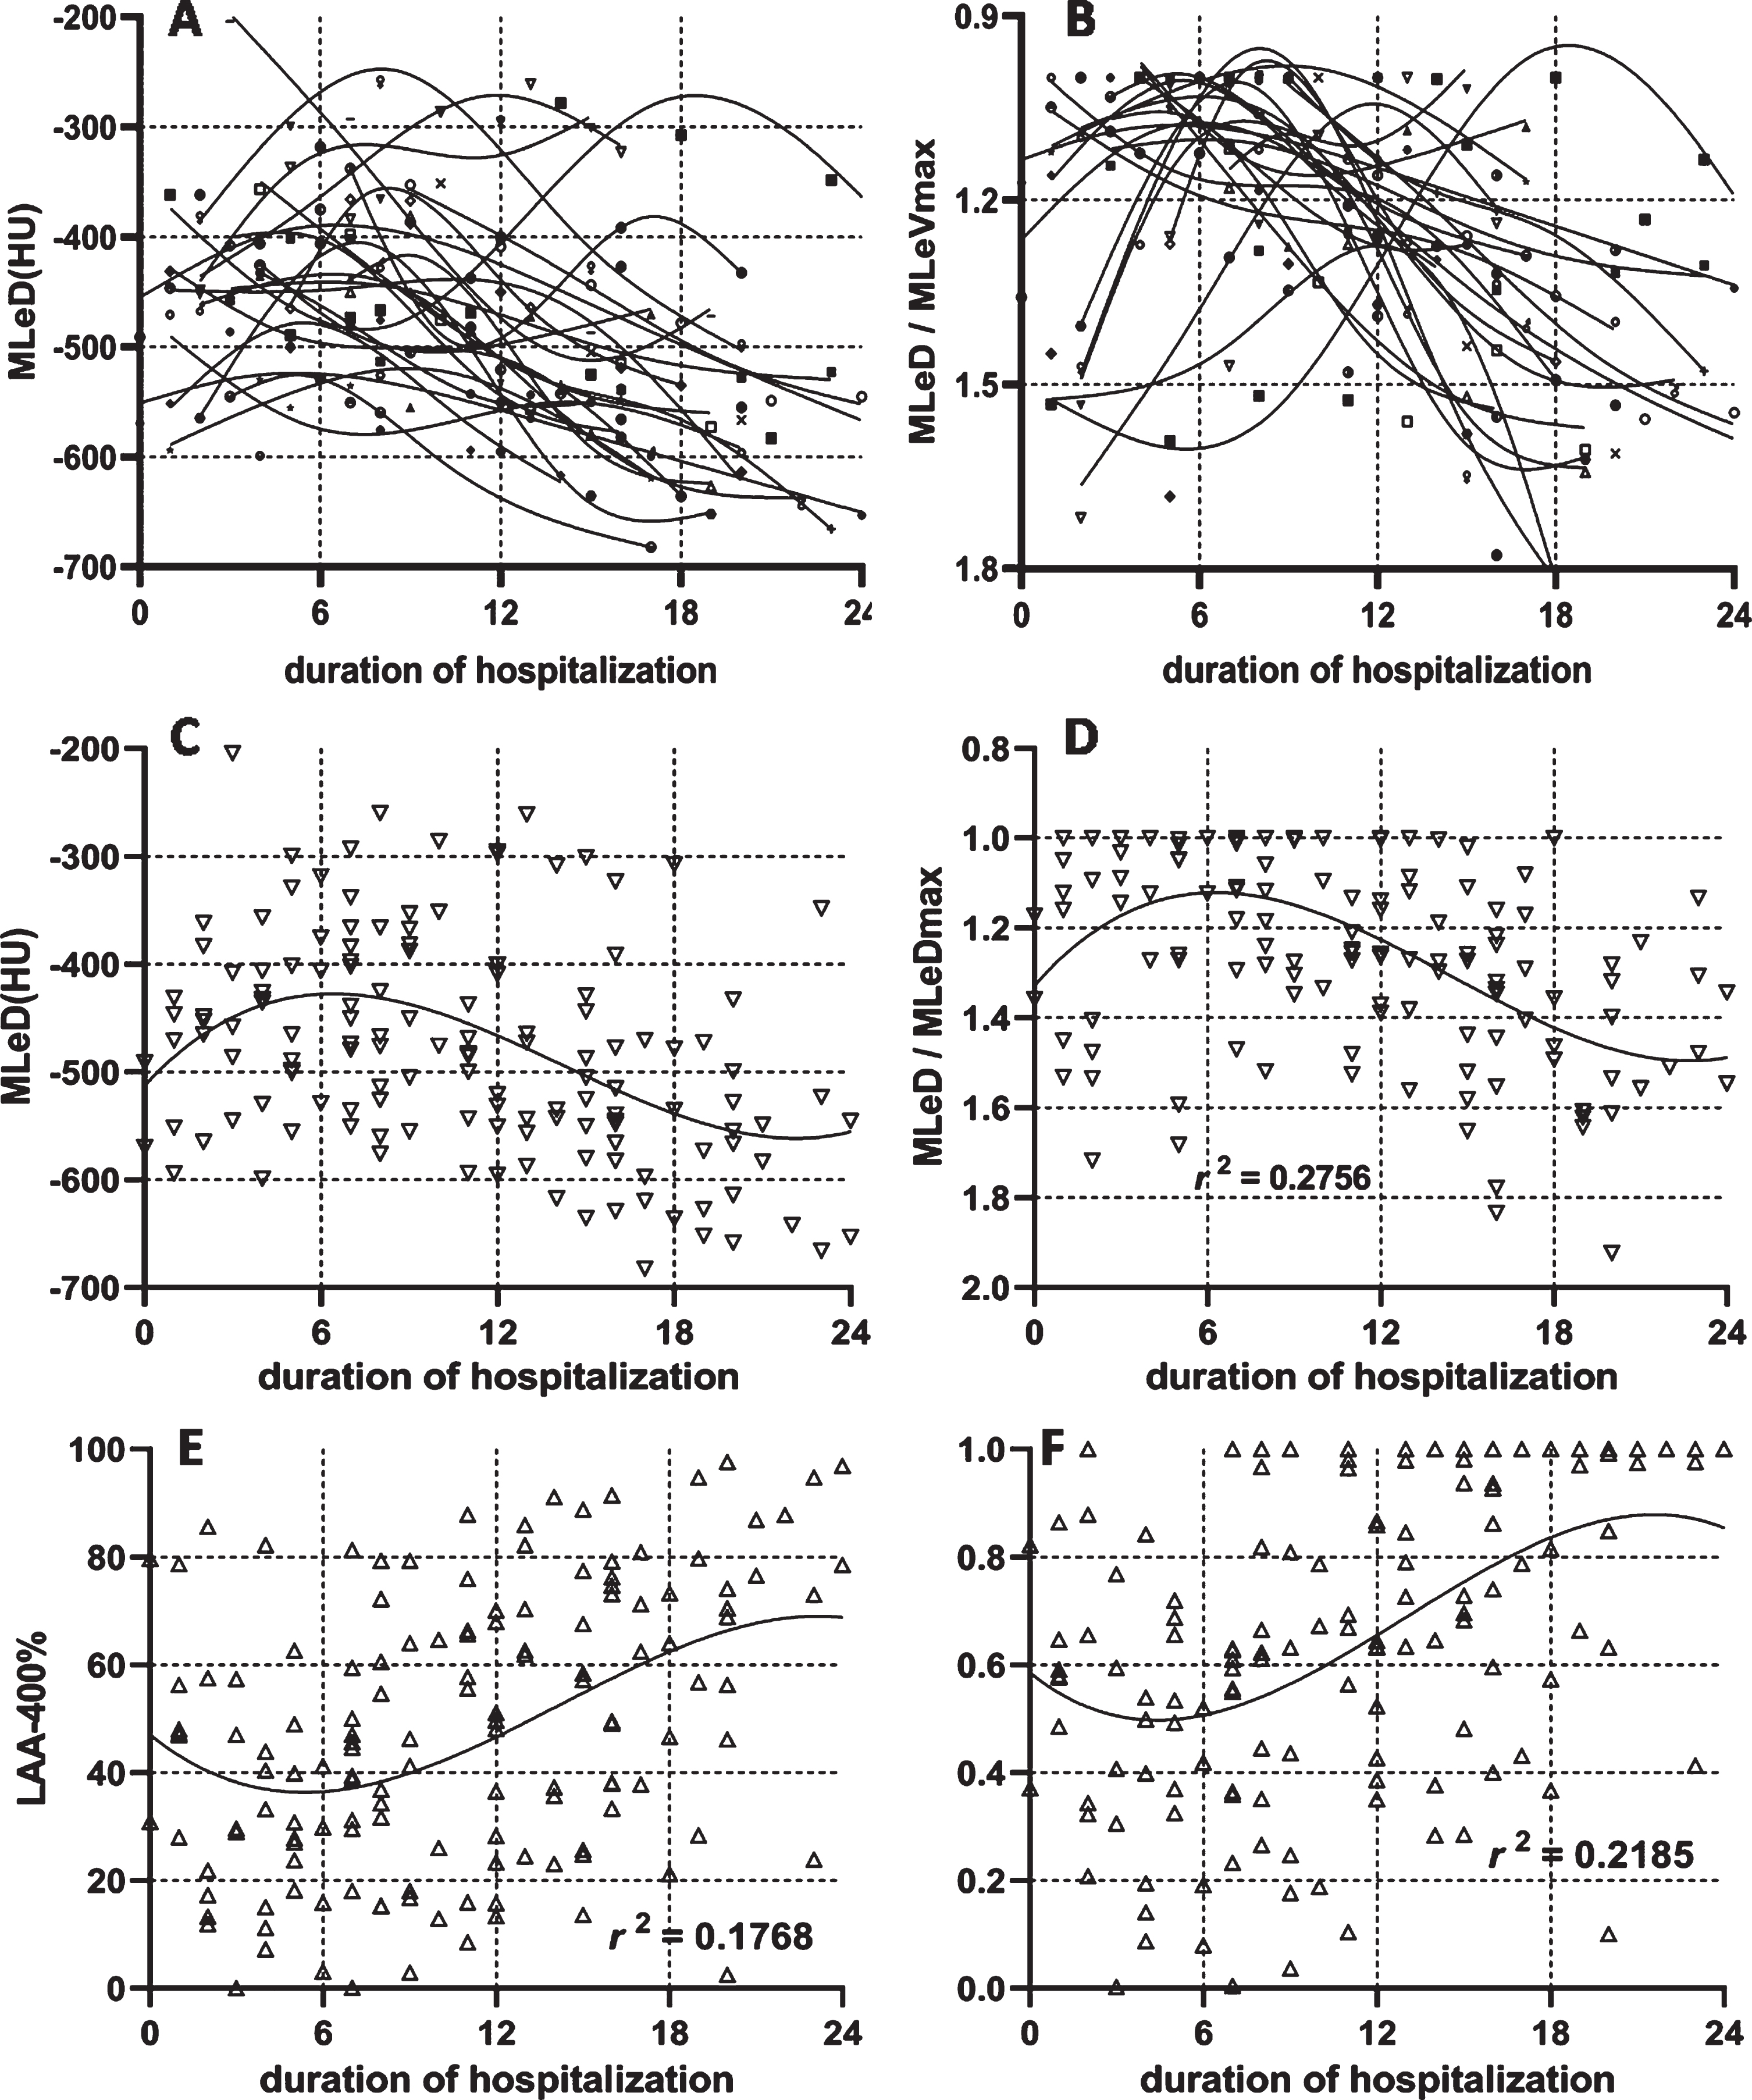
3.3The dynamic changes of the lesion density
The dynamic changes in lesion density of each patient were plotted in Fig. 5 according to the duration of hospitalization. The variation tendency of each patient was learned by the spline insert method (Fig. 5-A) and standardized by its largest value (Fig. 5-B). The dynamic changes of the lesion density in all patients were plotted in Fig. 5-C and were standardized by the highest lesion density in the patients in order to show the dynamic changing trend without affecting the lesion’s own density (Fig. 5-D). All scatter points were fitted with third order polynomial with the R square reaching a level of 0.2756. Figure 5-D revealed that the lesion reached its peak on day 6 from the day of initial symptoms, and then was decreased in the next two weeks. The dynamic changes of LAA-400% (Fig. 5-E) and its normalization (Fig. 5-F) were shown. From Fig. 5-F, the percentage of pixels’ density lower than – 400 HU was declined to the lowest on days 4–5, and then was increased until it reaches 100%.
Fig. 5
The dynamic changes of lesion density. The dynamic changes of lesion density for each patient (5-A) and standardized lesion density by its maximal value in the entire duration (5-B). The dynamic changes of lesion density in general patients (5-C) and standardized lesion density by its maximal value in the entire duration (5-D) were displayed. The dynamic changes in the percentage of lesion density was lower than – 400HU (5-E) and its standardized value (5-F) was presented.
3.4The dynamic changes of the lesion weight in general and each of the five lobes
The lesion weight that includes both lesion density and lesion volume into consideration was standardized. From Fig. 6-A, the severity of COVID-19 was known which mostly reached its peak on day 8, and then decreased.
Fig. 6
The dynamic changes of lesion weight in the five lobes of lungs in general patients.
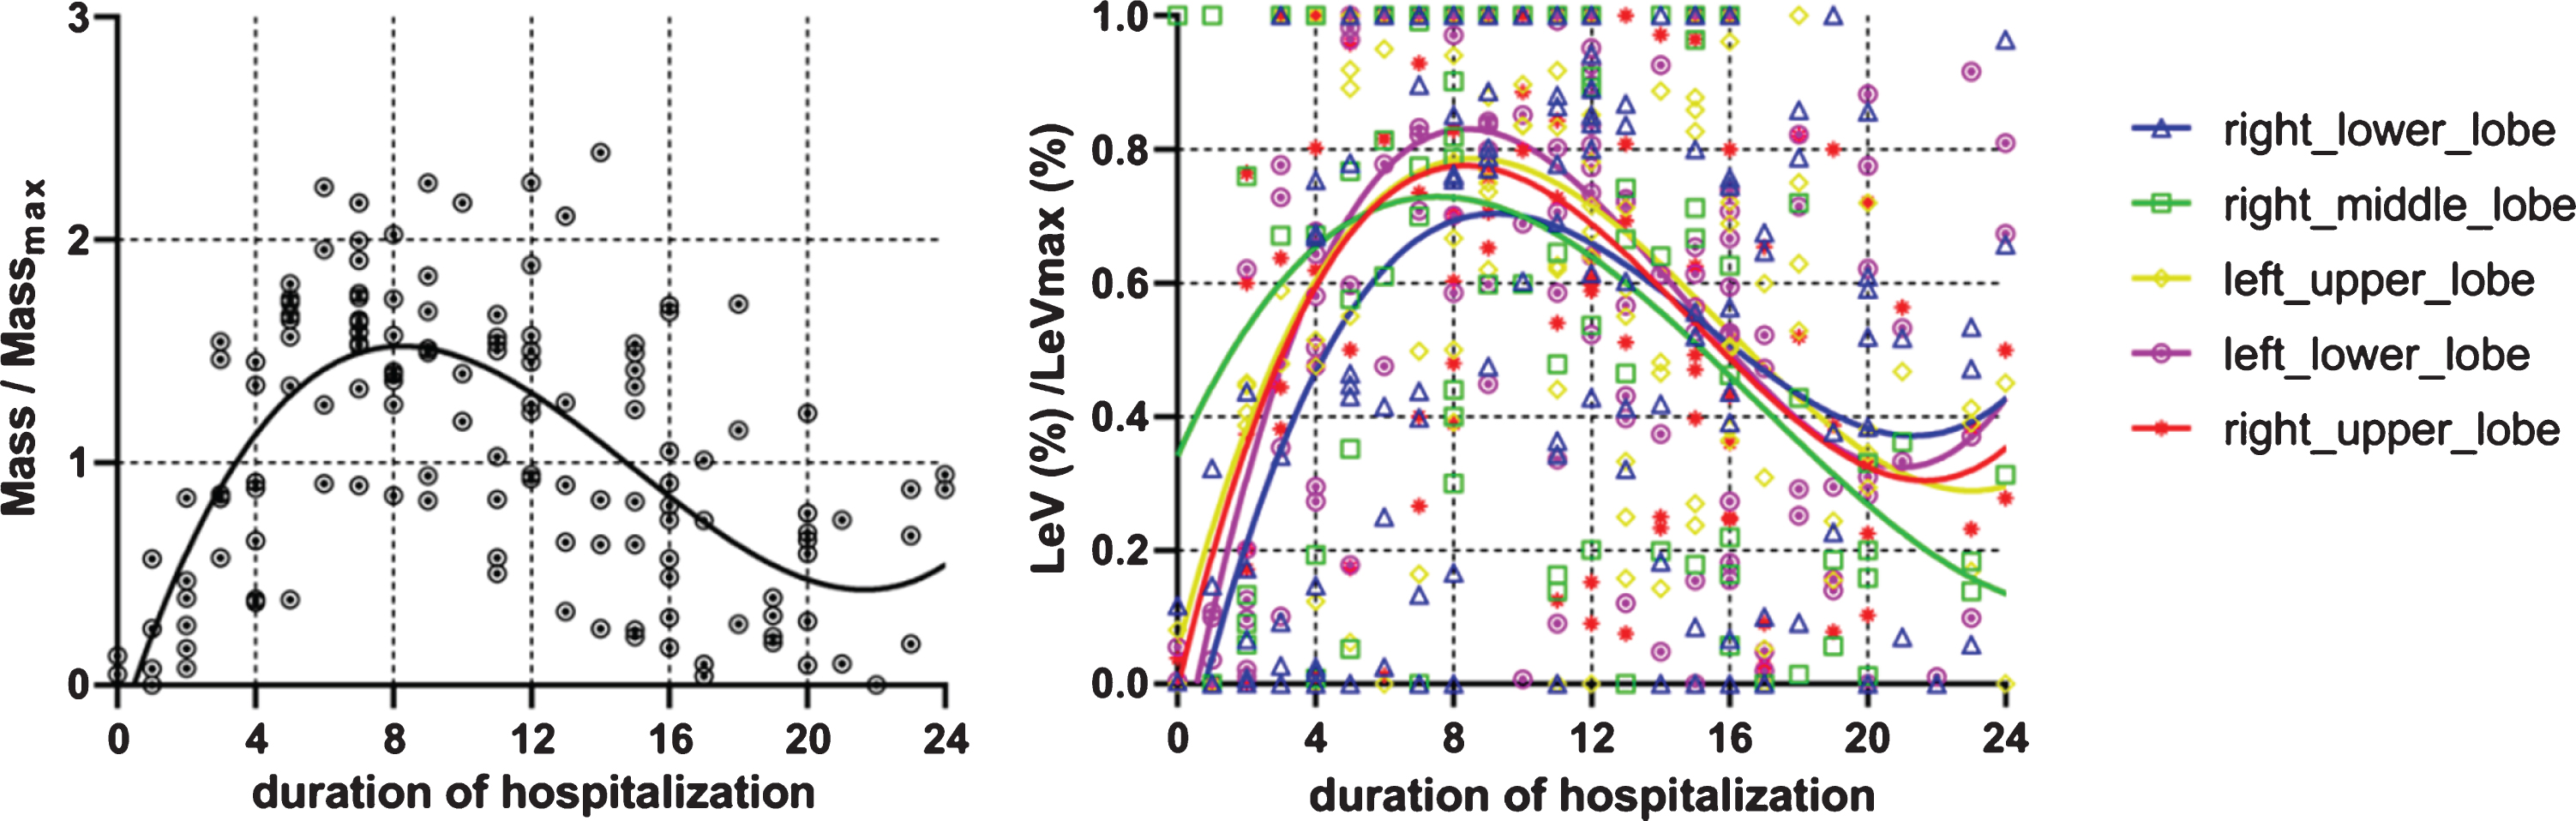
To learn the lesion distribution among the five lobes, the scan with the highest severity as assessed by the mass was chosen from multiple CT examinations in a patient for further analysis. Lesion distribution for specific lung lobe was defined as the percentage of total lobe volume to the total lesion volume. Table 2 showed that the lesion was more commonly seen in the bilateral lower lobes, followed by the left upper lobe, right upper lobe and right middle lobe. The dynamic changes of lesion weight of the 5 lobes were analyzed in Fig. 6-B. The right middle lobe was the earliest one (at 6–7 days) to reach its peak, while the right lower lobe was the latest one (at about 9–10 days) to reach its peak among the five lobes.
Table 2
Total lesion volume for five lobes of all patients
| Lesion distribution | Volume (mL) / percentage (%) |
| RUL | 1088.69 (14.00%) |
| RML | 175.35 (2.26%) |
| RLL | 2816.76 (36.23%) |
| LUL | 1080.92 (13.90%) |
| LLL | 2612.25 (33.60%) |
| Summary | 7773.97 (100%) |
Note: RUL, right upper lobe; RML, right middle lobe; RLL, right lower lobe; LUL, left upper lobe; LLL, left lower lobe.
4Discussion
COVID-19 has been declared as an international epidemic of public health concern by the WHO [21, 22]. Chest CT plays a vital role in the dynamic monitoring of severity of pneumonia. However, most of the dynamic analysis was based on physician assessed CT score, and this cannot avoid observer differences.
This study aimed to detect and quantify the lesion accurately by in-home software. It is known that the accurate dynamic changing trend is paramount for not only understanding the pathophysiology and natural history of infection, but also for predicting patient progression and potential complication development. Based on our knowledge, this is the first study for tracing the dynamic lung changes of COVID-19 by an accurate quantitative way in the aspect of lesion size and lesion density, as well as the distribution among the five lobes and the changes trending in the five lobes.
The results showed that the lesion size reached its largest value on day 9 of the initial symptoms. The results were similar with that of the previous study. In the study conducted by Pan [9] and Huang [23], the lung abnormalities on chest CT showed the greatest severity for approximately 10 days after the initial onset of the symptoms, except for cases with severity. In the study conducted by Wang [24], the extent of lung abnormalities on CT reached their peaked on days 6–11.
The lesion density reached the largest value on day 6 of the initial symptoms. The percentage of density was lower than that of – 400 HU (mostly the GGO) declining to the lowest on days 4–5, and then was increased. In a virological assessment study on COVID-19 [25], the pharyngeal virus shedding was peaked on day 4, and the average virus load was significantly decreased after day 5 of initial symptoms. This dynamic change of the lesion density is consistent with the changing pattern of the disease. In the previous study [24], a predominant pattern of abnormalities after symptom onset was shown to be ground-glass opacity, followed by ground-glass opacity with irregular linear opacity (paving pattern) and peaked consolidations on illness days 6–11, and the percentage of mixed pattern peaked on illness days 12–17, becoming the second most predominant pattern thereafter.
When both lesion size and lesion density were taken into consideration, for example, the lesion weight, the lesion was shown to reach peak on day 8. After day 8, the lesion burden remained decreasing. In the virological assessment study, no isolates were obtained from the samples taken after day 8 in spite of ongoing high viral loads [25].
The lesion was more commonly seen in the bilateral lower lobes, followed by the left upper lobe, the right upper lobe and the right middle lobe. The lobe involvement was similar with that of the previous studies [7]. In terms of five lobes, the right middle lobe was the earliest one while the right lower lobe was the latest one that reached peak among the five lobes. This can be explained based on the anatomy of the bronchus. ACE2 acts as a receptor of SARS-CoV-2 and mainly spreads through the respiratory tract. The right lower lobe has the longest length of the bronchus till the pulmonary alveoli, while the right middle lobe remained the shortest.
However, there are several limitations to our study. Firstly, the sample size in this study is still small. Secondly, selection bias is unavoidable as this is a retrospective study. All enrolled cases were imported from a province of China, and thus most of the cases were mild to moderate type. For severe cases X-ray is often chosen over CT as the first modality for severity assessment. The severe type would have more dynamic complicated changes, which is not discussed in this article. Third, the quantitative measurement would be affected as the patients were scanned by different scanners. Further investigations might contribute to the longer observation of dynamic changes.
Conflicts of interest statement
The authors report no conflicts of interest.
Acknowledgments
The authors would like to express their gratitude to the funders, and this study was supported by the Science and Technology Project of Shaanxi Province (No. 2018SF-264, 2019JM-361), The National Natural Science Foundation of China (81701691), Natural and Science Foundation of Shaanxi Province (2019JM-361).
References
[1] | Zhu N. , Zhang D. , Wang W. , et al., A Novel Coronavirus from Patients with Pneumonia in China, 2019, N Engl J Med 382: ((2020) ), 727–733. |
[2] | Cheng S.C. , Chang Y.C. , Fan Chiang Y.L. , et al., First case of Coronavirus Disease 2019 (COVID-19) pneumonia in Taiwan, J Formos Med Assoc 119: ((2020) ), 741–751. |
[3] | Ki M. , Task Force for 2019-nCoV, Epidemiologic characteristics of early cases with 2019 novel coronavirus (2019-nCoV) disease in Republic of Korea, Epidemiol Health (2020), e2020007. |
[4] | Eurosurveillance Editorial Team, Updated rapid risk assessment from ECDC on the outbreak of COVID-19: increased transmission globally, Euro Surveill 25: (9) ((2020) ), 2003051. |
[5] | National Health Commission of the People’s Republic of China. Diagnosis and treatment protocols of Coronavirus Disease 2019 (trial version 7), http://www.nhc.gov.cn/xcs/zhengcwj/202003/46c9294a7dfe4cef80dc7f5912eb1989.shtml Published on March 4, 2020. |
[6] | Sanche S. , Lin Y.T. , Xu C. , et al., High Contagiousness and rapid spread of severe acute respiratory syndrome coronavirus 2, Emerg Infect Dis 26: (7) ((2020) ), 1470–1477. |
[7] | Lei P. , Huang Z. , Liu G. , et al., Clinical and computed tomographic (CT) images characteristics in the patients with COVID-19 infection: what should radiologists need to know?, J Xray Sci Technol 28: (3) ((2020) ), 369–381. |
[8] | Kim H. , Hong H. , Yoon S.H. , Diagnostic performance of CT and reverse transcriptase-polymerase chain reaction for coronavirus disease 2019: a meta-analysis, Radiology (2020), DOI: 10.1148/radiol.2020201343 |
[9] | Pan F. , Ye T. , Sun P. , et al., Time course of lung changes on chest CT during recovery from 2019 novel coronavirus (COVID-19) pneumonia, Radiology (2020), DOI:10.1148/radiol.2020200370 |
[10] | Dai W.C. , Zhang H.W. , Yu J. , et al., CT imaging and differential diagnosis of COVID-19, Can Assoc Radiol J. (2020), DOI:10.1177/0846537120913033 |
[11] | Zu Z.Y. , Jiang M.D. , Xu P.P. , et al., Coronavirus disease 2019 (COVID-19): A Perspective from China, Radiology (2020), DOI:10.1148/radiol.2020200490 |
[12] | Zhou S. , Wang Y. , Zhu T. , et al., CT features of coronavirus disease 2019 (COVID-19) pneumonia in 62 patients in Wuhan, China, Am J Roentgenol 214: (6) ((2020) ), 1287–1294. |
[13] | Colombi D. , Bodini F.C. , Petrini M. , et al., Well-aerated lung on admitting chest CT to predict adverse outcome in COVID-19 pneumonia, Radiology (2020), DOI:10.1148/radiol.2020201433 |
[14] | Shen C. , Yu N. , Cai S. , et al., Quantitative computed tomography analysis for stratifying the severity of coronavirus disease 2019, J Pharm Anal 10: (6) ((2020) ), 123–129. |
[15] | Pu J. , Roos J. , Yi C.A. , et al., Adaptive border marching algorithm: automatic lung segmentation on chest CT images, Comput Med Imaging Graph 32: ((2008) ), 452–462. |
[16] | Pu J. , Zheng B. , Leader J.K. , et al., Pulmonary lobe segmentation in CT examinations using implicit surface fitting, IEEE Trans Med Imaging 28: ((2009) ), 1986–1996. |
[17] | Zhao W. , Liu H. , Leader J.K. , et al., Computerized identification of the vasculature surrounding a pulmonary nodule, Comput Med Imaging Graph 74: ((2019) ), 1–9. |
[18] | Gu S. , Fuhrman C. , Meng X. , et al., Computerized identification of airway wall in CT examinations using a 3D active surface evolution approach, Med Image Anal 17: ((2013) ), 283–296. |
[19] | Bian X.W. , the COVID-19 Pathology Team, Autopsy of COVID-19 victims in China. National Science Review (2020), nwaa123. |
[20] | Segeth K. , Some splines produced by smooth interpolation, Applied Mathematics and Computation 319: ((2018) ), 387–394. |
[21] | Kinross P. , Suetens C. , Gomes Dias J. , et al., Rapidly increasing cumulative incidence of coronavirus disease (COVID-19) in the European Union/European Economic area and the United Kingdom, 1 January to 15 March 2020, Euro Surveill 25: (11) ((2020) ), 2000285. |
[22] | Guo Y.R. , Cao Q.D. , Hong Z.S. , et al., The origin, transmission and clinical therapies on coronavirus disease 2019 (COVID-19) outbreak - an update on the status, Mil Med Res 7: (1) ((2020) ), 11. |
[23] | Huang C. , Wang Y. , Li X. , et al., Clinical features of patients infected with 2019 novel coronavirus in Wuhan, China, Lancet 395: ((2020) ), 497–506. |
[24] | Wang Y. , Dong C. , Hu Y. , et al., Temporal changes of CT findings in 90 patients with COVID-19 pneumonia: alongitudinal study, Radiology (2020), DOI:10.1148/radiol.2020200843 |
[25] | Wolfel R. , Corman V.M. , Guggemos W. , et al., Virological assessment of hospitalized patients with COVID-2019, Nature 581: ((2020) ), 465–469. |

