
Lockdown Amid COVID-19 Ascendancy over Ambient Particulate Matter Pollution Anomaly

 ,
,  , ,
, ,  , and
, and
Abstract
:
1. Introduction
2. Impact of Lockdown on PM Mass Concentration
2.1. Inference of Lockdown on Emission Sources
2.2. Inference of Lockdown on the Primary and Secondary Formation of PM
2.3. Influence of Lockdown on the Composition of PM
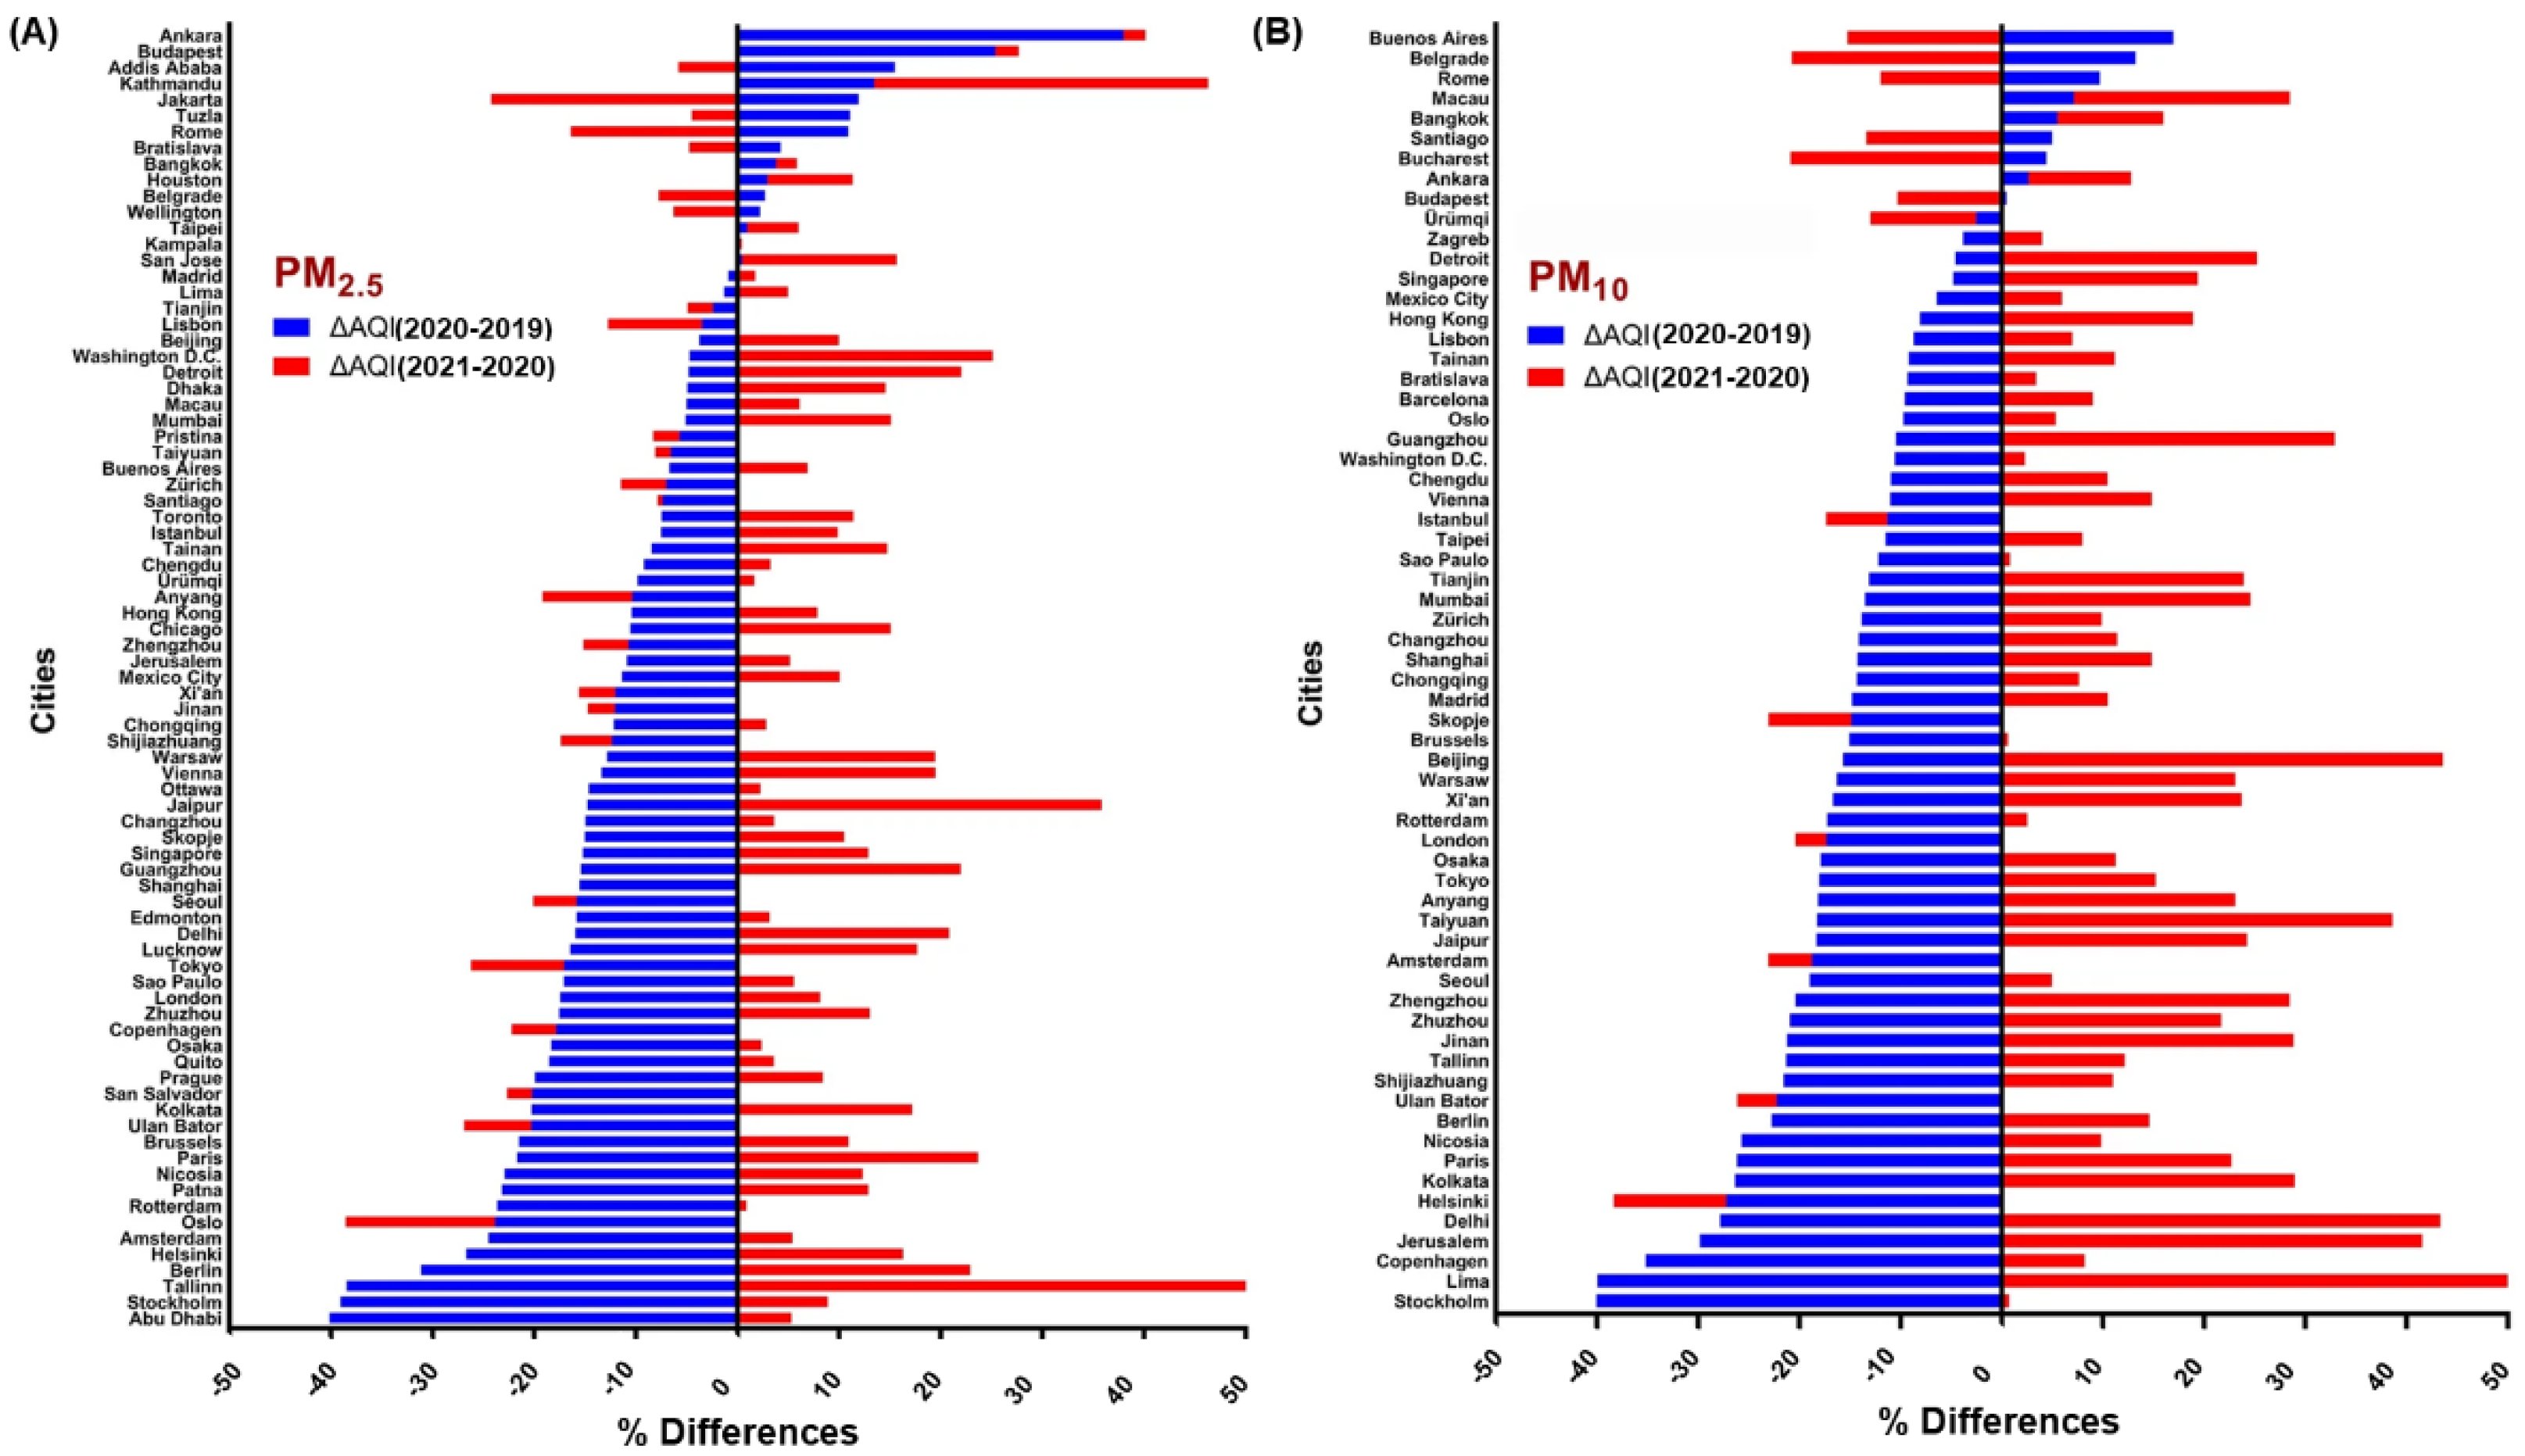
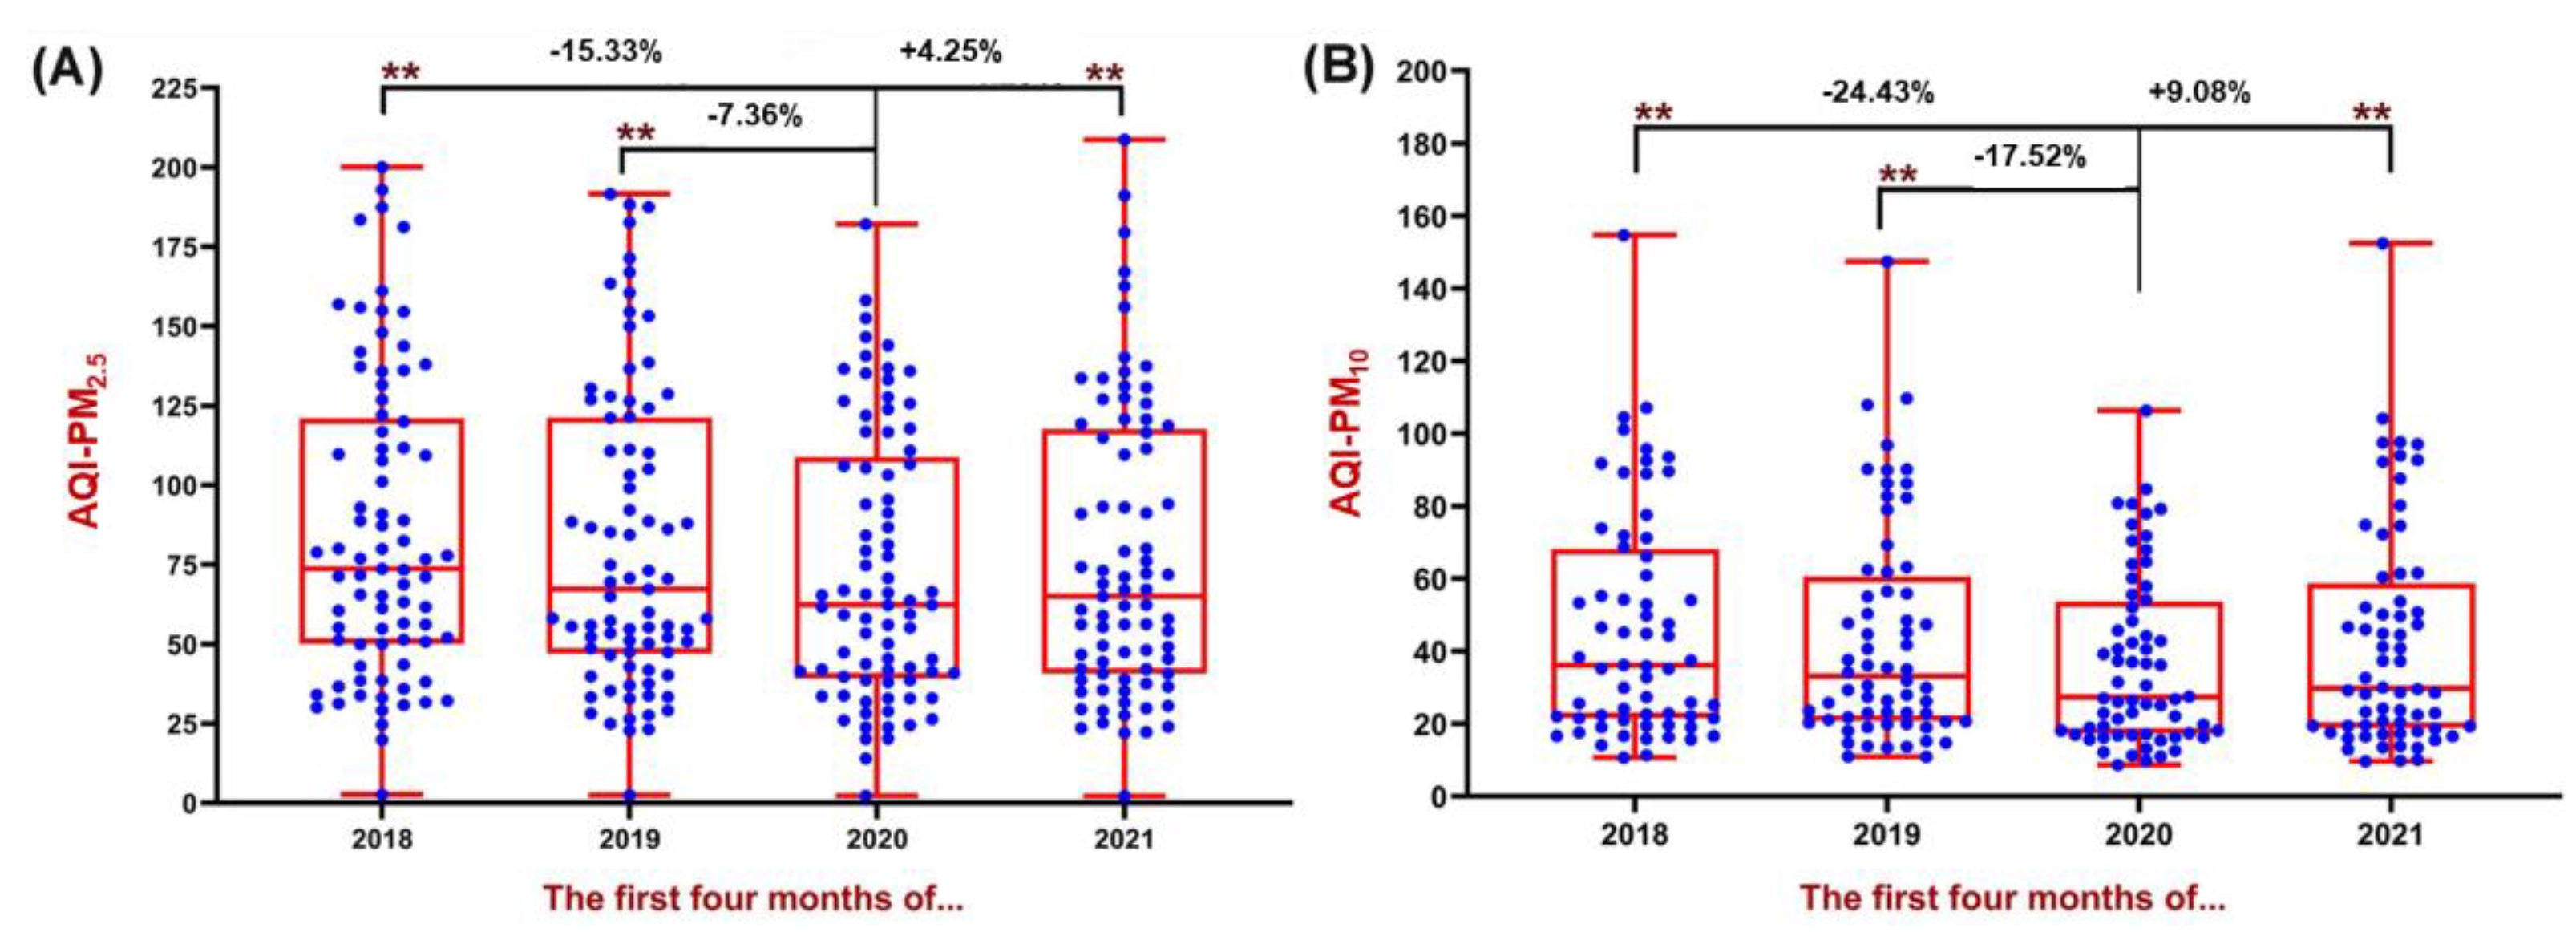
2.4. Influence of Lockdown on PM2.5− and PM10− Based Air Quality Index
3. Influence of Meteorological Factors on PM Level and COVID-19 Cases

| Meteorological Factor | Location | COVID-19 or PM Pollution | Findings | Reference |
|---|---|---|---|---|
| Temperature | USA (New York) | COVID-19 | COVID-19 cases decreased significantly with an increase in average and minimum temperatures. | [113] |
| Temperature | China (10 affected provinces) | COVID-19 | Temperature and COVID-19: asymmetric nexus—some show positive, some show negative, and a few show mixed signs. | [123] |
| Temperature | China (Wuhan) | COVID-19 | A temperature increase does not appear to be able to slow down or contain COVID-19 infections. | [117] |
| Temperature | China (17 different cities) | COVID-19 | An increase of 1 ℃ in the ambient temperature was associated with a decline in the daily confirmed case count. | [118] |
| Temperature | China | COVID-19 | Lower and higher temperatures may reduce COVID-19 incidence. | [119] |
| Temperature | Italy | COVID-19 | With an increase of 1 °C in average daily temperature, the number of cases decreased by approximately 6.4 per day. | [114] |
| Temperature | India | COVID-19 | Temperature causes an increase in the number of daily infections, and co-variability accounts for 85–50% of them. | [124] |
| Temperature | India | COVID-19 | A positive correlation between new cases of COVID-19 and the increasing temperature in the region. | [125] |
| Temperature | India | PM | Temperature and PM2.5 showed a strong negative correlation (r = −0.546). | [83] |
| Temperature | India’s 9 most affected cities | PM | The diurnal range in temperature is not significantly correlated. | [126] |
| Temperature | Top 20 countries | COVID-19 | The number of confirmed cases and deaths associated with COVID-19 decreases with high temperatures and increases with cold temperatures. | [127] |
| Humidity | USA (New York) | COVID-19 | Humidity doesn’t seem to play a significant role in the total number of cases. | [113] |
| Humidity | China (all provincial capitals) | COVID-19 | An increase of 1 g/m3 in absolute humidity was significantly associated with a reduction in confirmed cases. | [118] |
| Humidity | China | COVID-19 | The incidence of COVID-19 and absolute humidity did not show a significant association. | [119] |
| Humidity | India, 12 cities | COVID-19 | No correlation with RH. | [124] |
| Humidity | India | COVID-19 | COVID-19 shows a negative association with RH values up to mid-May, and then shows a positive association (showing again that increasing humidity does not affect India’s COVID-19 rates). | [125] |
| Humidity | India’s 9 most affected cities | COVID-19 | The daily range of RH is not significantly correlated. | [126] |
| Humidity | Pakistan | COVID-19 | Except for Lahore (r = 0.175), there is a significant correlation between COVID-19 cases and humidity. | [128] |
| Humidity | Top 20 countries | COVID-19 | There is a strong correlation between RH and COVID-19 incidence. RH increases the viability and persistence of the virus. Low RH is reported to prolong the viability and stability of Coronaviruses on contaminated surfaces. | [127] |
| Humidity | Iran (Tehran, Mazandaran, Alborz, Gilan, and Qom) | COVID-19 | COVID-19 cases increased with RH. | [129] |
| Rain Fall | USA | COVID-19 | COVID-19 is negatively and weakly correlated. | [113] |
| Rain Fall | Italy | COVID-19 | Each inch/day increases disease transmission. | [114] |
| Rain Fall | India | PM | Amount of rainfall contributed to the reduction in PM. | [82] |
| Wind speed | USA | COVID-19 | The speed of the wind does not play a significant role in the spread of viruses. | [113] |
| Air masses’ movement | India | PM | The movement of air masses also played a significant role in reducing PM. | [82] |
| Wind speed and pressure | Top 20 countries | COVID-19 | Virus spread is accelerated by both wind speed and surface pressure intensities. | [127] |
| Wind speed, | Iran (Tehran, Mazandaran, Alborz, Gilan, and Qom) | COVID-19 | COVID-19 cases increased due to the low wind speed. | [129] |
| Radiation exposure | Iran (Tehran, Mazandaran, Alborz, Gilan, and Qom) | COVID-19 | COVID-19 increased with high solar radiation. | [129] |
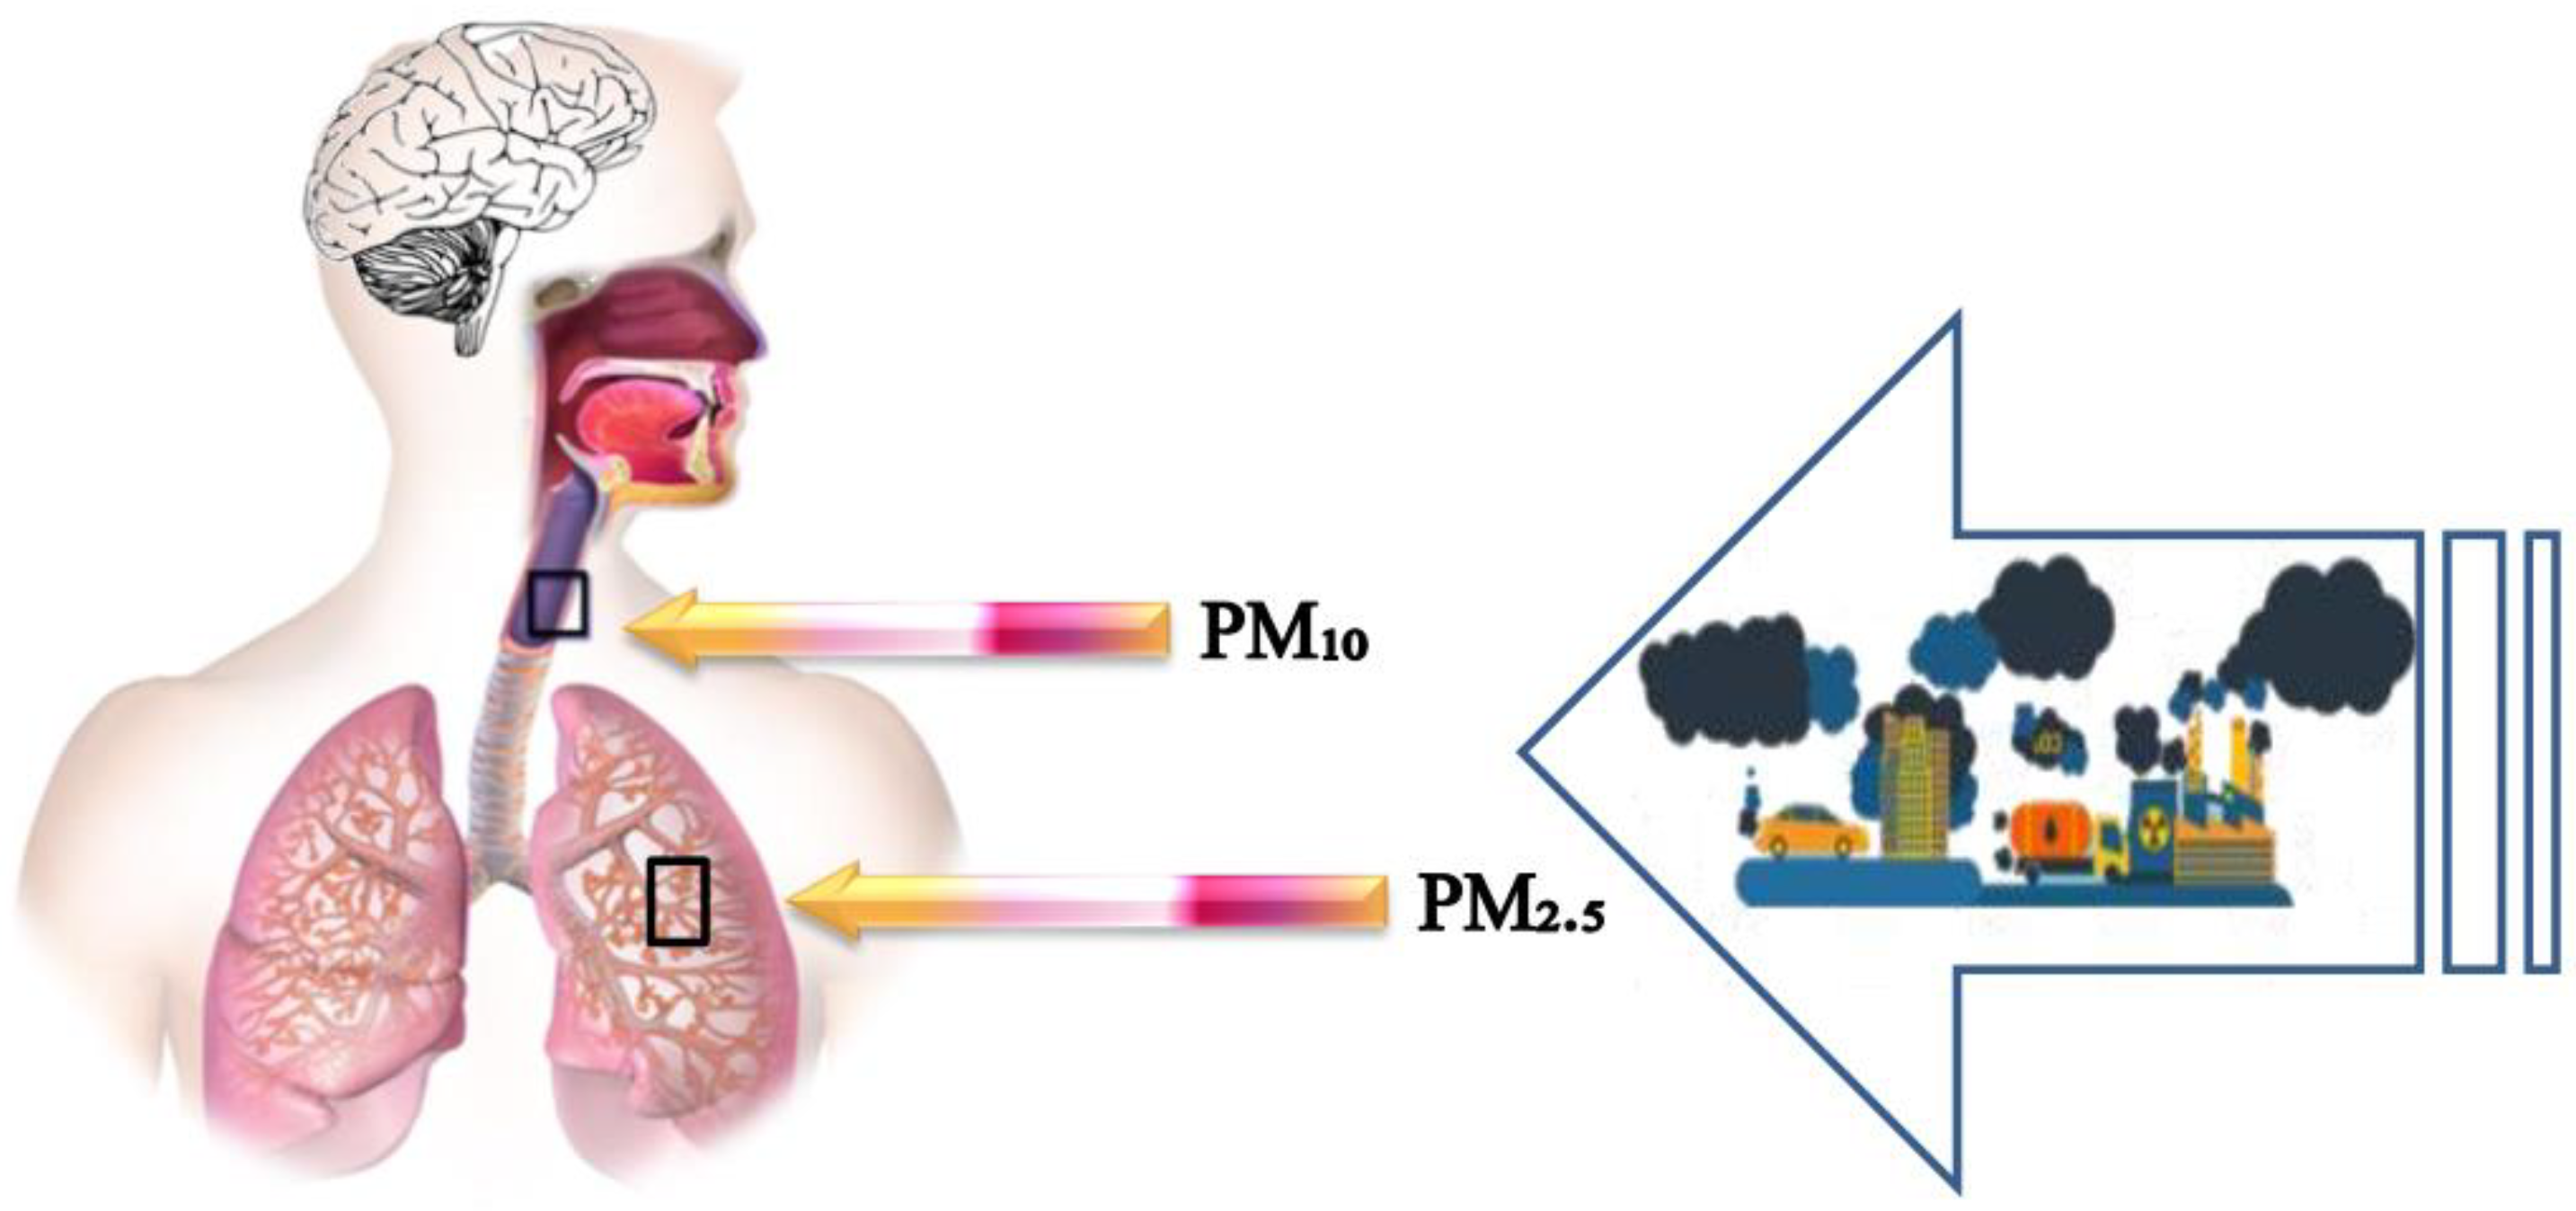
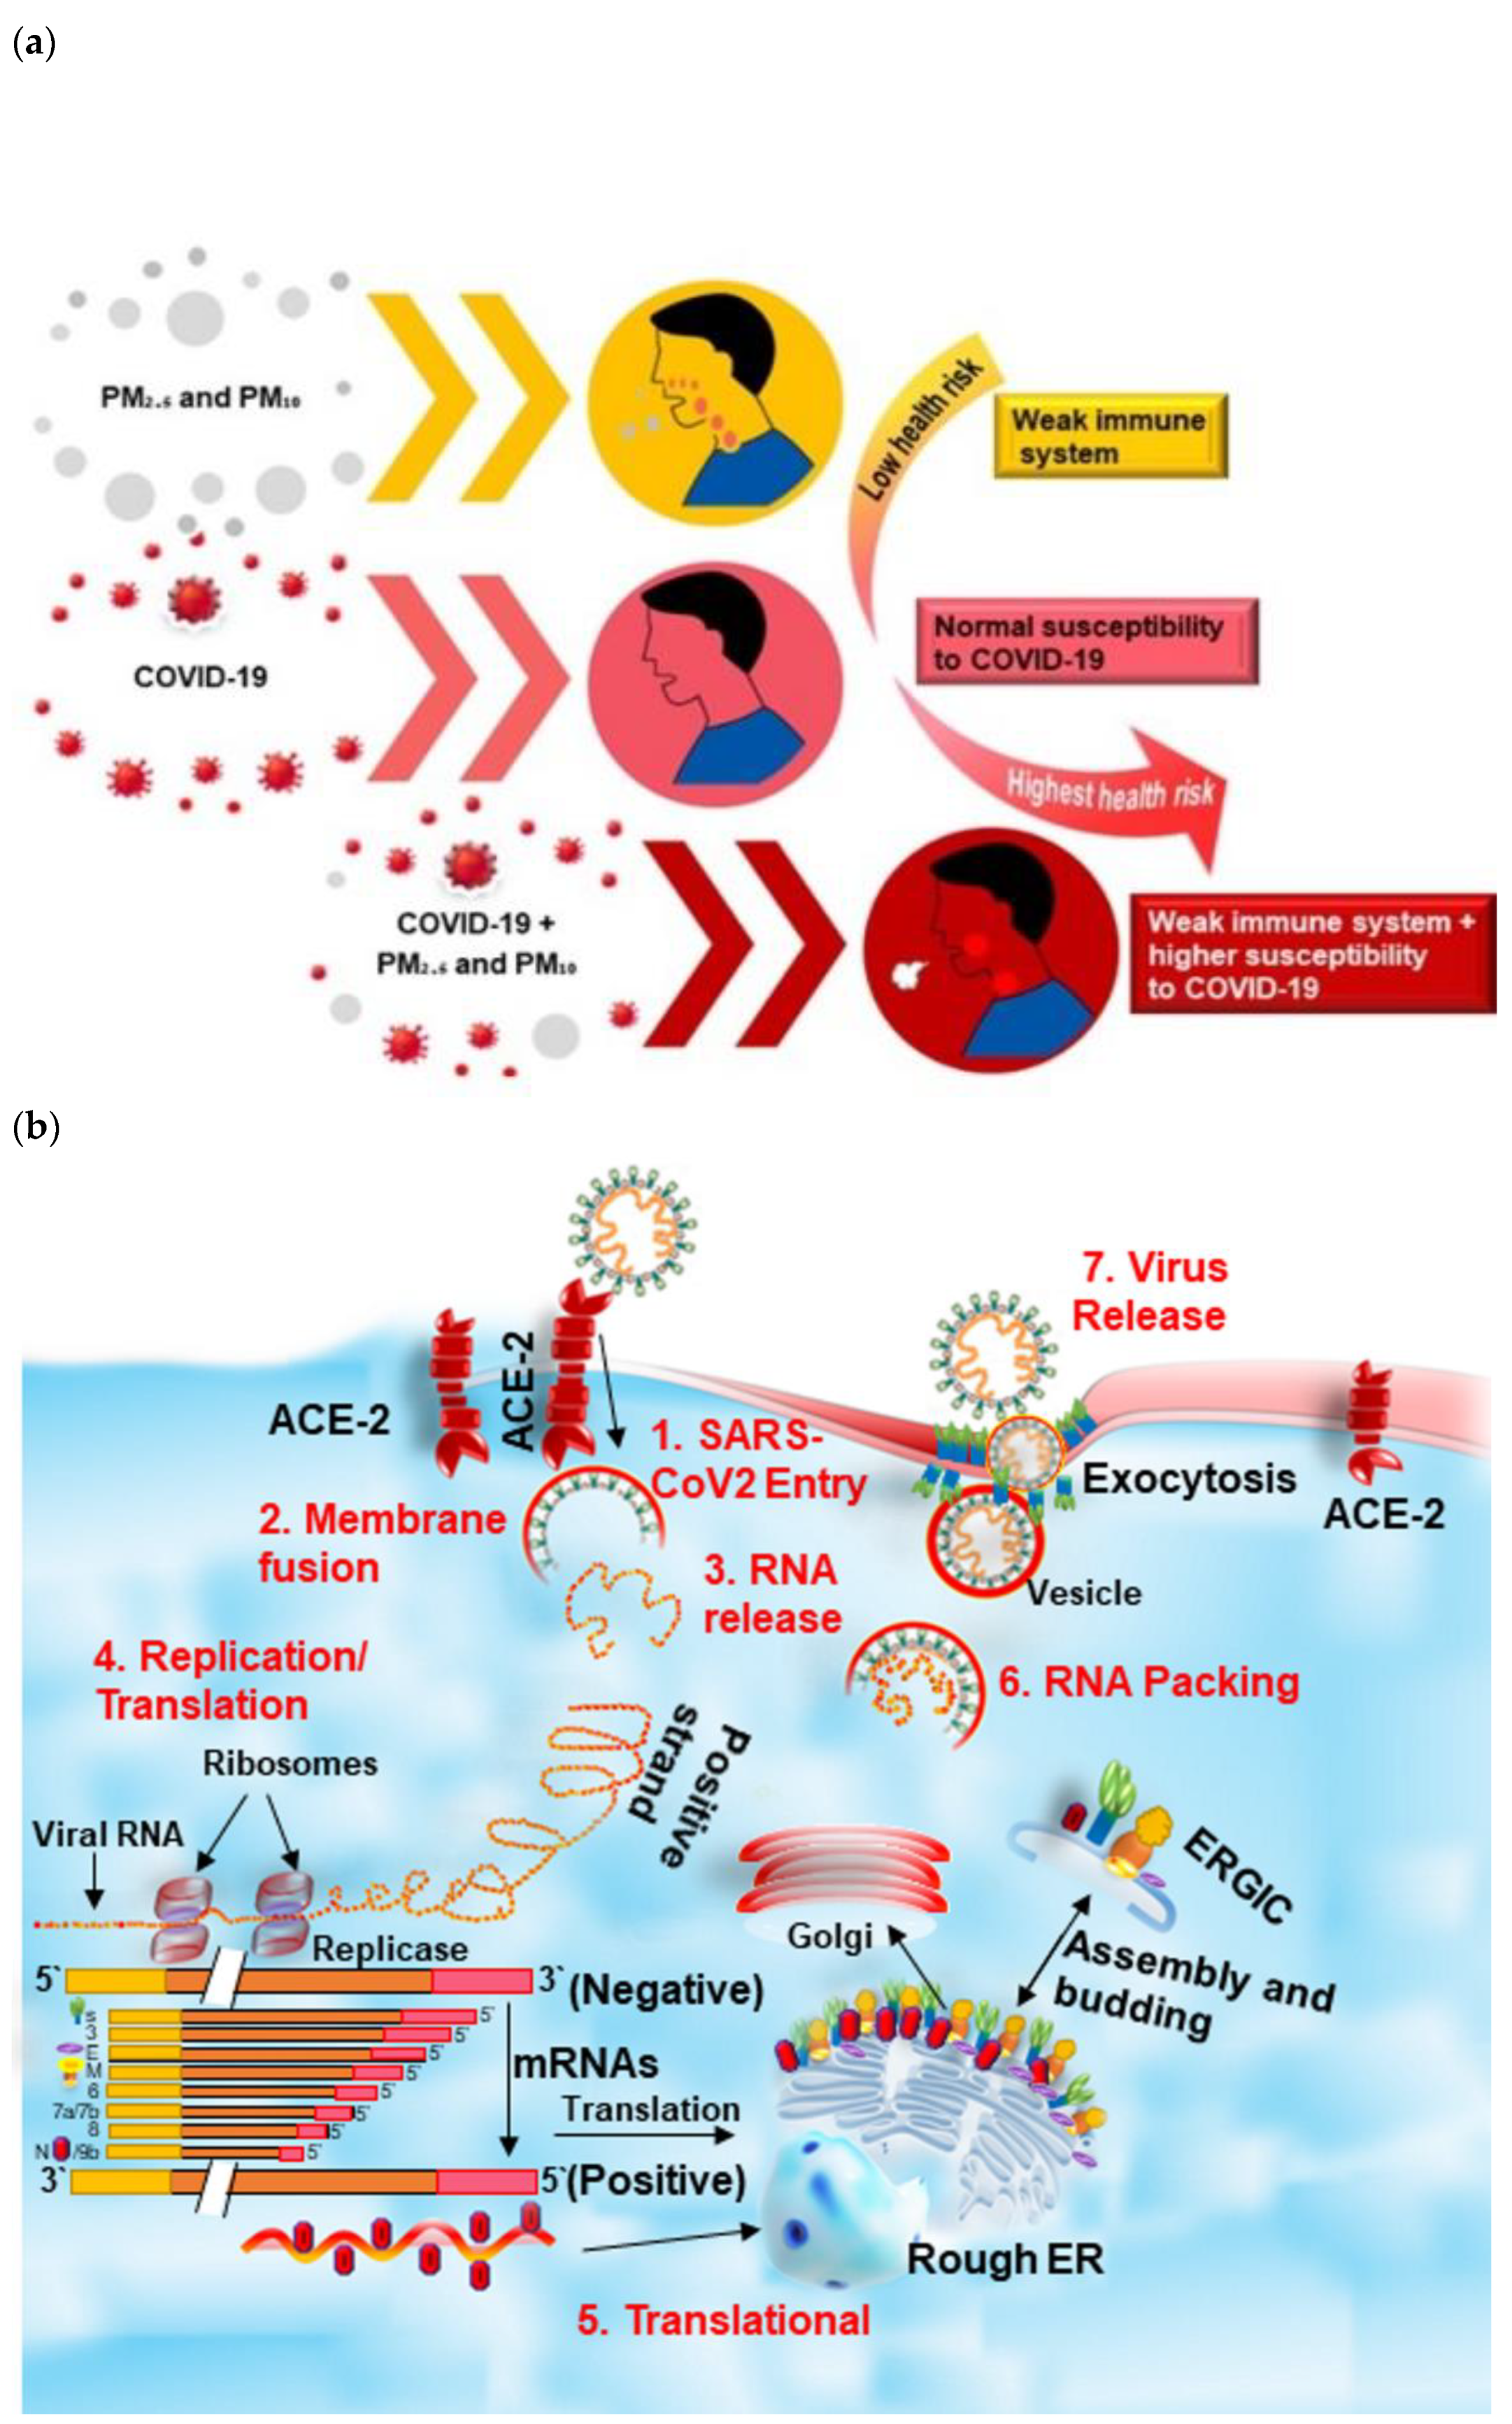
4. Health Implications Due to co-Exposure to PM and COVID-19
PM and COVID-19 Mechanism Inside the Human Body
5. Health Risk Assessment Due to the Combination of PM and COVID-19
Variation in COVID-19 Cases with Ambient PM2.5 and PM10 Level
| Location | Period | Aim | Effect | Data Analysis | Reference |
|---|---|---|---|---|---|
| USA (3000 counties) | Data up to 22 April 2020 | Estimation of long-term COVID-19 deaths based on average exposure to PM2.5. | A 1 μg/m3 increase in PM2.5 caused an 8% increase in the COVID-19 death rate. | Zero-inflated negative binomial models | [26] |
| US (3089 counties) | Data up to 18 June 2020 | COVID-19 death rates outcome and long-term average PM2.5 exposure. | A 1 μg/m3 rise in PM2.5 concentration was associated with an 11% increase in COVID-19 mortalities. | Negative binomial mixed model | [27] |
| USA (California) | From 4 March to 24 April 2020 | PM2.5, PM10, and NO2 pollution association with confirmed cases. | PM2.5: Kendall r (−0.359); Spearman r (−0.453) PM10: Kendall r (−0.287); Spearman r (−0.375). Significant correlation. | Spearman and Kendall correlation tests | [113] |
| Queens County, New York (U.S.A) | From 1 March to 20 April 2020 | Association between daily confirmed cases, total deaths and PM2.5. | Daily cases association = −0.4029 (CI %: 0.6478–0.6896); mortality association = −0.1151 (CI%: 0.7966–0.9971). | Negative binomial regression model | [159] |
| China (120 cities) | From 23 Jan to 29 February 2020 | The relationship between daily confirmed cases and air pollution (PM2.5, PM10, and NO2) over time. | PM2.5: 10 μg/m3 increase (lag 0–14) was associated with a 2.24% increase in daily new confirmed cases; PM10: a 10 μg/m3 increase (lag 0–14) was associated with a 1.76% increase in daily confirmed new cases. | Generalized additive model (GAM) | [31] |
| Wuhan, Xiaogan, and Huanggang (China) | From 25 Jan to 29 February 2020 | PM2.5, PM10, and NO2 pollution and daily confirmed cases temporal association. | PM2.5: Wuhan (RR = 1.036, CI:1.032–1.039); Xiaogan (RR = 1.059, CI = 1.046–1.072); Huanggang (RR = 1.144, CI = 1.12–1.169) PM10: Wuhan (RR = 0.964, CI: 0.961–0.967); Xiaogan (RR = 0.961, CI = 0.950–0.972); Huanggang (RR = 0.915, CI = 0.896–0.934). | Multivariate Poisson regression | [161] |
| Wuhan and Xiaogan | From 26 Jan to 29 February 2020 | Daily confirmed cases and air pollution PM2.5, PM10, and NO2 relation. | PM2.5: Wuhan (R2 = 0.174, p < 0.05); Xiaogan (R2 = 0.23, p < 0.01). PM10: Wuhan (R2 = 0.105; p > 0.05); Xiaogan (R2 = 0.158, p < 0.05). | Simple linear regression | [162] |
| 49 cities of China | Data up to March 22, 2020 | Relationship between air pollution level (PM2.5 and PM10) and fatality rate. | PM2.5: a 10 μg/m3 increase in PM2.5 was associated with a 0.24% (0.01%–0.48%) increase in fatality rate; PM10: 10 μg/m3 increase in PM10 was associated with a 0.26% (0.00%–0.51%) increase in fatality rate. | Multiple linear regression | [164] |
| Milan (Italy) | From 1 Jan to 30 April 2020 | PM2.5 and PM10 and total deaths (total cases, daily confirmed cases) association over time. | PM2.5: R = −0.39; R = 0.25; R = −0.53; PM10: R = −0.30; R = 0.35; R = −0.49. | Pearson coefficient correlation | [165] |
| 7 provinces of Lombardy, Italy; 6 provinces of Piedmont, Italy | From 10 February to 12 March 2020 | Spatial description of PM10 exceedances versus COVID-19 cases. | Lombardy: PM10 exceeding between 0 and 8, COVID-19 incidence % between 0.03 and 0.49; Piedmont: PM10 exceeding between 3 and 12, COVID-19 incidence % between 0.01 and 0.03. | Descriptive analysis | [32] |
| 55 Italian Provinces | Data up to April 7, 2020 | The relationship between confirmed cases and PM10. | COVID-19 in Northern Italy is highly correlated with air pollution levels measured in cities with days exceeding PM10 limits. | Hierarchical multiple regression model | [135] |
| 71 Italian provinces | Data up to 27 April 2020 | Air pollution levels (PM2.5, PM10, NO2) and total confirmed cases. | PM2.5: R2 = 0.340, p < 0.01; PM10: R2 = 0.267, p < 0.01. | Pearson regression coefficient analysis | [160] |
| 110 Italian provinces | From 24 February to 13 March 2020 | PM10 concentration exceedance relation with spreading of COVID-19 infection. | Daily PM10 exceedances and spreading of COVID-19 infection in 110 Italian provinces are geographically linked. | Pearson’s coefficient utilized for correlation analysis | [166] |
| Pakistan | COVID-19 cases were significantly correlated with PM2.5 and climatic factors at p < 0.05, except for Lahore. | [128] | |||
| Global (27 countries, including China, India, and Europe) | Feb-Mar 2020 | Researchers evaluated whether lockdown events reduced air pollution levels by using satellite data and more than 10,000 air quality stations. | Over 2 weeks following the lockdown, 7400 premature deaths (340 to 14,600) and 6600 (4900 to 7900) pediatric asthma cases were avoided. As a result of avoiding PM2.5 exposure, China avoided 1400 premature deaths (1100–1700) and India avoided 5300 (1000–11700). Assuming the lockdown-induced reduction in concentrations persists throughout 2020, 0.78 (0.09–1.5) million premature deaths and 1.6 (0.8–2) million pediatric asthma cases could be avoided around the world. | [167] |
6. COVID-19 Transmission Dynamics
Social Aspects
7. Opportunity Cost of Lockdown
8. Scope and Long-Term Prevalence of Lockdown
9. Conclusions and Future Studies
Author Contributions
Funding
Institutional Review Board Statement
Informed Consent Statement
Data Availability Statement
Acknowledgments
Conflicts of Interest
References
- WHO Coronavirus Disease (COVID-19)—Events as They Happen. Available online: https://www.who.int/emergencies/diseases/novel-coronavirus-2019/events-as-they-happen (accessed on 30 August 2022).
- Lv, D.; Chen, Y.; Zhu, T.; Li, T.; Shen, F.; Li, X.; Mehmood, T. The pollution characteristics of PM10 and PM2.5 during summer and winter in Beijing, Suning and Islamabad. Atmos. Pollut. Res. 2019, 10, 1159–1164. [Google Scholar] [CrossRef]
- Mehmood, T.; Zhu, T.; Ahmad, I.; Li, X. Ambient PM2.5 and PM10 bound pahs in islamabad, pakistan: Concentration, source and health risk assessment. Chemosphere 2020, 257, 127187. [Google Scholar] [CrossRef] [PubMed]
- Seinfeld, J.H.; Pandis, S.N. Atmospheric Chemistry and Physics: From Air Pollution to Climate Change; John Wiley & Sons: Hoboken, NJ, USA, 2016. [Google Scholar]
- Hinds, W.C. Aerosol Technology; John Wiley & Sons: New York, NY, USA, 1999. [Google Scholar]
- Curtius, J. Nucleation of atmospheric aerosol particles. C.R. Phys. 2006, 7, 1027–1045. [Google Scholar] [CrossRef]
- Mehmood, T.; Tianle, Z.; Ahmad, I.; Li, X. Integration of AirQ+ and particulate matter mass concentration to calculate health and ecological constraints in Islamabad, Pakistan. In Proceedings of the 2019 16th International Bhurban Conference on Applied Sciences and Technology (IBCAST), Islamabad, Pakistan, 8–12 January 2019; pp. 248–254. [Google Scholar]
- Cho, S.-H.; Tong, H.; McGee, J.K.; Baldauf, R.W.; Krantz, Q.T.; Gilmour, M.I. Comparative toxicity of size-fractionated airborne particulate matter collected at different distances from an urban highway. Environ. Health Perspect. 2009, 117, 1682–1689. [Google Scholar] [CrossRef] [Green Version]
- Gilmour, M.I.; McGee, J.; Duvall, R.M.; Dailey, L.; Daniels, M.; Boykin, E.; Cho, S.-H.; Doerfler, D.; Gordon, T.; Devlin, R.B. Comparative toxicity of size-fractionated airborne particulate matter obtained from different cities in the United States. Inhal. Toxicol. 2007, 19, 7–16. [Google Scholar] [CrossRef] [PubMed]
- Chen, P.S.; Tsai, F.T.; Lin, C.K.; Yang, C.Y.; Chan, C.C.; Young, C.Y.; Lee, C.H. Ambient influenza and avian influenza virus during dust storm days and background days. Environ. Health Perspect. 2010, 118, 1211–1216. [Google Scholar] [CrossRef] [Green Version]
- Mehmood, T.; Ahmad, I.; Bibi, S.; Mustafa, B.; Ali, I. Insight into monsoon for shaping the air quality of islamabad, pakistan: Comparing the magnitude of health risk associated with PM10 and PM2.5 exposure. J. Air Waste Manag. Assoc. 2020, 70, 1340–1355. [Google Scholar] [CrossRef] [PubMed]
- Frontera, A.; Martin, C.; Vlachos, K.; Sgubin, G. Regional air pollution persistence links to COVID-19 infection zoning. J. Infect. 2020, 81, 318–356. [Google Scholar] [CrossRef] [PubMed]
- Martelletti, L.; Martelletti, P. Air pollution and the novel COVID-19 disease: A putative disease risk factor. SN Compr. Clin. Med. 2020, 2, 383–387. [Google Scholar] [CrossRef] [Green Version]
- Lei, H.; Li, Y.; Xiao, S.; Lin, C.H.; Norris, S.L.; Wei, D.; Hu, Z.; Ji, S. Routes of transmission of influenza A H1N1, SARS CoV, and norovirus in air cabin: Comparative analyses. Indoor Air 2018, 28, 394–403. [Google Scholar] [CrossRef]
- Setti, L.; Passarini, F.; De Gennaro, G.; Barbieri, P.; Perrone, M.G.; Borelli, M.; Palmisani, J.; Di Gilio, A.; Torboli, V.; Fontana, F.; et al. SARS-CoV-2RNA found on particulate matter of bergamo in Northern Italy: First evidence. Environ. Res. 2020, 188, 109754. [Google Scholar] [CrossRef] [PubMed]
- Setti, L.; Passarini, F.; De Gennaro, G.; Barbieri, P.; Perrone, M.G.; Borelli, M.; Palmisani, J.; Di Gilio, A.; Piscitelli, P.; Miani, A. Airborne transmission route of COVID-19: Why 2 meters/6 feet of inter-personal distance could not be enough. Int. J. Environ. Res. Public Health 2020, 17, 2932. [Google Scholar] [CrossRef] [PubMed] [Green Version]
- Miani, A.; Piscitelli, P.; Setti, L.; De Gennaro, G. Air quality and COVID-19: Much more than six feet. Evidence about SARS-CoV-2 airborne transmission in indoor environments and polluted areas. Environ. Res. 2022, 210, 112949. [Google Scholar] [CrossRef] [PubMed]
- Curtius, J.; Weigel, R.; Vossing, H.J.; Wernli, H.; Werner, A.; Volk, C.M.; Konopka, P.; Krebsbach, M.; Schiller, C.; Roiger, A. Observations of meteoric material and implications for aerosol nucleation in the winter arctic lower stratosphere derived from in situ particle measurements. Atmos. Chem. Phys. 2005, 5, 3053–3069. [Google Scholar] [CrossRef] [Green Version]
- Jaenicke, R. Tropospheric aerosols. In Aerosol-Clouds-Climate Interaction; Hobbs, P.V., Ed.; Academic Press: San Diego, CA, USA, 1993. [Google Scholar]
- Marques, M.; Domingo, J.L.; Nadal, M.; Schuhmacher, M. Health risks for the population living near petrochemical industrial complexes. 2. Adverse health outcomes other than cancer. Sci. Total Environ. 2020, 730, 139122. [Google Scholar] [CrossRef]
- Xie, J.; Teng, J.; Fan, Y.; Xie, R.; Shen, A. The short-term effects of air pollutants on hospitalizations for respiratory disease in Hefei, China. Int. J. Biometeorol. 2019, 63, 315–326. [Google Scholar] [CrossRef]
- Iuliano, A.D.; Roguski, K.M.; Chang, H.H.; Muscatello, D.J.; Palekar, R.; Tempia, S.; Cohen, C.; Gran, J.M.; Schanzer, D.; Cowling, B.J.; et al. Estimates of global seasonal influenza-associated respiratory mortality: A modelling study. Lancet 2018, 391, 1285–1300. [Google Scholar] [CrossRef]
- Bourdrel, T.; Annesi-Maesano, I.; Alahmad, B.; Maesano, C.N.; Bind, M.-A. The impact of outdoor air pollution on COVID-19: A review of evidence from in vitro, animal, and human studies. Eur. Respir. Rev. 2021, 30, 200242. [Google Scholar] [CrossRef]
- Mehmood, T.; Peng, L. Polyethylene scaffold net and synthetic grass fragmentation: A source of microplastics in the atmosphere? J. Hazard. Mater. 2022, 429, 128391. [Google Scholar] [CrossRef] [PubMed]
- Contini, C.; Di Nuzzo, M.; Barp, N.; Bonazza, A.; De Giorgio, R.; Tognon, M.; Rubino, S. The novel zoonotic COVID-19 pandemic: An expected global health concern. J. Infect. Dev. Ctries 2020, 14, 254–264. [Google Scholar] [CrossRef]
- Wu, X.; Nethery, R.C.; Sabath, B.M.; Braun, D.; Dominici, F. Exposure to air pollution and COVID-19 mortality in the United States: A nationwide cross-sectional study. medRxiv 2020. [Google Scholar] [CrossRef] [Green Version]
- Wu, X.; Nethery, R.C.; Sabath, M.B.; Braun, D.; Dominici, F. Air pollution and COVID-19 mortality in the United States: Strengths and limitations of an ecological regression analysis. Sci. Adv. 2020, 6, eabd4049. [Google Scholar] [CrossRef] [PubMed]
- Coccia, M. An index to quantify environmental risk of exposure to future epidemics of the COVID-19 and similar viral agents: Theory and practice. Environ. Res. 2020, 191, 110155. [Google Scholar] [CrossRef] [PubMed]
- Cao, Y.; Chen, M.; Dong, D.; Xie, S.; Liu, M. Environmental pollutants damage airway epithelial cell cilia: Implications for the prevention of obstructive lung diseases. Thorac. Cancer 2020, 11, 505–510. [Google Scholar] [CrossRef] [Green Version]
- Conticini, E.; Frediani, B.; Caro, D. Can atmospheric pollution be considered a co-factor in extremely high level of SARS-CoV-2 lethality in Northern Italy? Environ. Pollut. 2020, 261, 114465. [Google Scholar] [CrossRef]
- Zhu, Y.; Xie, J.; Huang, F.; Cao, L. Association between short-term exposure to air pollution and COVID-19 infection: Evidence from China. Sci. Total Environ. 2020, 727, 138704. [Google Scholar] [CrossRef]
- Bontempi, E. First data analysis about possible COVID-19 virus airborne diffusion due to air particulate matter (PM): The case of Lombardy (Italy). Environ. Res. 2020, 186, 109639. [Google Scholar] [CrossRef]
- Dutheil, F.; Baker, J.S.; Navel, V. COVID-19 as a factor influencing air pollution? Environ. Pollut 2020, 263, 114466. [Google Scholar] [CrossRef]
- Muhammad, S.; Long, X.; Salman, M. COVID-19 pandemic and environmental pollution: A blessing in disguise? Sci Total Env. 2020, 728, 138820. [Google Scholar] [CrossRef] [PubMed]
- Saadat, S.; Rawtani, D.; Hussain, C.M. Environmental perspective of COVID-19. Sci. Total Environ. 2020, 728, 138870. [Google Scholar] [CrossRef] [PubMed]
- Berman, J.D.; Ebisu, K. Changes in U.S. Air pollution during the COVID-19 pandemic. Sci. Total Environ. 2020, 739, 139864. [Google Scholar] [CrossRef] [PubMed]
- Zambrano-Monserrate, M.A.; Ruano, M.A.; Sanchez-Alcalde, L. Indirect effects of COVID-19 on the environment. Sci. Total Environ. 2020, 728, 138813. [Google Scholar] [CrossRef] [PubMed]
- Faridi, S.; Yousefian, F.; Niazi, S.; Ghalhari, M.R.; Hassanvand, M.S.; Naddafi, K. Impact of SARS-CoV-2 on ambient air particulate matter in Tehran. Aerosol. Air Qual. Res. 2020, 20, 1805–1811. [Google Scholar] [CrossRef]
- Mohd Nadzir, M.S.; Ooi, M.C.G.; Alhasa, K.M.; Bakar, M.A.A.; Mohtar, A.A.A.; Nor, M.F.F.M.; Latif, M.T.; Hamid, H.H.A.; Ali, S.H.M.; Ariff, N.M.; et al. The impact of movement control order (MCO) during pandemic COVID-19 on local air quality in an urban area of Klang valley, Malaysia. Aerosol. Air Qual. Res. 2020, 20, 1237–1248. [Google Scholar] [CrossRef]
- Menut, L.; Bessagnet, B.; Siour, G.; Mailler, S.; Pennel, R.; Cholakian, A. Impact of lockdown measures to combat COVID-19 on air quality over Western Europe. Sci. Total Environ. 2020, 741, 140426. [Google Scholar] [CrossRef]
- Nichol, J.E.; Bilal, M.; Ali, M.A.; Qiu, Z. Air pollution scenario over China during COVID-19. Remote Sens. 2020, 12, 2100. [Google Scholar] [CrossRef]
- Dantas, G.; Siciliano, B.; Franca, B.B.; da Silva, C.M.; Arbilla, G. The impact of COVID-19 partial lockdown on the air quality of the city of Rio De Janeiro, Brazil. Sci. Total Environ. 2020, 729, 139085. [Google Scholar] [CrossRef] [PubMed]
- Otmani, A.; Benchrif, A.; Tahri, M.; Bounakhla, M.; Chakir, E.M.; El Bouch, M.; Krombi, M. Impact of COVID-19 lockdown on PM10, SO2 and NO2 concentrations in Sale City (Morocco). Sci. Total Environ. 2020, 735, 139541. [Google Scholar] [CrossRef]
- Huang, R.J.; Zhang, Y.; Bozzetti, C.; Ho, K.F.; Cao, J.J.; Han, Y.; Daellenbach, K.R.; Slowik, J.G.; Platt, S.M.; Canonaco, F.; et al. High secondary aerosol contribution to particulate pollution during haze events in China. Nature 2014, 514, 218–222. [Google Scholar] [CrossRef] [Green Version]
- Luo, J.; Zhang, J.; Huang, X.; Liu, Q.; Luo, B.; Zhang, W.; Rao, Z.; Yu, Y. Characteristics, evolution, and regional differences of biomass burning particles in the Sichuan Basin, China. J. Environ. Sci. 2020, 89, 35–46. [Google Scholar] [CrossRef]
- Wang, Y.; Yao, L.; Wang, L.; Liu, Z.; Ji, D.; Tang, G.; Zhang, J.; Sun, Y.; Hu, B.; Xin, J. Mechanism for the formation of the January 2013 heavy haze pollution episode over central and Eastern China. Sci. China Earth Sci. 2013, 57, 14–25. [Google Scholar] [CrossRef]
- Zhang, F.; Wang, Y.; Peng, J.; Chen, L.; Sun, Y.; Duan, L.; Ge, X.; Li, Y.; Zhao, J.; Liu, C.; et al. An unexpected catalyst dominates formation and radiative forcing of regional haze. Proc. Natl. Acad. Sci. USA 2020, 117, 3960–3966. [Google Scholar] [CrossRef] [PubMed] [Green Version]
- Cai, W.; Li, K.; Liao, H.; Wang, H.; Wu, L. Weather conditions conducive to beijing severe haze more frequent under climate change. Nat. Clim. Chang. 2017, 7, 257–262. [Google Scholar] [CrossRef]
- Shahzad, A.; Ullah, S.; Dar, A.A.; Sardar, M.F.; Mehmood, T.; Tufail, M.A.; Shakoor, A.; Haris, M. Nexus on climate change: Agriculture and possible solution to cope future climate change stresses. Environ. Sci. Pollut. Res. 2021, 28, 14211–14232. [Google Scholar] [CrossRef]
- Li, L.; Li, Q.; Huang, L.; Wang, Q.; Zhu, A.; Xu, J.; Liu, Z.; Li, H.; Shi, L.; Li, R.; et al. Air quality changes during the COVID-19 lockdown over the Yangtze River Delta Region: An insight into the impact of human activity pattern changes on air pollution variation. Sci. Total Environ. 2020, 732, 139282. [Google Scholar] [CrossRef]
- Shirmohammadi, F.; Hasheminassab, S.; Saffari, A.; Schauer, J.J.; Delfino, R.J.; Sioutas, C. Fine and ultrafine particulate organic carbon in the Los Angeles Basin: Trends in sources and composition. Sci. Total Environ. 2016, 541, 1083–1096. [Google Scholar] [CrossRef] [Green Version]
- Kim, S.; Shen, S.; Sioutas, C. Size distribution and diurnal and seasonal trends of ultrafine particles in source and receptor sites of the Los Angeles Basin. J. Air Waste Manag. Assoc. 2002, 52, 297–307. [Google Scholar] [CrossRef] [Green Version]
- Bao, R.; Zhang, A. Does lockdown reduce air pollution? Evidence from 44 cities in Northern China. Sci. Total Environ. 2020, 731, 139052. [Google Scholar] [CrossRef]
- Wang, H.; Miao, Q.; Shen, L.; Yang, Q.; Wu, Y.; Wei, H.; Yin, Y.; Zhao, T.; Zhu, B.; Lu, W. Characterization of the aerosol chemical composition during the COVID-19 lockdown period in Suzhou in the Yangtze River Delta, China. J. Environ. Sci. 2021, 102, 110–122. [Google Scholar] [CrossRef]
- Baldasano, J.M. COVID-19 lockdown effects on air quality by NO2 in the cities of Barcelona and Madrid (Spain). Sci. Total Environ. 2020, 741, 140353. [Google Scholar] [CrossRef]
- Jia, C.; Fu, X.; Bartelli, D.; Smith, L. Insignificant impact of the “stay-at-home” order on ambient air quality in the memphis metropolitan area, U.S.A. Atmosphere 2020, 11, 630. [Google Scholar] [CrossRef]
- Zangari, S.; Hill, D.T.; Charette, A.T.; Mirowsky, J.E. Air quality changes in New York city during the COVID-19 pandemic. Sci. Total Environ. 2020, 742, 140496. [Google Scholar] [CrossRef] [PubMed]
- Kanniah, K.D.; Zaman, N.A.F.K.; Kaskaoutis, D.G.; Latif, M.T. COVID-19’s impact on the atmospheric environment in the Southeast Asia region. Sci. Total Environ. 2020, 736, 139658. [Google Scholar] [CrossRef] [PubMed]
- Sharma, S.; Zhang, M.; Gao, J.; Zhang, H.; Kota, S.H. Effect of restricted emissions during COVID-19 on air quality in India. Sci. Total Environ. 2020, 728, 138878. [Google Scholar] [CrossRef] [PubMed]
- Huang, Z.; Huang, J.; Gu, Q.; Du, P.; Liang, H.; Dong, Q. Optimal temperature zone for the dispersal of COVID-19. Sci. Total Environ. 2020, 736, 139487. [Google Scholar] [CrossRef] [PubMed]
- Lian, X.; Huang, J.; Huang, R.; Liu, C.; Wang, L.; Zhang, T. Impact of city lockdown on the air quality of COVID-19-hit of Wuhan city. Sci. Total Environ. 2020, 742, 140556. [Google Scholar] [CrossRef]
- Wang, Y.; Gao, W.; Wang, S.; Song, T.; Gong, Z.; Ji, D.; Wang, L.; Liu, Z.; Tang, G.; Huo, Y.; et al. Contrasting trends of PM2.5 and surface-Ozone concentrations in China from 2013 to 2017. Natl. Sci. Rev. 2020, 7, 1331–1339. [Google Scholar] [CrossRef] [Green Version]
- An, Z.; Huang, R.J.; Zhang, R.; Tie, X.; Li, G.; Cao, J.; Zhou, W.; Shi, Z.; Han, Y.; Gu, Z.; et al. Severe haze in Northern China: A synergy of anthropogenic emissions and atmospheric processes. Proc. Natl. Acad. Sci. USA 2019, 116, 8657–8666. [Google Scholar] [CrossRef] [Green Version]
- Fenger, J. Air pollution in the last 50 years—From local to global. Atmos. Environ. 2009, 43, 13–22. [Google Scholar] [CrossRef]
- Guo, S.; Hu, M.; Peng, J.; Wu, Z.; Zamora, M.L.; Shang, D.; Du, Z.; Zheng, J.; Fang, X.; Tang, R.; et al. Remarkable nucleation and growth of ultrafine particles from vehicular exhaust. Proc. Natl. Acad. Sci. USA 2020, 117, 3427–3432. [Google Scholar] [CrossRef]
- Li, K.; Jacob, D.J.; Liao, H.; Zhu, J.; Shah, V.; Shen, L.; Bates, K.H.; Zhang, Q.; Zhai, S. A two-pollutant strategy for improving ozone and particulate air quality in China. Nat. Geosci. 2019, 12, 906–910. [Google Scholar] [CrossRef]
- Zhu, T.; Shang, J.; Zhao, D. The roles of heterogeneous chemical processes in the formation of an air pollution complex and gray haze. Sci. China Chem. 2011, 54, 145–153. [Google Scholar] [CrossRef]
- Kelly, F.J.; Fussell, J.C. Size, source and chemical composition as determinants of toxicity attributable to ambient particulate matter. Atmos. Environ. 2012, 60, 504–526. [Google Scholar] [CrossRef]
- Lin, C.C.; Chen, S.J.; Huang, K.L.; Lee, W.J.; Lin, W.Y.; Liao, C.J.; Chaung, H.C.; Chiu, C.H. Water-soluble ions in nano/ultrafine/fine/coarse particles collected near a busy road and at a rural site. Environ. Pollut. 2007, 145, 562–570. [Google Scholar] [CrossRef] [PubMed]
- Myriokefalitakis, S.; Fanourgakis, G.; Kanakidou, M. The contribution of bioaerosols to the organic carbon budget of the atmosphere. In Perspectives on Atmospheric Sciences; Springer: Berlin/Heidelberg, Germany, 2017; pp. 845–851. [Google Scholar]
- Han, Y.; Li, L.; Wang, Y.; Ma, J.; Li, P.; Han, C.; Liu, J. Composition, dispersion, and health risks of bioaerosols in wastewater treatment plants: A review. Front. Environ. Sci. Eng. 2020, 15, 1–16. [Google Scholar] [CrossRef]
- Matthias-Maser, S.; Jaenicke, R. Examination of atmospheric bioaerosol particles with radii > 0.2 μm. J. Aerosol. Sci. 1994, 25, 1605–1613. [Google Scholar] [CrossRef]
- Haas, D.; Galler, H.; Luxner, J.; Zarfel, G.; Buzina, W.; Friedl, H.; Marth, E.; Habib, J.; Reinthaler, F.F. The concentrations of culturable microorganisms in relation to particulate matter in urban air. Atmos. Environ. 2013, 65, 215–222. [Google Scholar] [CrossRef]
- Raes, F.; Van Dingenen, R.; Vignati, E.; Wilson, J.; Putaud, J.-P.; Seinfeld, J.H.; Adams, P. Formation and cycling of aerosols in the global troposphere. Atmos. Environ. 2000, 34, 4215–4240. [Google Scholar] [CrossRef]
- Williams, J.; Reus, M.d.; Krejci, R.; Fischer, H.; Ström, J. Application of the variability-size relationship to atmospheric aerosol studies: Estimating aerosol lifetimes and ages. Atmos. Chem. Phys. 2002, 2, 133–145. [Google Scholar] [CrossRef] [Green Version]
- Li, X.; Ruan, B.; Hopke, P.K.; Mehmood, T. On the performance parameters of PM2.5 and PM1 size separators for ambient aerosol monitoring. Aerosol. Air Qual. Res. 2019, 19, 2173–2184. [Google Scholar] [CrossRef]
- Sulaymon, I.D.; Zhang, Y.; Hopke, P.K.; Zhang, Y.; Hua, J.; Mei, X. COVID-19 pandemic in Wuhan: Ambient air quality and the relationships between criteria air pollutants and meteorological variables before, during, and after lockdown. Atmos. Res. 2021, 250, 105362. [Google Scholar] [CrossRef]
- Mahato, S.; Pal, S.; Ghosh, K.G. Effect of lockdown amid COVID-19 pandemic on air quality of the Megacity Delhi, India. Sci. Total Environ. 2020, 730, 139086. [Google Scholar] [CrossRef] [PubMed]
- Goel, V.; Hazarika, N.; Kumar, M.; Singh, V.; Thamban, N.M.; Tripathi, S.N. Variations in black carbon concentration and sources during COVID-19 lockdown in Delhi. Chemosphere 2021, 270, 129435. [Google Scholar] [CrossRef]
- Xiang, J.; Austin, E.; Gould, T.; Larson, T.; Shirai, J.; Liu, Y.; Marshall, J.; Seto, E. Impacts of the COVID-19 responses on traffic-related air pollution in a northwestern US city. Sci. Total Environ. 2020, 747, 141325. [Google Scholar] [CrossRef]
- Datta, A.; Rahman, M.H.; Suresh, R. Did the COVID-19 lockdown in Delhi and Kolkata improve the ambient air quality of the two cities? J. Environ. Qual. 2021, 50, 485–493. [Google Scholar] [CrossRef]
- Ravindra, K.; Singh, T.; Biswal, A.; Singh, V.; Mor, S. Impact of COVID-19 lockdown on ambient air quality in megacities of India and implication for air pollution control strategies. Environ. Sci. Pollut. Res. 2021, 28, 21621–21632. [Google Scholar] [CrossRef]
- Arunkumar, M.; Dhanakumar, S. Ambient fine particulate matter pollution over the megacity Delhi, India: An impact of COVID-19 lockdown. Curr. Sci. 2021, 120, 304–312. [Google Scholar] [CrossRef]
- Sreekanth, V.; Kushwaha, M.; Kulkarni, P.; Upadhya, A.R.; Spandana, B.; Prabhu, V. Impact of COVID-19 lockdown on the fine particulate matter concentration levels: Results from Bengaluru Megacity, India. Adv. Space Res. 2021, 67, 2140–2150. [Google Scholar] [CrossRef]
- Chauhan, A.; Singh, R.P. Decline in PM2.5 concentrations over major cities around the world associated with COVID-19. Environ. Res. 2020, 187, 109634. [Google Scholar] [CrossRef]
- Sicard, P.; De Marco, A.; Agathokleous, E.; Feng, Z.; Xu, X.; Paoletti, E.; Rodriguez, J.J.D.; Calatayud, V. Amplified Ozone pollution in cities during the COVID-19 lockdown. Sci. Total Environ. 2020, 735, 139542. [Google Scholar] [CrossRef]
- Kerimray, A.; Baimatova, N.; Ibragimova, O.P.; Bukenov, B.; Kenessov, B.; Plotitsyn, P.; Karaca, F. Assessing air quality changes in large cities during COVID-19 lockdowns: The impacts of traffic-free urban conditions in Almaty, Kazakhstan. Sci. Total Environ. 2020, 730, 139179. [Google Scholar] [CrossRef] [PubMed]
- Kotnala, G.; Mandal, T.; Sharma, S.; Kotnala, R. Emergence of blue sky over Delhi due to coronavirus disease (COVID-19) lockdown implications. Aerosol. Sci. Eng. 2020, 4, 228–238. [Google Scholar] [CrossRef]
- Srivastava, S.; Kumar, A.; Bauddh, K.; Gautam, A.S.; Kumar, S. 21-day lockdown in India dramatically reduced air pollution indices in lucknow and New Delhi, India. Bull. Environ. Contam Toxicol. 2020, 105, 9–17. [Google Scholar] [CrossRef] [PubMed]
- Shi, X.; Brasseur, G.P. The response in air quality to the reduction of Chinese economic activities during the COVID-19 outbreak. Geophys. Res. Lett. 2020, 47, e2020GL088070. [Google Scholar] [CrossRef] [PubMed]
- Wang, Y.; Yuan, Y.; Wang, Q.; Liu, C.; Zhi, Q.; Cao, J. Changes in air quality related to the control of coronavirus in China: Implications for traffic and industrial emissions. Sci. Total Environ. 2020, 731, 139133. [Google Scholar] [CrossRef]
- Collivignarelli, M.C.; Abbà, A.; Bertanza, G.; Pedrazzani, R.; Ricciardi, P.; Miino, M.C. Lockdown for COVID-2019 in milan: What are the effects on air quality? Sci. Total Environ. 2020, 732, 139280. [Google Scholar] [CrossRef] [PubMed]
- Mandal, I.; Pal, S. COVID-19 pandemic persuaded lockdown effects on environment over stone quarrying and crushing areas. Sci Total Environ. 2020, 732, 139281. [Google Scholar] [CrossRef] [PubMed]
- Ali, S.M.; Malik, F.; Anjum, M.S.; Siddiqui, G.F.; Anwar, M.N.; Lam, S.S.; Nizami, A.S.; Khokhar, M.F. Exploring the linkage between PM2.5 levels and COVID-19 spread and its implications for socio-economic circles. Environ. Res 2021, 193, 110421. [Google Scholar] [CrossRef] [PubMed]
- Mehmood, K.; Bao, Y.; Petropoulos, G.P.; Abbas, R.; Abrar, M.M.; Saifullah; Mustafa, A.; Soban, A.; Saud, S.; Ahmad, M.; et al. Investigating connections between COVID-19 pandemic, air pollution and community interventions for Pakistan employing geoinformation technologies. Chemosphere 2021, 272, 129809. [Google Scholar] [CrossRef]
- Zheng, M.; Cass, G.R.; Schauer, J.J.; Edgerton, E.S. Source apportionment of PM2.5 in the southeastern United States using solvent-extractable organic compounds as tracers. Environ. Sci. Technol. 2002, 36, 2361–2371. [Google Scholar] [CrossRef] [PubMed]
- Sun, Y.; Lei, L.; Zhou, W.; Chen, C.; He, Y.; Sun, J.; Li, Z.; Xu, W.; Wang, Q.; Ji, D.; et al. A chemical cocktail during the COVID-19 outbreak in Beijing, China: Insights from six-year aerosol particle composition measurements during the Chinese new year holiday. Sci. Total Environ. 2020, 742, 140739. [Google Scholar] [CrossRef] [PubMed]
- Anil, I.; Alagha, O. The impact of COVID-19 lockdown on the air quality of eastern province, Saudi Arabia. Air Qual. Atmos. Health 2021, 14, 117–128. [Google Scholar] [CrossRef] [PubMed]
- Bilal; Bashir, M.F.; Benghoul, M.; Numan, U.; Shakoor, A.; Komal, B.; Bashir, M.A.; Bashir, M.; Tan, D. Environmental pollution and COVID-19 outbreak: Insights from Germany. Air Qual. Atmos. Health 2020, 13, 1–10. [Google Scholar] [CrossRef] [PubMed]
- Pata, U.K. How is COVID-19 affecting environmental pollution in us cities? Evidence from asymmetric fourier causality test. Air Qual. Atmos. Health 2020, 13, 1149–1155. [Google Scholar] [CrossRef]
- Shakoor, A.; Chen, X.; Farooq, T.H.; Shahzad, U.; Ashraf, F.; Rehman, A.; Sahar, N.E.; Yan, W. Fluctuations in environmental pollutants and air quality during the lockdown in the USA and China: Two sides of COVID-19 pandemic. Air Qual. Atmos. Health 2020, 13, 1335–1342. [Google Scholar] [CrossRef] [PubMed]
- Jakovljevic, I.; Strukil, Z.S.; Godec, R.; Davila, S.; Pehnec, G. Influence of lockdown caused by the COVID-19 pandemic on air pollution and carcinogenic content of particulate matter observed in Croatia. Air Qual Atmos Health 2021, 14, 467–472. [Google Scholar] [CrossRef] [PubMed]
- Zhang, L.; Yang, L.; Zhou, Q.; Zhang, X.; Xing, W.; Zhang, H.; Toriba, A.; Hayakawa, K.; Tang, N. Impact of the COVID-19 outbreak on the long-range transport of particulate PAHs in East Asia. Aerosol Air Qual. Res. 2020, 20, 2035–2046. [Google Scholar] [CrossRef]
- Sarmadi, M.; Rahimi, S.; Rezaei, M.; Sanaei, D.; Dianatinasab, M. Air quality index variation before and after the onset of COVID-19 pandemic: A comprehensive study on 87 capital, industrial and polluted cities of the world. Environ. Sci. Eur. 2021, 33, 134. [Google Scholar] [CrossRef]
- Vasudevan, M.; Natarajan, N.; Selvi, S.M.; Ravikumar, K.; Rajendran, A.D.; Bagavathi, A.B. Correlating the trends of COVID-19 spread and air quality during lockdowns in tier-I and tier-II cities of India—Lessons learnt and futuristic strategies. In Environmental Science and Pollution Research; Springer: Berlin/Heidelberg, Germany, 2021; pp. 1–30. [Google Scholar]
- Yazdani, M.; Baboli, Z.; Maleki, H.; Birgani, Y.T.; Zahiri, M.; Chaharmahal, S.S.H.; Goudarzi, M.; Mohammadi, M.J.; Alam, K.; Sorooshian, A. Contrasting Iran’s air quality improvement during COVID-19 with other global cities. J. Environ. Health Sci. Eng. 2021, 19, 1801–1806. [Google Scholar] [CrossRef] [PubMed]
- Requia, W.J.; Roig, H.L.; Schwartz, J.D. Schools exposure to air pollution sources in Brazil: A nationwide assessment of more than 180 thousand schools. Sci. Total Environ. 2021, 763, 143027. [Google Scholar] [CrossRef] [PubMed]
- Pakbin, P.; Hudda, N.; Cheung, K.L.; Moore, K.F.; Sioutas, C. Spatial and temporal variability of coarse (PM10–2.5) particulate matter concentrations in the Los Angeles area. Aerosol Sci. Technol. 2010, 44, 514–525. [Google Scholar] [CrossRef] [Green Version]
- Zhao, P.S.; Dong, F.; He, D.; Zhao, X.J.; Zhang, X.L.; Zhang, W.Z.; Yao, Q.; Liu, H.Y. Characteristics of concentrations and chemical compositions for PM2.5 in the region of Beijing, Tianjin, and Hebei, China. Atmos. Chem. Phys. 2013, 13, 4631–4644. [Google Scholar] [CrossRef] [Green Version]
- Cao, J.J.; Lee, S.C.; Chow, J.C.; Watson, J.G.; Ho, K.F.; Zhang, R.J.; Jin, Z.D.; Shen, Z.X.; Chen, G.C.; Kang, Y.M. Spatial and seasonal distributions of carbonaceous aerosols over China. J. Geophys. Res. Atmos. 2007, 112. [Google Scholar] [CrossRef] [Green Version]
- Mehmood, T.; Hassan, M.A.; Li, X.; Ashraf, A.; Rehman, S.; Bilal, M.; Obodo, R.M.; Mustafa, B.; Shaz, M.; Bibi, S. Mechanism behind Sources and Sinks of Major Anthropogenic Greenhouse Gases. In Climate Change Alleviation for Sustainable Progression; CRC Press: Boca Raton, FL, USA, 2022; pp. 114–150. [Google Scholar]
- Hong, H.S.; Yin, H.L.; Wang, X.H.; Ye, C.X. Seasonal variation of PM10 -bound PAHs in the atmosphere of Xiamen, China. Atmos. Res. 2007, 85, 429–441. [Google Scholar] [CrossRef]
- Bashir, M.F.; Ma, B.J.; Bilal; Komal, B.; Bashir, M.A.; Farooq, T.H.; Iqbal, N.; Bashir, M. Correlation between environmental pollution indicators and COVID-19 pandemic: A brief study in Californian context. Environ. Res. 2020, 187, 109652. [Google Scholar] [CrossRef] [PubMed]
- Sobral, M.F.F.; Duarte, G.B.; da Penha Sobral, A.I.G.; Marinho, M.L.M.; de Souza Melo, A. Association between climate variables and global transmission of SARS-CoV-2. Sci. Total Environ. 2020, 729, 138997. [Google Scholar] [CrossRef]
- Pateraki, S.; Asimakopoulos, D.N.; Flocas, H.A.; Maggos, T.; Vasilakos, C. The role of meteorology on different sized aerosol fractions (PM10, PM2.5, PM2.5–10). Sci. Total Environ. 2012, 419, 124–135. [Google Scholar] [CrossRef] [PubMed]
- Shehzad, K.; Sarfraz, M.; Shah, S.G.M. The impact of COVID-19 as a necessary evil on air pollution in India during the lockdown. Environ. Pollut. 2020, 266, 115080. [Google Scholar] [CrossRef] [PubMed]
- Iqbal, N.; Fareed, Z.; Shahzad, F.; He, X.; Shahzad, U.; Lina, M. The nexus between COVID-19, temperature and exchange rate in Wuhan city: New findings from partial and multiple wavelet coherence. Sci. Total Environ. 2020, 729, 138916. [Google Scholar] [CrossRef]
- Liu, J.; Zhou, J.; Yao, J.; Zhang, X.; Li, L.; Xu, X.; He, X.; Wang, B.; Fu, S.; Niu, T.; et al. Impact of meteorological factors on the COVID-19 transmission: A multi-city study in China. Sci. Total Environ. 2020, 726, 138513. [Google Scholar] [CrossRef] [PubMed]
- Shi, P.; Dong, Y.; Yan, H.; Li, X.; Zhao, C.; Liu, W.; He, M.; Tang, S.; Xi, S. The impact of temperature and absolute humidity on the coronavirus disease 2019 (COVID-19) outbreak—Evidence from China. medRxiv 2020. [Google Scholar] [CrossRef] [Green Version]
- Mantis, J.; Chaloulakou, A.; Samara, C. PM10-bound polycyclic aromatic hydrocarbons (PAHs) in the greater area of Athens, Greece. Chemosphere 2005, 59, 593–604. [Google Scholar] [CrossRef]
- Ravindra, K.; Bencs, L.; Wauters, E.; Hoog, J.D.; Deutsch, F.; Roekens, E.; Bleux, N.; Berghmans, P.; Grieken, R.V. Seasonal and site-specific variation in vapour and aerosol phase pahs over flanders (Belgium) and their relation with anthropogenic activities. Atmos. Environ. 2006, 40, 771–785. [Google Scholar] [CrossRef] [Green Version]
- Sin, D.W.; Wong, Y.C.; Choi, Y.Y.; Lam, C.H.; Louie, P.K. Distribution of polycyclic aromatic hydrocarbons in the atmosphere of Hong Kong. J. Environ. Monit. 2004, 5, 989–996. [Google Scholar] [CrossRef]
- Shahzad, F.; Shahzad, U.; Fareed, Z.; Iqbal, N.; Hashmi, S.H.; Ahmad, F. Asymmetric nexus between temperature and COVID-19 in the top ten affected provinces of China: A current application of quantile-on-quantile approach. Sci. Total Environ. 2020, 736, 139115. [Google Scholar] [CrossRef]
- Sasikumar, K.; Nath, D.; Nath, R.; Chen, W. Impact of extreme hot climate on COVID-19 outbreak in India. Geohealth 2020, 4, e2020GH000305. [Google Scholar] [CrossRef]
- Kumar, S. Effect of meteorological parameters on spread of COVID-19 in India and air quality during lockdown. Sci. Total Environ. 2020, 745, 141021. [Google Scholar] [CrossRef]
- Gupta, A.; Pradhan, B.; Maulud, K.N.A. Estimating the impact of daily weather on the temporal pattern of COVID-19 outbreak in India. Earth Syst. Environ. 2020, 4, 523–534. [Google Scholar] [CrossRef]
- Sarkodie, S.A.; Owusu, P.A. Impact of meteorological factors on COVID-19 pandemic: Evidence from top 20 countries with confirmed cases. Environ. Res. 2020, 191, 110101. [Google Scholar] [CrossRef]
- Mehmood, K.; Bao, Y.; Abrar, M.M.; Petropoulos, G.P.; Saifullah; Soban, A.; Saud, S.; Khan, Z.A.; Khan, S.M.; Fahad, S. Spatiotemporal variability of COVID-19 pandemic in relation to air pollution, climate and socioeconomic factors in Pakistan. Chemosphere 2021, 271, 129584. [Google Scholar] [CrossRef]
- Ahmadi, M.; Sharifi, A.; Dorosti, S.; Jafarzadeh Ghoushchi, S.; Ghanbari, N. Investigation of effective climatology parameters on COVID-19 outbreak in Iran. Sci. Total Environ. 2020, 729, 138705. [Google Scholar] [CrossRef] [PubMed]
- Zhang, Y.; Guo, Y.; Li, G.; Zhou, J.; Jin, X.; Wang, W.; Pan, X. The spatial characteristics of ambient particulate matter and daily mortality in the urban area of Beijing, China. Sci. Total Environ. 2012, 435–436, 14–20. [Google Scholar] [CrossRef] [PubMed]
- Li, H.; Zhao, Z.; Luo, X.-S.; Fang, G.; Zhang, D.; Pang, Y.; Huang, W.; Mehmood, T.; Tang, M. Insight into urban PM2.5 chemical composition and environmentally persistent free radicals attributed human lung epithelial cytotoxicity. Ecotoxicol. Environ. Saf. 2022, 234, 113356. [Google Scholar] [CrossRef] [PubMed]
- Mehmood, T.; Liu, C.; Gaurav, G.K.; Haider, F.U.; Bibi, R.; Usman, M.; Mustafa, B.; Liu, J.; Ejaz, M.; Arslan, F. Toxicity and related engineering and biological controls. In Hazardous Waste Management; Elsevier: Amsterdam, The Netherlands, 2022; pp. 185–215. [Google Scholar]
- Chen, H.; Burnett, R.T.; Kwong, J.C.; Villeneuve, P.J.; Goldberg, M.S.; Brook, R.D.; van Donkelaar, A.; Jerrett, M.; Martin, R.V.; Brook, J.R. Risk of incident diabetes in relation to long-term exposure to fine particulate matter in Ontario, Canada. Environ. Health Perspect. 2013, 121, 804. [Google Scholar] [CrossRef]
- Coccia, M. Factors determining the diffusion of COVID-19 and suggested strategy to prevent future accelerated viral infectivity similar to COVID. Sci. Total Environ. 2020, 729, 138474. [Google Scholar] [CrossRef]
- Coccia, M. Two mechanisms for accelerated diffusion of COVID-19 outbreaks in regions with high intensity of population and polluting industrialization: The air pollution-to-human and human-to-human transmission dynamics. medRxiv 2020. [CrossRef]
- Sanità di Toppi, L.; Sanità di Toppi, L.; Bellini, E. Novel coronavirus: How atmospheric particulate affects our environment and health. Challenges 2020, 11, 6. [Google Scholar] [CrossRef]
- Xu, J.; Zhao, S.; Teng, T.; Abdalla, A.E.; Zhu, W.; Xie, L.; Wang, Y.; Guo, X. Systematic comparison of two animal-to-human transmitted human coronaviruses: SARS-CoV-2 and SARS-CoV. Viruses 2020, 12, 244. [Google Scholar] [CrossRef] [Green Version]
- Domingo, J.L.; Rovira, J. Effects of air pollutants on the transmission and severity of respiratory viral infections. Environ. Res. 2020, 187, 109650. [Google Scholar] [CrossRef]
- Han, J.; Yin, J.; Wu, X.; Wang, D.; Li, C. Environment and COVID-19 incidence: A critical review. J. Environ. Sci. 2022, 124, 933–951. [Google Scholar] [CrossRef]
- Ashraf, M.A.; Faheem, M.; Hassan, M.A. Impact of COVID-19 on Environmental Ecosystem; Springer: Berlin/Heidelberg, Germany, 2021; pp. 1–3. [Google Scholar]
- Rouadi, P.W.; Idriss, S.A.; Naclerio, R.M.; Peden, D.B.; Ansotegui, I.J.; Canonica, G.W.; Gonzalez-Diaz, S.N.; Rosario Filho, N.A.; Ivancevich, J.C.; Hellings, P.W.; et al. Immunopathological features of air pollution and its impact on inflammatory airway diseases (IAD). World Allergy Organ J. 2020, 13, 100467. [Google Scholar] [CrossRef] [PubMed]
- Wales, A.D.; Davies, R.H. Co-selection of resistance to antibiotics, biocides and heavy metals, and its relevance to foodborne pathogens. Antibiot 2015, 4, 567–604. [Google Scholar] [CrossRef] [PubMed] [Green Version]
- Gilbert, J.A.; Stephens, B. Microbiology of the built environment. Nat. Rev. Microbiol. 2018, 16, 661–670. [Google Scholar] [CrossRef] [PubMed]
- van Boheemen, S.; de Graaf, M.; Lauber, C.; Bestebroer, T.M.; Raj, V.S.; Zaki, A.M.; Osterhaus, A.D.; Haagmans, B.L.; Gorbalenya, A.E.; Snijder, E.J.; et al. Genomic characterization of a newly discovered coronavirus associated with acute respiratory distress syndrome in humans. mBio 2012, 3, e00473-12. [Google Scholar] [CrossRef] [Green Version]
- Perlman, S.; Netland, J. Coronaviruses post-sars: Update on replication and pathogenesis. Nat. Rev. Microbiol. 2009, 7, 439–450. [Google Scholar] [CrossRef] [Green Version]
- Raj, V.S.; Mou, H.; Smits, S.L.; Dekkers, D.H.; Muller, M.A.; Dijkman, R.; Muth, D.; Demmers, J.A.; Zaki, A.; Fouchier, R.A.; et al. Dipeptidyl peptidase 4 is a functional receptor for the emerging human coronavirus-EMC. Nature 2013, 495, 251–254. [Google Scholar] [CrossRef] [Green Version]
- Wang, N.; Shi, X.; Jiang, L.; Zhang, S.; Wang, D.; Tong, P.; Guo, D.; Fu, L.; Cui, Y.; Liu, X.; et al. Structure of MERS-CoV spike receptor-binding domain complexed with human receptor DPP4. Cell Res. 2013, 23, 986–993. [Google Scholar] [CrossRef] [Green Version]
- Bertram, S.; Glowacka, I.; Muller, M.A.; Lavender, H.; Gnirss, K.; Nehlmeier, I.; Niemeyer, D.; He, Y.; Simmons, G.; Drosten, C.; et al. Cleavage and activation of the severe acute respiratory syndrome coronavirus spike protein by human airway trypsin-like protease. J. Virol. 2011, 85, 13363–13372. [Google Scholar] [CrossRef] [Green Version]
- Glowacka, I.; Bertram, S.; Muller, M.A.; Allen, P.; Soilleux, E.; Pfefferle, S.; Steffen, I.; Tsegaye, T.S.; He, Y.; Gnirss, K.; et al. Evidence that tmprss2 activates the severe acute respiratory syndrome coronavirus spike protein for membrane fusion and reduces viral control by the humoral immune response. J. Virol. 2011, 85, 4122–4134. [Google Scholar] [CrossRef] [Green Version]
- Wu, F.; Zhao, S.; Yu, B.; Chen, Y.M.; Wang, W.; Song, Z.G.; Hu, Y.; Tao, Z.W.; Tian, J.H.; Pei, Y.Y.; et al. A new coronavirus associated with human respiratory disease in China. Nature 2020, 579, 265–269. [Google Scholar] [CrossRef]
- Zhou, P.; Yang, X.-L.; Wang, X.-G.; Hu, B.; Zhang, L.; Zhang, W.; Si, H.-R.; Zhu, Y.; Li, B.; Huang, C.-L.; et al. A pneumonia outbreak associated with a new coronavirus of probable bat origin. Nature 2020, 579, 270–273. [Google Scholar] [CrossRef] [PubMed] [Green Version]
- Xu, X.; Chen, P.; Wang, J.; Feng, J.; Zhou, H.; Li, X.; Zhong, W.; Hao, P. Evolution of the novel coronavirus from the ongoing Wuhan outbreak and modeling of its spike protein for risk of human transmission. Sci. China Life Sci. 2020, 63, 457–460. [Google Scholar] [CrossRef] [PubMed] [Green Version]
- Wan, Y.; Shang, J.; Graham, R.; Baric, R.S.; Li, F. Receptor recognition by the novel coronavirus from Wuhan: An analysis based on decade-long structural studies of SARS coronavirus. J. Virol. 2020, 94, e00127-20. [Google Scholar] [CrossRef] [PubMed] [Green Version]
- Liu, J.; Li, Y.; Li, J.; Liu, Y.; Tao, N.; Song, W.; Cui, L.; Li, H. Association between ambient PM2.5 and children’s hospital admissions for respiratory diseases in Jinan, China. Environ. Sci. Pollut. Res. Int. 2019, 26, 24112–24120. [Google Scholar] [CrossRef] [PubMed]
- Li, N.; Xia, T.; Nel, A.E. The role of oxidative stress in ambient particulate matter-induced lung diseases and its implications in the toxicity of engineered nanoparticles. Free Radic Biol. Med. 2008, 44, 1689–1699. [Google Scholar] [CrossRef] [PubMed] [Green Version]
- Rhee, J.; Dominici, F.; Zanobetti, A.; Schwartz, J.; Wang, Y.; Di, Q.; Balmes, J.; Christiani, D.C. Impact of long-term exposures to ambient PM2.5 and Ozone on ards risk for older adults in the United States. Chest 2019, 156, 71–79. [Google Scholar] [CrossRef]
- Setti, L.; Passarini, F.; De Gennaro, G.; Barbieri, P.; Pallavicini, A.; Ruscio, M.; Piscitelli, P.; Colao, A.; Miani, A. Searching for SARS-CoV-2 on particulate matter: A possible early indicator of COVID-19 epidemic recurrence. Int. J. Environ. Res. Public Health 2020, 17, 2986. [Google Scholar] [CrossRef]
- Becker, S.; Soukup, J.M. Exposure to urban air particulates alters the macrophage-mediated inflammatory response to respiratory viral infection. J. Toxicol. Environ. Health A 1999, 57, 445–457. [Google Scholar]
- Adhikari, A.; Yin, J. Short-term effects of ambient ozone, PM2.5, and meteorological factors on COVID-19 confirmed cases and deaths in queens, New York. Int. J. Environ. Res. Public Health 2020, 17, 4047. [Google Scholar] [CrossRef]
- Fattorini, D.; Regoli, F. Role of the chronic air pollution levels in the COVID-19 outbreak risk in Italy. Environ. Pollut. 2020, 264, 114732. [Google Scholar] [CrossRef]
- Jiang, Y.; Wu, X.J.; Guan, Y.J. Effect of ambient air pollutants and meteorological variables on COVID-19 incidence. Infect. Control Hosp. Epidemiol. 2020, 41, 1011–1015. [Google Scholar] [CrossRef] [PubMed]
- Li, H.; Xu, X.L.; Dai, D.W.; Huang, Z.Y.; Ma, Z.; Guan, Y.J. Air pollution and temperature are associated with increased COVID-19 incidence: A time series study. Int. J. Infect. Dis. 2020, 97, 278–282. [Google Scholar] [CrossRef] [PubMed]
- Vasquez-Apestegui, V.; Parras-Garrido, E.; Tapia, V.; Paz-Aparicio, V.M.; Rojas, J.P.; Sanchez-Ccoyllo, O.R.; Gonzales, G.F. Association between air pollution in lima and the high incidence of COVID-19: Findings from a post hoc analysis. Res. Sq. 2020, 21, 1161. [Google Scholar] [CrossRef] [PubMed]
- Yao, Y.; Pan, J.; Wang, W.; Liu, Z.; Kan, H.; Qiu, Y.; Meng, X.; Wang, W. Association of particulate matter pollution and case fatality rate of COVID-19 in 49 Chinese cities. Sci. Total Environ. 2020, 741, 140396. [Google Scholar] [CrossRef]
- Zoran, M.A.; Savastru, R.S.; Savastru, D.M.; Tautan, M.N. Assessing the relationship between surface levels of PM2.5 and PM10 particulate matter impact on COVID-19 in Milan, Italy. Sci. Total Environ. 2020, 738, 139825. [Google Scholar] [CrossRef] [PubMed]
- Setti, L.; Passarini, F.; De Gennaro, G.; Barbieri, P.; Licen, S.; Perrone, M.G.; Piazzalunga, A.; Borelli, M.; Palmisani, J.; Di Gilio, A.; et al. Potential role of particulate matter in the spreading of COVID-19 in Northern Italy: First observational study based on initial epidemic diffusion. BMJ Open 2020, 10, e039338. [Google Scholar] [CrossRef]
- Venter, Z.S.; Aunan, K.; Chowdhury, S.; Lelieveld, J. COVID-19 lockdowns cause global air pollution declines. Proc. Natl. Acad. Sci. USA 2020, 117, 18984–18990. [Google Scholar] [CrossRef]
- WHO. Coronavirus Disease (COVID-19) Situation Reports; WHO: Geneva, Switzerland, 2020; Available online: https://www.who.int/emergencies/diseases/novel-coronavirus-2019/situation-reports (accessed on 28 July 2020).
- Baccini, M.; Biggeri, A.; Grillo, P.; Consonni, D.; Bertazzi, P.A. Health impact assessment of fine particle pollution at the regional level. Am. J. Epidemiol. 2011, 174, 1396–1405. [Google Scholar] [CrossRef] [Green Version]
- Candido, D.S.; Claro, I.M.; De Jesus, J.G.; Souza, W.M.; Moreira, F.R.; Dellicour, S.; Mellan, T.A.; Du Plessis, L.; Pereira, R.H.; Sales, F.C. Evolution and epidemic spread of SARS-CoV-2 in Brazil. Science 2020, 369, 1255–1260. [Google Scholar] [CrossRef]
- Sarmadi, M.; Marufi, N.; Moghaddam, V.K. Association of COVID-19 global distribution and environmental and demographic factors: An updated three-month study. Environ. Res. 2020, 188, 109748. [Google Scholar] [CrossRef]
- Wu, X.; Yin, J.; Li, C.; Xiang, H.; Lv, M.; Guo, Z. Natural and human environment interactively drive spread pattern of COVID-19: A city-level modeling study in China. Sci. Total Environ. 2021, 756, 143343. [Google Scholar] [CrossRef] [PubMed]
- Metelmann, S.; Pattni, K.; Brierley, L.; Cavalerie, L.; Caminade, C.; Blagrove, M.S.; Turner, J.; Sharkey, K.J.; Baylis, M. Impact of climatic, demographic and disease control factors on the transmission dynamics of COVID-19 in large cities worldwide. One Health 2021, 12, 100221. [Google Scholar] [CrossRef] [PubMed]
- Bontempi, E.; Coccia, M.; Vergalli, S.; Zanoletti, A. Can commercial trade represent the main indicator of the COVID-19 diffusion due to human-to-human interactions? A comparative analysis between Italy, France, and Spain. Environ. Res. 2021, 201, 111529. [Google Scholar] [CrossRef]
- He, C.; Hong, S.; Zhang, L.; Mu, H.; Xin, A.; Zhou, Y.; Liu, J.; Liu, N.; Su, Y.; Tian, Y. Global, continental, and national variation in PM2.5, O3, and NO2 concentrations during the early 2020 COVID-19 lockdown. Atmos. Pollut. Res. 2021, 12, 136–145. [Google Scholar] [CrossRef]
- Nottmeyer, L.N.; Sera, F. Influence of temperature, and of relative and absolute humidity on COVID-19 incidence in England-a multi-city time-series study. Environ. Res. 2021, 196, 110977. [Google Scholar] [CrossRef] [PubMed]
- Zarei, M.; Rahimi, K.; Hassanzadeh, K.; Abdi, M.; Hosseini, V.; Fathi, A.; Kakaei, K. From the environment to the cells: An overview on pivotal factors which affect spreading and infection in COVID-19 pandemic. Environ. Res. 2021, 201, 111555. [Google Scholar] [CrossRef] [PubMed]
- Gunthe, S.S.; Swain, B.; Patra, S.S.; Amte, A. On the global trends and spread of the COVID-19 outbreak: Preliminary assessment of the potential relation between location-specific temperature and UV index. J. Public Health 2020, 30, 219–228. [Google Scholar] [CrossRef]
- Hossain, M.S.; Ahmed, S.; Uddin, M.J. Impact of weather on COVID-19 transmission in South Asian countries: An application of the arimax model. Sci. Total Environ. 2021, 761, 143315. [Google Scholar] [CrossRef] [PubMed]
- Mehmood, T.; Tianle, Z.; Ahmad, I.; Li, X.; Shen, F.; Akram, W.; Dong, L. Variations of PM2.5, PM10 mass concentration and health assessment in Islamabad, Pakistan. In IOP Conference Series: Earth and Environmental Science; IOP Publishing: Bristol, UK, 2018; p. 012031. [Google Scholar]
- Islam, N.; Bukhari, Q.; Jameel, Y.; Shabnam, S.; Erzurumluoglu, A.M.; Siddique, M.A.; Massaro, J.M.; D’Agostino Sr, R.B. COVID-19 and climatic factors: A global analysis. Environ. Res. 2021, 193, 110355. [Google Scholar] [CrossRef]
- Van Doremalen, N.; Bushmaker, T.; Morris, D.H.; Holbrook, M.G.; Gamble, A.; Williamson, B.N.; Tamin, A.; Harcourt, J.L.; Thornburg, N.J.; Gerber, S.I. Aerosol and surface stability of SARS-CoV-2 as compared with SARS-CoV-1. N. Engl. J. Med. 2020, 382, 1564–1567. [Google Scholar] [CrossRef]
- Saini, G.; Swahn, M.H.; Aneja, R. Disentangling the coronavirus disease 2019 health disparities in African Americans: Biological, environmental, and social factors. In Open Forum Infectious Diseases; Oxford University Press: Oxford, UK, 2021; p. ofab064. [Google Scholar]
- Nana-Sinkam, P.; Kraschnewski, J.; Sacco, R.; Chavez, J.; Fouad, M.; Gal, T.; AuYoung, M.; Namoos, A.; Winn, R.; Sheppard, V. Health disparities and equity in the era of COVID-19. J. Clin. Transl. Sci. 2021, 5, e99. [Google Scholar] [CrossRef] [PubMed]
- Paital, B.; Das, K.; Parida, S.K. Inter nation social lockdown versus medical care against COVID-19, a mild environmental insight with special reference to India. Sci. Total Environ. 2020, 728, 138914. [Google Scholar] [CrossRef] [PubMed]
- Flaxman, S.; Mishra, S.; Gandy, A.; Unwin, H.J.T.; Mellan, T.A.; Coupland, H.; Whittaker, C.; Zhu, H.; Berah, T.; Eaton, J.W. Estimating the effects of non-pharmaceutical interventions on COVID-19 in Europe. Nature 2020, 584, 257–261. [Google Scholar] [CrossRef]
- Favale, T.; Soro, F.; Trevisan, M.; Drago, I.; Mellia, M. Campus traffic and e-learning during COVID-19 pandemic. Comput. Netw. 2020, 176, 107290. [Google Scholar] [CrossRef]
- Prospects, G.E. Pandemic, Recession: The Global Economy in Crisis; World Bank Group: Washington, DC, USA, 2020. [Google Scholar]
- Guan, D.; Wang, D.; Hallegatte, S.; Davis, S.J.; Huo, J.; Li, S.; Bai, Y.; Lei, T.; Xue, Q.; Coffman, D.M. Global supply-chain effects of COVID-19 control measures. Nat. Hum. Behav. 2020, 4, 577–587. [Google Scholar] [CrossRef] [PubMed]
- Jin, H.; Wang, H.; Li, X.; Zheng, W.; Ye, S.; Zhang, S.; Zhou, J.; Pennington, M. Economic burden of COVID-19, China, January–March, 2020: A cost-of-illness study. Bull. World Health Organ. 2021, 99, 112. [Google Scholar] [CrossRef] [PubMed]
- Perracini, M.R.; De Amorim, J.S.C.; Lima, C.A.; Da Silva, A.; Trombini-Souza, F.; Pereira, D.S.; Pelicioni, P.H.S.; Duim, E.; Batista, P.P.; Dos Santos, R.B. Impact of COVID-19 pandemic on life-space mobility of older adults living in brazil: Remobilize study. Front. Public Health 2021, 9, 643640. [Google Scholar] [CrossRef] [PubMed]
- Rodríguez-Urrego, D.; Rodríguez-Urrego, L. Air quality during the COVID-19: PM2.5 analysis in the 50 most polluted capital cities in the world. Environ. Pollut. 2020, 266, 115042. [Google Scholar] [CrossRef] [PubMed]
- Pan, S.; Jung, J.; Li, Z.; Hou, X.; Roy, A.; Choi, Y.; Gao, H.O. Air quality implications of COVID-19 in California. Sustainability 2020, 12, 7067. [Google Scholar] [CrossRef]
- Gautam, A.S.; Dilwaliya, N.K.; Srivastava, A.; Kumar, S.; Bauddh, K.; Siingh, D.; Shah, M.; Singh, K.; Gautam, S. Temporary reduction in air pollution due to anthropogenic activity switch-off during COVID-19 lockdown in northern parts of India. Environ. Dev. Sustain. 2021, 23, 8774–8797. [Google Scholar] [CrossRef]
- Bruce, N.; Perez-Padilla, R.; Albalak, R. Indoor air pollution in developing countries: A major environmental and public health challenge. Bull. World Health Organ. 2000, 78, 1078–1092. [Google Scholar]
- Wang, Y.; Wu, R.; Liu, L.; Yuan, Y.; Liu, C.; Hang Ho, S.S.; Ren, H.; Wang, Q.; Lv, Y.; Yan, M.; et al. Differential health and economic impacts from the COVID-19 lockdown between the developed and developing countries: Perspective on air pollution. Environ. Pollut. 2022, 293, 118544. [Google Scholar] [CrossRef] [PubMed]
- Hunt, A.; Ferguson, J.; Hurley, F.; Searl, A. Social costs of morbidity impacts of air pollution. OECD Environ. Work. Pap. 2016, 99, 1–78. [Google Scholar]
- Reardon, T.; Timmer, C.P.; Barrett, C.B.; Berdegué, J. The rise of supermarkets in Africa, Asia, and Latin America. Am. J. Agric. Econ. 2003, 85, 1140–1146. [Google Scholar] [CrossRef]
- Shah, K.U.; Arjoon, S.; Rambocas, M. Aligning corporate social responsibility with green economy development pathways in developing countries. Sustain. Dev. 2016, 24, 237–253. [Google Scholar] [CrossRef]
- Wang, Y.; Liu, C.; Wang, Q.; Qin, Q.; Ren, H.; Cao, J. Impacts of natural and socioeconomic factors on PM2.5 from 2014 to 2017. J. Environ. Manag. 2021, 284, 112071. [Google Scholar] [CrossRef] [PubMed]
- Li, N.; Zhang, X.; Shi, M.; Hewings, G.J.D. Does China’s air pollution abatement policy matter? An assessment of the Beijing-Tianjin-Hebei region based on a multi-regional CGE model. Energy Policy 2019, 127, 213–227. [Google Scholar] [CrossRef]
- Mendoza, D.L.; Benney, T.M.; Boll, S. Long-term analysis of the relationships between indoor and outdoor fine particulate pollution: A case study using research grade sensors. Sci. Total Environ. 2021, 776, 145778. [Google Scholar] [CrossRef]
- Long, M.A.; Lynch, M.J.; Stretesky, P.B. The great recession, the treadmill of production and ecological disorganization: Did the recession decrease toxic releases across US states, 2005–2014? Ecol. Econ. 2018, 146, 184–192. [Google Scholar] [CrossRef]
- Gold, J.A.W.; Wong, K.K.; Szablewski, C.M.; Patel, P.R.; Rossow, J.; da Silva, J.; Natarajan, P.; Morris, S.B.; Fanfair, R.N.; Rogers-Brown, J.; et al. Characteristics and clinical outcomes of adult patients hospitalized with COVID-19—Georgia, March 2020. MMWR Morb. Mortal Wkly. Rep. 2020, 69, 545–550. [Google Scholar] [CrossRef]
- Zhao, X.; Zhou, W.; Han, L.; Locke, D. Spatiotemporal variation in PM2.5 concentrations and their relationship with socioeconomic factors in China’s major cities. Environ. Int. 2019, 133, 105145. [Google Scholar] [CrossRef] [PubMed]
- Liu, H.; Fei, C.; Chen, Y.; Luo, S.; Yang, T.; Yang, L.; Liu, J.; Ji, X.; Wu, W.; Song, J. Investigating SARS-CoV-2 persistent contamination in different indoor environments. Environ. Res. 2021, 202, 111763. [Google Scholar] [CrossRef] [PubMed]
- Mehmood, T.; Hassan, M.A.; Faheem, M.; Shakoor, A. Why is inhalation the most discriminative route of microplastics exposure? Environ. Sci. Pollut. Res. 2022, 29, 49479–49482. [Google Scholar] [CrossRef] [PubMed]
- Kazakos, V.; Taylor, J.; Luo, Z. Impact of COVID-19 lockdown on NO2 and PM2.5 exposure inequalities in London, UK. Environ. Res. 2021, 198, 111236. [Google Scholar] [CrossRef]
- Zhang, D.; Li, H.; Luo, X.-S.; Huang, W.; Pang, Y.; Yang, J.; Tang, M.; Mehmood, T.; Zhao, Z. Toxicity assessment and heavy metal components of inhalable particulate matters (PM2.5 & PM10) during a dust storm invading the city. Process. Saf. Environ. Prot. 2022, 162, 859–866. [Google Scholar]
- Li, H.; Tang, M.; Luo, X.; Li, W.; Pang, Y.; Huang, W.; Zhao, Z.; Wei, Y.; Long, T.; Mehmood, T. Compositional characteristics and toxicological responses of human lung epithelial cells to inhalable particles (PM10) from ten typical biomass fuel combustions. Particuology 2022. [Google Scholar] [CrossRef]


| PM | Country | Location | Period | Findings | References |
|---|---|---|---|---|---|
| PM2.5 and PM10 | India | Delhi and Kolkata | From 22 March to 3 May 2020 | Lockdown reduced 59 and 43% PM10 and PM2.5 in Delhi and 49 and 50% in Kolkata compared to PM10 and PM2.5 concentrations found in 2019. | [81] |
| PM2.5 | India | Kolkata, Mumbai, Chennai, Hyderabad, and New Delhi | From 25 March to 31st May 2020 | Peak hour (i.e., 07:00–11:00 h) concentration of PM2.5 reduced by 63.4%, 56.4%, 48.5%, 23.8%, and 21.3% in Kolkata, Mumbai, Chennai, Hyderabad, and New Delhi by the lockdown. | [82] |
| PM2.5 | India | Delhi | From 25 March to 30 April 2020 | Compared to pre-lockdown, PM2.5 concentration decreased by 40%; 94.44% days were observed below the NAAQS 24 h standard limit of 60 μg/m3. | [83] |
| PM2.5 | India | Bengaluru | Daily PM2.5 levels for 53 days. 1 March to 22 April 2020 | PM2.5 reduced by ~15–22%. | [84] |
| PM2.5 | 9 most COVID-19-affected cities | New York, Los Angeles, Rome, Mumbai, Delhi, Dubai, Beijing, Shanghai, and Zaragoza | March 2020 | Comparing March 2020 with March 2019, PM2.5 concentrations decreased in Beijing and Shanghai (up to 50%), in Delhi (35%), New York (32%), Mumbai (14%), Dubai (11%), and Los Angeles (4%). No change in Zaragoza and Rome. | [85] |
| PM10 and PM2.5 | Malaysia and Southeast Asia | Malaysia | March-April 2020 | PM10 and PM2.5 were reduced by 28–39% and 20–42% in the industrial area, and by 26–31% and 23–32% in urban areas, respectively. | [58] |
| PM10 and PM2.5 | Southern European cities and China | Nice, Valencia, Rome, Turin, and Wuhan | 1 January to 18 April 2020 | PM2.5 and PM10 were reduced by ∼42% in Wuhan, by ∼8% in Europe, and ∼6% in Southern Europe. | [86] |
| PM2.5 | Kazakhstan | Almaty | 19 March to 14 April 2020 | PM2.5 declined 21% with a 6–34% spatial variation. | [87] |
| PM10 and PM2.5 | India | Delhi | 1 January to 31 March 2020 | PM10 and PM2.5 levels significantly reduced. Sharp decline of up to 200% of PM2.5 and PM10 concentrations. | [88] |
| PM2.5 | India | Lucknow and New Delhi | 1 February to 21 February and 25 March to 14 March 2020 | Lockdown resulted in a significant decline in PM2.5. | [89] |
| PM2.5 | Northern China | Beijing, Wuhan, and Northern China | 23 January to 29 February 2020 | PM2.5 decreased by 29 ± 22%. Similar reductions in PM2.5 (31 ± 6%) were noted in the urban area of Wuhan. | [90] |
| PM10 and PM2.5 | China | 366 Cities | 24 January to 9 February 2020 | A substantial decrease in PM2.5 and PM10 was attributed primarily to reduced activity in the transportation, industries, and industrial sectors. In China, PM2.5, decreased from 65.0 μg m−3 to 51.4 μg m−3 during lockdown. In total, 315 of the 366 cities experienced a decrease in PM2.5. | [91] |
| PM10 and PM2.5 | Italy | Milan | 9 March to 5 of April 2020 | PM10 and PM2.5 levels were significantly reduced primarily because of reduced vehicular emissions. PM10 reduced up to 59% while PM2.5 decreased up to 47.4%. | [92] |
| PM10 | Morocco | Salé City | 11 March to 2 April 2020 | There was an outweighing of locally emitted PM10 reductions by long-range transported aerosols. Overall, 75% reduction in PM10 concentration was reported. | [43] |
| PM10 | India | Dwarka river basin within Jharkhand and West Bengal | 28 March to 13 April 2020 | As a result of the lockdown, PM10 concentrations dropped from 189–278 μg/m3 to 50–65 μg/m3. | [93] |
| PM2.5 | Pakistan | Four major cities of Lahore, Islamabad, Karachi, and Peshawar. | 23 March to 15 April 2020 | Satellite observations reveal PM2.5 pollution levels reduction of 13% to 33%, whereas ground-based observations reveal 23% to 58% decrease. | [94] |
| PM2.5 | Pakistan | Lahore, Karachi, Peshawar Islamabad | 22 March to 30 June 2020 | Pre-lockdown: 176.0, 142.5, 148.9, and 131.7; In lockdown: 108.9, 78.0, 97.2, and 83.0; Relaxed period: 133.5, 77.7, 101.7, and 82.6; In smart lockdown: 134.9, 65.3, 126.9, and 103.8 | [95] |
Publisher’s Note: MDPI stays neutral with regard to jurisdictional claims in published maps and institutional affiliations. |
© 2022 by the authors. Licensee MDPI, Basel, Switzerland. This article is an open access article distributed under the terms and conditions of the Creative Commons Attribution (CC BY) license (https://creativecommons.org/licenses/by/4.0/).
Share and Cite
Hassan, M.A.; Mehmood, T.; Lodhi, E.; Bilal, M.; Dar, A.A.; Liu, J. Lockdown Amid COVID-19 Ascendancy over Ambient Particulate Matter Pollution Anomaly. Int. J. Environ. Res. Public Health 2022, 19, 13540. https://doi.org/10.3390/ijerph192013540
Hassan MA, Mehmood T, Lodhi E, Bilal M, Dar AA, Liu J. Lockdown Amid COVID-19 Ascendancy over Ambient Particulate Matter Pollution Anomaly. International Journal of Environmental Research and Public Health. 2022; 19(20):13540. https://doi.org/10.3390/ijerph192013540
Chicago/Turabian StyleHassan, Muhammad Azher, Tariq Mehmood, Ehtisham Lodhi, Muhammad Bilal, Afzal Ahmed Dar, and Junjie Liu. 2022. "Lockdown Amid COVID-19 Ascendancy over Ambient Particulate Matter Pollution Anomaly" International Journal of Environmental Research and Public Health 19, no. 20: 13540. https://doi.org/10.3390/ijerph192013540