

Automatic Fact Checking Using an Interpretable Bert-Based Architecture on COVID-19 Claims


1
Posgrado en Ciencia e Ingeniería de la Computación, Universidad Nacional Autónoma de México, Mexico City 04510, Mexico
2
Instituto de Investigaciones en Matemáticas Aplicadas y en Sistemas, Universidad Nacional Autónoma de México, Mexico City 04510, Mexico
*
Author to whom correspondence should be addressed.
Appl. Sci. 2022, 12(20), 10644; https://doi.org/10.3390/app122010644
Submission received: 29 September 2022
/
Revised: 7 October 2022
/
Accepted: 12 October 2022
/
Published: 21 October 2022
(This article belongs to the Special Issue Applications of Deep Learning and Artificial Intelligence Methods)
Abstract
:We present a neural network architecture focused on verifying facts against evidence found in a knowledge base. The architecture can perform relevance evaluation and claim verification, parts of a well-known three-stage method of fact-checking. We fine-tuned BERT to codify claims and pieces of evidence separately. An attention layer between the claim and evidence representation computes alignment scores to identify relevant terms between both. Finally, a classification layer receives the vector representation of claims and evidence and performs the relevance and verification classification. Our model allows a more straightforward interpretation of the predictions than other state-of-the-art models. We use the scores computed within the attention layer to show which evidence spans are more relevant to classify a claim as supported or refuted. Our classification models achieve results compared to the state-of-the-art models in terms of classification of relevance evaluation and claim verification accuracy on the FEVER dataset.
1. Introduction
Social media is a fundamental information source for many people; internet users rely on these platforms to keep in touch with current events. However, information quality is not always guaranteed. Many phenomena, such as fake news and rumors, can be found daily [1]. This kind of false information might be very harmful, and it is essential to detect it promptly. There are many approaches to deal with this problem. Some of these approaches focus on the stylometric aspect [2], detecting the style in which the false information is written to attract readers, and foster further spread. Others concentrate on detecting patterns in social interactions indicating likely false information [3,4].
This work introduces a knowledge-based method to detect false information. We utilize fact verification to establish whether or not a claim describing a fact is true. Our model takes advantage of the BERT pretrained language model. We use an attention layer to simplify the model interpretation and produce an extra output. The code we used to train and evaluate our models is available at https://github.com/PLN-disca-iimas/InterpretableFactChecking (accessed on 20 October 2022).
The rest of the paper is organized as follows. Section 2 introduces relevant research performed in the field of fact checking. Section 3 describes our novel architecture, which takes advantage of the power of pretrained language models but also leverages an attention mechanism to produce an interpretable output of the decision made regarding the truthfulness of a claim. Our experiments and results are presented in Section 5. In Section 6, we present a case study whose purpose is to apply our architecture to detect false information related to COVID-19. Finally, Section 7 draws conclusions and addresses future research lines.
2. Related Work
Fact verification is a common strategy used to debunk false information in digital media. Usually, it is performed manually due to the difficulties in finding reliable and available evidence supporting or refuting a particular statement and the not trivial decision needed to define a claim as false. Nevertheless, this task is resource intensive and time consuming [5]. For this reason, it is necessary to support this labor through technological tools that promote acceleration in this process. Information Retrieval (IR) systems are already an adequate help, but are not always sufficient for this complex task. Many automatic fact verification approaches follow a three-stage scheme [6]; Figure 1 describes these stages. The first step aims to retrieve relevant documents from a knowledge base or a document collection. These databases usually include tens of thousands of documents, so the retrieval process needs to be efficient. In [7], the authors apply Anserini https://github.com/castorini/anserini (accessed on 17 October 2022) to retrieve documents. Anserini is an IR API based on Apache Lucene https://lucene.apache.org/ (accessed on 17 October 2022). Some approaches rely on weights such as TF-IDF [8]. Others use an external search API [9].
The second step focuses on extracting relevant text spans from retrieved documents. Some approaches measure the similarity between the claim and the statement to evaluate the span relevance [7]. Enhanced Sequential Inference Model (ESIM) [10]-based approaches use recurrent neural networks to classify the relevance [9]. Additionally, methods that fine-tune pretrained language models are available [11], and nowadays, these models have achieved the most competitive results. In Soleimani et al. [11], a model that uses BERT to extract evidence is presented, and it is the state of the art in relevance using neural networks. The difference between our architecture and the architecture by Soleimani et al. is the interpretation capability that we included by computing attention among the tokens of the claims and the evidence.
The third and last step aims to evaluate the claim against retrieved evidence and classify it as supported, refuted, or without information. Approaches aimed at evaluating relevance can also be used to verify the claim. The only difference is that the former uses two classes, while the latter uses three.
3. Interpretable Bert-Based Claim Verification
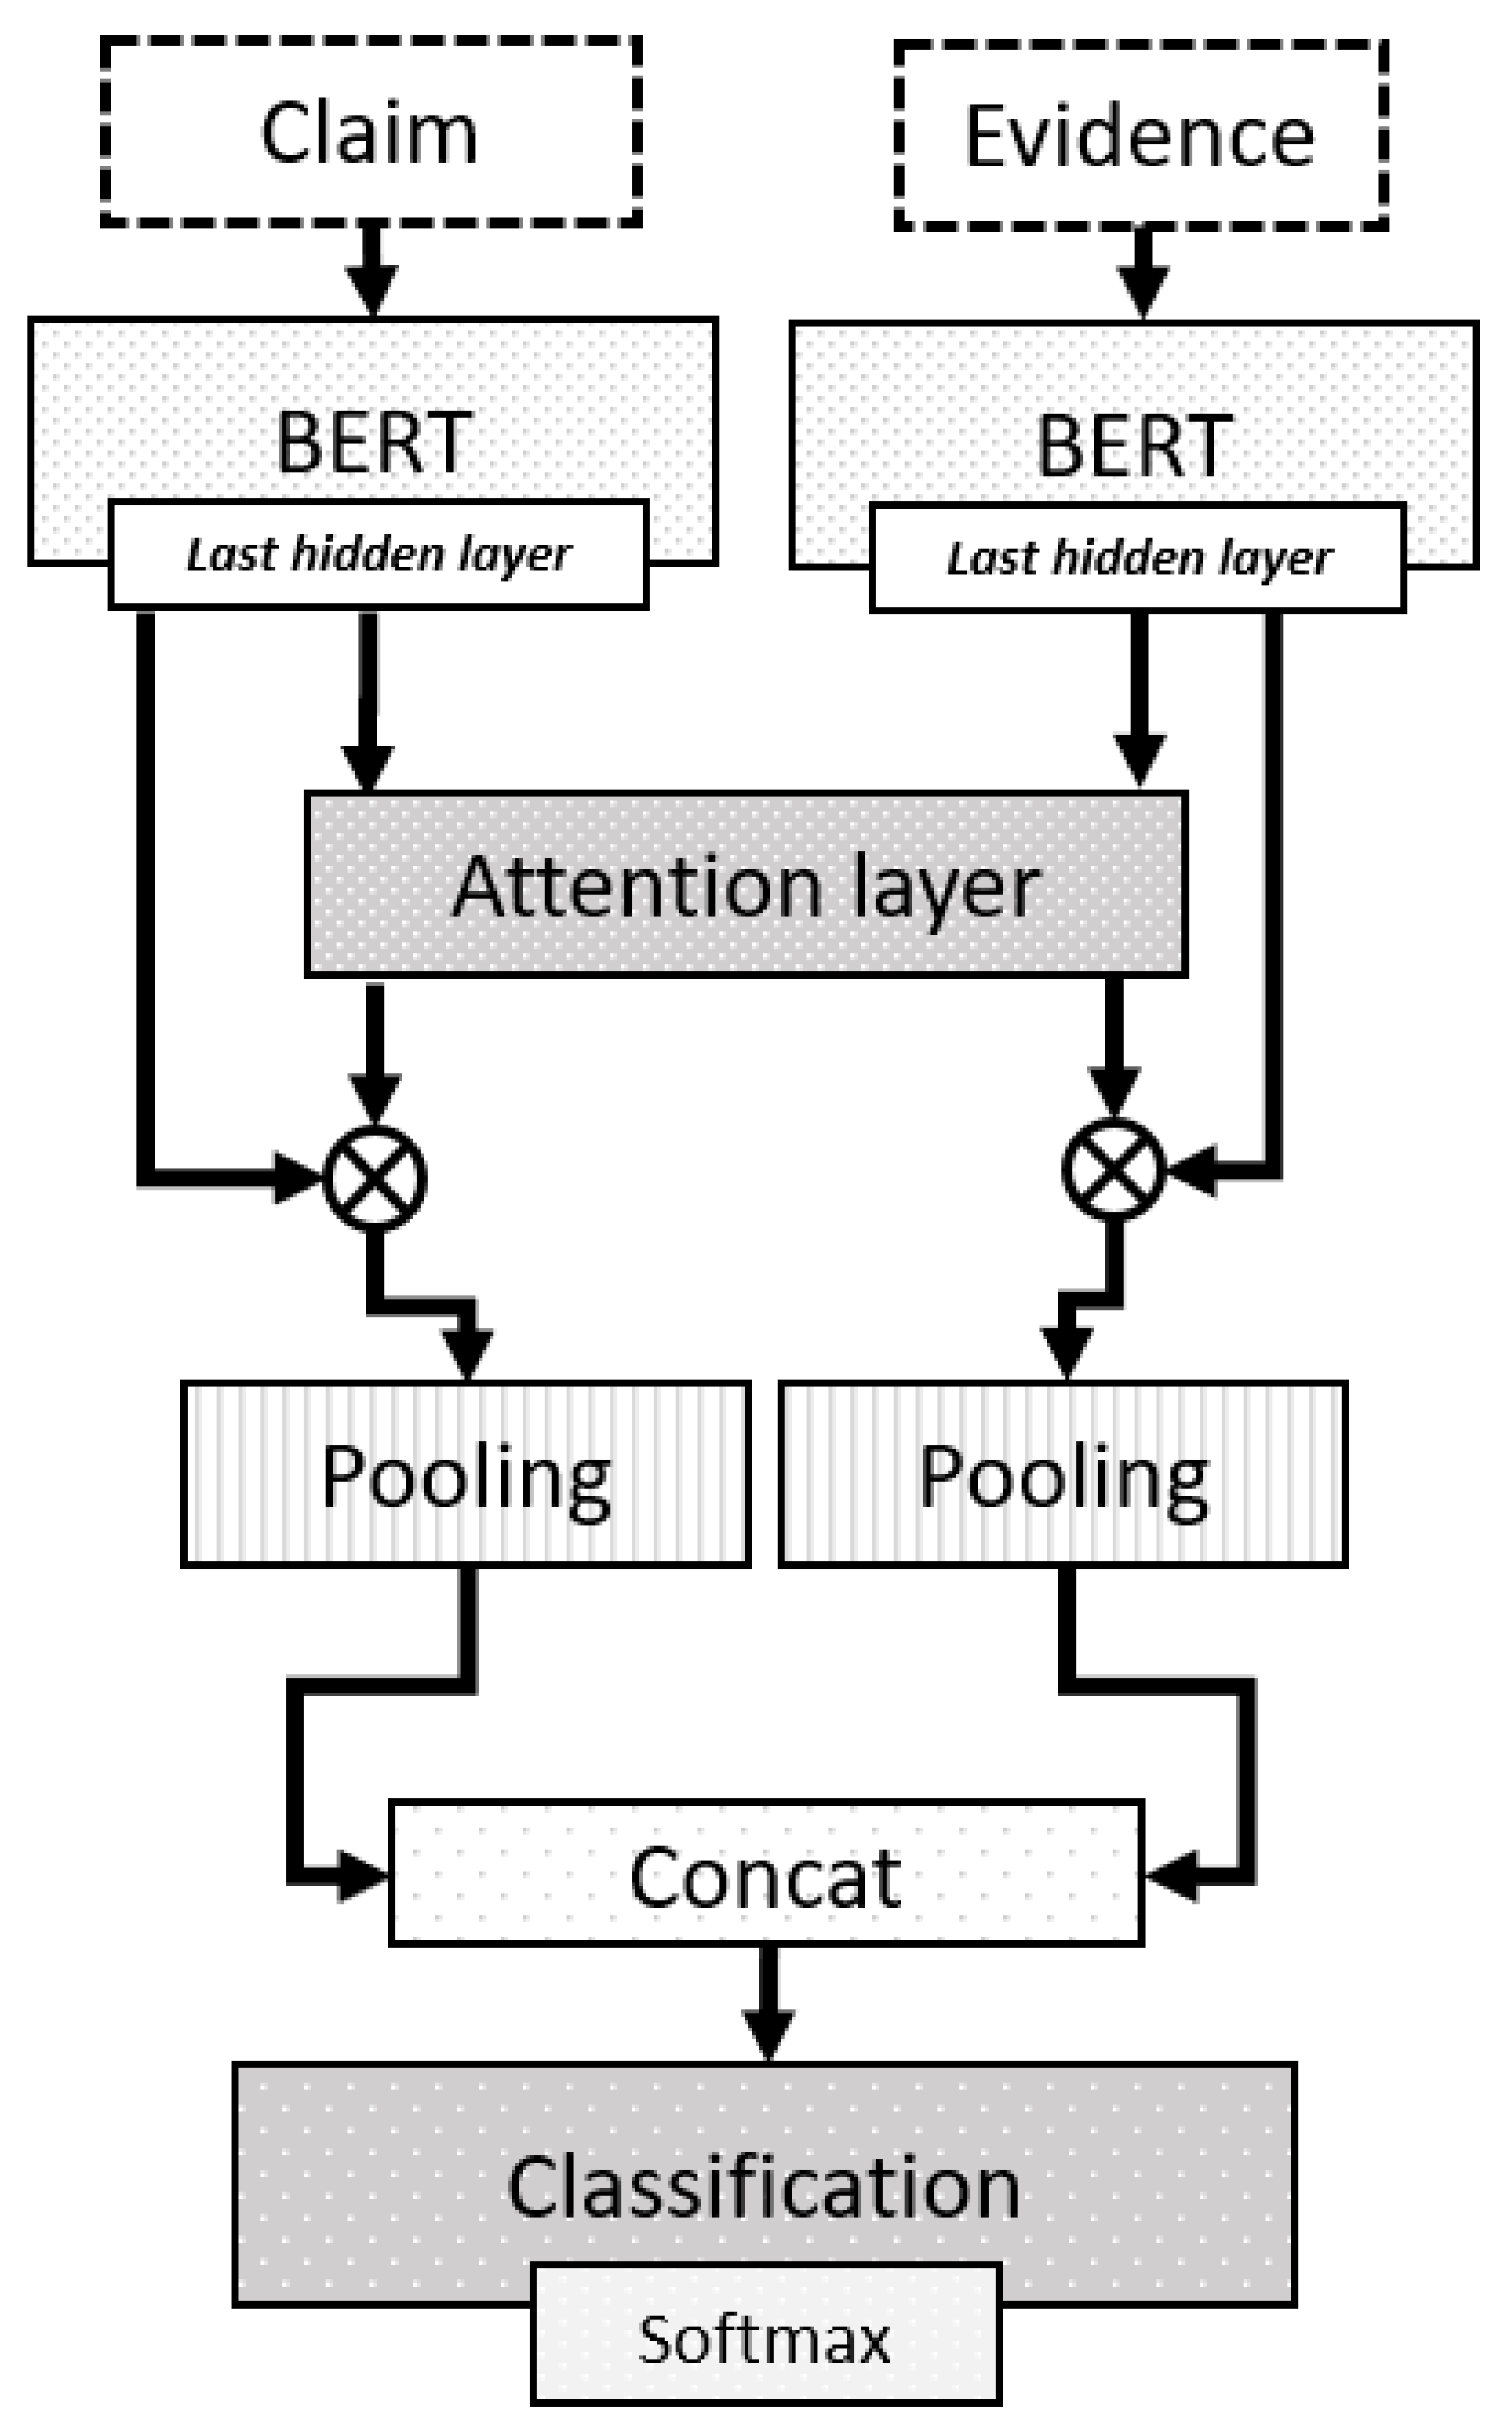
BERT [12] and other transformer-based models [13] have state-of-the-art results in many natural language processing (NLP) tasks, including fact verification. However, these models are large, with millions of parameters and many attention heads. These attention heads can be used to interpret the decisions made by the model. Some of the most powerful transformers rely on the size of both parameters and pretraining data. Consequently, the attention mechanisms are numerous, and getting a single interpretation is complex. Currently, research about what is being learned inside transformer networks is still in process [14]. The interpretation of a model is relevant, since it provides an extra output that gives an insight into what aspects of the input had the most influence when producing the predictions. In the case of fact verification, having this insight might help to detect and mitigate the impact of false information. The architecture we present in this paper takes advantage of the pretraining power of BERT [12], but simultaneously simplifies the model’s interpretation using an attention layer between claim and evidence. Figure 2 depicts our model. The architecture concentrates on relevance evaluation and claims verification tasks, which are the second and third steps of the aforementioned (Section 2) method used to verify descriptions of facts.
The architecture codifies claims and evidence independently using a pair of BERT blocks. Each block produces a sequence and , respectively. Each sequence is the output of the last BERT codifier layer; all token outputs are used. The sequences of claims and evidence are limited to 128 tokens.
With and as inputs, alignment scores are computed in the attention layer, and every element in is evaluated against every element in . As a score function, we assessed the next functions:
- Multiplicative
- Multiplicative + softmax
- Multiplicative + sigmoid
- Cosine
The attention process produces a matrix A of dimensions which correspond to the sequence size, i.e., the number of tokens in the claim and the evidence. Every item represents the alignment of item i in with the item j in . After calculating the attention matrix A, it is multiplied by each of the vector sequences and . The aim of matrix A is to weigh and , giving more weight to those elements related between both sequences. This attention map will be useful to comprehend which text spans are considered relevant by the model. The weighting produces two sequences and (see Equations (5) and (6)).
Now, it is necessary to obtain a single vector that will represent both the claim and the evidence. For this purpose, a pooling is performed on the vector sequences and . The pooling process obtains a vector for each input sentence and . The dimension of these vectors corresponds to the size of the representation of the hidden state of BERT. For the case of the base version, it is 768 dimensions, and for the large version of 1024.
Using the 128 vectors of the sequence, the centroid of this set is obtained. This centroid is the average of each of the vectors’ dimensions. The resulting vector will be Equation (7), where n is the size of the sequence. Now, each sequence is represented by a vector and .
We also evaluated an alternative method to generate a single sequence representation using a LSTM recurrent network [15]. Under this schema, the final representations and correspond to the last hidden state. We experimented with the size of the hidden state and also considered different numbers of layers.
The next step in the fact-checking architecture is the union of and . We used the method introduced in [16]. In this paper, the authors merge the codified vectors from a Siamese network, concatenating and and the difference between them.
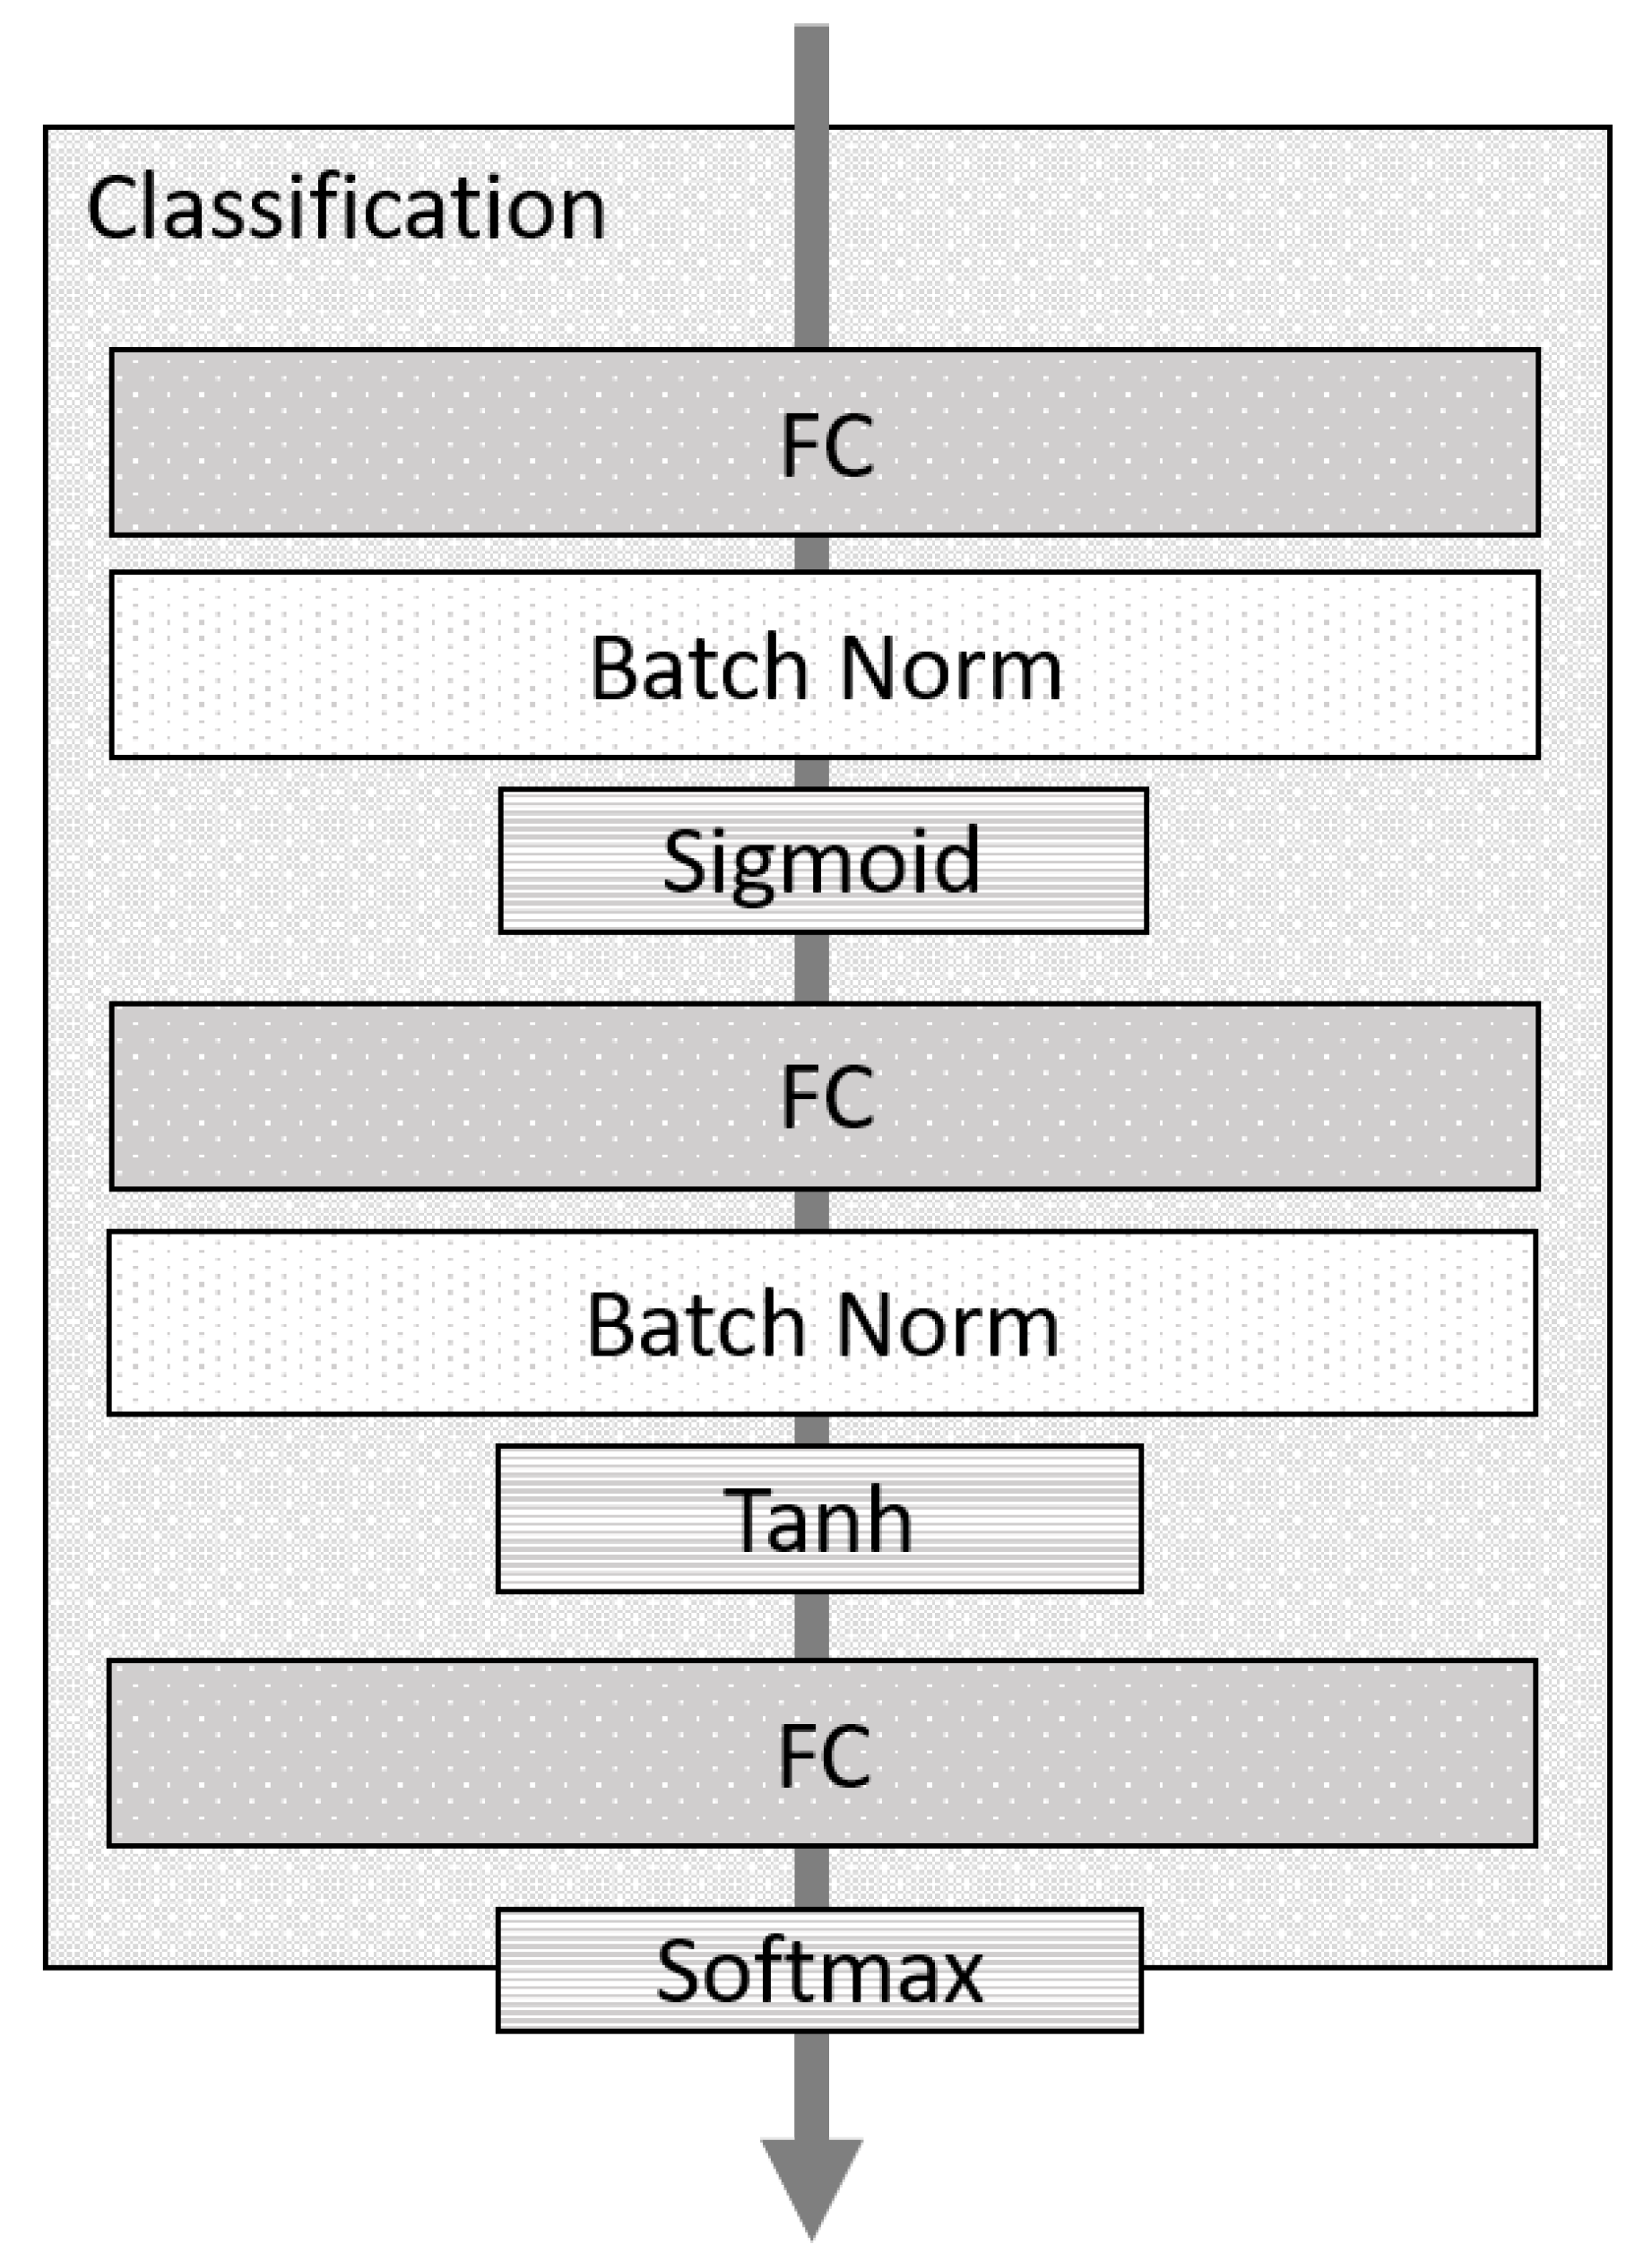
Finally, the merged vector is processed by a classification layer. Figure 3 shows the internal configuration of the classification layer. This configuration is the result of experimentation with different numbers of layers and activation functions. The classification layer comprises three fully connected (FC) layers, which are stacked. The first has a sigmoid activation function (Sigmoid), and the second is a hyperbolic tangent (Tanh). The last layer uses the softmax function to compute the most likely class given the inputs. This layer differentiates the relevance classification model from the claim verification model. The first classifies a pair of claim–evidence as relevant or irrelevant. The second decides whether a claim given some evidence is supported, refuted, or with no information.
4. The FEVER Dataset
To train and test the proposed architecture, we used the FEVER dataset [8]. This dataset contains more than 185k claims extracted from Wikipedia https://en.wikipedia.org (accessed on 17 October 2022). Claims are tagged as supported, refuted, or no information depending on evidence obtained from the same source. We preprocessed the dataset to form claim–evidence pairs extracted from a 2017 Wikipedia dump to facilitate the training process. For relevance evaluation, positive examples were gathered, considering claims tagged as supported or refuted. Negative examples were randomly sampled from Wikipedia articles that also contained positive ones. Selecting random negative examples from any article resulted in trivial potential evidence, and the model was able to classify relevance easily. The dataset for verification was the result of predicting relevant evidence using a trained relevance model.
5. Experiments and Results
We trained the relevance evaluation network for three epochs, using a learning rate decay of 0.1 per epoch. BERT blocks were frozen in the first two epochs, and only the extra layers were trained. In the third epoch, BERT blocks were fine-tuned together with the rest of the network. Additionally, using BERT shared parameters was proven to produce better results. The model intended for verification also used BERT shared parameters.
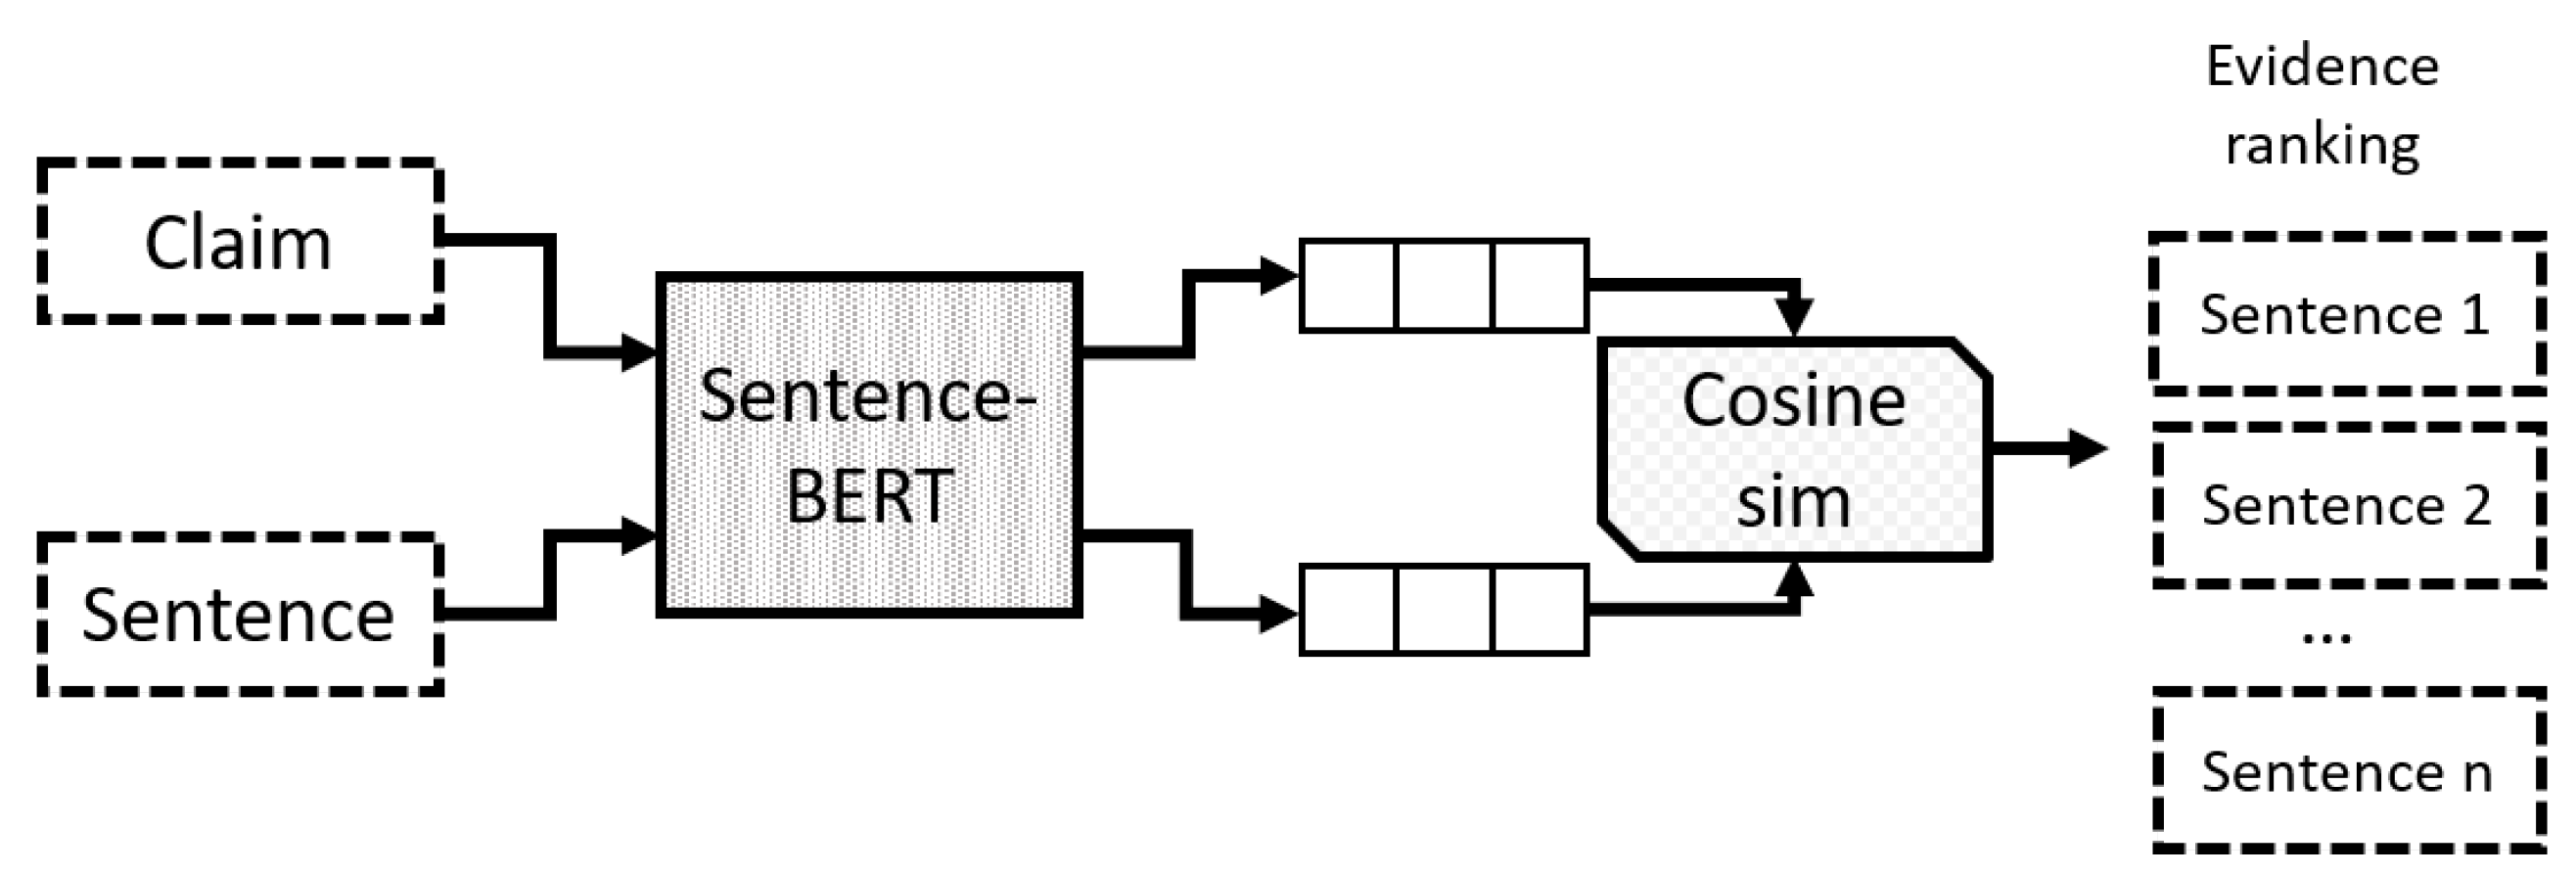
We also considered other transformers such as GPT-2 [17], Roberta [18] and SentenceBERT [16]; however, BERT achieved the best results. As a baseline for relevance evaluation, we used a model implementing SentenceBERT to measure the distance between potential evidence and claim. Distance is computed with cosine similarity. Figure 4 shows this model. We take the top five sentences that are the most closely related to the claim. In this model, the evidence was classified considering its similarity to the claim; if the similarity between the claim and the evidence is less than 0.4, then the evidence is considered relevant; otherwise, it is classified as irrelevant.
Table 1 presents the accuracy of the best configurations tested for relevance evaluation task. Our best model for this task was composed of BERT with shared parameters, multiplicative + softmax attention, and a five-layer LSTM for sequence representation. Using other transformers was not beneficial in evaluating relevance. Our model (in bold) underperformed compared with the state of the art Soleimani et al. [11] for a small difference. In Table 2, we present the recall, precision, and F1 scores considering a retrieval window of five documents.
The second model, intended to verify a claim against evidence, was trained in the dataset created with predictions of the best relevance model. The baseline for the verification task is based on the work of Popat et al. [19], who proposed a LSTM neural network intended to detect fake news based on evidence found in Google https://www.google.com/ (accessed on 17 October 2022). For comparison, we adapt this model by removing the entries referring to sources’ credibility, since the credibility of the evidence is taken for granted in our model [19]. The verification baseline is also trained with the same data as our models.
Table 3 present the accuracy of the verification model. The best configuration for this task differs from the best one focused on evaluating relevance, which reflects the different nature of these tasks. The best configuration was SentBERT (Roberta), multiplicative + softmax attention, and average sequence representation. Our best configuration underperformed compared to the state of the art [11], but has considerably better results than the baseline [19].
We tested the best configurations of both tasks resulting in nine combinations, and with them, we experimented with the complete three-stage method. For document retrieval, we used the predictions of [9] that achieved a recall of 93% in FEVER. With these predictions, we performed the claim relevance evaluation resulting in a set of evidence. Lastly, both evidence and claim were verified, producing a final tag prediction. Table 4 presents the resulting accuracy using complete method. Our best model has lower accuracy compared with [11], but outperformed the baseline. The advantage of our model is the ability to interpret the predictions due to the attention mechanism that allows us to inspect the terms leading to supporting or refuting a claim.
We were seeking a benefit with this architecture to produce a simpler attention map that provides more information regarding final classification. We used matrix A to produce an interpretation, averaging the scores of each evidence token to produce a single importance score for each. Figure 5 and Figure 6 present some examples of pieces of evidence with highlighted tokens. The most relevant spans are highlighted based on scores computed in the attention layer. Identifying the most pertinent tokens in a given piece of evidence is an important advantage of our model. It is worth noting that other models in the state of the art fine-tune pretrained transformers.
6. Case Study: Fact Checking on COVID-19 Claims
The proposed architecture is helpful during fact-verification tasks. It can verify a claim using relevant evidence and provides additional information about the attention of the network on relevant tokens. This extra information is fundamental in the labor against false information. In the situation of a global pandemic, such as COVID-19, this tool can support the verification of related news. Information about various topics such as prevention, treatments, vaccination, and conspiracy theories has been circulating during the pandemic. For the reasons mentioned above, we implemented a model to verify claims related to COVID-19. We employed the following elements:
- Database. We used CORD-19 [20] as the knowledge base of information related to COVID-19 and similar diseases. It comprises tens of thousands of scientific articles, many of which have complete text.
- Information retrieval. To retrieve relevant documents from CORD-19, we used Anserini https://github.com/castorini/anserini (accessed on 17 October 2022). It is an API intended to construct custom indexes, and it can retrieve documents from collections of millions of entries in just a few milliseconds.
- Relevance evaluation. We employed our model to evaluate a claim’s relevance in a retrieved document. The ten documents with the highest probability were selected as evidence. For this task, we utilized the model trained in FEVER.
- Verification. Our verification model was used to verify COVID-19 claims. We used the pretrained model in FEVER as a starting point, and then we fine-tuned it further. We created a COVID-19 claims dataset to fine-tune.
COVID-19 Claims Dataset
To fine-tune the verification model, we created a dataset that contains claims related to COVID-19. First, we collected common claims from sources such as WHO Mythbusters https://www.who.int/emergencies/diseases/novel-coronavirus-2019/advice-for-public/myth-busters (accessed on 17 October 2022), “Myth versus fact” Johns Hopkins https://www.hopkinsmedicine.org/health/conditions-and-diseases/coronavirus/2019-novel-coronavirus-myth-versus-fact (accessed on 17 October 2022) and CNN Questions and answers https://edition.cnn.com/interactive/2020/health/coronavirus-questions-answers/ (accessed on 17 October 2022). As a result, we gathered 112 different claims. Using an index built upon CORD-19, a group of annotators retrieved evidence supporting or refuting claims. A maximum of 10 sentences was extracted for each claim. On average, each claim has 6.77 sentences as evidence. Subsequently, another group of annotators decided to claim the tag based on evidence. To increase the number of examples, we introduced negations to the original claims, changing the initial tag to the opposite one. In this way, we finally collected 1518 claim-evidence pairs.
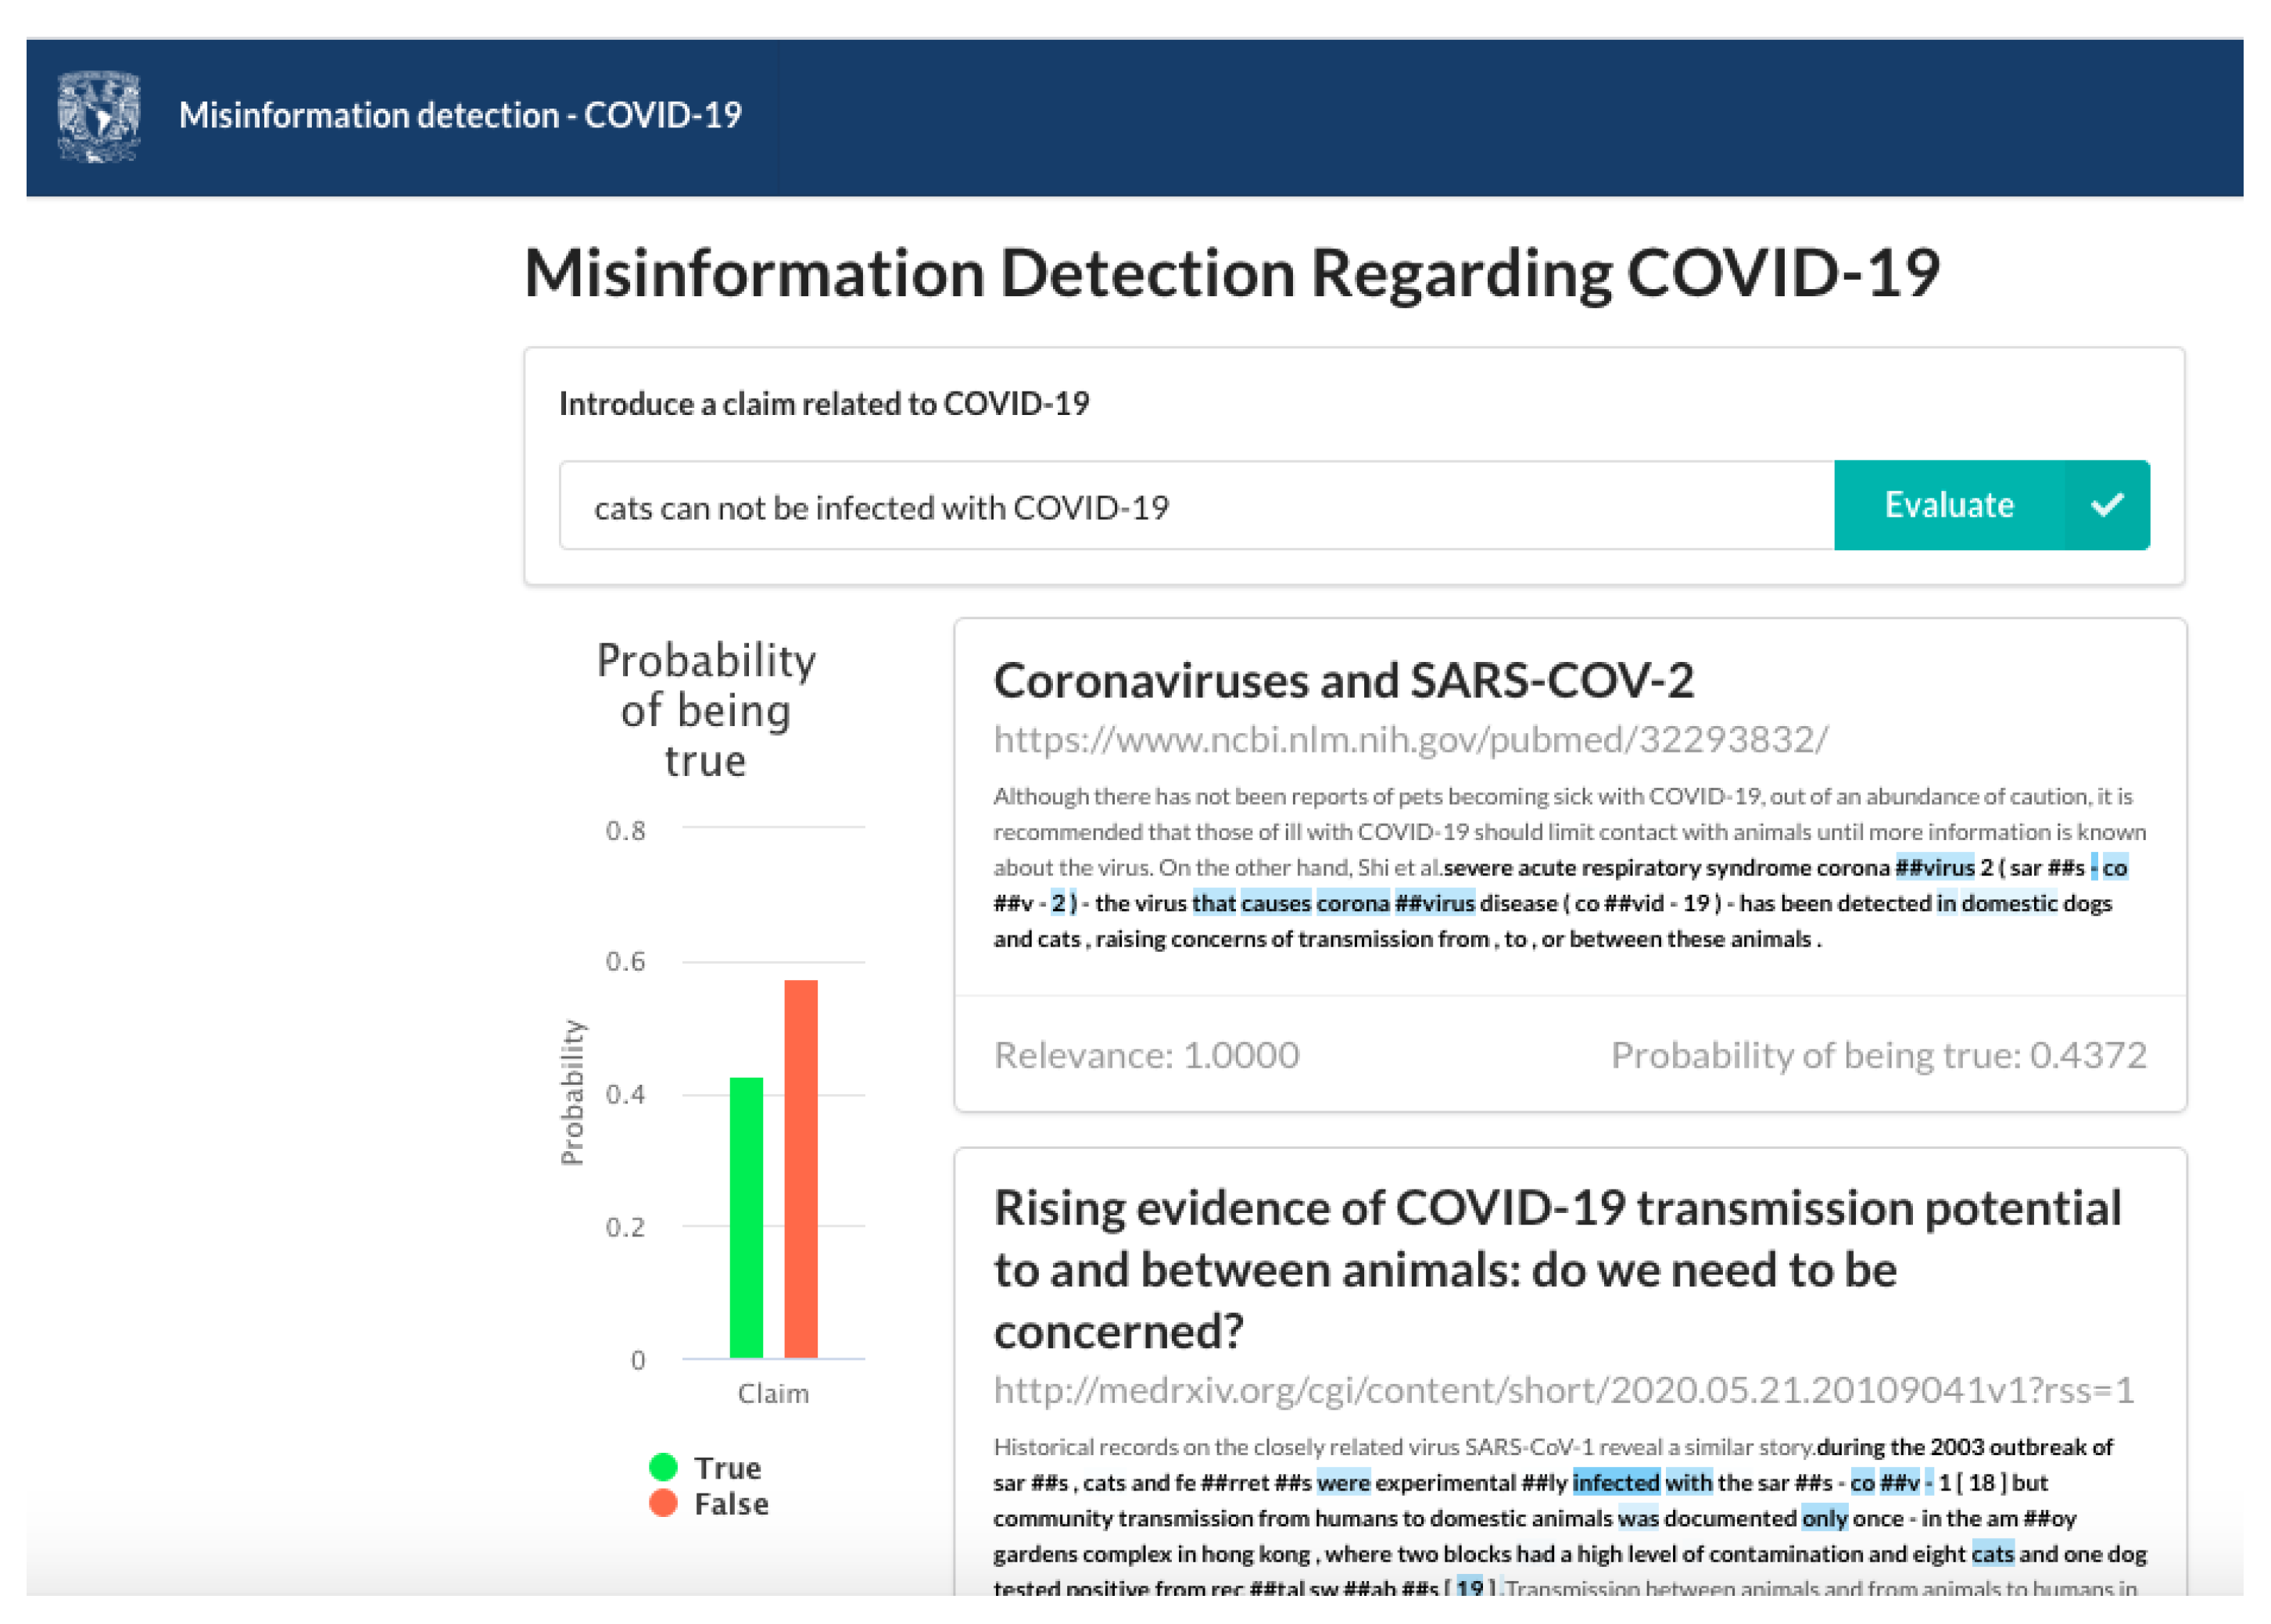
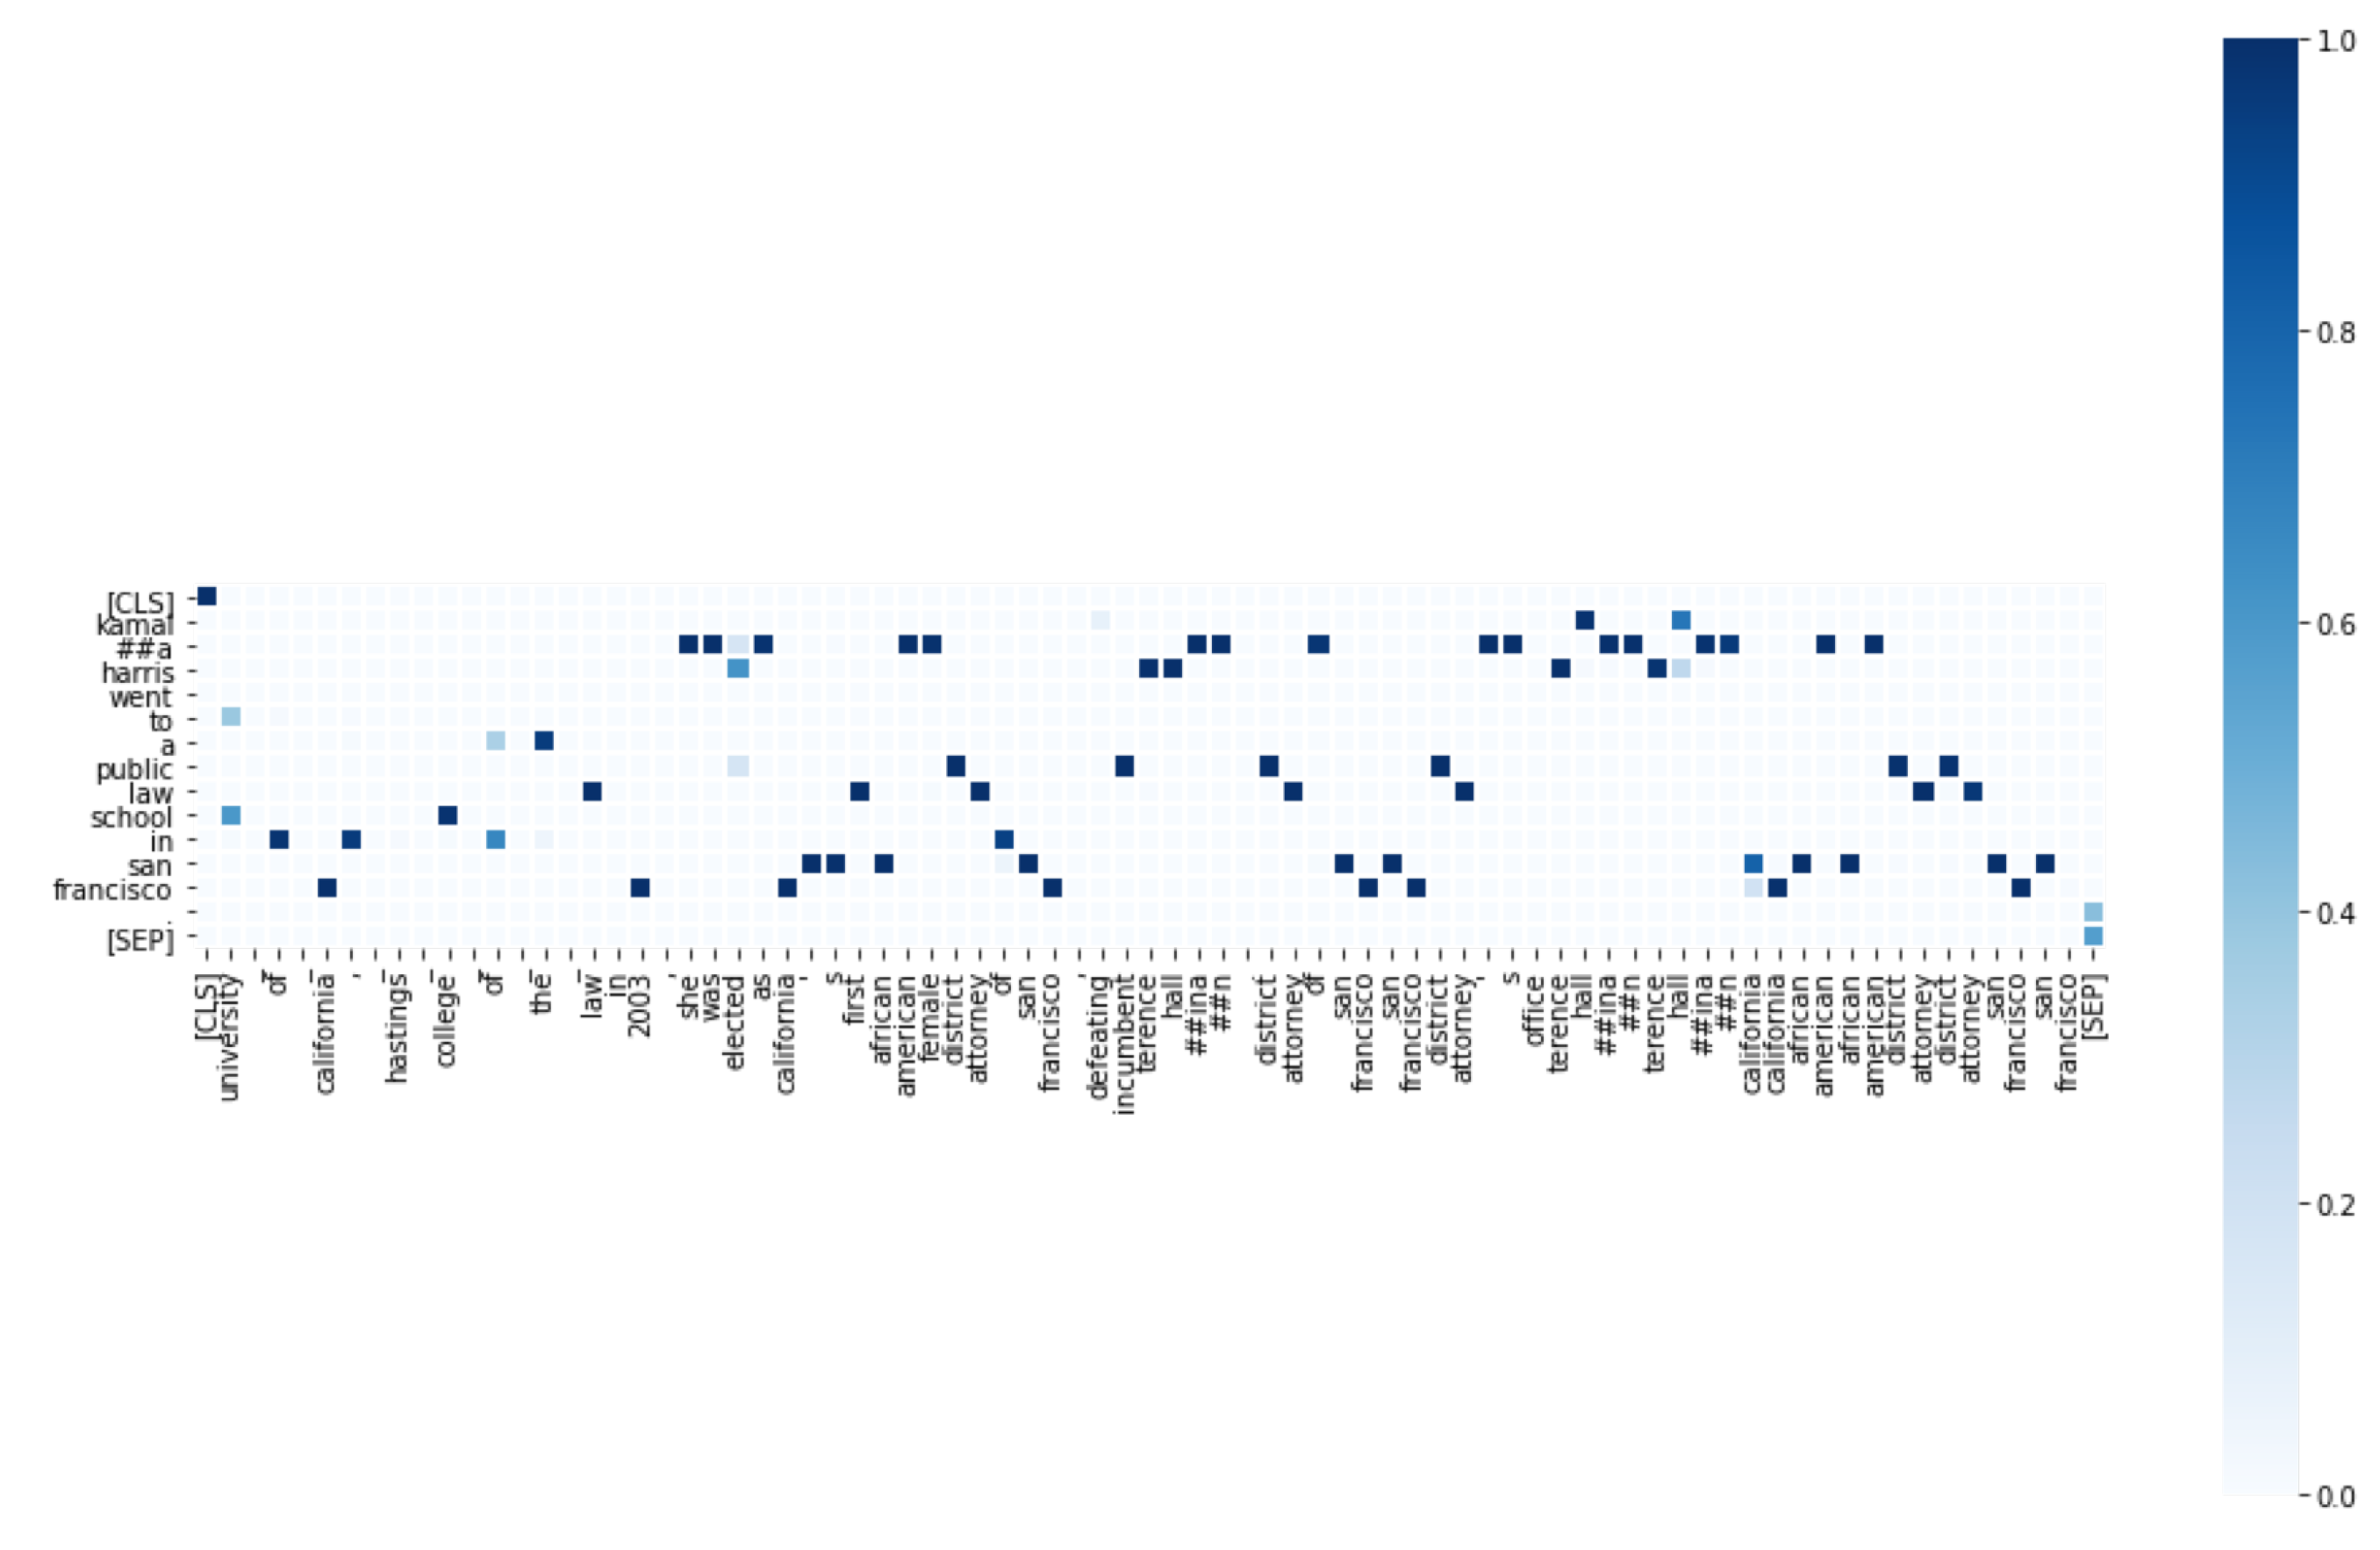
We implemented the model to verify COVID-19 claims with the elements listed above. In order to facilitate user interaction, we created a web interface to verify claims. Figure 7 shows this interface. As an outcome, the model presents evidence found and highlights relevant text spans. This relevance is computed in the attention layer by calculating a matrix of weights between the elements of both input sequences. Each inference process generates a particular weighted matrix for each case. The matrix stores the information on the aspects in which the neural network focuses more, and which ones it leaves aside. Figure 8 and Figure 9 represent the claim–evidence pairs that are evaluated by the model. When evaluating these couples, the calculated attention map is obtained, in which the weightings are reflected. In Figure 8 and Figure 9, it is possible to observe, in broad strokes, which tokens of the evidence the model gives more importance with respect to each token of the affirmation. The importance of the tokens is shown through color coding, with the most important tokens appearing in a deeper shade of blue. The highlighted tokens are the parts of the evidence that are relevant to the verification of the claim. For this reason, the attention map generated is used as an approximation to understand what the model takes into account to decide if a statement is supported, refuted, or without information. Furthermore, the verification model presents a final score, indicating the probability of the claim being true, considering the evidence.
7. Conclusions
In this work, we presented a neural network architecture capable of evaluating the relevance a piece of evidence has about a claim. We focused on the fact-verification task, in particular, the approach composed of three sequential stages. Our proposal is aimed at the second and third stages. This architecture takes advantage of BERT’s capability to create vector representations from texts, but also simplifies evaluation between sequences—in this case, claim and evidence. The attention layer created for this purpose can be used to extract an interpretation from the model.
The importance of interpretation can be observed in the presented case study, where extra information can help final users to understand why a COVID-19 claim is evaluated as supported or refuted. Consequently, this fact-verification tool can decide whether a claim is valid or not using evidence found in scientific articles, but also presents evidence with important text spans highlighted, which is helpful for further informing final users.
Fact-checking models need to consider the evidence’s date of publication. For example, it is possible to find contradictory information in different sources or new information that refutes the original information in scientific articles. For this reason, in future work, we want to increase the weight of the most recent articles in case a contradiction is found in the retrieved pieces of evidence. Fact-checking is also necessary for other domains, such as politics and economy, among others. In these domains, finding reliable sources of information is difficult. So, in future work, it is also necessary to include strategies to evaluate a source’s reliability or generate new sources of reliable information.
Author Contributions
Conceptualization, H.G.-A. and R.C.; methodology, H.G.-A., O.R.-F., V.L.-B. and R.C.; software, O.R.-F. and R.C.; validation, O.R.-F. and R.C. and V.L.-B.; formal analysis, H.G.-A. and V.L.-B.; investigation, H.G.-A., R.C., V.L.-B. and O.R.-F.; resources, H.G.-A. and O.R.-F.; data curation, O.R.-F.; writing—original draft preparation, H.G.-A. and R.C.; writing—review and editing, H.G.-A., O.R.-F. and V.L.-B.; visualization, R.C.; supervision, H.G.-A. and V.L.-B.; project administration, H.G.-A. and V.L.-B.; funding acquisition, H.G.-A. and V.L.-B. All authors have read and agreed to the published version of the manuscript.
Funding
This research was partially funded by SECTEI (Mexican Government) project SECTEI/202/2021, DGAPA-UNAM PAPIIT project numbers TA101722, and CONACYT No. CVU. 997130 scholarship.
Institutional Review Board Statement
Not applicable.
Informed Consent Statement
Not applicable.
Data Availability Statement
Not applicable.
Acknowledgments
The authors thank CONACYT for the computer resources provided through the INAOE Supercomputing Laboratory’s Deep Learning Platform for Language Technologies.
Conflicts of Interest
The authors declare no conflict of interest.
References
- Shu, K.; Sliva, A.; Wang, S.; Tang, J.; Liu, H. Fake News Detection on Social Media: A Data Mining Perspective. ACM SIGKDD Explor. Newsl. 2017, 19, 22–36. [Google Scholar] [CrossRef]
- Potthast, M.; Kiesel, J.; Reinartz, K.; Bevendorff, J.; Stein, B. A Stylometric Inquiry into Hyperpartisan and Fake News. arXiv 2017, arXiv:1702.05638. [Google Scholar]
- Kwon, S.; Cha, M.; Jung, K.; Chen, W.; Wang, Y. Prominent Features of Rumor Propagation in Online Social Media. In Proceedings of the IEEE International Conference on Data Mining, ICDM, Dallas, TX, USA, 7–10 December 2013; pp. 1103–1108. [Google Scholar] [CrossRef]
- Ma, J.; Gao, W.; Wei, Z.; Lu, Y.; Wong, K.F. Detect Rumors Using Time Series of Social Context Information on Microblogging Websites. In Proceedings of the CIKM ’15: Proceedings of the 24th ACM International on Conference on Information and Knowledge Management, Melbourne, Australia, 18–23 October 2015. [Google Scholar] [CrossRef]
- Hassan, N.; Adair, B.; Hamilton, J.; Li, C.; Tremayne, M.; Yang, J.; Yu, C. The Quest to Automate Fact-Checking. Proc. Comput. J. Symp. 2015, 1–5. [Google Scholar]
- Chernyavskiy, A.; Ilvovsky, D. Extract and Aggregate: A Novel Domain-Independent Approach to Factual Data Verification. In Proceedings of the Second Workshop on Fact Extraction and VERification (FEVER), Hong Kong, China, 3–7 November 2019; pp. 69–78. [Google Scholar] [CrossRef] [Green Version]
- Yang, W.; Xie, Y.; Lin, A.; Li, X.; Tan, L.; Xiong, K.; Li, M.; Lin, J. End-to-End Open-Domain Question Answering with BERTserini. arXiv 2019, arXiv:1902.01718. [Google Scholar]
- Thorne, J.; Vlachos, A.; Christodoulopoulos, C.; Mittal, A. FEVER: A large-scale dataset for Fact Extraction and VERification. In Proceedings of the 2018 Conference of the North American Chapter of the Association for Computational Linguistics: Human Language Technologies, New Orleans, LA, USA, 1–6 June 2018. [Google Scholar] [CrossRef] [Green Version]
- Hanselowski, A.; Zhang, H.; Li, Z.; Sorokin, D.; Schiller, B.; Schulz, C.; Gurevych, I. UKP-Athene: Multi-Sentence Textual Entailment for Claim Verification. arXiv 2018, arXiv:1809.01479. [Google Scholar]
- Chen, Q.; Zhu, X.; Ling, Z.H.; Wei, S.; Jiang, H.; Inkpen, D. Enhanced LSTM for Natural Language Inference. In Proceedings of the 55th Annual Meeting of the Association for Computational Linguistics (Volume 1: Long Papers), Vancouver, BC, Canada, 30 July–4 August 2017; pp. 1657–1668. [Google Scholar] [CrossRef] [Green Version]
- Soleimani, A.; Monz, C.; Worring, M. BERT for Evidence Retrieval and Claim Verification; ECIR: Lisboa, Portugal, 2020; pp. 359–366. [Google Scholar] [CrossRef] [Green Version]
- Devlin, J.; Chang, M.W.; Lee, K.; Toutanova, K. BERT: Pre-training of Deep Bidirectional Transformers for Language Understanding. arXiv 2018, arXiv:1810.04805. [Google Scholar]
- Vaswani, A.; Shazeer, N.; Parmar, N.; Uszkoreit, J.; Jones, L.; Gomez, A.; Kaiser, L.; Polosukhin, I. Attention Is All You Need. In Proceedings of the 31st International Conference on Neural Information Processing Systems, Long Beach, CA, USA, 4–9 December 2017. [Google Scholar]
- Clark, K.; Khandelwal, U.; Levy, O.; Manning, C. What Does BERT Look At? An Analysis of BERT’s Attention. In Proceedings of the Second BlackboxNLP Workshop on Analyzing and Interpreting Neural Networks for NLP, Florence, Italy, 1 August 2019; pp. 276–286. [Google Scholar]
- Hochreiter, S.; Schmidhuber, J. Long Short-term Memory. Neural Comput. 1997, 9, 1735–1780. [Google Scholar] [CrossRef]
- Reimers, N.; Gurevych, I. Sentence-BERT: Sentence Embeddings using Siamese BERT-Networks. In Proceedings of the 2019 Conference on Empirical Methods in Natural Language Processing. Association for Computational Linguistics, Hong Kong, China, 3–7 November 2019. [Google Scholar]
- Radford, A.; Wu, J.; Child, R.; Luan, D.; Amodei, D.; Sutskever, I. Language Models are Unsupervised Multitask Learners. OpenAI Blog 2019, 8, 9. [Google Scholar]
- Liu, Y.; Ott, M.; Goyal, N.; Du, J.; Joshi, M.; Chen, D.; Levy, O.; Lewis, M.; Zettlemoyer, L.; Stoyanov, V. RoBERTa: A Robustly Optimized BERT Pretraining Approach. arXiv 2019, arXiv:1907.11692. [Google Scholar]
- Popat, K.; Mukherjee, S.; Yates, A.; Weikum, G. DeClarE: Debunking Fake News and False Claims using Evidence-Aware Deep Learning. arXiv 2018, arXiv:1809.06416. [Google Scholar]
- Wang, L.; Lo, K.; Chandrasekhar, Y.; Reas, R.; Yang, J.; Eide, D.; Funk, K.; Kinney, R.; Liu, Z.; Merrill, W.; et al. CORD-19: The COVID-19 Open Research Dataset. arXiv 2020, arXiv:2004.10706v2. [Google Scholar]
Figure 1.
Fact verification usually is composed of three sequential stages.

Figure 2.
Architecture proposed to evaluate relevance and claim verification.

Figure 3.
Classification layer.

Figure 4.
Baseline implemented with SentenceBERT [16] for the relevance evaluation task. The most similar sentences are retrieved.
Figure 4.
Baseline implemented with SentenceBERT [16] for the relevance evaluation task. The most similar sentences are retrieved.

Figure 5.
Example of evidence with relevant spans highlighted. These spans were highlighted considering the relevance scores computed in the attention layer.
Figure 5.
Example of evidence with relevant spans highlighted. These spans were highlighted considering the relevance scores computed in the attention layer.

Figure 6.
Example of evidence with relevant spans highlighted. These spans were highlighted considering the relevance scores computed in the attention layer.
Figure 6.
Example of evidence with relevant spans highlighted. These spans were highlighted considering the relevance scores computed in the attention layer.

Figure 7.
Web interface to verify claims related to COVID-19.

Figure 8.
Attention map obtained from the model. Corresponds to Figure 5.
Figure 8.
Attention map obtained from the model. Corresponds to Figure 5.

Figure 9.
Attention map obtained from the model. Corresponds to Figure 6.
Figure 9.
Attention map obtained from the model. Corresponds to Figure 6.


Table 1.
Accuracy of the best configurations. Relevance evaluation task.
| Model | Train | Test | |
|---|---|---|---|
| Soleimani 2020 [11] | 0.9298 | 0.8996 | |
| Bert(shared) + Multiplicative + Softmax | R2 | 0.9261 | 0.8892 |
| Bert(shared) + Cosine | R3 | 0.9419 | 0.8858 |
| Bert(shared) Multiplicative + Sigmoid | 0.9241 | 0.8651 | |
| Bert (Shared) + Multiplicative + LSTM-5L | R1 | 0.9322 | 0.8937 |
| Sentence-BERT Baseline | 0.6649 | 0.6553 |
Table 2.
Relevance classification results with a retrieval window of 5 documents.
| Precision@5 | Recall@5 | F1@5 | |
|---|---|---|---|
| Soleimani 2020 [11] | 0.5828 | 0.8504 | 0.6299 |
| Model R1-Bert(shared) + multiplicative + LSTM-5L | 0.4800 | 0.8823 | 0.5503 |
| Model R2-Bert(shared) + multiplicative + AVG | 0.4000 | 0.5900 | 0.4300 |
| Model R3-Bert(shared) + cosine + AVG | 0.4825 | 0.8796 | 0.5519 |
| Sentence BERT-Baseline | 0.3609 | 0.3951 | 0.3652 |
Table 3.
Accuracy of the best configurations. Relevance evaluation task.
| Train | Test | |
|---|---|---|
| Soleimani 2020 [11] | 0.8320 | 0.6576 |
| Bert(shared) + multiplicative + Softmax | 0.8102 | 0.6338 |
| Bert(shared) + multiplicative + LSTM-5L | 0.7620 | 0.5582 |
| SentBert–Roberta(shared) + multiplicative + Softmax | 0.7936 | 0.6378 |
| SentBert–Roberta(shared) + multiplicative + LSTM-5L | 0.7878 | 0.6343 |
| Popat et. al Baseline [19] | 0.5693 | 0.5233 |
Table 4.
Complete method evaluation. Accuracy of final claim classification is reported.
| Relevance | Verification | Accuracy |
|---|---|---|
| Soleimani 2020 [11] | Soleimani 2020 [11] | 0.6889 |
| BERT(shared) + multiplicative + LSTM-5L | SentBert-Roberta(shared) + multiplicative + Softmax | 0.6362 |
| BERT(shared) + multiplicative + LSTM-5L | SentBert-Roberta(shared) + multiplicative + LSTM-5L | 0.6336 |
| BERT(shared) + multiplicative + LSTM-5L | BERT(shared) + multiplicative + Softmax | 0.6356 |
| BERT(shared) + multiplicative + Softmax | SentBert-Roberta(shared) + multiplicative + Softmax | 0.6358 |
| BERT(shared) + multiplicative + Softmax | SentBert-Roberta(shared) + multiplicative + LSTM-5L | 0.6317 |
| BERT(shared) + multiplicative + Softmax | BERT(shared) + multiplicative + Softmax | 0.6330 |
| BERT(shared) + cosine | SentBert-Roberta(shared) + multiplicative + Softmax | 0.6360 |
| BERT(shared) + cosine | SentBert-Roberta(shared) + multiplicative + LSTM-5L | 0.6327 |
| BERT(shared) + cosine | BERT(shared) + multiplicative + Softmax | 0.6352 |
| Sentence-BERT Baseline | Popat et al. Baseline [19] | 0.5233 |
Publisher’s Note: MDPI stays neutral with regard to jurisdictional claims in published maps and institutional affiliations. |
© 2022 by the authors. Licensee MDPI, Basel, Switzerland. This article is an open access article distributed under the terms and conditions of the Creative Commons Attribution (CC BY) license (https://creativecommons.org/licenses/by/4.0/).
Share and Cite
MDPI and ACS Style
Casillas, R.; Gómez-Adorno, H.; Lomas-Barrie, V.; Ramos-Flores, O. Automatic Fact Checking Using an Interpretable Bert-Based Architecture on COVID-19 Claims. Appl. Sci. 2022, 12, 10644. https://doi.org/10.3390/app122010644
AMA Style
Casillas R, Gómez-Adorno H, Lomas-Barrie V, Ramos-Flores O. Automatic Fact Checking Using an Interpretable Bert-Based Architecture on COVID-19 Claims. Applied Sciences. 2022; 12(20):10644. https://doi.org/10.3390/app122010644
Chicago/Turabian StyleCasillas, Ramón, Helena Gómez-Adorno, Victor Lomas-Barrie, and Orlando Ramos-Flores. 2022. "Automatic Fact Checking Using an Interpretable Bert-Based Architecture on COVID-19 Claims" Applied Sciences 12, no. 20: 10644. https://doi.org/10.3390/app122010644
Note that from the first issue of 2016, this journal uses article numbers instead of page numbers. See further details here.