
Food Insufficiency among Job-Loss Households during the Pandemic: The Role of Food Assistance Programs

1
Department of Sociology, University of Central Florida, Orlando, FL 32816, USA
2
Department of Geography and Geospatial Sciences, South Dakota State University, Brookings, SD 57007, USA
3
School of Global Health Management and Informatics, University of Central Florida, Orlando, FL 32816, USA
*
Authors to whom correspondence should be addressed.
Sustainability 2022, 14(22), 15433; https://doi.org/10.3390/su142215433
Submission received: 14 October 2022
/
Revised: 16 November 2022
/
Accepted: 18 November 2022
/
Published: 20 November 2022
(This article belongs to the Section Health, Well-Being and Sustainability)
Abstract
:During the early stages of the pandemic, many households experienced a loss of employment income, which worsened food insecurity and food insufficiency across the United States. This study aimed to examine whether food assistance programs (FAPs) significantly alleviated food insufficiency (FI) among job-loss households during the pandemic. The analysis was conducted with nationally representative survey data (n = 229,668) collected across 50 states and D.C. in 2020. Spatial analysis and logistic regression were applied to analyze the patterns of FI and to assess the Supplemental Nutrition Assistance Program (SNAP), FAPs for children, and community FAPs. Approximately 18.6% of participants faced FI, 41% of whom experienced FI for the first time. SNAP significantly lowered the odds of being food insufficient by 24.5% among households who were already food insufficient before the pandemic and by 11.9% for households with children. FAPs for children slightly reduced FI among households with children, but those who participated in these programs still had higher prevalence of food insufficiency than those who did not. Community FAPs were not effective. The findings suggest increasing the benefit level of SNAP for households with lowest income, strengthening their partnership with community FAPs, and distributing more emergent assistance to the most vulnerable households.
1. Introduction
The COVID-19 pandemic has had severe consequences for the health and well-being of people in the United States and worldwide. For example, the pandemic has substantially increased economic hardship and exacerbated food insecurity and food insufficiency [1,2]. Data from the Household Pulse Survey (hereafter HPS) show that almost 37% of respondents experienced a job loss in the United States in 2020 [3]. Many families have experienced a considerable loss of income because of the unprecedented increase in unemployment, which has worsened food insecurity and food insufficiency across the country [1,4].
Food insecurity refers to limited or uncertain access to the adequate, safe, and nutritious food required to maintain an active and healthy life [5]. Food insufficiency describes the way in which households sometimes or often do not have enough food to eat [6,7,8]. As a result, food insufficiency is often considered a more severe form of food insecurity due to its focus on undernutrition (not having enough to eat) while food insecurity includes both malnutrition (not being able to eat a balanced meal) and undernutrition. HPS used a single food sufficiency survey question, instead of the full food security survey module, in order to collect near real-time data during the pandemic [8].
Feeding America estimated that food insecurity reached record levels in the United States in 2020 to approximately 45 million (or one out of seven) Americans, an increase from approximately 37 million Americans prior to the pandemic [9]. A substantial number of households have become food insecure for the first time, while previously low-income food-insecure households have experienced more serious food hardship [1,10,11]. Socioeconomic disparities in food insecurity widely existed prior to the COVID-19 crisis [12]. Rates of food insecurity were greater for the following demographic groups: older individuals, women, racial and/or ethnic minorities, low-income households, households with lower levels of education, and households with children [13]. The COVID-19 crisis has worsened many of these inequalities by making vulnerable households’ food insecurity coping strategies more difficult. For example, patronizing multiple stores to look for the most affordable food, group shopping trips, and sharing membership to club stores and meals with neighbors and family all increase interactions with others and the risk of contacting the disease [12,14].
The U.S. government has implemented a series of food assistance programs for improving low-income Americans’ food security and reducing hunger [15]. The Supplemental Nutrition Assistance Program (SNAP) was designed to alleviate food insecurity and poverty [15,16]. Other federal programs target more specific populations, for example the Special Supplemental Nutrition Program for Women, Infants, and Children for pregnant, breastfeeding and postpartum women, and infants and children up to five years old. The National School Lunch Program (NSLP) and School Breakfast Program (SBP) provided approximately 45 million low-cost or free breakfasts and lunches daily for low-income school children in 2019 [14]. In addition to the federal programs, community food assistance programs such as food banks, soup kitchens, and religious organizations have also helped families in need [17]. In 2015, food banks already served an estimated 46 million Americans [17]. There has been extensive research examining the effectiveness of food assistance programs on reducing food insecurity, but the findings have been inconsistent [16]. For instance, some studies have found no association between SNAP participation and food security [18,19], whereas others have suggested that SNAP participants have higher [19,20] or lower odds of being food insecure for adults [12,21,22,23,24]. The inconsistency has raised scholars’ concerns over the selection bias [16]. In other words, among eligible households and families, those who participate in the program may be different than those who do not in unmeasured characteristics, which would bias potential estimates of the program’s impact on outcomes of interest.
Providing food assistance has become more challenging because of the extraordinary rise in demand for food assistance, physical distancing efforts, and other cascading effects of the COVID-19 crisis [4,15]. Federal food assistance programs have served as important safety nets for many families during the pandemic. For example, Congress authorized all states to offer the maximum SNAP benefit level to eligible households via emergency allotments if the federal government and states had declared a public health or disaster emergency [25]. School meal programs are essential for improving low-income children’s nutrient intake and their households’ food security [26]. However, school closures and other COVID-19 prevention strategies have made it extremely difficult for children in need to access these meals [27,28]. In addition, food banks have been overwhelmed due to the surge in demand and simultaneous decrease in the amount of donated food, particularly fresh produce and meat [4].
As a result of the pandemic, millions of Americans have lost their job, with the unemployment rate increasing from 3.5% in February to 6.7% in the fourth quarter of 2020 [29,30]. Job losses have put many families at high risk of food insufficiency or have further worsened their pre-existing food insufficiency [31]. There is still much to learn about food insufficiency among job-loss families and the role of food assistance programs in the context of the global pandemic. To better improve food sufficiency, a thorough understanding of the reasons for food hardships and people’s responses to food assistance programs is urgently needed [4,24]. This study aims to fill this gap by examining the effects of federal and community food assistance programs in improving the food sufficiency of job-loss families during the pandemic. Three hypotheses are proposed: during the pandemic, (1) SNAP has alleviated the food insufficiency of job-loss households who have experienced a loss of employment income; (2) programs providing food assistance for children have reduced the food insufficiency of job-loss households; and (3) community-based food assistance programs have reduced the food insufficiency of job-loss households.
2. Materials and Methods
2.1. Study Design, Settings, and Participants
This study used nationally representative data from the Household Pulse Survey to examine whether food assistance programs have effectively reduced food insufficiency among job-loss households. This survey was created and conducted by the U.S. Census Bureau, Department of Agriculture (USDA), Bureau of Labor Statistics, National Center for Health Statistics, National Center for Education Statistics, and Department of Housing and Urban Development. The Census Bureau’s Master Address File was used as the source to select a systematic sample from all eligible household units across 66 areas, including 50 states, D.C., and 15 metro areas [1]. The survey questionnaires were delivered online using Qualtrics as the data collection platform [1]. The Institutional Review Board of the authors’ institution determined that this is not research involving human subjects as defined by DHHS and FDA regulations and, therefore, this study was exempt from IRB review and approval.
The survey collects data from all 50 states and D.C. since 23 April 2020 by the U.S. Census Bureau [3]. This study used data collected from 19 August to 21 December 2020 (weeks 13 to 21). Phase 1 data (23 April–21 July 2020) as well as Phases 3–3.1 data (6 January 2021–5 July 2022) were excluded due to a lack of households’ SNAP utilization data and/or pre-pandemic food sufficiency information. During weeks 13 to 21, a total of 299,301 households experienced a job loss during the pandemic. More specifically, the participants were included in analysis if they answered yes to the survey question “Have you, or has anyone in your household (born before 2002) experienced a loss of employment income since 13 March 2020”?
Individual-level survey data include food insufficiency, participation in SNAP, and resources for receiving free food at no cost, as well as socio-demographic factors such as age, gender, race, ethnicity, education, income, and number of children. After removing those with missing data such as food sufficiency, participation in SNAP, having received free food at no cost from programs aimed at children or community-based programs, and income data, the analytical sample totaled 229,668 participants. Missing data in social science datasets is a common problem [32] which might affect the results of statistical analyses if there are over 10% missing cases [33,34]. The samples with missing data (n = 299,301) and without missing data (n = 229,668) were compared (Table 1). Generally, the respondents included in analysis are older (48.4 vs. 47.8) with higher percentages of White (80.5% vs. 78.9%) and non-Hispanic populations (89.1% vs. 88.1%), higher education level (5.2 vs. 5.1), and fewer children (0.74 vs. 0.79) compared to all 299,301 respondents. The gender compositions (39.8% vs. 39.7% of male) are similar between two datasets while we were unable to compare the difference in income levels due to missing values. According to Rubin’s classification on missing data, the data are missing at random (MAR) in our study because the probability to be included relates to some known property [33], namely respondents’ socio-demographics. Following some recent studies which used HPS data [1,6,7], we applied the listwise deletion method and included the respondents with complete data in analysis. To address any potential nonresponse bias, the HPS recommended sampling weight was applied to all analyses in this study to reflect the representative proportion in the U.S. population [1,6,35]. In addition, a power analysis was performed for the logistic regression analysis with the equation given by Hsieh, Bloch, and Larsen [36]. With a statistical power of 0.9 and a significance level of 0.05, the derived minimum sample size is 521. Therefore, the sample used for statistical analysis is sufficiently large to test the hypotheses. The state boundary file for data analysis and mapping was obtained from the U.S. Census Bureau website.
2.2. Measures
Table 2 summarizes the variables. The dependent variable is household food insufficiency, measured by a 4-point Likert scale question, “In the past 7 days, which of these statements best describes the food eaten in your household?” A binary variable was created, coded as 1 if the participant answered “Sometimes not enough to eat” or “Often not enough to eat,” and coded as 0 if they had enough food to eat. This measure has been widely used to investigate food insecurity and food insufficiency during the pandemic [1,6,35,36,37,38]. As part of the full food security survey module, the food insufficiency question has been validated at the household level [8,38]. According to recent USDA data, food insufficiency and food insecurity significantly overlap as the majority of food secure households are also classified as food sufficient [8].
There are three independent variables reflecting a household’s utilization of food assistance programs. (1) SNAP participation was measured by a yes or no question, “Do you or does anyone in your household receive benefits from the Supplemental Nutrition Assistance Program (SNAP) or the Food Stamp Program?” A participant was coded as 1 if they answered “yes” and coded as 0 if they reported not receiving SNAP benefits. (2) The receipt or not of free food from school and children’s programs was reflected by a multiple-choice question, “Where did you get free groceries or free meals?”. A participant was coded as 1 if they chose “Free meals through the school or other programs aimed at children” but coded as 0 if they did not choose this answer. (3) The utilization of community-based programs was measured by the same question. The participant was coded as 1 if they selected a food pantry or food bank, home delivered service such as Meals on Wheels, church, synagogue, temple, mosque, or other religious organization, shelter, or soup kitchen, or other community program, whereas they were coded as 0 if they did not select any of these answers. The three sources of assistance are not mutually exclusive as a participant could have participated in SNAP and also received free food from the other two programs.
The following socio-demographic factors are highly associated with households’ food insufficiency: age, gender, race/ethnicity, education, household income, and the number of children under 18-years old [1,13] (Table 3, Appendix A). Therefore, the participant’s age, gender, race/ethnicity, education, and the household’s income, presence of children or not, and food insufficiency before the pandemic are included as control variables. Educational attainment is an ordinal variable ranging from 1 to 7, indicating less than high school, some high school, high school graduate or equivalent, some college, associate degree, bachelor’s degree, and graduate degree. Household income level is an ordinal variable ranging from 1 to 8, indicating pre-tax household income of less than $25,000, $25,000–$34,999, $35,000–$49,999, $50,000–$74,999, $75,000–$99,999, $100,000–$149,999, $150,000–$199,999, and $200,000 and above, respectively.
2.3. Spatial and Statistical Analysis
Spatial analysis was used in ArcGIS Pro 2.8 to visualize the food insufficiency patterns across the United States before and during the pandemic. We used logistic regression in SPSS 28 to examine the effectiveness of SNAP, food programs aimed at children, and community-based programs on alleviating food insufficiency among job-loss families (Model 1, n = 229,668). We also ran logistic regression models with subsets of the sample to further understand the effectiveness of these food assistance programs among two socioeconomically vulnerable populations. Because many households were already food insecure before the pandemic, Model 2 restricted the analytical sample to these participants (n = 20,964) and excluded those who have faced food insufficiency for the first time and those who have not experienced food insufficiency. The subsample was selected based on a survey question, “Which of these statements best describes the food eaten in your household before 13 March 2020?” The households were included in Model 2 if they answered, “Sometimes not enough to eat” or “Often not enough to eat”. In addition, households with children have a high rate of food insecurity [13]. Model 3 (n = 91,031) focused on households with children to thoroughly examine the effectiveness of food assistance programs, particularly those aimed at children.
3. Results
3.1. Descriptions of Food-Insufficient Households and Preditor Variables
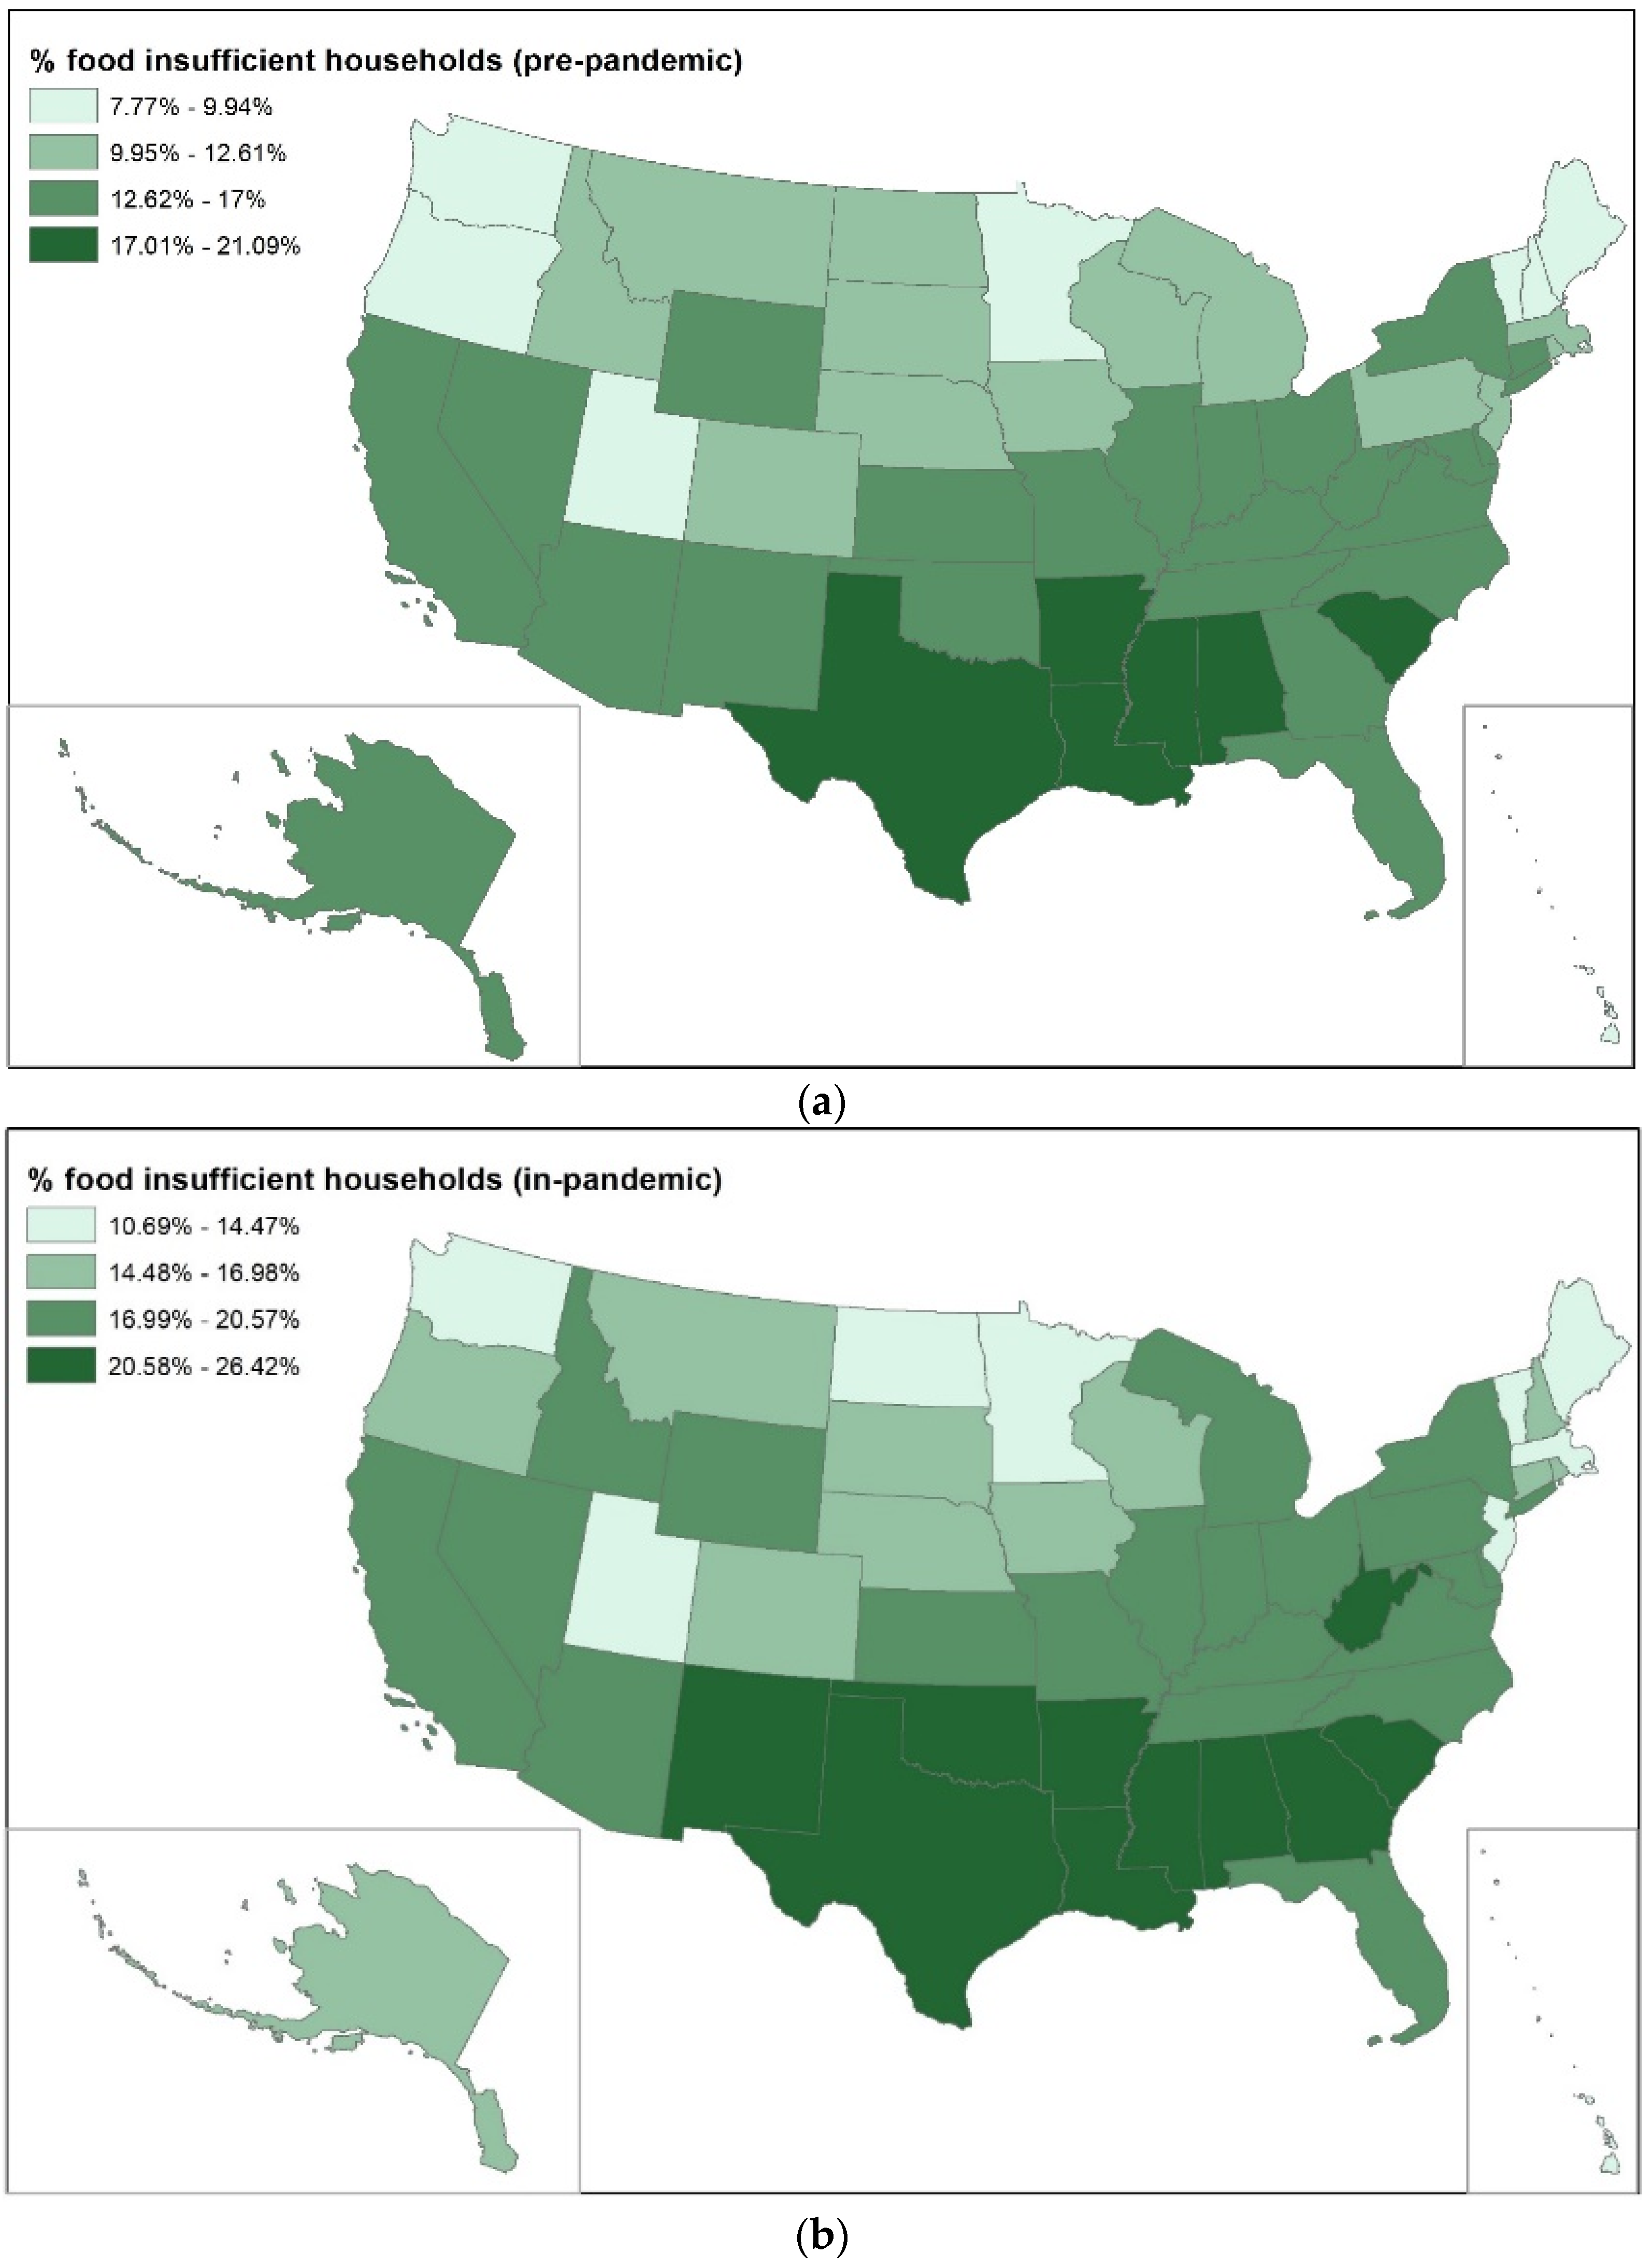
Among participants who or whose family members have experienced a job loss, 18.6% have experienced food insufficiency during the pandemic (Table 2), 41% of whom have experienced food insufficiency for the first time. Food insufficiency rates increased across all socio-demographic groups in the pandemic (Table 3). The percentages of food insufficient households were much higher among Black (29.3%) and Hispanic (24.8%) households compared to White (16.4%) and non-Hispanic households (17.3%). Households with children had a higher rate than those without children (22.6% vs. 15.9%). The proportion of pre-pandemic and in-pandemic food-insufficient households displays similar patterns across states (Figure 1), with several southern states (Alabama, Arkansas, Louisiana, Mississippi, South Carolina, and Texas) maintaining the highest proportion of food-insufficient households. The proportion of food-insufficient households rose across all states during the pandemic, among which Arizona, Georgia, Idaho, Kentucky, Oklahoma, and West Virginia increased most sharply, over 6.5% higher than pre-pandemic levels.
Approximately 15.7% of households in the sample have received SNAP benefits, 34.8% of whom were food insufficient during the pandemic. Additionally, 12.6% of households have received free meals or free groceries, including 7.5% from community-based programs and 5.1% from the school or other programs aimed at children (Table 2). At the time of the survey, the participants were between 18 and 88 years old (mean 46) and included 47.8% of men and 52.2% of women, 75% White, 13.4% Black, 4.7% Asian and 6.9% other race or race in combination, as well as 17.6% Hispanic and 82.4% non-Hispanic (Table 2).
3.2. Results of Logistic Regression Models
Table 4 presents the estimates from the logistic regression models. Participation in the SNAP program shows inconsistent associations with food insufficiency for job-loss households across the three models (odds ratio [OR] = 1.107, p < 0.001, 95% CI 1.106, 1.108; OR = 0.755, p < 0.001, 95% CI 0.754, 0.756; OR = 0.881, p < 0.001, 95% CI 0.88, 0.882). The results suggest that households who received SNAP benefits are more likely to be food insufficient during the pandemic generally (Model 1). However, receiving benefits from the SNAP program significantly reduces the odds of being food insufficient by 24.5% for households who were already food insufficient before the pandemic and by 11.9% for households with children.
The findings on the assistance programs aimed at children vary among the three models as well. Among households with children, those who have received free food from school and children’s programs are more likely to be food insufficient during the pandemic (OR = 1.077, p < 0.001, 95% CI 1.075, 1.079). While in Models 1 and 2, the assistance programs aimed at children have slightly alleviated food insufficiency by 0.7% (OR = 0.993, p < 0.001, 95% CI 0.991, 0.994) among all households and by 9.4% (OR = 0.906, p < 0.001, 95% CI 0.904, 0.909) for households who were already food insufficient before the pandemic.
The findings on community-based programs are relatively consistent among the three models. Households who have received free food from community food programs (e.g., food pantry or food bank) are more likely to be food insufficient during the pandemic in all three models (OR = 1.309, p < 0.001, 95% CI 1.307, 1.31; OR = 1.07, p < 0.001, 95% CI 1.067, 1.072; OR = 1.23, p < 0.001, 95% CI 1.228, 1.232).
There are substantial differences in food insufficiency by individual and households’ social and demographic characteristics. In general, participants’ households are more likely to be food insufficient if they are young (OR = 0.985, p < 0.001, 95% CI 0.985, 0.985), female (OR = 1.091, p < 0.001, 95% CI 1.09, 1.092), Black (OR = 1.125, p < 0.001, 95% CI 1.123, 1.126), or other races (OR = 1.158, p < 0.001, 95% CI 1.156, 1.159), or have low educational attainment (OR = 0.895, p < 0.001, 95% CI 0.895, 0.895). In addition, lower income households (OR = 0.774, p < 0.001, 95% CI 0.774, 0.775) or households with children (OR = 1.136, p < 0.001, 95% CI 1.135, 1.137) are more likely to be food insufficient. Food insufficiency before the pandemic is the strongest predictor (OR = 26.869, p < 0.001, 95% CI 26.869, 26.915) of the dependent variable.
4. Discussion
The main goal of the current study was to analyze job-loss households’ food hardship and examine the effectiveness of food assistance programs on alleviating food insufficiency during the COVID-19 crisis.
The results partially support the first hypothesis on the effectiveness of SNAP. SNAP participation has significantly alleviated food insufficiency for job-loss households who were already food insufficient before the pandemic and households with children. However, we did not find evidence that this program is also effective for those who first became food insufficient during the pandemic. These findings can be explained by the following aspects, which also echo several recent studies [39,40,41].
First, some job-loss households are not eligible for SNAP whereas other eligible households may not participate in the program [39,40]. To receive SNAP benefits, households must meet certain requirements including income and assets limits [42]. Generally, the household’s gross income should be lower than 130% of the poverty line and total assets should be less than $2500, while some states increased the income threshold up to 200% of the poverty line and waived the asset limit [43]. For SNAP households, the unemployment benefits are counted as unearned income and, therefore, receiving these benefits might have made some households no longer eligible for SNAP benefits [43]. The $600/week unemployment benefit which was extended until December 2020 has significantly reduced food insufficiency among households who lost employment income during the pandemic [44]. Our data show that only 26.5% of first-time food-insufficient households have received benefits from SNAP. Second, the existing SNAP benefits are not sufficient for all current recipients to cope with increased food prices and exacerbated economic hardship, and therefore, the most vulnerable households with the lowest income have remained food insecure [39,40,41,42]. Congress temporarily increased SNAP benefits from April to December 2021, over one year after the pandemic began [45]. Third, barriers to food access other than economic hardship have also intensified food insufficiency during the pandemic. Among all participants, 39.4% (90,577) did not get sufficient food or what they wanted to eat because they could not or were afraid to go out due to transportation, mobility, or health problems or because they could not get groceries or meals delivered to them. Although the USDA has launched the SNAP online purchase pilot, the benefits can only be used to purchase eligible food from a few grocers in 2020 although more retailers have been added to the SNAP online purchasing in recent two years [46]. For example, only Sam’s Club Scan and Go, Amazon, and Walmart accept payment online in Louisiana while Alaska has yet to begin this program [46]. In addition, SNAP recipients cannot pay delivery fees and other associated charges with the SNAP benefits [46], which the household may not be able to afford to pay. The inflexibility of using SNAP benefits may have created new barriers for vulnerable households [41].
Turning to the second hypothesis, the analysis shows that food programs for children have slightly reduced food insufficiency among all job-loss households and among households that were already food insufficient before the pandemic. However, when focusing on households with children, we found that those who have participated in these programs tend to be more food insufficient compared with those who have not received free food from these programs. Some early studies have demonstrated that participation in school-based food programs (i.e., NSLP and SBP) has improved students’ nutrition and lowered food insecurity and food insufficiency for households with children [47,48,49]. However, the analysis in this study also shows unexpected findings (Model 3) which align with some recent studies [50,51,52]. There are two possible explanations for the results. First, school-based and other food programs for children provide free meals or food for children from low-income families [50]. For example, children are eligible for free school meals if their households have incomes below 130% of the poverty line [53]. It is not surprising that these low-income households are more likely to be food insufficient.
Second, school closures and physical distancing approaches during the early stage of the pandemic disrupted children’s access to food assistance resources, particularly school meals [11,54]. Though some schools provided meal pickup, many parents and caregivers could not leave from work in the middle of the day to pick up meals at a designated site [55]. According to a Food Research and Action Center report, the school lunch participation rate had dropped by 30% in the 2020–2021 school year compared to the 2018–2019 school year [56]. Therefore, the virtual schooling and physical distancing recommendations may have greatly reduced the effectiveness of food assistance programs aimed at children in improving low-income households’ food security and food sufficiency during the pandemic due to their inability to reach these children in need. In addition, food insecurity rates have risen to record levels among households with children during the pandemic [57]. Food assistance programs for children might not be capable of providing sufficient amounts of food for all children in need, although these programs have reduced the degree of food insufficiency among households with children to some extent. Based on an estimate of national data, receiving free or low-cost school lunches can alleviate 3.8% of food insecurity [58]. However, children depending on school meals have become more vulnerable to food insecurity and food insufficiency because of remote schooling [54]. Comparing the pre-pandemic era with our study period (August to December 2020), food insufficiency rates increased more sharply for households who received free or low-cost food from school or other food programs for children (20.2% to 27.1%) than for those who did not participate in these programs (17.2% to 22%).
The results do not support the third hypothesis. The literature on the association of food insufficiency and utilization of community-based food assistance programs is inconsistent. Some research stresses that community-based programs (e.g., food banks, food pantries, and soup kitchens) have played an important role in combating food insecurity and food insufficiency by offering immediate solutions to severe food hardships [4,59,60]. While our findings are in line with studies suggesting that people who used community-based food programs are more likely to be food insecure/insufficient [61,62]. The users of community-based food programs usually have significantly lower income compared with those who did not use these programs [62]. Therefore, it is challenging to assess the effects of food programs on improving food security/sufficiency because of the selection bias. Namely, the substantial differences between program users and non-users may mask the positive effects of food assistance programs [63]. Undoubtedly, these community programs have effectively bridged the food security gap to meet the emergent needs of the vulnerable population [60]. Regional and local food pantries, soup kitchens, and shelters, among others, have partnered with the USDA and delivered almost 174 million food boxes to disadvantaged Americans in this period [4,64].
It is also worth mentioning the spatial inequalities of food insufficiency among states. A dozen states maintain very high rates of food insufficiency, or their proportions of food insufficient households have risen significantly during the pandemic. Most of these states have lower income levels (average median household income (MHHI) $52,617) but higher poverty rates (average 15.3%) compared with the national MHHI ($67,521) and poverty rate (11.4%). A substantial number of households have suffered income loss or reduction and food hardship; however, the percentages of job-loss households participating in food assistance programs are similar to, and even lower than, the national average levels, with 16.9% participating in SNAP and 4.8% and 7.2% receiving free food from programs aimed at children and community-based programs respectively in these states. According to USDA data [65], the percentages of eligible people who participated in SNAP were lower in these states (81.3%) compared to the national average (84%). Also, given that community-based food programs rely heavily on donations [66], the economically disadvantaged states may have limited capacity for these programs. These comparisons raise the critical issue of how to equitably provide and distribute emergent food assistance to low-income states in order to combat food insecurity and food insufficiency more efficiently during a crisis, which merits a more thorough investigation.
This study has some limitations. First, we were only able to understand the pattern of job-loss households’ food insufficiency and their utilizations of food assistance programs from August to December 2020 while unable to investigate the trend from March to July 2020 and in 2021 and 2022 because of a lack of data. Second, the effectiveness of federal food assistance programs in alleviating food insufficiency might be underestimated given that low-income food insecure households are more likely to be eligible for and participate in these programs. In addition, due to the data limitations, it is difficult to measure the influence of receiving unemployment benefits on households’ eligibility to apply for SNAP and the degree of food insufficiency reduced by the school and other food programs for children. These all might have caused the effectiveness of federal food assistance programs to be underestimated. Thirdly, food insufficiency has been exacerbated due to additional barriers other than economic hardship, such as transportation and psychological issues. In future studies, a survey that incorporates these factors will be designed and conducted to provide thorough insights.
5. Conclusions
Using nationally representative survey data, this research analyzed food insufficiency among job-loss households during the early stages of the pandemic and examined the role of food assistance programs in reducing their food hardship. We found that SNAP significantly reduced the odds of being food insufficient for households who were already food insufficient prior to the pandemic and for households with children. Food programs for children slightly lowered food insufficiency among households with children, but those who have participated in these programs still had a higher prevalence of food insufficiency than those who have not. In addition, community food assistance programs were not effective.
This study has potential policy implications. First, the findings suggest the government lower the access barriers to federal food assistance programs for those households who were food insufficient but ineligible for these programs and increase the benefits more rapidly to provide emergent assistance for those most vulnerable households during a global crisis.
Second, given the flexibility of community-based food programs, the results suggest policy makers further strengthen the partnership between federal and community-based programs to make food assistance accessible and available for all households in need. During the pandemic, many people, particularly those senior and disabled people, could not or were afraid to go out to purchase food due to transportation, mobility, or health problems [3]. While the SNAP benefits do not pay for delivery fees and other associated charges [46]. The federal food assistance programs (e.g., SNAP) have partnered with Feeding America’s network, including food pantries and meal programs, to provide meals for those in need [8]. The partnership between federal and community-based programs could be further expanded and strengthened to provide and deliver free meals for more food insufficient households, especially for senior and disabled people.
Thirdly, considering the socioeconomic disparities between socio-demographic groups and among regions and states, it is necessary to allocate more federal resources to support vulnerable households across the country, particularly those in economically disadvantaged states. Governments could use both traditional and social media to broadly advertise food assistance programs to increase the participation rates among eligible households. The federal food assistance programs could distribute more resources to improve the capacity of community-based programs in economically disadvantaged states.
Author Contributions
Conceptualization, Y.L.; methodology, Y.L.; validation, D.L. and C.K.; formal analysis, Y.L.; investigation, Y.L.; resources, Y.L.; data curation, Y.L.; writing—original draft preparation, Y.L.; writing—review and editing, Y.L., D.L. and C.K.; visualization, Y.L. All authors have read and agreed to the published version of the manuscript.
Funding
This research received no external funding.
Institutional Review Board Statement
The Institutional Review Board of the University of Central Florida determined that the proposed activity is not research involving human subjects as defined by DHHS and FDA regulations. IRB review and approval by this organization are not required.
Informed Consent Statement
Not applicable.
Data Availability Statement
Data used in this study were downloaded from: https://www.census.gov/programs-surveys/household-pulse-survey/datasets.html (accessed on 15 June 2021).
Conflicts of Interest
The authors declare no conflict of interest.
Appendix A

Table A1.
Summary of socio-demographic information among food insufficient households and food sufficient households.
Table A1.
Summary of socio-demographic information among food insufficient households and food sufficient households.
| Demographics | Food Insufficient Households | Food Sufficient Households | |
|---|---|---|---|
| Gender | Male | 46.3% | 48.1% |
| Female | 53.7% | 51.9% | |
| Race | White | 65.9% | 77.1% |
| Black | 21.2% | 11.7% | |
| Asian | 3.1% | 5.1% | |
| Other races | 9.9% | 6.2% | |
| Ethnicity | Hispanic | 23.5% | 16.30% |
| Non-Hispanic | 76.50% | 83.7% | |
| Age | Mean/Standard Deviation | 42.3/13.6 | 46.8/15.4 |
| Minimum, Maximum | 18, 88 | 18, 88 | |
| Education | Mean/Standard Deviation | 3.6/1.4 | 4.5/1.6 |
| Minimum, Maximum | 1, 7 | 1, 7 | |
| Income | Mean/Standard Deviation | 2.5/1.6 | 4.1/2 |
| Minimum, Maximum | 1, 8 | 1, 8 | |
| Children | Mean/Standard Deviation | 1/1.3 | 0.7/1.1 |
| Minimum, Maximum | 0, 5 | 0, 5 |
Note: all descriptive statistics and percentages were calculated with weighted data to reflect the representative proportion in the target U.S. population.
References
- Morales, D.; Morales, S.; Beltran, T. Racial/ethnic disparities in household food insecurity. J. Racial Ethn. 2021, 8, 1300–1314. [Google Scholar]
- Hao, F.; Shao, W.; Huang, W. Understanding the influence of contextual factors and individual social capital on American public mask wearing in response to COVID-19. Health Place 2021, 68, 102537. [Google Scholar] [CrossRef]
- U.S. Census Bureau. Household Pulse Survey Data Tables. Available online: https://www.census.gov/programs-surveys/household-pulse-survey/data.html (accessed on 3 March 2022).
- Blackmon, L.; Chan, R.; Carbral, O.; Chintapally, G.; Dhara, S.; Felix, P.; Jagdish, A.; Konakalla, S.; Labana, J.; Mcllvain, J.; et al. Rapid development of a decision support system to alleviate food insecurity at the Los Angeles regional food bank amid the COVID-19 pandemic. Prod. Oper. Manag. 2021, 30, 3391–3407. [Google Scholar] [CrossRef]
- Coleman-Jensen, A.; Rabbitt, M.; Gregory, C.; Singh, A. Household Food Security in the United States in 2018. U.S. Department of Agriculture. ERR-270. September 2019. Available online: https://www.ers.usda.gov/webdocs/publications/94849/err-270.pdf?v=963.1 (accessed on 20 April 2022).
- Blumenberg, E.; Pinski, M.; Nhan, L.A.; Wang, M.C. Regional differences in the impact of the COVID-19 pandemic on food sufficiency in California, April–July 2020: Implications for food programmes and policies. Public Health Nutr. 2021, 24, 3442–3450. [Google Scholar] [CrossRef]
- Nagata, J.M.; Ganson, K.T.; Whittle, H.J.; Chu, J.; Harris, O.O.; Tsai, A.C.; Weiser, S.D. Food insufficiency and mental health in the U.S. during the COVID-19 pandemic. Am. J. Prev. Med. 2021, 60, 453–461. [Google Scholar] [CrossRef]
- U.S. Department of Agriculture. Measurement. Available online: https://www.ers.usda.gov/topics/food-nutrition-assistance/food-security-in-the-u-s/measurement/#insufficiency (accessed on 13 April 2022).
- Feeding America. The Impact of the Coronavirus on Local Food Insecurity in 2020 & 2021. Available online: https://www.feedingamerica.org/sites/default/files/2021-03/Local%20Projections%20Brief_3.31.2021.pdf (accessed on 8 March 2022).
- Field, S. “Record Levels” of Food Insecurity in the U.S. Because of COVID-19. Available online: https://www.marketplace.org/2020/05/22/record-levels-of-food-insecurity-in-the-u-s-because-of-covid-19/ (accessed on 15 July 2021).
- Wolfson, J.; Leung, C. Food insecurity during COVID-19: An acute crisis with long-term health implications. Am. J. Public Health 2020, 110, 1763–1765. [Google Scholar] [CrossRef]
- Fitzpatrick, K.; Harris, C.; Drawve, G. Assessing food insecurity among US adults during the COVID-19 pandemic. J. Hunger Environ. Nutr. 2021, 16, 1–18. [Google Scholar] [CrossRef]
- Gundersen, C. Food insecurity is an ongoing national concern. Adv. Nutr. 2013, 4, 36–41. [Google Scholar] [CrossRef] [Green Version]
- Kinsey, E.; Hecht, A.; Dunn, C.G.; Levi, R.; Read, M.A.; Smith, C.; Niesen, P.; Seligman, H.K.; Hager, E.R. School closures during COVID-19: Opportunities for innovation in meal service. Am. J. Prev. Med. 2020, 110, 1635–1643. [Google Scholar] [CrossRef] [PubMed]
- Esobi, I.; Lasode, M.; Anyanwu, C.; Barriguete, M.O.F.; Okorie, M.A.; Lasode, D.O. Food insecurity, social vulnerability, and the impact of COVID-19 on population dependent on public assistance / SNAP: A case study of South Carolina, USA. J. Food Secur. 2021, 9, 8–18. [Google Scholar]
- Zhang, J.; Wang, Y.; Yen, S. Does Supplemental Nutrition Assistance Program reduce food insecurity among households with children? Evidence from the current population survey. Int. J. Environ. Res. 2021, 18, 3178. [Google Scholar] [CrossRef] [PubMed]
- Baker, C.; Bacon, G. The rise of food banks and the challenge of matching food assistance with potential need: Towards a spatially specific, rapid assessment approach. Agric. Human Values. 2017, 34, 899–919. [Google Scholar]
- Oliveira, V.; Gundersen, G. The food stamp program and food insufficiency. Am. J. Agric. Econ. 2001, 83, 875–887. [Google Scholar]
- Huffman, S. Food assistance programs and outcomes. Soc. Sci. Q. 2008, 89, 95–115. [Google Scholar] [CrossRef]
- Jensen, H. Food insecurity and the food stamp program. Am. J. Agric. Econ. 2002, 84, 1215–1228. [Google Scholar] [CrossRef]
- Mabli, J.; Ohls, J. Supplemental Nutrition Assistance Program participation is associated with an increase in household food security in a national evaluation. J. Nutr. 2015, 145, 344–351. [Google Scholar] [CrossRef] [Green Version]
- Yen, S.; Andrews, M.; Chen, Z.; Eastwood, D.B. Food stamp program participation and food insecurity: An instrumental variables approach. Am. J. Agric. Econ. 2008, 90, 117–132. [Google Scholar] [CrossRef]
- Gundersen, C.; Kreider, B.; Pepper, J. Partial identification methods for evaluating food assistance programs: A case study of the causal impact of SNAP on food insecurity. Am. J. Agric. Econ. 2017, 99, 875–893. [Google Scholar] [CrossRef]
- Zhang, J.; Yen, S. Supplemental Nutrition Assistance Program and food insecurity among families with children. J. Policy Model. 2017, 39, 52–64. [Google Scholar] [CrossRef] [Green Version]
- Center on Budget and Policy Priorities. States Are Using Much-Needed Temporary Flexibility in SNAP to Respond to COVID-19 Challenges. Available online: https://www.cbpp.org/sites/default/files/atoms/files/3-31-20fa.pdf (accessed on 1 March 2022).
- Dalma, A.; Petralias, A.; Thomas, T.; Nikolakopoulos, S.; Veloudaki, A.; Kastorini, C.M.; Papadimitriou, E.; Zota, D.; Linos, A. Effectiveness of a school food aid programme in improving household food insecurity; a cluster randomized trial Archontoula. Eur. J. Public Health 2019, 30, 171–178. [Google Scholar]
- Abrams, S.; Avalos, A.; Gray, M.; Hawthorne, K.M. High level of food insecurity among families with children seeking routine care at federally qualified health centers during the Coronavirus disease 2019 pandemic. J. Pediatr X. 2020, 4, 100044. [Google Scholar] [CrossRef] [PubMed]
- Sinha, I.; Lee, A.; Bennett, D.; McGeehan, L.; Abrams, E.M.; Mayell, S.J.; Harwood, R.; Hawcutt, D.B.; Gilchrist, F.J.; Auth, M.K.H.; et al. Child poverty, food insecurity, and respiratory health during the COVID-19 pandemic. Lancet Respir. Med. 2020, 8, 762–763. [Google Scholar] [CrossRef]
- Bureau of Labor Statistics. Unemployment Rises in 2020, as the Country Battles the COVID-19 Pandemic. Available online: https://www.bls.gov/opub/mlr/2021/article/unemployment-rises-in-2020-as-the-country-battles-the-covid-19-pandemic.htm (accessed on 3 March 2022).
- Pew Research Center. About Half of Lower-Income Americans Report Household Job or Wage Loss Due to COVID-19. Available online: https://www.pewresearch.org/social-trends/2020/04/21/about-half-of-lower-income-americans-report-household-job-or-wage-loss-due-to-covid-19/ (accessed on 13 April 2022).
- Milovanska-Farrington, S. Job loss and food insecurity during the COVID-19 pandemic. J. Econ. Stud. 2022. forthcoming. [Google Scholar] [CrossRef]
- Social Policy Institute at Washington University at St. Louis. Employment Changes during COVID-19: The Importance of Employment Attachment. Available online: https://cpb-us-w2.wpmucdn.com/sites.wustl.edu/dist/a/2003/files/2021/12/Survey-COVID-Employment_JPMC.pdf (accessed on 13 April 2022).
- Little, R.A.; Rubin, D.B. The analysis of social science data with missing values. Soc. Methods Res. 1989, 18, 292–326. [Google Scholar] [CrossRef]
- Schafer, J.L. Multiple imputation: A primer. Stat. Methods Med. Res. 1999, 8, 3–15. [Google Scholar] [CrossRef]
- Bennett, D.A. How can I deal with missing data in my study? Aust. N. Z. J. 2001, 25, 464–469. [Google Scholar] [CrossRef]
- Hsieh, F.Y.; Bloch, D.A.; Larsen, M.D. A simple method of sample size calculation for linear and logistic regression. Stat. Med. 1998, 17, 1623–1634. [Google Scholar] [CrossRef]
- Altman, C.; Dondero, M.; Heflin, C.; Nusbaum, D. Current and future food insufficiency during Covid-19: Examining disparities by race/ethnicity and recent work loss. J. Racial Ethn. 2022, 9, 1794–1806. [Google Scholar] [CrossRef]
- Poblacion, A.; Cuba, S.E.D.; Cook, J.T. Comparing Food Security Before and During the COVID-19 Pandemic: Considerations When Choosing Measures. J. Acad. Nutr. Diet. 2021, 121, 1945–1947. [Google Scholar] [CrossRef]
- Gundersen, C. Viewpoint: A proposal to reconstruct the Supplemental Nutrition Assistance Program (SNAP) into a universal basic income program for food. Food Policy. 2021, 101, 102096. [Google Scholar] [CrossRef]
- Frank, D.; Bruce, C.; Ochoa, E. SNAP is medicine for food insecurity. Pediatrics 2020, 146, e2020002105. [Google Scholar] [CrossRef] [PubMed]
- Siddiqi, S.; Cantor, J.; Dastidar, M.G.; Beckman, R.; Richardson, A.S.; Baird, M.D.; Dubowitz, T. SNAP participants and high levels of food insecurity in the early stages of the COVID-19 pandemic. Public Health Rep. 2021, 136, 457–465. [Google Scholar] [CrossRef]
- Gundersen, C.; Waxman, E.; Crumbaugh, A. An examination of the adequacy of Supplemental Nutrition Assistance Program (SNAP) benefit levels: Impacts on food insecurity. Agric. Econ. Res. Rev. 2019, 48, 433–447. [Google Scholar] [CrossRef] [Green Version]
- Center on Budget and Policy Priorities. Pandemic Unemployment Insurance Provisions: What They Mean for Access to SNAP, Medicaid, and TANF. Available online: https://www.cbpp.org/research/economy/pandemic-unemployment-insurance-provisions-what-they-mean-for-access-to-snap (accessed on 3 March 2022).
- Raifman, J.; Bor, J.; Venkataramani, A. Association between receipt of unemployment insurance and food insecurity among people who lost employment during the COVID-19 pandemic in the United States. JAMA Net. Open 2021, 4, e2035884. [Google Scholar] [CrossRef]
- USDA. SNAP Benefits—COVID-19 Pandemic and Beyond. Available online: https://www.fns.usda.gov/snap/benefit-changes-2021 (accessed on 18 April 2022).
- USDA. SNAP Online Purchasing Pilot. Available online: https://www.fns.usda.gov/snap/online-purchasing-pilot (accessed on 13 April 2022).
- Millimet, D.; Tchernis, R.; Husain, M. School nutrition programs and the incidence of childhood obesity. J. Hum. Resour. 2009, 45, 640–654. [Google Scholar]
- Barnidge, J.; Huang, E. Low-income children’s participation in the national school lunch program and household food insufficiency. Soc. Sci. 2016, 150, 8–14. [Google Scholar]
- Ralston, K.; Treen, K.; Coleman-Jensen, A.; Guthrie, J. Children’s Food Security and USDA Child Nutrition Programs. The U.S. Department of Agriculture. June 2017. Economic Information Bulletin, 174. Available online: https://www.ers.usda.gov/webdocs/publications/84003/eib-174.pdf?v=42905 (accessed on 10 March 2022).
- Burke, M.; Cabili, C.; Berman, D.; Forrestal, S.; Gleason, P. A randomized controlled trial of three school meals and weekend food backpacks on food security in Virginia. J. Acad. Nutr. Diet. 2021, 121, S34–S45. [Google Scholar] [CrossRef]
- Gross, S.; Kelley, T.L.; Augustyn, M.; Wilson, M.J.; Bassarab, K.; Palmer, A. Household food security status of families with children attending schools that Participate in the community eligibility provision (CEP) and those with children attending schools that are with children attending schools that are CEP eligible. J. Hunger Environ. Nutr. 2021, 16, 281–296. [Google Scholar] [CrossRef]
- Forrestal, S.; Potamites, E.; Guthrie, J.; Paxton, N. Associations among food security, school meal participation, and students’ diet quality in the first school nutrition and meal cost study. Nutrients 2021, 13, 307. [Google Scholar] [CrossRef]
- U.S. Department of Agriculture. Child Nutrition Programs Income Eligibility Guidelines (2020–2021). Available online: https://www.fns.usda.gov/cn/fr-032020 (accessed on 8 March 2022).
- Fang, D.; Thomsen, M.R.; Nayga, R.M.; Yang, W. Food insecurity during the COVID-19 pandemic: Evidence from a survey of low-income Americans. Food Secur. 2022, 14, 165–183. [Google Scholar] [CrossRef]
- National Public Radio. ‘Children Are Going Hungry’: Why Schools Are Struggling To Feed Students. Available online: https://www.npr.org/2020/09/08/908442609/children-are-going-hungry-why-schools-are-struggling-to-feed-students (accessed on 20 April 2022).
- The Food Research and Action Center. The Reach of Breakfast and Lunch: A look at Pandemic and Pre-Pandemic Participation. Available online: https://frac.org/wp-content/uploads/SchoolMealsReport2022.pdf (accessed on 20 April 2022).
- Paslakis, G.; Dimitropoulos, G.; Katzman, D.K. A call to action to address COVID-19—Induced global food insecurity to prevent hunger, malnutrition, and eating pathology. Nutr. Rev. 2021, 79, 114–116. [Google Scholar] [CrossRef]
- Food Research and Action Center. Benefit of School Lunch. Available online: https://frac.org/programs/national-school-lunch-program/benefits-school-lunch (accessed on 8 March 2022).
- Martin, K.; Wu, K.M.R.; Wolff, M.; Colantonia, A.; Grady, J. A novel food pantry program: Food security, self-sufficiency, and diet-quality outcomes. Am. J. Prev. Med. 2013, 45, 569–575. [Google Scholar] [CrossRef] [PubMed]
- Bazerghi, C.; McKay, F.; Dunn, M. The role of food banks in addressing food insecurity: A systematic review. J. Community Health. 2016, 41, 732–740. [Google Scholar] [CrossRef] [PubMed]
- Coleman-Jensen, A.; Rabbitt, M.P.; Gregory, C.A.; Singh, A. Statistical Supplement to Household Food Security in the United States in 2016. U.S. Department of Agriculture. AP-077. September 2017. Available online: https://www.ers.usda.gov/publications/pub-details/?pubid=84980 (accessed on 15 November 2022).
- Tarasuk, V.; St-Germain, A.; Loopstra, R. The Relationship Between Food Banks and Food Insecurity: Insights from Canada. Voluntas 2020, 31, 841–852. [Google Scholar] [CrossRef] [Green Version]
- McKernan, S.M.; Ratcliffe, C.; Braga, B. The Effect of the US Safety Net on Material Hardship over Two Decades. J. Public Econ. 2021, 197, 104403. [Google Scholar] [CrossRef]
- U.S. Department of Agriculture. USDA Farmers to Families Food Box. Available online: https://www.ams.usda.gov/selling-food-to-usda/farmers-to-families-food-box (accessed on 1 March 2022).
- U.S. Department of Agriculture. Food Environment Atlas Data Download. Available online: https://www.ers.usda.gov/data-products/food-environment-atlas/data-access-and-documentation-downloads/ (accessed on 15 April 2022).
- Loopstra, R. Interventions to address household food insecurity in high-income countries. Proc. Nutr. Soc. 2018, 77, 270–281. [Google Scholar] [CrossRef]
Figure 1.
Percentages of food insufficient households before (a) and during (b) the pandemic. (Note: all percentages were calculated with weighted data).
Figure 1.
Percentages of food insufficient households before (a) and during (b) the pandemic. (Note: all percentages were calculated with weighted data).

Table 1.
Comparing demographics of all respondents (with missing data) and respondents included in analysis (without missing data).
Table 1.
Comparing demographics of all respondents (with missing data) and respondents included in analysis (without missing data).
| Sample with Missing Data (n = 299,301) | Mean | SD | Minimum | Maximum |
|---|---|---|---|---|
| Age * | 47.8 | 14.4 | 18 | 88 |
| Education * | 5.1 | 1.5 | 1 | 7 |
| Income | N/A | N/A | 1 | 8 |
| Children * | 0.79 | 1.3 | 0 | 5 |
| Gender | Male: 39.7% | Female: 60.3% | ||
| Race | White: 78.9% | Non-White: 21.1% | ||
| Ethnicity * | Non-Hispanic: 88.1% | Hispanic: 11.9% | ||
| Sample without missing data (n = 229,668) | Mean | SD | Minimum | Maximum |
| Age * | 48.4 | 14.1 | 18 | 88 |
| Education * | 5.2 | 1.4 | 1 | 7 |
| Income | 4.3 | 2.1 | 1 | 8 |
| Children * | 0.74 | 1.1 | 0 | 5 |
| Gender | Male: 39.8% | Female: 60.2% | ||
| Race * | White: 80.5% | Non-White: 19.5% | ||
| Ethnicity * | Non-Hispanic: 89.1% | Hispanic: 10.9% | ||
Note: * Denotes p value < 0.01. All statistics and percentages were calculated with original (unweighted) data to compare respondents with missing data and without missing data.
Table 2.
Summary statistics of variables (n = 229,668).
| Variables | Description | ||||
|---|---|---|---|---|---|
| Dependent variable | |||||
| Food insufficiency | 1-Food insufficient (in pandemic) | Yes | 18.6% | No | 81.4% |
| Independent variables | |||||
| SNAP | Received benefits from SNAP or the Food Stamp Program | Yes | 15.7% | No | 84.3% |
| Children program | Got free food from programs for children | Yes | 5.1% | No | 94.9% |
| Community | Got free food from community programs | Yes | 7.5% | No | 92.5% |
| Control variables | |||||
| Gender | 1-Male | Male | 47.8% | Female | 52.2% |
| Race | 1-White | White | 75% | Non-White | 25% |
| Ethnicity | 1-Non-Hispanic | Non- Hispanic | 82.4% | Hispanic | 17.6% |
| Children | Have children | Yes | 41% | No | 59% |
| Pre food insufficiency | 1-Food insufficient (before pandemic) | Yes | 13.9% | No | 86.1% |
| Mean | SD | Min | Max | ||
| Age | 46 | 15.2 | 18 | 88 | |
| Education | 4.3 | 1.6 | 1 | 7 | |
| Income | 3.8 | 2 | 1 | 8 | |
Note: all descriptive statistics and percentages were calculated with weighted data to reflect the representative proportion in the target U.S. population.
Table 3.
Food insufficiency rates among socio-demographic groups.
| Demographics | % Food Insufficient Householdsbefore Pandemic | % Food Insufficient Households during Pandemic | |
|---|---|---|---|
| Gender | Male | 13.3% | 18.3% |
| Female | 14.3% | 19.2% | |
| Race | White | 11.5% | 16.4% |
| Black | 24.2% | 29.3% | |
| Asian | 10.3% | 12.3% | |
| Other races | 21.7% | 26.6% | |
| Ethnicity | Hispanic | 20.60% | 24.80% |
| Non-Hispanic | 12.4% | 17.3% | |
| Age | <65 | 14.9% | 20.1% |
| ≥65 | 7.0% | 9.1% | |
| Education | Less than high school or high school | 21.8% | 26.8% |
| Some college or associate degree | 12.6% | 18.9% | |
| Bachelor’s degree or higher | 4.9% | 7.5% | |
| Income | <$50,000 | 23.5% | 29.8% |
| ≥$50,000 | 5.6% | 9.0% | |
| Children | With children | 17.5% | 22.6% |
| Without children | 11.3% | 15.9% | |
Note: all percentages were calculated with weighted data to reflect the representative proportion in the target U.S. population.
Table 4.
Results of logistic regression models.
| Model 1 | Model 2 | Model 3 | |
|---|---|---|---|
| All (n = 229,668) | Pre food insufficient (n = 20,964) | Households with children (n = 91,031) | |
| Individual level independent variables Odds Ratio | |||
| SNAP | 1.107 * | 0.755 * | 0.881 * |
| 95% CI | 1.106, 1.108 | 0.754, 0.756 | 0.88, 0.882 |
| Children programs | 0.993 * | 0.906 * | 1.077 * |
| 95% CI | 0.991, 0.994 | 0.904, 0.909 | 1.075, 1.079 |
| Community programs | 1.309 * | 1.07 * | 1.23 * |
| 95% CI | 1.307, 1.31 | 1.067, 1.072 | 1.228, 1.232 |
| Control variables | |||
| Age | 0.985 * | 1.002 * | 0.991 * |
| 95% CI | 0.985, 0.985 | 1.002, 1.002 | 0.991, 0.991 |
| Gender (reference-female) | 1.091 * | 1.287 * | 1.043 * |
| 95% CI | 1.09,1.092 | 1.285, 1.289 | 1.041, 1.044 |
| Race (reference-White) | |||
| 1-Black | 1.125 * | 0.977 * | 1.1 * |
| 95% CI | 1.123, 1.126 | 0.975, 0.979 | 1.099, 1.102 |
| 2-Asian | 0.689 * | 0.811 * | 0.691 * |
| 95% CI | 0.688, 0.69 | 0.808, 0.814 | 0.689, 0.693 |
| 3-Other races | 1.158 * | 0.951 * | 1.16 * |
| 95% CI | 1.156, 1.159 | 0.949, 0.953 | 1.158, 1.162 |
| Ethnicity (reference-non-Hispanic) | 0.894 * | 0.873 * | 0.861 * |
| 95% CI | 0.894, 0.895 | 0.872, 0.875 | 0.86, 0.862 |
| Education | 0.895 * | 0.979 * | 0.903 * |
| 95% CI | 0.895, 0.895 | 0.979, 0.98 | 0.903, 0.904 |
| Income | 0.774 * | 0.898 * | 0.782 * |
| 95% CI | 0.774, 0.775 | 0.898, 0.899 | 0.782, 0.782 |
| Pre food sufficiency (reference-yes) | 26.892 * | N/A | 21.255 |
| 26.869, 26.915 | 21.23, 21.281 | ||
| Children (reference-no children) | 1.136 * | 0.985 * | N/A |
| 95% CI | 1.135, 1.137 | 0.984, 0.987 | |
| Omnibus Tests (model significance) | <0.001 | <0.001 | <0.001 |
| -2Loglikelihood | 204,132,813 | 46,334,563 | 48,004,269 |
Note: * Denote p value < 0.001. Results presented in Table 4 were weighted based on the HPS recommended sampling weights to reflect the representative proportion in the target U.S. population.
Publisher’s Note: MDPI stays neutral with regard to jurisdictional claims in published maps and institutional affiliations. |
© 2022 by the authors. Licensee MDPI, Basel, Switzerland. This article is an open access article distributed under the terms and conditions of the Creative Commons Attribution (CC BY) license (https://creativecommons.org/licenses/by/4.0/).
Share and Cite
MDPI and ACS Style
Li, Y.; Li, D.; King, C. Food Insufficiency among Job-Loss Households during the Pandemic: The Role of Food Assistance Programs. Sustainability 2022, 14, 15433. https://doi.org/10.3390/su142215433
AMA Style
Li Y, Li D, King C. Food Insufficiency among Job-Loss Households during the Pandemic: The Role of Food Assistance Programs. Sustainability. 2022; 14(22):15433. https://doi.org/10.3390/su142215433
Chicago/Turabian StyleLi, Yingru, Dapeng Li, and Christian King. 2022. "Food Insufficiency among Job-Loss Households during the Pandemic: The Role of Food Assistance Programs" Sustainability 14, no. 22: 15433. https://doi.org/10.3390/su142215433
Note that from the first issue of 2016, this journal uses article numbers instead of page numbers. See further details here.