
Impact of the COVID-19 Market Turmoil on Investor Behavior: A Panel VAR Study of Bank Stocks in Borsa Istanbul

1
Department of Management Engineering, Istanbul Technical University, Istanbul 34367, Turkey
2
International Trade and Finance Department, Faculty of Economics, Administrative and Social Sciences, Kadir Has University, Istanbul 34083, Turkey
*
Author to whom correspondence should be addressed.
Int. J. Financial Stud. 2024, 12(1), 14; https://doi.org/10.3390/ijfs12010014
Submission received: 24 November 2023
/
Revised: 30 January 2024
/
Accepted: 1 February 2024
/
Published: 4 February 2024
Abstract
:Assuming that investors can be foreign or local, do high-frequency trading (HFT) or not, and submit orders through a bank-owned or non-bank-owned broker, we associated trades to various investors. Then, building a panel vector autoregressive model, we analyzed the dynamic relation of these investors with returns and among each other before and during the COVID-19 market crash. Results show that investor groups have influence on each other. Their net purchases also interact with returns. Moreover, during the turmoil caused by the pandemic, except foreign investors not involved in HFT, the response of any investor group (retail/institutional, domestic investors doing HFT and those not doing HFT, and foreign investors doing HFT) significantly altered. This shows that the interrelation among investor groups is dynamic and sensitive to market conditions.
1. Introduction
Analyzing the trading behavior of different investor types has been of significant interest since the 1990s. One branch of the literature has studied the differences in trading behavior of individual (retail) investors and institutional investors with a special emphasis on behavioral biases (see e.g., Lee et al. 1999; Grinblatt and Keloharju 2000; Shapira and Venezia 2001; Griffin et al. 2003; Ng and Wu 2007; Barber and Odean 2008). This literature generally documents that individual investors are more prone to behavioral biases. Moreover, their trading behavior tends to exhibit a mean-reverting pattern (Ng and Wu 2007; Foucault et al. 2011). Another branch of research investigates the role of investors’ origin (and location), inquiring whether investors are domestic or foreign (Choe et al. 1999; Kamesaka et al. 2003; Dvorak 2005; Richards 2005). This research concludes that domestic (foreign) investors are oriented by negative (positive) feedback pursuing contrarian (momentum) strategies (Grinblatt and Keloharju 2000; Ng and Wu 2007; Phansatan et al. 2012). The observed differences are also rooted in two behavioral biases, i.e., home bias (Grinblatt and Keloharju 2001; Coval and Moskowitz 1999) and familiarity bias (Kang and Stulz 1997; Huberman 2001), which may play a part in the diverse sophistication levels of these investors. A third stream of studies adapting a comparative approach for investor types examines the role of trading frequency and speed. More specifically, a recently originated but wide literature studies the interaction between high-frequency (HF) traders and slow traders with respect to various concentration points, such as positive (Brogaard et al. 2014; Menkveld 2014) or negative (Foucault et al. 2017; Biais et al. 2015) externality of HF traders on markets and participants; trader composition following structural changes (Mahmoodzadeh and Gençay 2017) as well as during crises and extreme events (Kirilenko et al. 2017; Brogaard et al. 2018).
While there is ample evidence of the different trading behavior of various investor types, the literature analyzing the interaction between investors is scarce, an exception being the high-frequency trading (HFT) literature. Moreover, the vast majority of the studies attempting to differentiate investors do so by grounding on a single feature and classifying investors as individual vs. institutional, domestic vs. foreign, slow vs. fast, etc. Although sophistication level is an ingredient in most categorizations, each feature underlying the categorizations has unique aspects. Therefore, in examining the interactions between investors, it is essential to incorporate multiple features.
Besides all these occurrences observed in financial markets, an event that shaped lives and global markets early this decade is the pandemic (COVID-19). Global indices experienced a sharp fall with the spread of the pandemic and then recovered slowly. Many researchers have documented the effects of COVID-19 on stock returns (Panyagometh 2020; Salisu and Vo 2020; Xu 2021; Dospatliev et al. 2022). Among others, Nguyen et al. (2023) indicate that foreign investors changed their trading behavior and lost their role as a trend leader to domestic retail investors in the Vietnamese market. Chung and Chuwonganant (2023) find increases in price efficiency and informed trading before the NYSE closed its trading floor in the US due to COVID-19. Upon the close of the trading floor, liquidity, price efficiency and informed trading declined, whereas these effects fully reversed when the trading floor reopened. Celik et al. (2024) find that, with the pandemic, the effect of HFT on market liquidity disappeared in Borsa Istanbul. The literature offers other studies that investigate the COVID-19-imposed changes to the behavior of selected investor types, e.g., Ozik et al. (2021) and Djalilov and Ülkü (2021) on retail investors; Glossner et al. (2022) on institutional investors; Bing and Ma (2021) on individual and institutional investors; and Banerjee and Nawn (2024) on HFTs and non-HFTs.
Despite the ample evidence of the behavior and impacts of selected investor type(s) throughout the pandemic period, the role of COVID-19 on the interactions and simultaneous impacts of various investor types has been rarely analyzed. Ülkü et al. (2023) examine the trading activity of various investor types to observe each type’s role in the COVID-19-related worldwide negative bubble. They point out the altered investor distribution due to the COVID-19-oriented increase in individual investors’ participation in the markets and find that individual investors and domestic institutions exploited the negative bubble.
Coupled with the effects of the pandemic, similar to other countries (Nguyen et al. 2023; Ülkü et al. 2023), the stock market in Turkey has faced a rise in the activity and influence of individual investors, which has consequences in stock prices and investment patterns. Moreover, the challenges faced in the early days of the pandemic, such as a reduction in overseas investment activities, and a drop (a boom) in face-to-face (distant) communication might have impacts on the investment styles, risk attitudes and trading behavior of different investor types.
Motivated by this questioning, the paper goes around the following research questions. Do the trades (net purchases) of different market participants have impact on stock prices and on the trades of others? If so, which investor groups influence the stock prices most? Did the pandemic bring about any change in the response of market participants to each other?
Borsa Istanbul offers an ideal setup for doing this research since it releases in real time the trades committed by different brokerage firms. Hence, we analyze the short-term impact different types of investors have on each other as well as their interaction with returns intraday. We develop an original classification of investors based upon tick-by-tick transaction data endowed with the name of the broker committing the transaction, construct a panel vector autoregression (VAR) model comprising eight variables and interpret the regression results for the periods just before and after 19 February 2020, in order to determine if the financial turmoil that started with COVID-19 had an effect on the trading behavior of different investors. This research is particularly important insofar as the rationality of investors is concerned or from the standpoint of investors who are to submit their orders strategically thinking that a certain category of investors is better informed. Theoretically speaking, it contributes to the literature about asset pricing, behavioral finance, market microstructure and the effects of COVID-19.
2. Market and Data
Borsa Istanbul (BIST) is one of the largest and most active emerging stock markets with 352 stocks listed, a total market capitalization of USD 217 billion and an average daily trading volume of USD 5.16 billion by the end of 2020. Established in 1985, the market switched to fully computerized trading by 1994 and witnessed a major technological change called BISTECH through 2015 to 2018. Hence, it adopted the trading system of NASDAQ which has enabled the investors and various market participants to practice more easily algorithmic and high-frequency trading.
We conduct an analysis on four major bank stocks (AKBNK, GARAN, ISCTR and YKBNK) trading in Borsa Istanbul that can all be considered peers since they are highly liquid and frequently traded, and these banks are homogeneous in their business, corporate features and other aspects. In fact, stocks of major Turkish banks have long been considered blue chips in BIST. Although few in number, they used to be highly influential on the overall market. Among others, Dospinescu and Dospinescu (2019) and Al-Nefaie and Aldhyani (2022) select similar datasets.
Table 1 gives summary statistics about all eleven banks listed in BIST. These statistics relate to corporate size and extent, such as numbers of branches, ATMs and employees; to financials such as total assets and net profit; and to market values and trading of their stocks such as market capitalization, daily turnover, free float, beta and foreign ownership in floating shares. Accordingly, four bank stocks taken in the sample (Panel A) constitute 13.54% of the overall market capitalization and 7.67% of the turnover in Borsa Istanbul (BIST). They also generate 45.58% of the overall profits in the banking industry in the country (including non-listed banks). Their stocks count a minimum (maximum) of 10,541 (21,872) trades per day, which makes 46 (22) trades per minute. Therefore, they can easily satisfy data requirements intraday. Consequently, we reduce the sample to four peer private banks, which in terms of history, business area, size, market capitalization, weight in the index, free float and foreign ownership of floating shares are close to each other and distinct from the remaining banks. Although two bank stocks (VAKBN and HALKB) are close to our sample stocks (AKBNK, GARAN, ISCTR and YKBNK) for many aspects such as size, liquidity, weight in the index, investor interest (number of analysts) and foreign ownership, they are mainly state owned and subject to public administration rules. On the other hand, QNBFB has a high market capitalization (15.57%), yet is very thinly traded since its free float ratio is only 0.12%. Other listed banks are small, less traded or less followed compared to the sample stocks. Therefore, we exclude them in the analysis.
A reason for choosing bank stocks is that large banking groups usually have many subsidiaries such as brokerage houses, portfolio and insurance companies that manage various funds, leasing and factoring companies, and real estate investment trusts. Hence, they have an influential power through their trades and positions in financial markets. Consequently, we can distinguish between the trades of bank-owned and non-bank-owned brokers’ trades, which is an important distinction of our classification.
Another essential motivation in focusing on bank stocks is the existence of a regulative action within our sample period. Initiated on 28 February 2020, short selling in all non-financial stocks was prohibited in the course of the COVID-19 market crash, which might have led to a significant change in the trading activity of certain market participants such as HFTs and foreign traders, while the short sale ban had already been in use for the examined bank stocks since 16 October 2019, well before the start of COVID-19. Hence, our sample stocks did not experience a change regarding short sale bans throughout the study period.
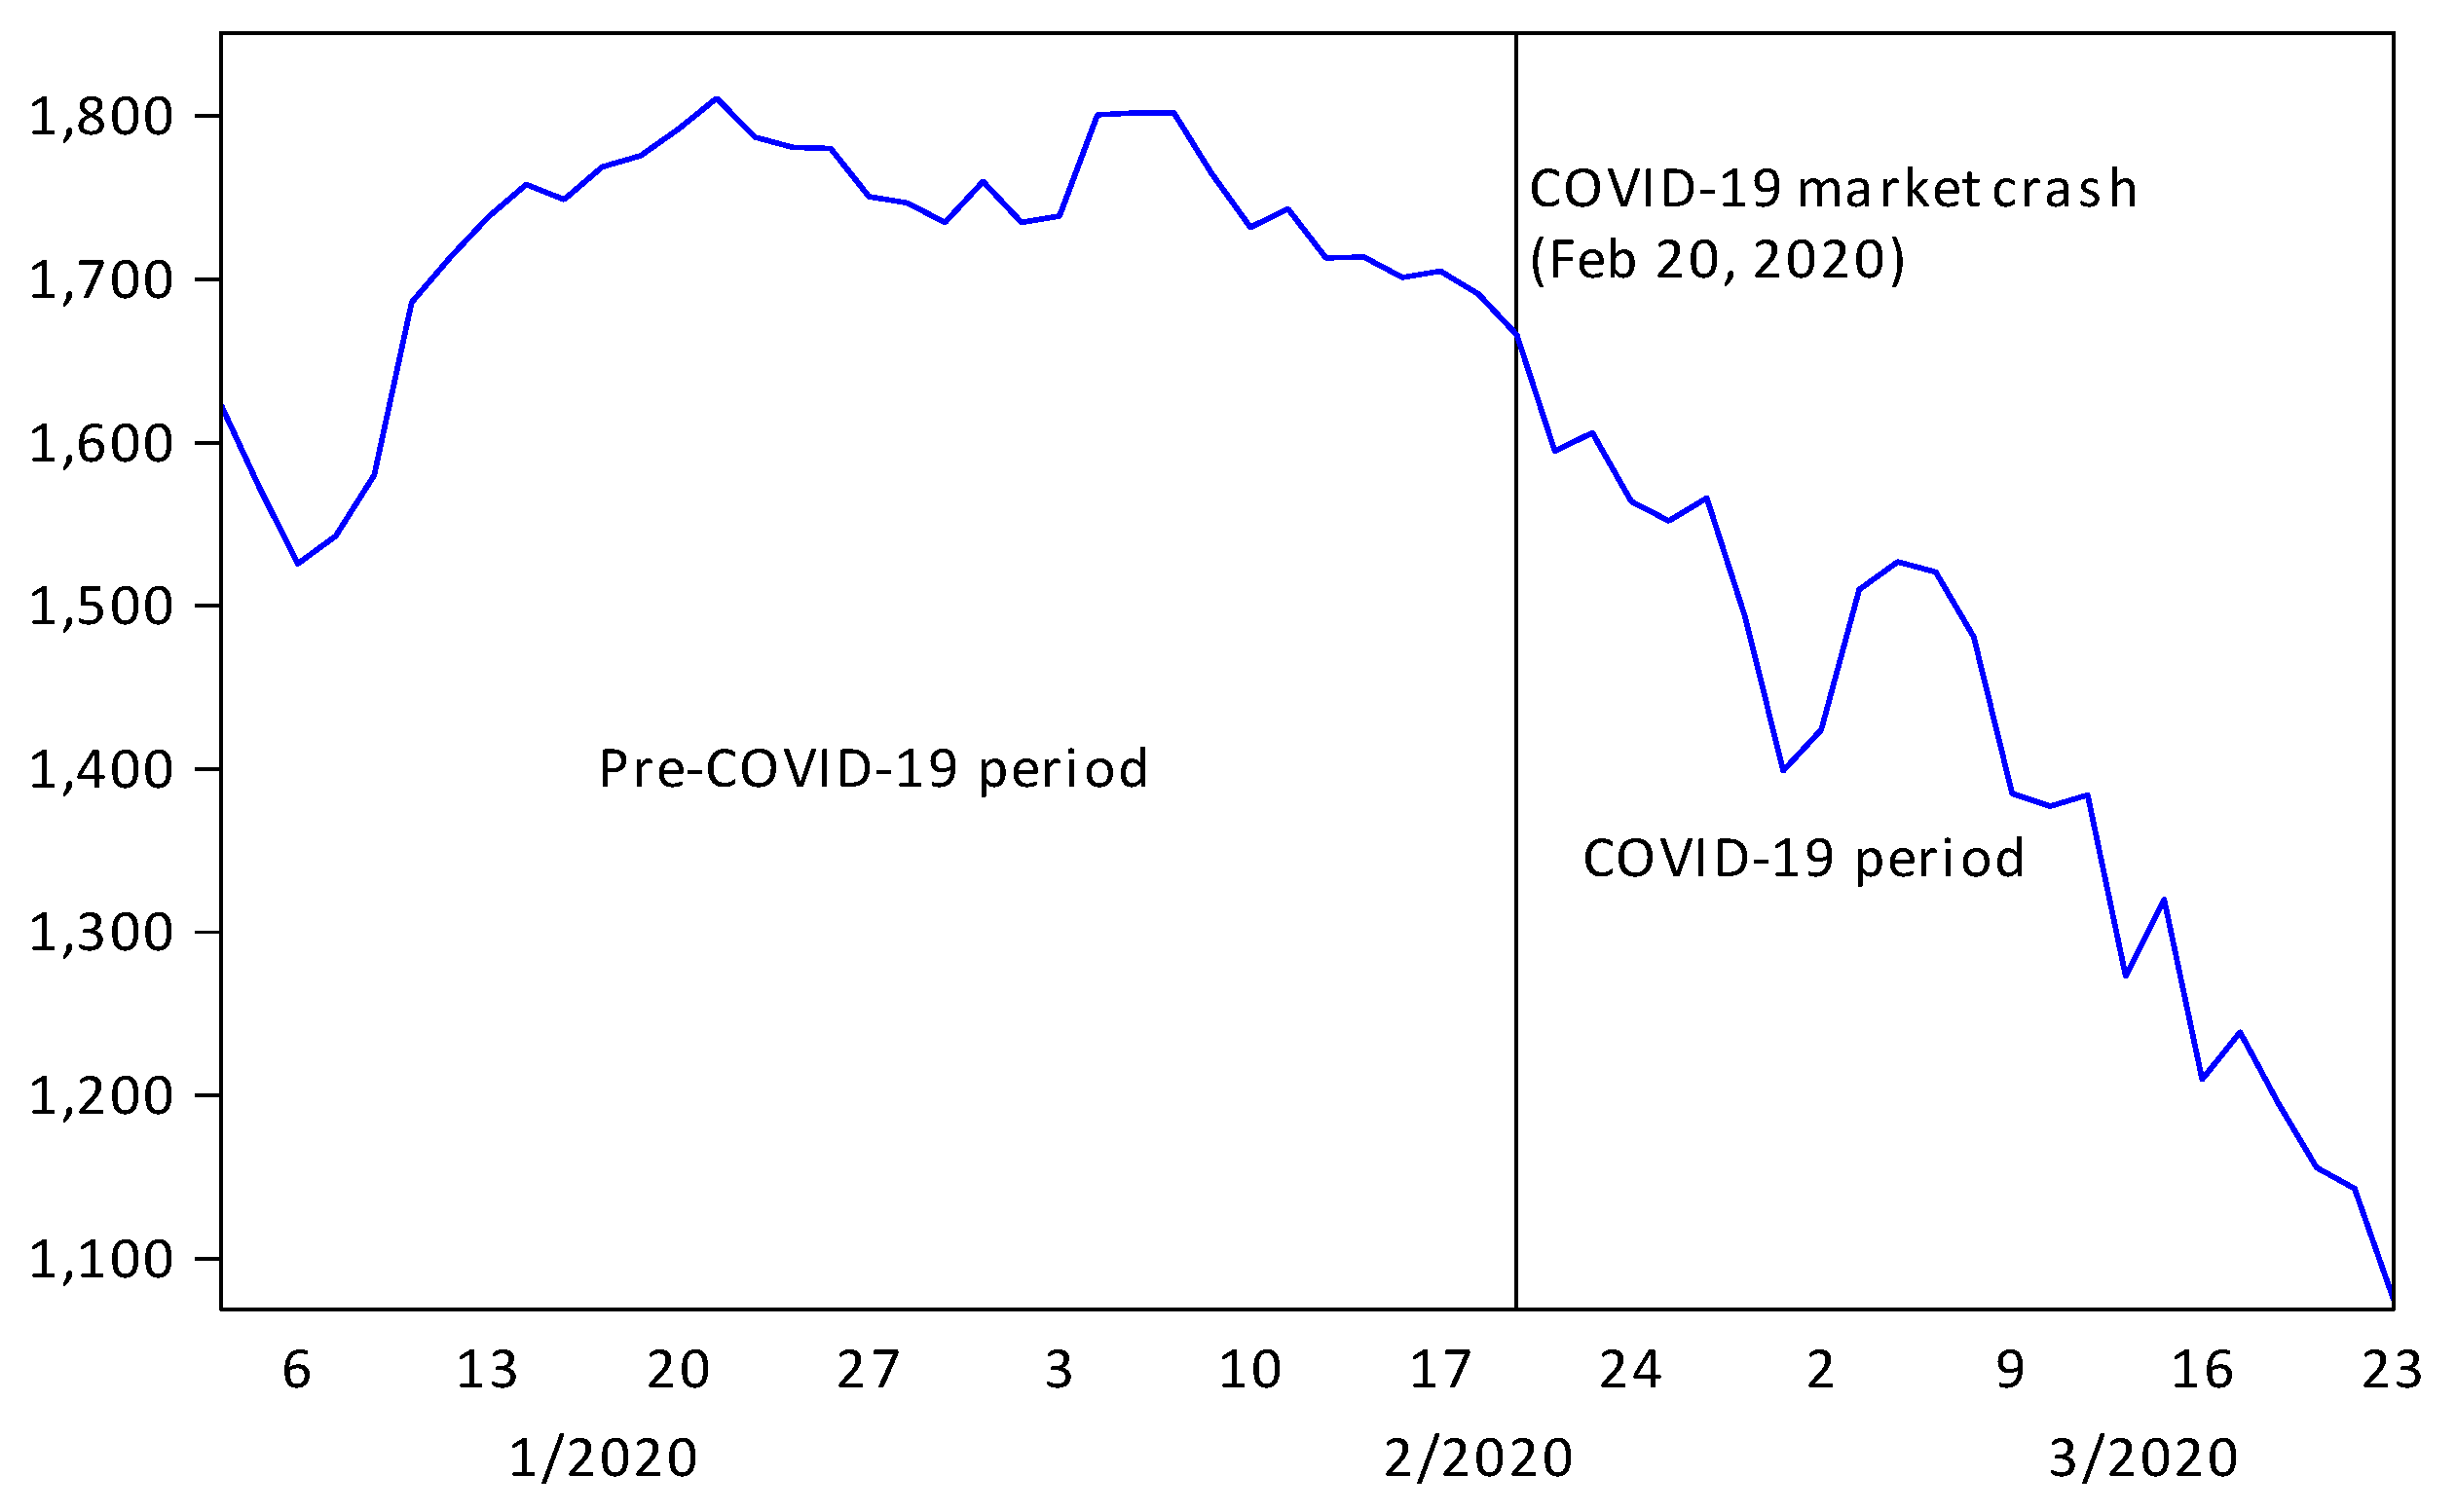
Based on tick-by-tick transaction data from 2 January 2020 to 23 March 2020 (58 trading days), we constructed time series of equal length (5 min) intervals, for returns as well as for the net purchases (buy volume minus sell volume) of various investor types. We divided the whole sample period into two subperiods: the pre-COVID-19 period from 2 January 2020 to 19 February 2020 and the COVID-19 market crash period from 20 February to 23 March 2020. In the literature, there are different views about the starting date of COVID-19. Nonetheless, our focus is in the market crash due to COVID-19. The XBANK index faced a large drop of 4.2% in 20 February 2020 due to the panic caused by COVID-19, while price changes were much more limited in the preceding days. Another issue for the varying dates in these event studies is that countries were not affected by COVID-19 simultaneously. For instance, infections in China, Italy, and Iran were detected much earlier than those in the US. This counts on the conscience of investors about the impacts of COVID-19. Nevertheless, we performed analyses with alternative starting dates of the market crash as well as the pre-COVID-19 period and obtained qualitatively similar results. Note that the banking index of Borsa Istanbul (XBANK) is relatively stable in the former subperiod, whereas it falls by 35% in the latter (see Figure 1).
Borsa Istanbul (BIST) releases in real time the names of the brokers on both the buy and sell sides of trades. It is among the rare exchanges to release this buyer and seller information which motivates our study. On the practical side, this information incites many traders to follow each other and submit their orders strategically. In a separate online source, the Exchange publishes the list of brokerage firms having access to colocation services. In order to infer investor types, we combined these two data sources and the tick-by-tick transaction data revealing the time, price and quantity of each trade.
We excluded daily opening returns since large amount of news accumulate overnight and investors do not necessarily respond to each other when they trade. In contrast, it is more likely that investors interact with each other through the rest of the trading session.
3. Methodology
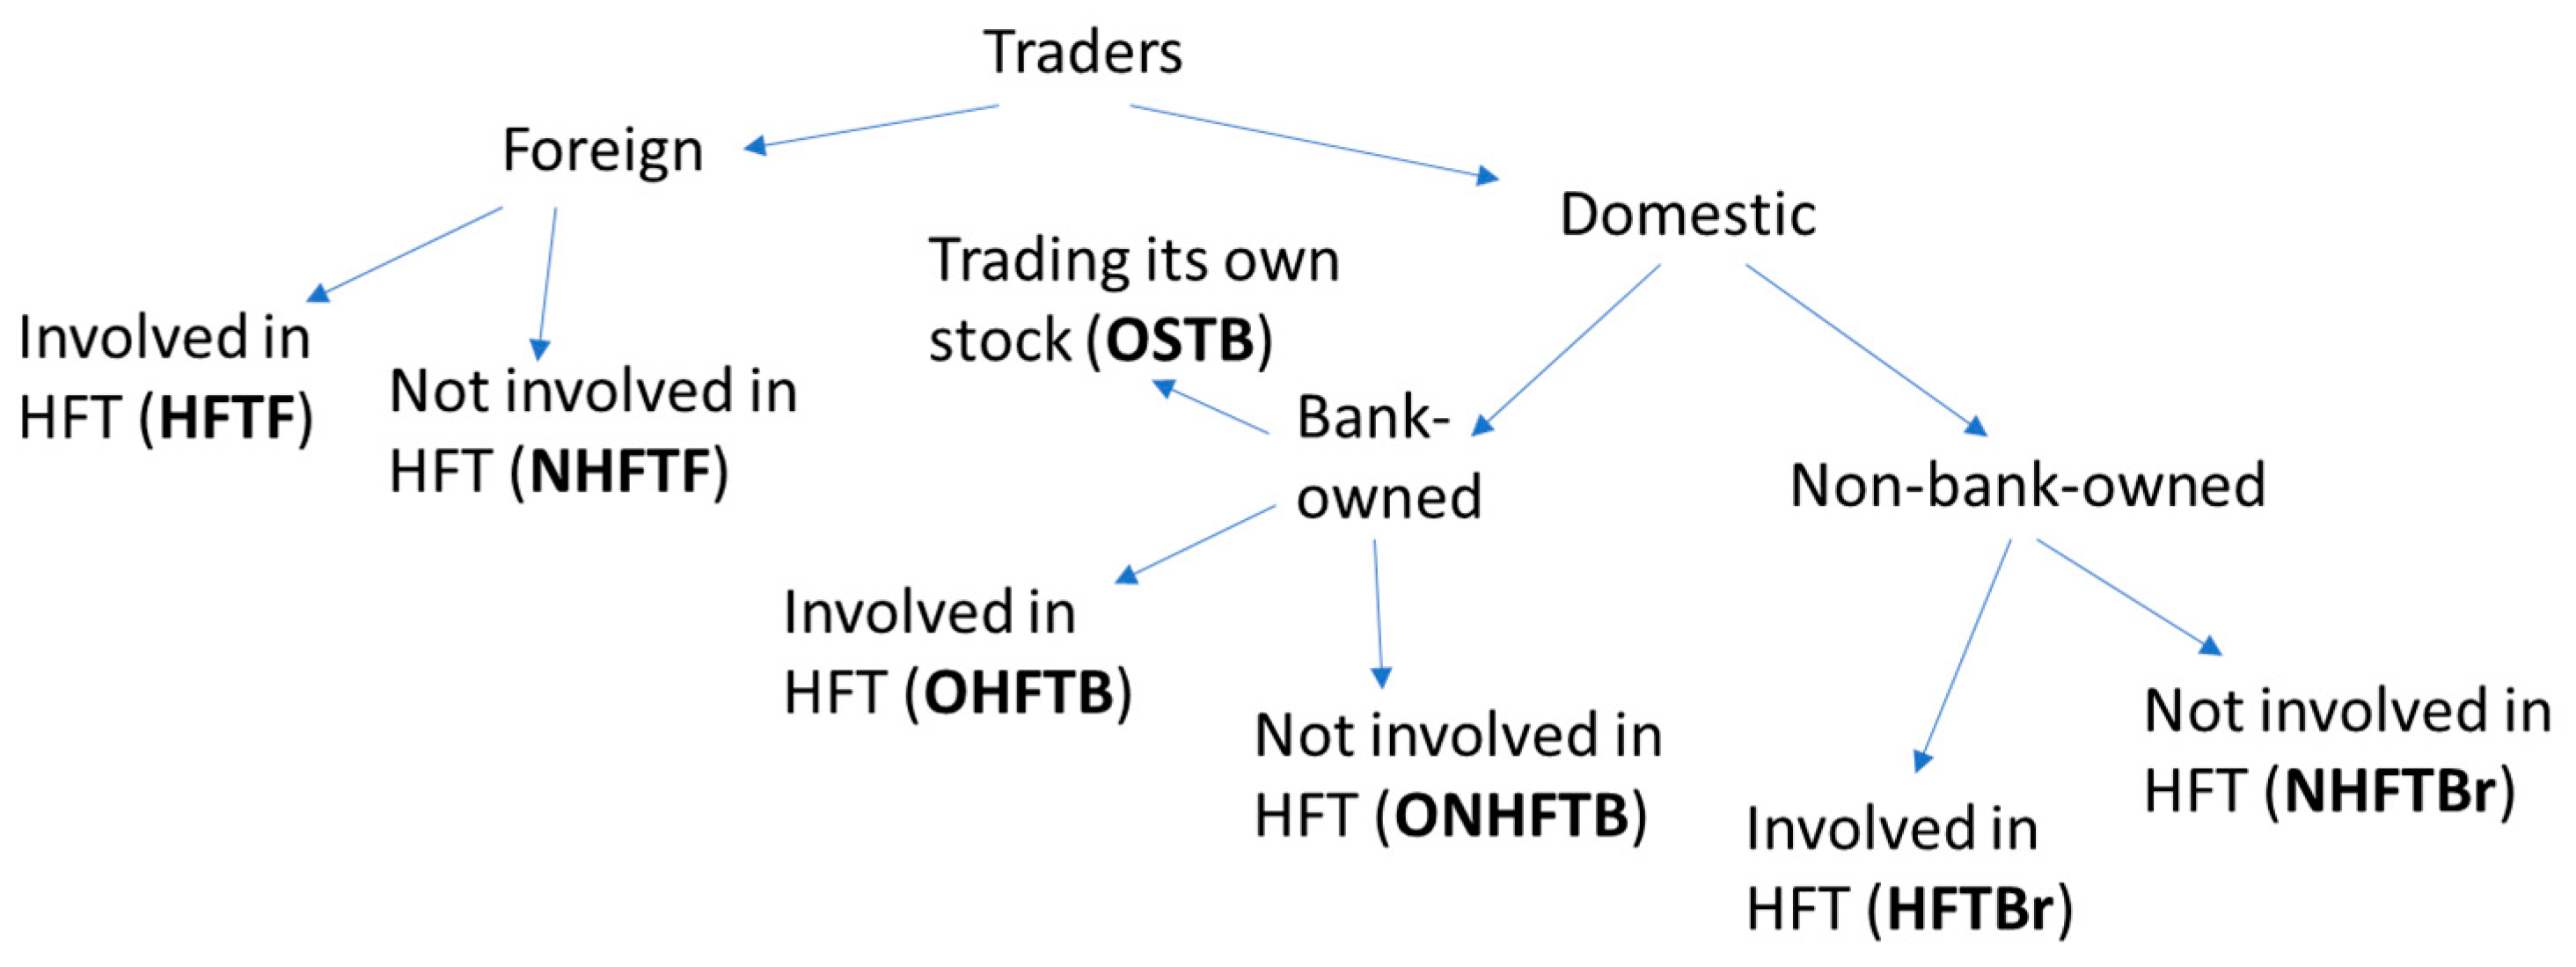
Based on the dataset, we define seven groups of investors described in Table 2 and illustrated in Figure 2.
To determine if a trade is an HFT, we look at whether the executing broker is a member of the colocation service offered by BIST. Foreign investors’ trades are executed by three brokers, of which one has access to a colocation service and other two do not. Consequently, we can determine HFTF and NHFTF. Depending on the trade, a bank-owned broker can be trading its group bank’s shares (OSTB) or others banks’ shares. We distinguish between the trades in own banking group stocks (OSTB) and in other banks’ stocks (OHFTB) because brokers’ motivations can be different in these two cases.
Note that our classification is novel to the literature since broker names are not released in other exchanges. Hence, we are able to associate trades with trader types. Secondly, we combine different types of data such as the list of brokers using a colocation service, those engaged in foreigners’ trades and tick-by-tick transactions. We use different algorithms to filter seven types of investors. Even if classification of different investors (e.g., foreign investors, HFT, etc.) exists in the literature, their joint combinations such as foreign investors doing HFT or bank-owned broker doing HFT have not been addressed in this way.
When a broker trades, this can be on behalf of itself as a proprietary (prop) trade or on behalf of a customer, i.e., an individual person or a legal person such as a fund or a portfolio company. However, it is natural that a bank makes prop trading through (or directs its customers’ transactions to) its own group broker simply to avoid larger fees or make profits at group level. Similarly, a fund managed by a banking or brokerage group makes its investments through the same group’s broker. Therefore, it is grounded to claim that broker names convey critical information and reveal the type of investor executing the trade. Note that in Turkey, asset management is highly dominated by banking groups. In their turn, brokerage groups are more specialized in stock trading activity. In order to separate these two types of intermediaries, we divide all the brokers in our dataset into two groups with respect to their holding company. A banking group represents a financial services conglomerate with banking and brokerage activities under different entities (OSTB, OHFTB and ONHFTB in Table 2). In contrast, a brokerage group consists of a financial services subsidy not owned by a bank (HFTF, NHFTF, HFTBr and NHFTBr in Table 1).
We wonder whether, defined in this way, the net purchases of different investor groups have an interaction with returns. In a similar approach to ours, Ülkü and Weber (2013) show that individual investors’ net trading is negatively related to future returns; net trading of private funds has no forecast ability while banks and pension funds maintain limited price impact of their trades. Henker and Henker (2010) provide evidence that retail investors have no impact on stock prices. Consequently, our first two null hypotheses are the following.
Hypothesis 1a.
The net purchase of a particular investor type does not have impact on short-term returns of bank stocks.
Hypothesis 1b.
The short-term returns of bank stocks do not have impact on the net purchase of a particular investor type.
Secondly, due mostly to herding behavior (Dalgıç et al. 2021) motivated by informed trading, the net purchases of various investor groups can also have an impact on each other (Ülkü and Weber 2013; Ülkü et al. 2023). Consequently, our next null hypothesis is the following.
Hypothesis 2.
The net purchase of a particular investor type does not have an impact on the net purchase of others’ in the short term.
Finally, due to the widespread effects of COVID-19 all over the world in the early decade (Panyagometh 2020; Salisu and Vo 2020; Xu 2021; Dospatliev et al. 2022; Nguyen et al. 2023; Ozik et al. 2021; Djalilov and Ülkü 2021; Glossner et al. 2022; Bing and Ma 2021; Banerjee and Nawn 2024), we hypothesize that the relations among market players as well as their interaction with returns might have changed. Hence, our last null hypothesis is the following.
Hypothesis 3.
The reciprocal impacts of returns and net purchases of particular investor types before and after the financial turmoil caused by COVID-19 are the same.
Hypotheses 1a, 1b and 2 can be tested by the significance of regression coefficients while for Hypothesis 3, we compare the sign and significance of regression coefficients for the time periods before and during COVID-19.
In order to detect the reciprocal relation between return and investor types (Kumar and Lee 2006; Lee et al. 1999), we employ a panel vector autoregression (panel VAR) model with balanced data shown in Equation (1). Our selection of the VAR approach in analyzing the dynamic relationship among various investor types and returns follows related earlier works that utilize intraday returns (e.g., Hu et al. 2015; Frijns et al. 2016; Strauß et al. 2018; Gao and Liu 2020).
In the model, is return (RINTRADAY) while to are the net stock purchases, i.e., the difference between buy volume and sell volume, of seven different types of investors defined in Table 2 for stock , , and 5 min time interval . For capturing autoregressive effects, we added four lags () in the model. To determine the optimal number of lags, we reiterated the regressions by minimizing Schwartz Information Criterion (SIC) and Akaike Information Criterion (AIC). The optimal number of lags is found to be around twenty. However, qualitative results remained the same. Hence, for brevity, we keep four lags in the analysis.
As in Arellano and Bover (1995), we apply a forward mean-differencing (Helmert transformation) which helps preserve homoscedasticity and the orthogonality between transformed variables and their lags. Subsequently, we demean all the variables (i.e., in a particular 5 min interval, we take the difference of a stock from the average of four stocks) to remove time effects.
A problem of using lagged variables in an intraday analysis is that the model suggests a variable can respond to a phenomenon taking place in the preceding day. Although it is not unreasonable to assume that investors can respond to returns or the net purchases that occurred in the previous day, stocks can accumulate critical information overnight. To tackle this problem, we exclude from the analysis the first four intervals at the day opening (see Griffin et al. 2003; Choe et al. 1999; Hasbrouck 2018). Unit root tests such as Im, Pesaran and Shin, ADF or PP confirm that our variables are stationary.
4. Findings
Table 3 displays the correlations among intraday returns and net purchases of various investor types for the periods just before (Panel A) and during (Panel B) the COVID-19 market crash. Accordingly, the correlation coefficients between intraday returns and the net purchases of three investor groups (OSTB, HFTF and NHFTF, respectively) are 1%, 9% and 12% and significant. The correlation of intraday returns with the remaining four investor groups’ (OHFTB, ONHFTB, HFTBr, and NHFTBr) trading are negative and significant for three of them (−1% to −8%). This puts forward that foreign investors’ net purchases in any stock and banks’ net purchases in their own stocks are likely to be associated with price increases while other investors’ net purchases are associated with price decreases. Larger and negative correlations (−22% to −47%) are observed between the net purchases of OHFTB and any other investor type, which reveals that bank-owned brokers’ net purchases in the stocks of other banks contrast with the net purchases of other investors. Interestingly, during the COVID-19 crash, the negative correlations between OHFTB and other investor types except for non-bank-owned brokers (HFTBr and NHFTBr) declined in magnitude (−6% to −12%). Non-bank-owned brokers mostly giving service to retail domestic investors, weakening correlations along with the rise of COVID-19 may signal a change in the attitude of this investor type.
Table 4 explores the regression results for the panel VAR equations explained above. Pre-crash and crash periods divide the time interval at the COVID-19 outbreak and are reported in consecutive columns for each investor type. The table only reports the coefficients which are significant at the 5% level and the positive and negative impacts are reflected by the green and red colors, both for readability purposes. R-squared values vary between 2% and 23%. Block exogeneity shows the joint significance of all lags of all independent variables in each regression reported in Table 4. Respective p-values are small (<0.001) in all the regressions, indicating the existence of the joint significance.
The coefficients of RINTRADAY lags are significantly negative. This shows intraday returns are mean reverting. Moreover, the mean reverting behavior of intraday returns remained roughly the same, though with one lag delay, during the COVID-19 crash. Table 4 also reveals that the impacts of different investor types’ net purchases on intraday returns are limited and in a lagged form. Most of the investor types have either no return impacts or have impacts as late as four lags. Additionally, this result is more generalized by the COVID-19 outbreak, where we observe lesser price impacts. One of the most evident and intriguing findings concerns the impact of returns on the net purchases of examined investor types in the subsequent intraday periods. All the documented return effects on OSTB, NHFTF, HFTBr and NHFTBr disappeared, whereas HFTF (ONHFTB) was positively (negatively) affected by intraday returns. This shows that during the crash, any investor group revised its response to returns.
Before the COVID-19 market crash, foreign investors involved in HFT (HFTF) used to respond negatively to most other types of investors (i.e., OSTB, OHFTB, ONHFTB, HFTBr and NHFTBr) in the subsequent 5 min period and positively in the subsequent third period while this cyclical pattern disappeared during the crash. Instead, we document a second-lag positive impact of three investor groups (OHFTB, HFTBr and NHFTBr) on HFTF during the market crash. This signals a change in the attitude of HFTF vis-à-vis certain domestic investors. It is interesting to note that the long-lasting persistence on the net purchases of foreign investors (both HFTF and NHFTF) has not changed during the crash.
In the pre-crash period, net purchases of bank-owned brokers without access to colocation and trading another bank’s stock (ONHFTB) were larger just following the net purchases of any of the remaining investor groups (positive coefficients in first lags). This relation totally disappeared during the crash period, where we observe delayed and oscillating responses to other investors.
Before COVID-19, bank-owned brokers with access to colocation and trading another bank’s stock (OHFTB) reacted negatively to the preceding net purchases of foreign investors (both HFTF and NHFTF) and to non-bank-owned brokers without access to colocation (NHFTBr) while this pattern disappeared during the crash.
During the crash, net purchases of NHFTBr started to follow those of other investors and this usually pursued two lags before turning to negative in the third lag. This reveals that during the crash, most retail (individual) investors were influenced more from other (institutional) investors who are likely to be more professional.
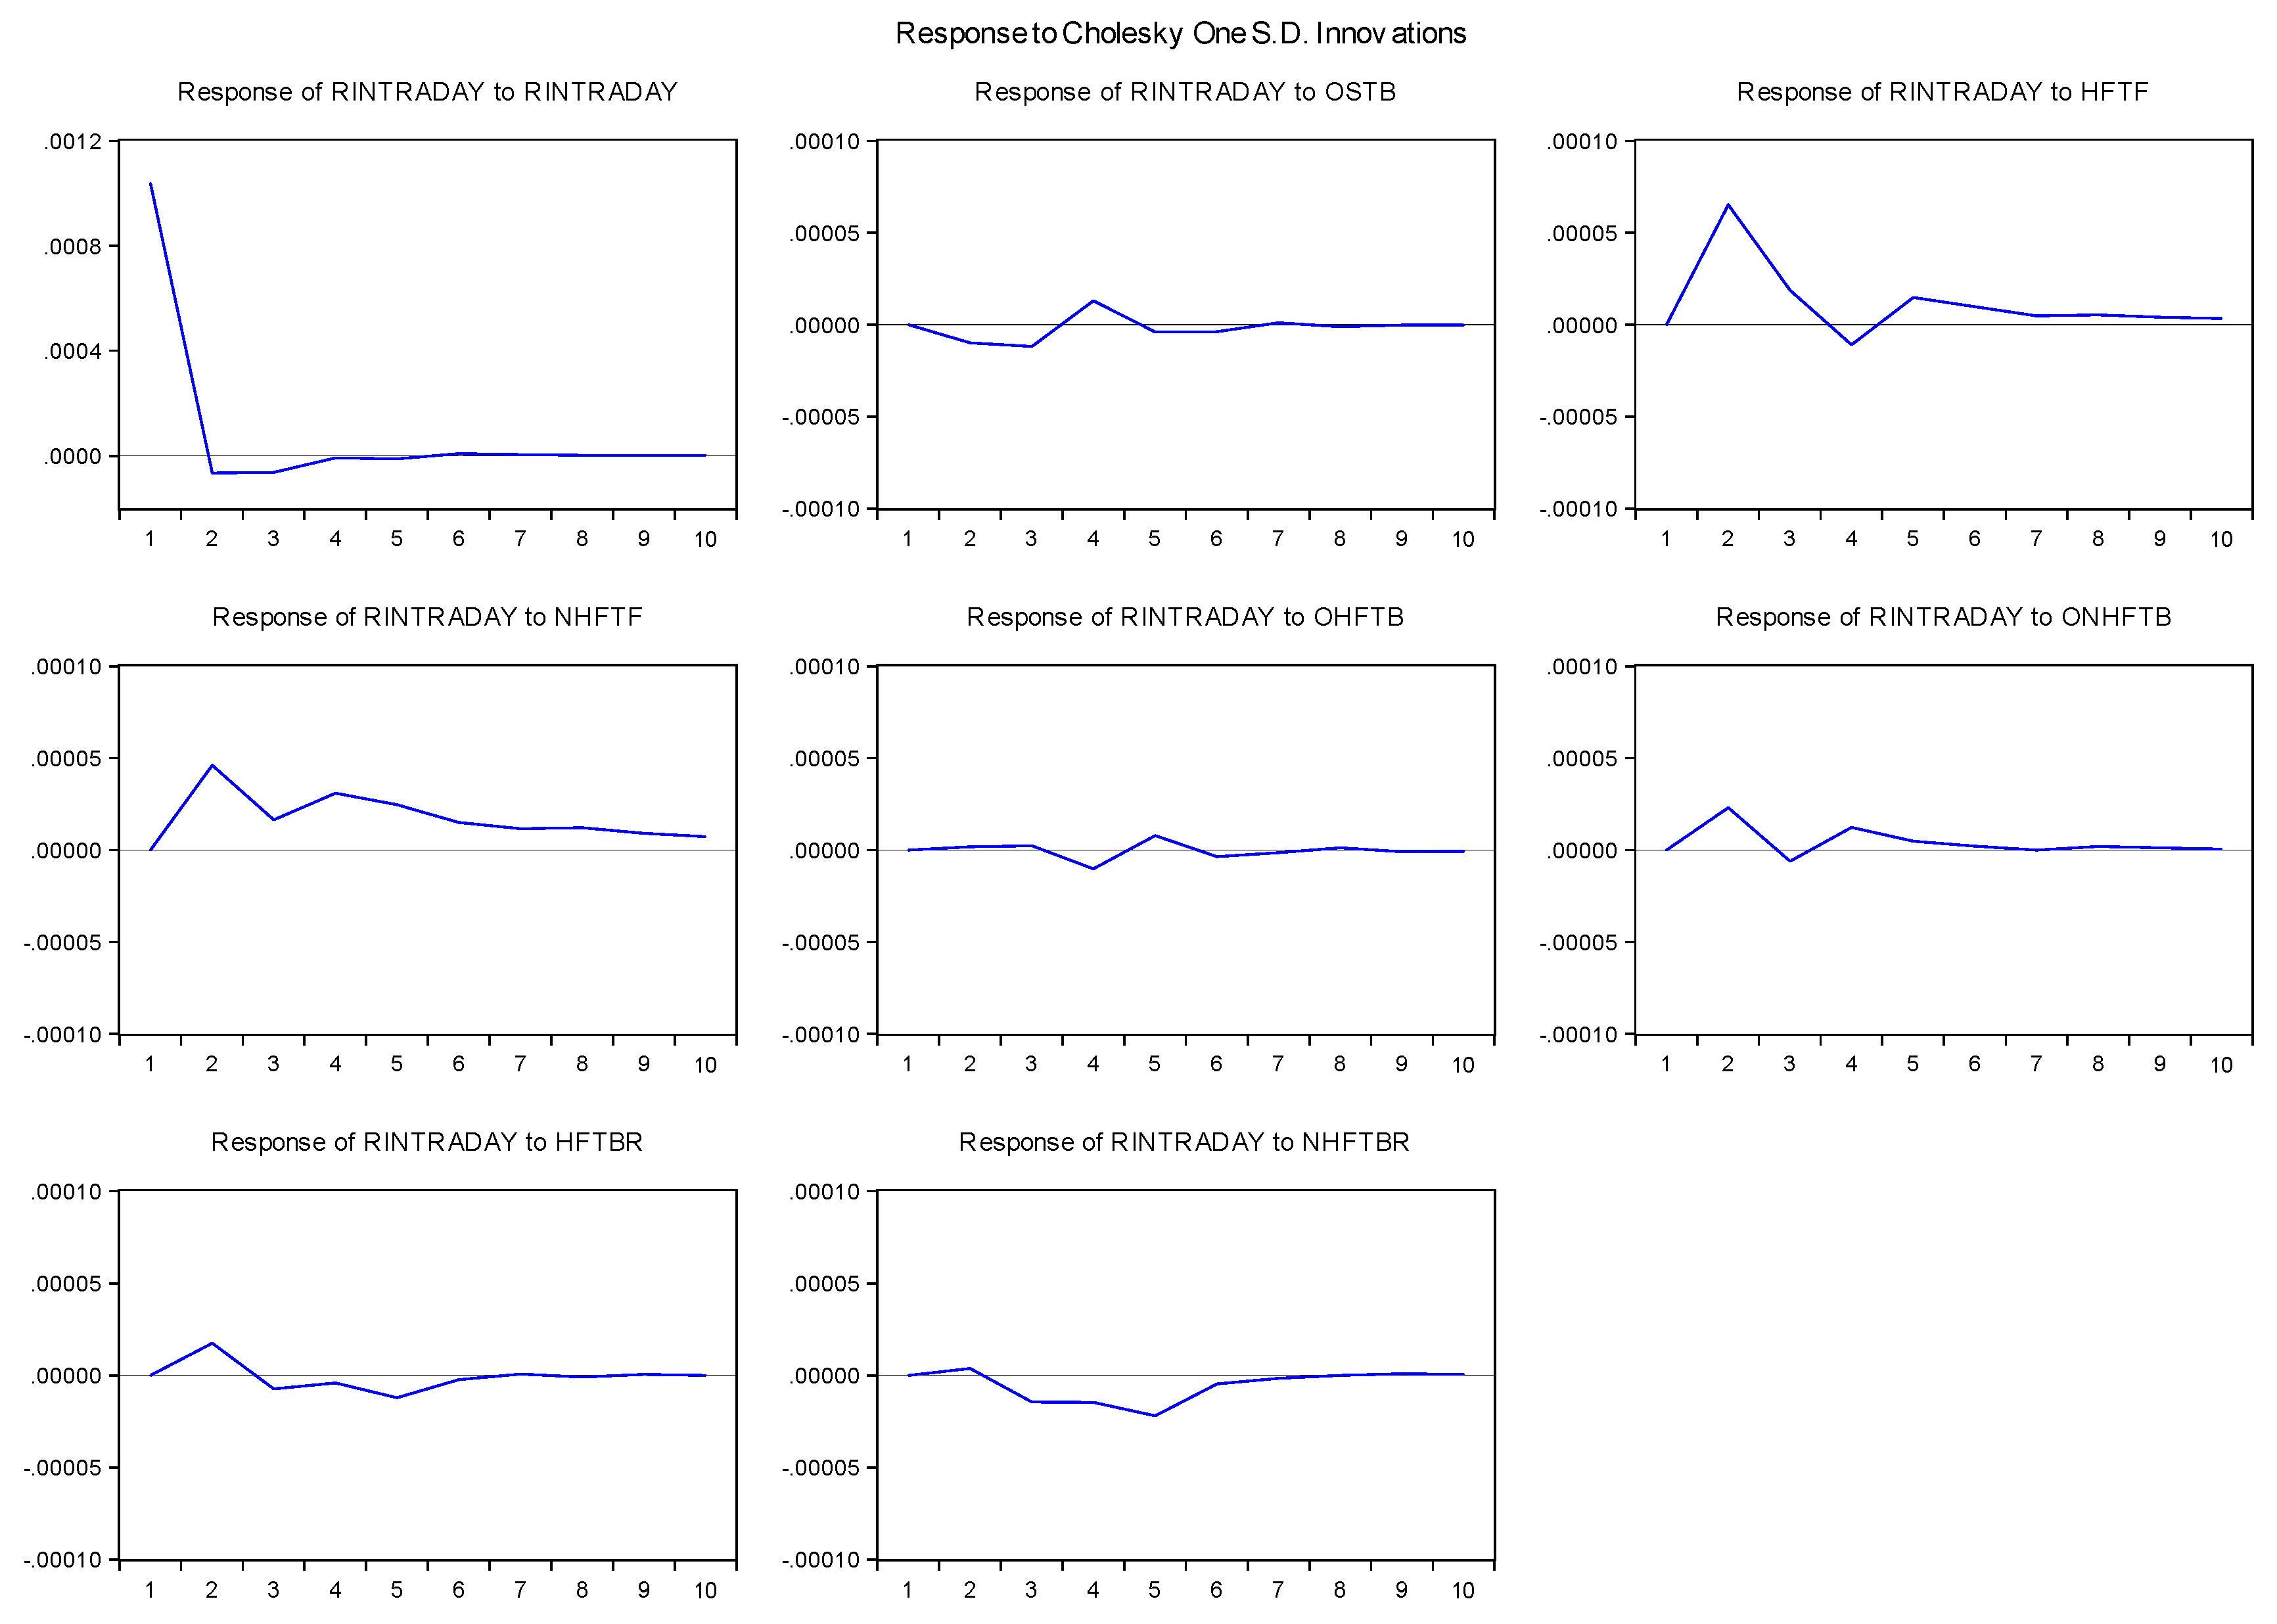
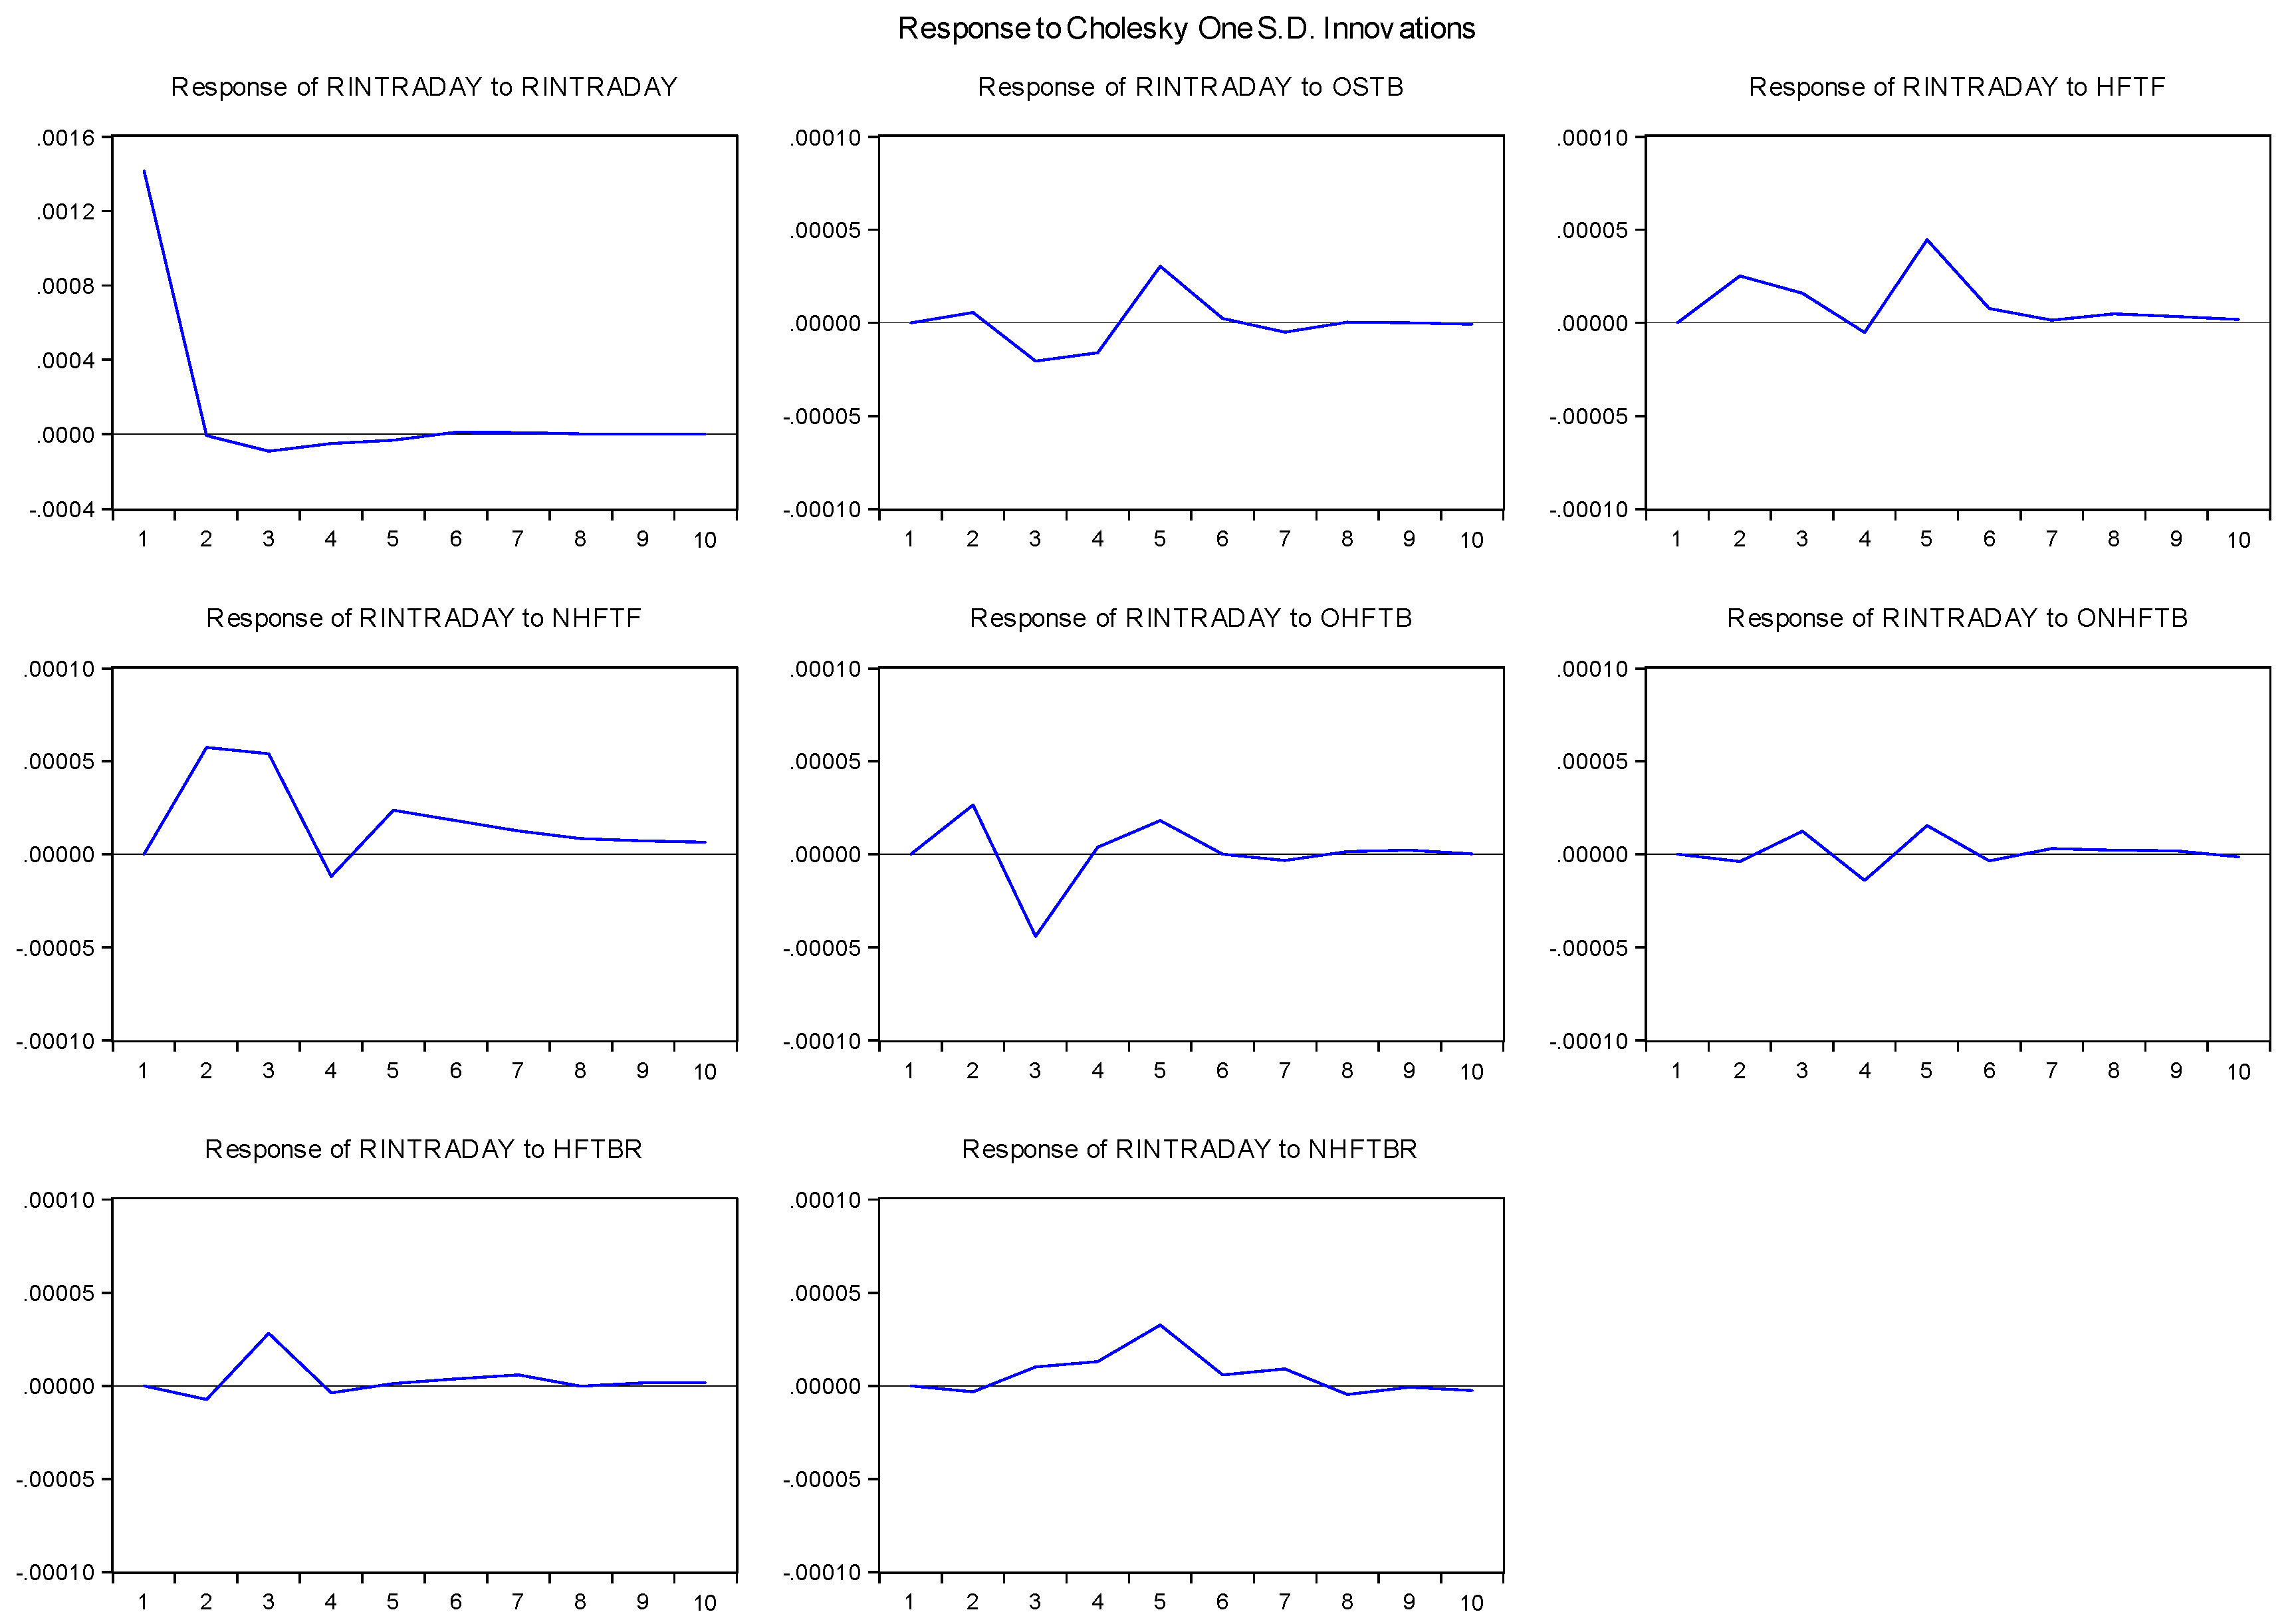
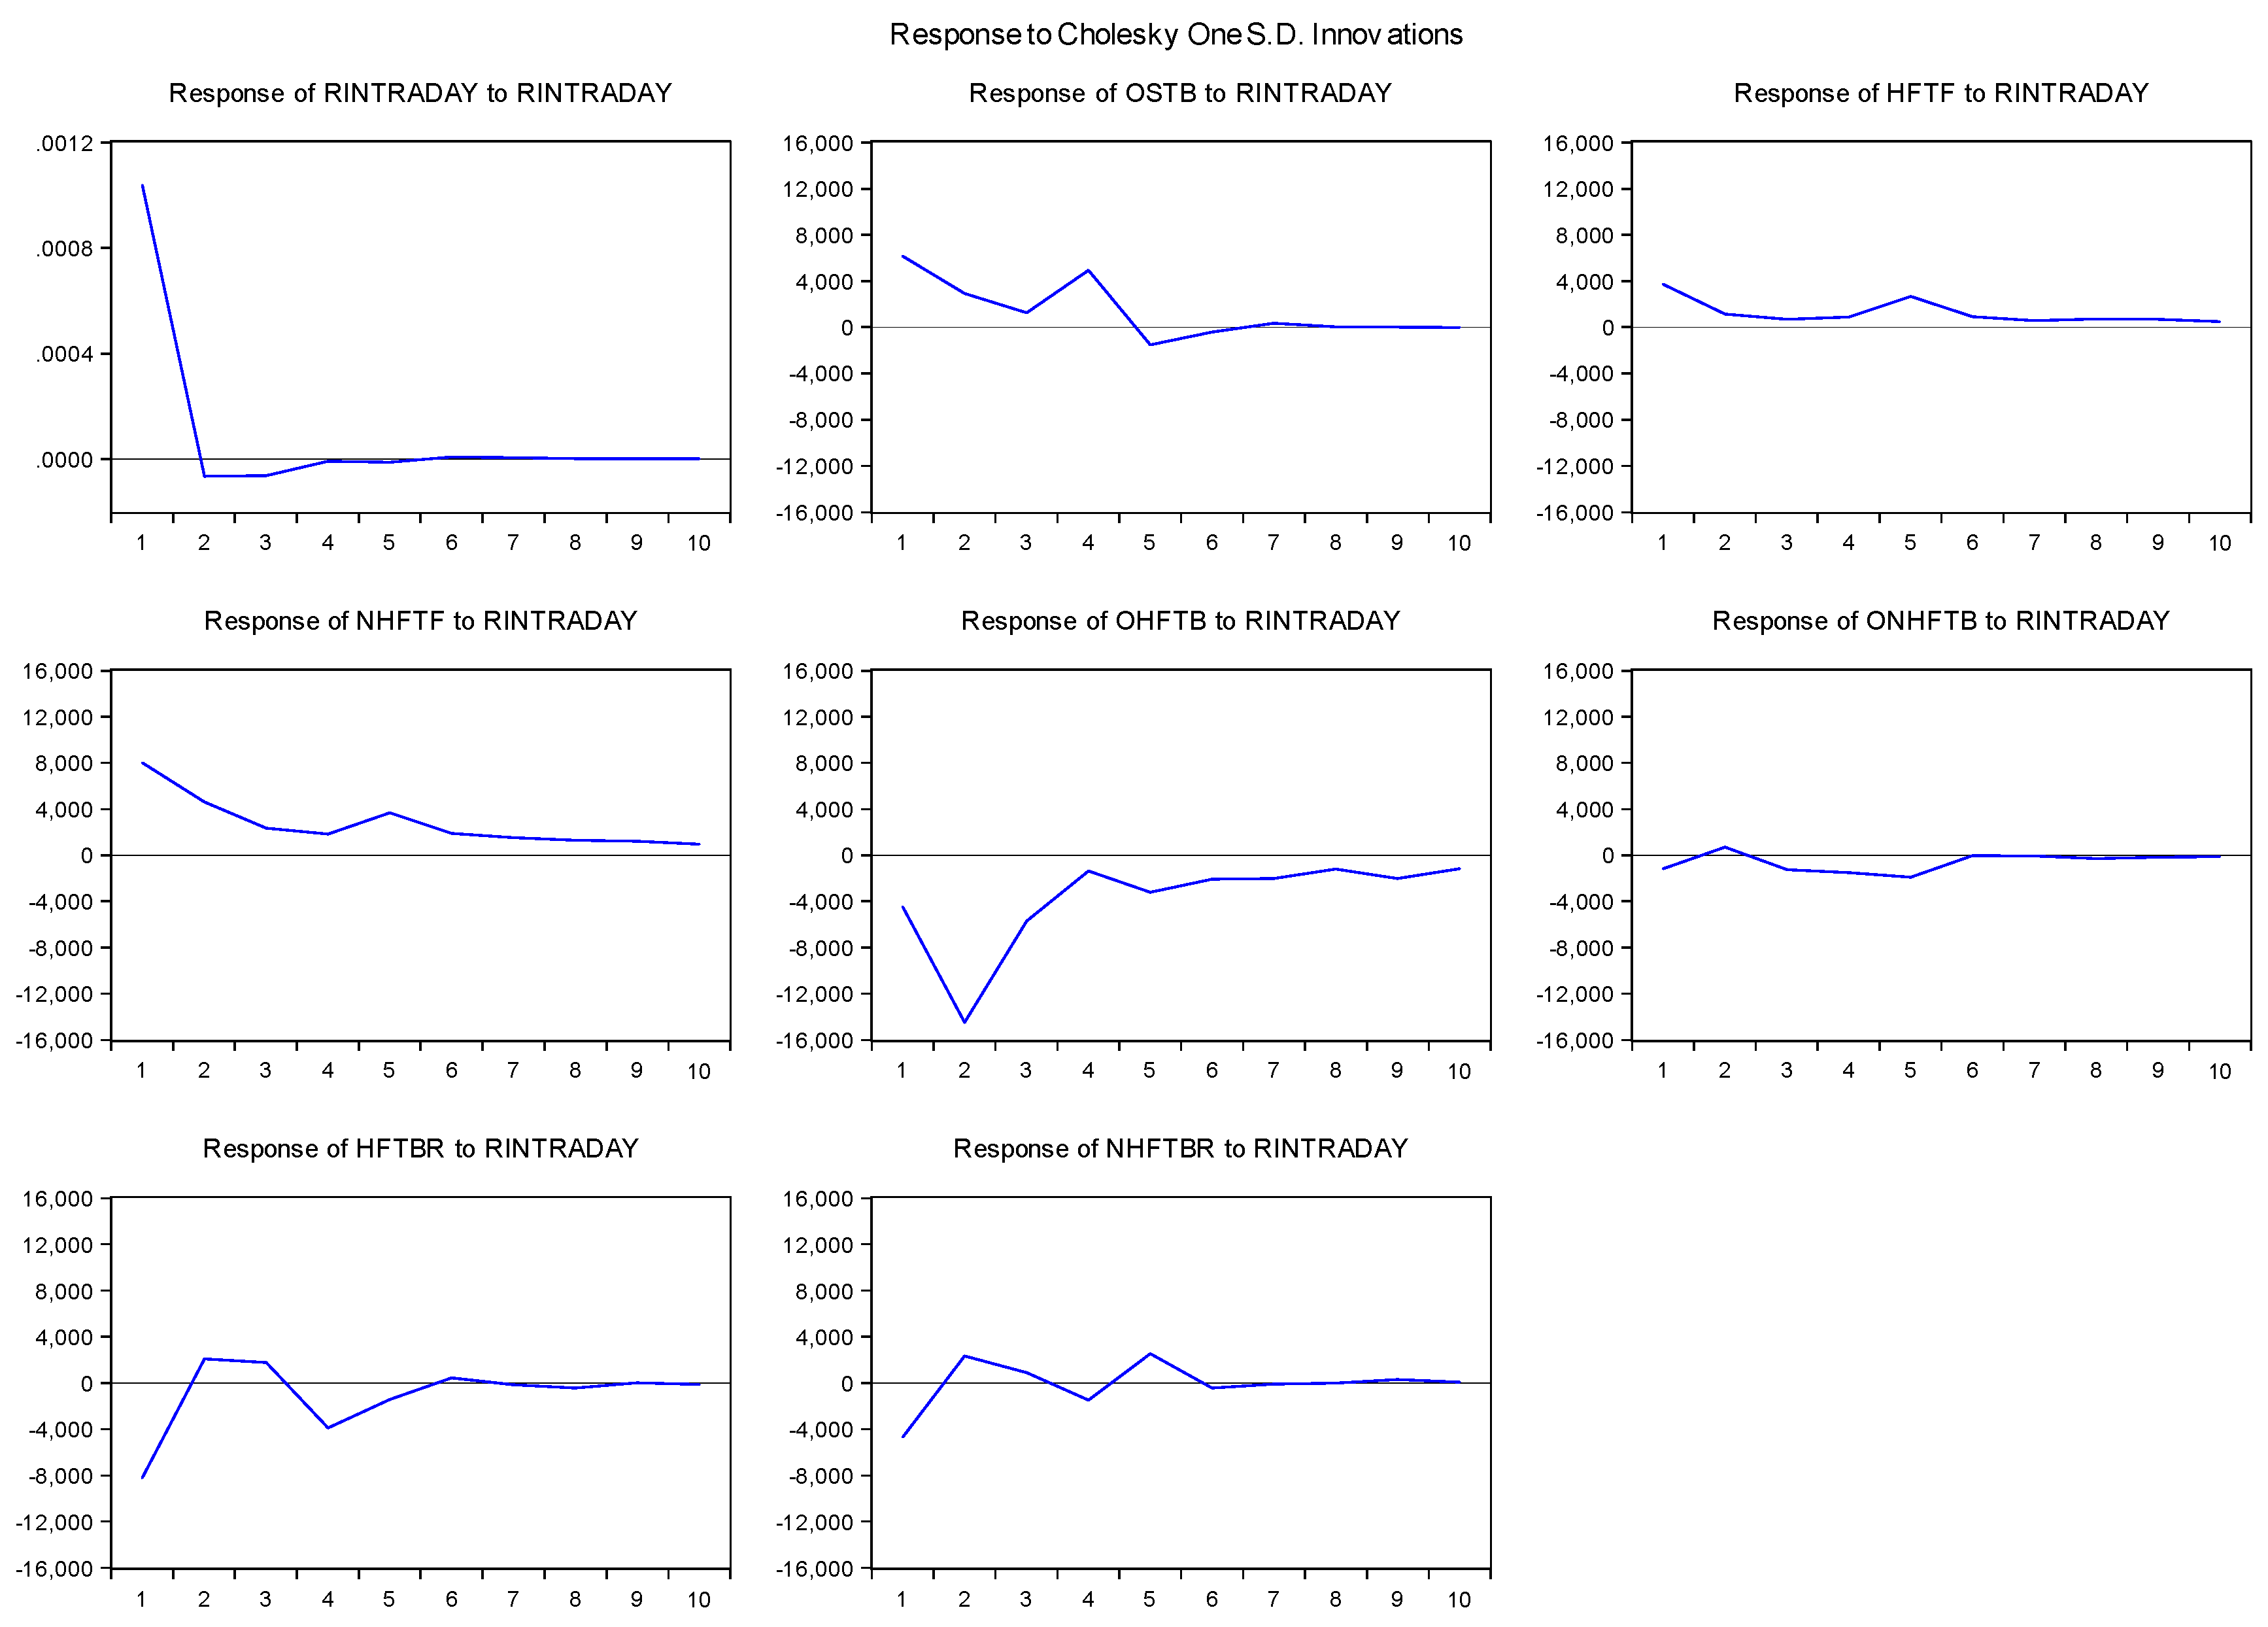
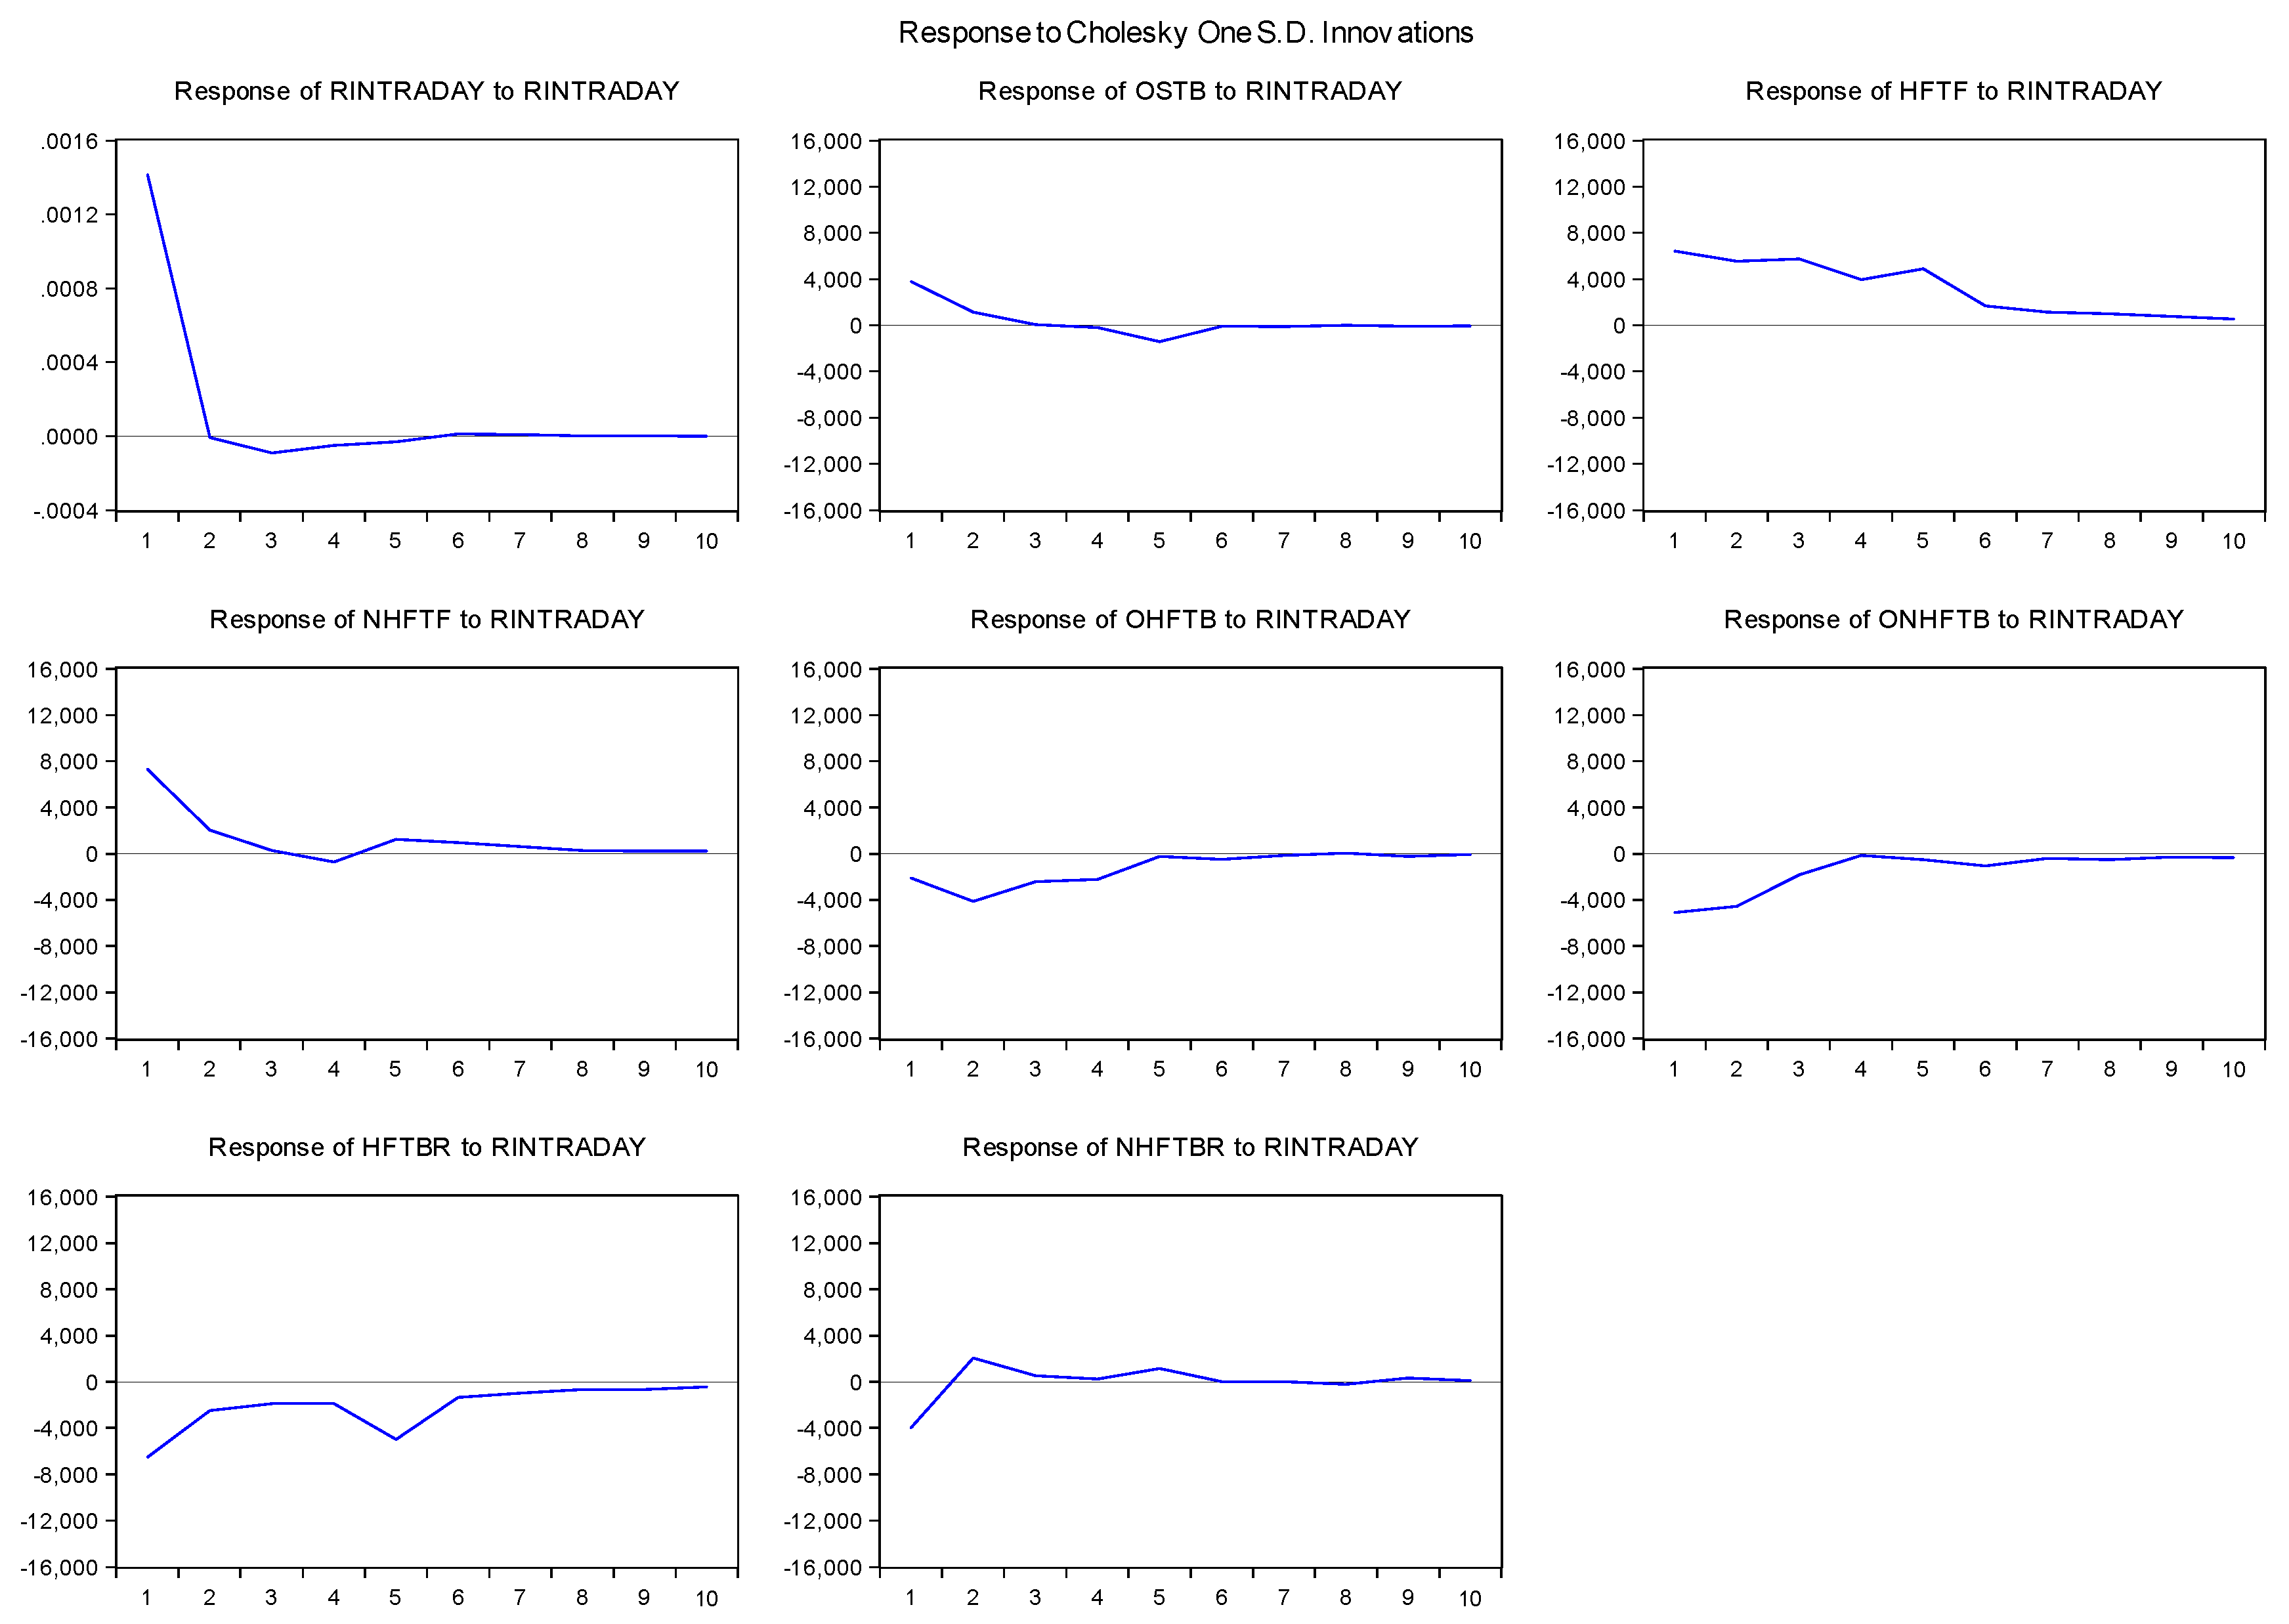
To shed more light on the relationship between intraday returns and various investor types’ net trading, Figure A1, Figure A2, Figure A3 and Figure A4 in Appendix A plot the impulse response graphs. Figure A1 and Figure A2 show the response of intraday returns to shocks in returns itself as well as in the net purchases of each examined investor type, before and during COVID-19, respectively. Figure A3 and Figure A4 show the opposite counterparts in both periods: the responses of each investor types’ net purchases to a shock in intraday returns. Conventionally, the shock used in all figures is in the magnitude of one standard deviation of the variable in focus. A broad comparison of Figure A1 and Figure A2 does not signal dramatic discrepancies, implying relatively limited changes in responses with the outbreak of the pandemic. An exception is the response of intraday returns to NHFTBr, i.e., net purchases of non-bank-owned brokers not involved in HFT (the last chart among eight in either figure). Accordingly, upon a shock in the net purchase of NHFTBr observed before the outbreak of the pandemic, returns gradually decline for few periods before recovering back to steady state level. During COVID-19, however, returns respond oppositely to a shock in this investor group’s activity, i.e., experience a gradual increase followed by a recovery only in subsequent periods.
Analysis of Figure A3 and Figure A4 regarding the responses of investors to price changes reveal interesting results. There are marginal changes in how certain investor groups react to shocks in intraday returns (i.e., non-bank-owned brokers and brokers serving foreign investors: HFTF, NHFTF, HFTBr, NHFTBr). The observed changes are in the form of a slightly extended fading period of the responses or moderately changed persistence of responses over the first few periods following the shock. On the other hand, the responses of other investor types to a one standard deviation change in returns are altered to larger extent due to the pandemic. For example, bank-owned brokers trading another bank’s stocks (OHFTB and ONHFTB) become more sensitive to a shock in intraday returns that is reflected by sharp changes in the first few intraday periods upon the shock in Figure A4.
5. Discussion
Our findings regarding the significant interactions of various investor types as well as the findings on COVID-19-driven changes to these interactions are in support of earlier evidence. A wide stream of studies has previously documented the altered behavior of different investor groups during the recent COVID-19 pandemic. For example, Ozik et al. (2021) and Djalilov and Ülkü (2021) provide evidence regarding retail investors; Glossner et al. (2022) regarding institutional investors; Bing and Ma (2021) regarding individual and institutional investors; and Banerjee and Nawn (2024) regarding HFTs and non-HFTs. Given such changes in each group’s trading, the observed interactions of different investor types are also likely to be altered through the outbreak of the pandemic. Our findings on these altered impacts are related to earlier works arguing for the exaggerated herding behavior during uncertain and hard-to-decide times (Bekiros et al. 2017; Aharon 2020). Similarly, Au et al. (2023) show that social connectedness has affected the trading behavior of mutual fund managers during the pandemic. Managers located in or socially connected to COVID-19 hotspots sold more of their holdings when compared to others. Our findings on the altered interactions of investor types and the returns during the COVID-19 pandemic enable us to reject the null hypothesis in Hypothesis 3 (Section 3) for the aforementioned investor types. Similarly, as in the aforementioned discussion, the existence of certain investors’ impacts on other investors is validated (Hypothesis 2).
Our finding of the limited and lagged impacts of investor types’ trading on intraday returns is in line with the literature. In a closely related work, Ülkü and Weber (2013) find net trading of private funds do not forecast returns while banks and pension funds maintain limited price impact of their trades. Therefore, we support the limited price impact of institutional investors argument by providing new evidence for banks, brokerage firms, high-frequency traders and foreign institutions. In other words, we can provide limited evidence in rejecting Hypothesis 1a that claims no short-term effects of investors on returns.
It is previously documented in the literature that foreign investors might follow positive feedback trading strategies (e.g., Brennan and Cao 1997; Griffin et al. 2004; Jinjarak et al. 2011). This is partly approved by the findings of our paper. We provide partial evidence (only for certain investor types) in rejecting Hypothesis 1b that states no impact of returns on the trading of investor types. Two investor groups considered foreign in our dataset are brokers with and without colocation access both serving foreign clients (HFTF and NHFTF). Net purchases of the first group are affected by lagged returns both before and during the COVID-19 intervention. The activity of the second group (NHFTF) is affected only by one-lagged returns before the pandemic while no impact remains after the outbreak.
6. Conclusions
In this study, we classify in a novel way various investor groups such as foreigners, high-frequency traders, investors making transactions through bank-owned and non-bank-owned brokers as well as their joint combinations based upon the brokers that executed the trades. Then, on four major bank stocks from Borsa Istanbul and with a panel vector autoregression model (utilizing the net purchases of each investor type as well as intraday returns), we measure reciprocal impacts and compare the results for the periods before and after the apparition of market crash due to the COVID-19 pandemic.
This investigation is important because understanding the response of others in a strategic game offers advantage for any player. Although the literature offers studies about the interaction between different investor types, no prior studies exist combining different participants such as foreign investors doing/not doing HFT or bank-owned brokers involved/not involved in HFT. Moreover, analyzing this interaction during a special period, i.e., the pandemic, provides original results.
We mainly conclude that the COVID-19 market crash resulted in changes in the behavior of certain investor types. More specifically, foreign investors not involved in HFT did not change while all other investor types altered their trading behavior. In particular, retail investors following others became more apparent; institutional trades not involved in HFT kept their attitude but delayed by one period (five minutes); and domestic HFT reversed while foreign HFT neutralized its response to others.
The results mostly confirm that various market participants do have an impact on each other in terms of affecting one’s net stock purchases and these impacts partially altered during the market crash caused by the COVID-19 pandemic. When generalized for other periods, these results can be useful for fund managers, portfolio managers, other investors and policymakers who are curious about the trading intention of different investors. Moreover, corporate managers of listed banks can consider the impact of various investor types on stock returns when promoting their stock in the market and trying to attract investors.
This study has several limitations. First, we label a trade as an HFT trade if the executing broker is a member of the colocation service. While HFT activity is conducted through colocation services, non-HFT activities of the same broker can also be applied through colocation. This can lead to a certain amount of noise in our investor-type proxy. However, we expect that our findings would be even more robust if we had the ability to distinguish the non-HFT activity of HFT brokers. Second, our study employs a dataset of banking stocks listed in an emerging market, Borsa Istanbul. As discussed in Section 2, these choices are due to the availability of special data in this market and special settings in this sector. Nevertheless, this can be considered a limitation as our results could have greater validity with the inclusion of other sectors and/or stock markets. Finally, we analyzed the time period from 2 January 2020 to 23 March 2020 (58 trading days) with the main intention of observing any effects of the COVID-19 emergence. While the selected period well suits the needs of the main goal of this study, extended periods could include different dynamics and events. Therefore, it can be considered a limitation.
Future research can conduct studies with broader scope and more up-to-date data. For example, extended data with stocks from different sectors and markets can be utilized in future studies. Similarly, while we work with multiple types of investors in this study, inclusion of other investor categories or subcategories (e.g., retail investors, arbitrageurs, informed traders) in future works can contribute to this branch of the literature. Future research can also investigate the interactions of different investor types through extended time periods, e.g., later stages of the pandemic and post-pandemic. While we prefer to work with 5 min intervals, future research analyzing developed markets with ultrafast trading speeds and excessive trading volumes can look into interactions at higher frequencies of seconds. Finally, future research can study the determinants and impacts of interactions among investor types.
Author Contributions
Conceptualization, C.E.; methodology, C.E. and O.E.; formal analysis, C.E. and O.E.; data curation, C.E.; writing—original draft preparation, C.E. and O.E.; writing—review and editing, C.E. and O.E.; funding acquisition, C.E. All authors have read and agreed to the published version of the manuscript.
Funding
This research was funded by the Scientific Research Projects Department of Istanbul Technical University (Project Number: SHD-2022-44334).
Informed Consent Statement
Not applicable.
Data Availability Statement
Dataset available on request from the authors.
Acknowledgments
We acknowledge the assistance of Mehmet Bodur and the data support by ITU Finance Lab.
Conflicts of Interest
The authors declare no conflicts of interest.
Appendix A
Figure A1.
Response of Return to the Net Purchase of Different Investor Types Before COVID-19.

Figure A2.
Response of Return to the Net Purchase of Different Investor Types During COVID-19.

Figure A3.
Response of the Net Purchase of Different Investor Types to Return Before COVID-19.

Figure A4.
Response of the Net Purchase of Different Investor Types to Return During COVID-19.

References
- Aharon, David Y. 2020. Uncertainty, Fear and Herding Behavior: Evidence from Size-Ranked Portfolios. Journal of Behavioral Finance 22: 320–37. [Google Scholar] [CrossRef]
- Al-Nefaie, Abdullah H., and Theyazn H. H. Aldhyani. 2022. Predicting Close Price in Emerging Saudi Stock Exchange: Time Series Models. Electronics 11: 3443. [Google Scholar] [CrossRef]
- Arellano, Manuel, and Olympia Bover. 1995. Another look at the instrumental variable estimation of error-components models. Journal of Econometrics 68: 29–51. [Google Scholar] [CrossRef]
- Au, Shiu-Yik, Ming Dong, and Xinyao Zhou. 2023. Does Social Interaction Spread Fear Among Institutional Investors? Evidence from Coronavirus Disease 2019. Management Science. [Google Scholar] [CrossRef]
- Banerjee, Anirban, and Samarpan Nawn. 2024. Proprietary algorithmic traders and liquidity supply during the pandemic. Finance Research Letters 61: 105052. [Google Scholar] [CrossRef]
- Barber, Brad M., and Terrance Odean. 2008. All that glitters: The effect of attention and news on the buying behavior of individual and institutional investors. The Review of Financial Studies 21: 785–818. [Google Scholar] [CrossRef]
- Bekiros, Stelios, Mouna Jlassi, Bryan Lucey, Kamel Naoui, and Gazi Salah Uddin. 2017. Herding behavior, market sentiment and volatility: Will the bubble resume? The North American Journal of Economics and Finance 42: 107–31. [Google Scholar] [CrossRef]
- Biais, Bruno, Thierry Foucault, and Sophie Moinas. 2015. Equilibrium fast trading. Journal of Financial Economics 116: 292–313. [Google Scholar] [CrossRef]
- Bing, Tao, and Hongkun Ma. 2021. COVID-19 pandemic effect on trading and returns: Evidence from the Chinese stock market. Economic Analysis and Policy 71: 384–396. [Google Scholar] [CrossRef]
- Brennan, Michael J., and H. Henry Cao. 1997. International portfolio flows. Journal of Finance 52: 1851–80. [Google Scholar] [CrossRef]
- Brogaard, Jonathan, Allen Carrion, Thibaut Moyaert, Ryan Riordan, Andriy Shkilko, and Konstantin Sokolov. 2018. High frequency trading and extreme price movements. Journal of Financial Economics 128: 253–65. [Google Scholar] [CrossRef]
- Brogaard, Jonathan, Terrence Hendershott, and Ryan Riordan. 2014. High-frequency trading and price discovery. The Review of Financial Studies 27: 2267–306. [Google Scholar] [CrossRef]
- Celik, Mehmet S., Mutlu B. Ozturk, and Ozkan Haykir. 2024. The effect of technological developments on the stock market: Evidence from emerging market. Applied Economics Letters 31: 118–21. [Google Scholar] [CrossRef]
- Choe, Hyuk, Bong-Chan Kho, and René M. Stulz. 1999. Do foreign investors destabilize stock markets? The Korean experience in 1997. Journal of Financial Economics 54: 227–64. [Google Scholar] [CrossRef]
- Chung, Kee H., and Chairat Chuwonganant. 2023. COVID-19 Pandemic and the stock market: Liquidity, price efficiency, and trading. Journal of Financial Markets 64: 100803. [Google Scholar] [CrossRef]
- Coval, Joshua D., and Tobias J. Moskowitz. 1999. Home bias at home: Local equity preference in domestic portfolios. The Journal of Finance 54: 2045–73. [Google Scholar] [CrossRef]
- Dalgıç, Nihan, Cumhur Ekinci, and Oğuz Ersan. 2021. Daily and intraday herding within different types of investors in Borsa Istanbul. Emerging Markets Finance and Trade 57: 1793–810. [Google Scholar] [CrossRef]
- Djalilov, Abdulaziz, and Numan Ülkü. 2021. Individual investors’ trading behavior in Moscow Exchange and the COVID-19 crisis. Journal of Behavioral and Experimental Finance 31: 100549. [Google Scholar] [CrossRef] [PubMed]
- Dospatliev, Lilko, Miroslava Ivanova, and Milen Varbanov. 2022. Effects of COVID-19 Pandemic on the Bulgarian Stock Market Returns. Axioms 11: 94. [Google Scholar] [CrossRef]
- Dospinescu, Nicoleta, and Octavian Dospinescu. 2019. A Profitability Regression Model in Financial Communication of Romanian Stock Exchange’s Companies. Ecoforum Journal 8: 1–4. [Google Scholar]
- Dvorak, Tomas. 2005. Do domestic investors have an information advantage? Evidence from Indonesia. The Journal of Finance 60: 817–39. [Google Scholar] [CrossRef]
- Foucault, Thierry, David Sraer, and David J. Thesmar. 2011. Individual investors and volatility. The Journal of Finance 66: 1369–406. [Google Scholar] [CrossRef]
- Foucault, Thierry, Roman Kozhan, and Wing Wah Tham. 2017. Toxic arbitrage. The Review of Financial Studies 30: 1053–94. [Google Scholar] [CrossRef]
- Frijns, Bart, Alireza Tourani-Rad, and Robert I. Webb. 2016. On the intraday relation between the VIX and its futures. Journal of Futures Markets 36: 870–86. [Google Scholar] [CrossRef]
- Gao, Bin, and Xihua Liu. 2020. Intraday sentiment and market returns. International Review of Economics & Finance 69: 48–62. [Google Scholar]
- Glossner, Simon, Pedro Matos, Stefano Ramelli, and Alexander F. Wagner. 2022. Do Institutional Investors Stabilize Equity Markets in Crisis Periods? Evidence from COVID-19. Available online: https://ssrn.com/abstract=3655271 (accessed on 2 February 2024). [CrossRef]
- Griffin, John M., Federico Nardari, and René M. Stulz. 2004. Are daily cross-border equity flows pushed or pulled? Review of Economics and Statistics 86: 641–57. [Google Scholar] [CrossRef]
- Griffin, John M., Jeffrey H. Harris, and Selim Topaloglu. 2003. The dynamics of institutional and individual trading. The Journal of Finance 58: 2285–320. [Google Scholar] [CrossRef]
- Grinblatt, Mark, and Matti Keloharju. 2000. The investment behavior and performance of various investor types: A study of Finland’s unique data set. Journal of Financial Economics 55: 43–67. [Google Scholar] [CrossRef]
- Grinblatt, Mark, and Matti Keloharju. 2001. How distance, language, and culture influence stockholdings and trades. The Journal of Finance 56: 1053–73. [Google Scholar] [CrossRef]
- Hasbrouck, Joel. 2018. High-Frequency Quoting: Short-Term Volatility in Bids and Offers. Journal of Financial and Quantitative Analysis 53: 613–41. [Google Scholar] [CrossRef]
- Henker, Julia, and Thomas Henker. 2010. Are retail investors the culprits? Evidence from Australian individual stock price bubbles. The European Journal of Finance 16: 281–304. [Google Scholar] [CrossRef]
- Hu, Wu-Yueh, Chih-Jen Huang, Heng-Yu Chang, and Wei-Ju Lin. 2015. The effect of investor sentiment on feedback trading and trading frequency: Evidence from Taiwan intraday data. Emerging Markets Finance and Trade 51: S111–20. [Google Scholar] [CrossRef]
- Huberman, Gur. 2001. Familiarity breeds investment. The Review of Financial Studies 14: 659–80. [Google Scholar] [CrossRef]
- Jinjarak, Yothin, Jon Wongswan, and Huanhuan Zheng. 2011. International fund investment and local market returns. Journal of Banking and Finance 35: 572–87. [Google Scholar] [CrossRef]
- Kamesaka, Akiko, John R. Nofsinger, and Hidetaka Kawakita. 2003. Investment patterns and performance of investor groups in Japan. Pacific-Basin Finance Journal 11: 1–22. [Google Scholar] [CrossRef]
- Kang, Jun-Koo, and René M. Stulz. 1997. Why is there a home bias? An analysis of foreign portfolio equity ownership in Japan. Journal of Financial Economics 46: 3–28. [Google Scholar] [CrossRef]
- Kirilenko, Andrei, Albert S. Kyle, Mehrdad Samadi, and Tugkan Tuzun. 2017. The flash crash: High-frequency trading in an electronic market. The Journal of Finance 72: 967–98. [Google Scholar] [CrossRef]
- Kumar, Alok, and Charles M. C. Lee. 2006. Retail investor sentiment and return comovements. The Journal of Finance 61: 2451–86. [Google Scholar] [CrossRef]
- Lee, Yi-Tsung, Ji-Chai Lin, and Yu-Jane Liu. 1999. Trading patterns of big versus small players in an emerging market: An empirical analysis. Journal of Banking and Finance 23: 701–25. [Google Scholar] [CrossRef]
- Mahmoodzadeh, Soheil, and Ramazan Gençay. 2017. Human vs. high-frequency traders, penny jumping, and tick size. Journal of Banking and Finance 85: 69–82. [Google Scholar] [CrossRef]
- Menkveld, Albert J. 2014. High-frequency traders and market structure. Financial Review 49: 333–444. [Google Scholar] [CrossRef]
- Ng, Lilian, and Fei Wu. 2007. The trading behavior of institutions and individuals in Chinese equity markets. Journal of Banking and Finance 31: 2695–710. [Google Scholar] [CrossRef]
- Nguyen, Huan Huu, Vu Minh Ngo, and Uyen Dinh Hoang Nguyen. 2023. The foreign investors’ behaviours during the COVID-19 Pandemic in emerging market. Applied Economics Letters 30: 384–90. [Google Scholar] [CrossRef]
- Ozik, Gideon, Ronnie Sadka, and Siyi Shen. 2021. Flattening the illiquidity curve: Retail trading during the COVID-19 lockdown. Journal of Financial and Quantitative Analysis 56: 2356–88. [Google Scholar] [CrossRef]
- Panyagometh, Kamphol. 2020. The Effects of Pandemic Event on the Stock Exchange of Thailand. Economies 8: 90. [Google Scholar] [CrossRef]
- Phansatan, Suwipa, John G. Powell, Suparatana Tanthanongsakkun, and Sirimon Treepongkaruna. 2012. Investor type trading behavior and trade performance: Evidence from the Thai stock market. Pacific-Basin Finance Journal 20: 1–23. [Google Scholar] [CrossRef]
- Richards, Anthony. 2005. Big fish in small ponds: The trading behavior and price impact of foreign investors in Asian emerging equity markets. Journal of Financial and Quantitative Analysis 40: 1–27. [Google Scholar] [CrossRef]
- Salisu, Afees A., and Xuan Vinh Vo. 2020. Predicting stock returns in the presence of COVID-19 Pandemic: The role of health news. International Review of Financial Analysis 71: 101546. [Google Scholar] [CrossRef]
- Shapira, Zur, and Itzhak Venezia. 2001. Patterns of behavior of professionally managed and independent investors. Journal of Banking and Finance 25: 1573–87. [Google Scholar] [CrossRef]
- Strauß, Nadine, Rens Vliegenthart, and Piet Verhoeven. 2018. Intraday news trading: The reciprocal relationships between the stock market and economic news. Communication Research 45: 1054–77. [Google Scholar] [CrossRef]
- Ülkü, Numan, and Enzo Weber. 2013. Identifying the interaction between stock market returns and trading flows of investor types: Looking into the day using daily data. Journal of Banking & Finance 37: 2733–49. [Google Scholar]
- Ülkü, Numan, Fahad Ali, Saidgozi Saydumarov, and Deniz Ikizlerli. 2023. COVID caused a negative bubble. Who profited? Who lost? How stock markets changed? Pacific-Basin Finance Journal 79: 102044. [Google Scholar] [CrossRef]
- Xu, Libo. 2021. Stock Return and the COVID-19 Pandemic: Evidence from Canada and the US. Finance Research Letters 38: 101872. [Google Scholar] [CrossRef] [PubMed]
Figure 1.
XBANK Index Before and During COVID-19 Market Crash.

Figure 2.
Classification of investor groups.


Table 1.
Summary statistics of banks listed in Borsa Istanbul.
| Indicator | Panel A. Banks in the Sample | Panel B. Banks Not Included in the Sample | |||||||||
|---|---|---|---|---|---|---|---|---|---|---|---|
| AKBNK | GARAN | ISCTR | YKBNK | VAKBN | HALKB | TSKB | QNBFB | SKBNK | ICBCT | ALBRK | |
| Number of domestic branches | 712 | 810 | 1066 | 779 | 940 | 1073 | 2 | 435 | 240 | 39 | 226 |
| Number of ATMs | 5202 | 5306 | 6555 | 4526 | 4222 | 4059 | 0 | 2842 | 393 | 43 | 294 |
| Number of employees | 12,140 | 18,486 | 22,890 | 15,795 | 16,821 | 20,042 | 392 | 10,837 | 3216 | 730 | 2918 |
| Total assets (bn USD) | 65.81 | 73.30 | 94.79 | 69.69 | 67.68 | 75.92 | 7.15 | 31.32 | 5.99 | 3.02 | 8.17 |
| Share of total assets among banks in Turkey (%) | 8.58 | 9.31 | 11.14 | 9.22 | 9.98 | 10.88 | 1.00 | 4.32 | 0.73 | 0.43 | 1.17 |
| Net profit (bn USD) | 0.91 | 1.06 | 1.20 | 0.66 | 0.70 | 0.40 | 0.12 | 0.46 | −0.03 | 0.01 | 0.03 |
| Share of net profit among banks in Turkey (%) | 11.62 | 13.22 | 13.02 | 7.72 | 6.01 | 3.69 | 1.51 | 5.63 | −1.47 | 0.09 | 0.17 |
| IPO year | 1990 | 1990 | 1987 | 1987 | 2006 | 2007 | 1996 | 1996 | 1997 | 1996 | 2007 |
| Free float ratio (%) | 59.06 | 50.15 | 32.83 | 38.35 | 25.31 | 48.89 | 44.39 | 0.12 | 20.55 | 7.16 | 46.61 |
| Avg market cap (bn USD) | 6.68 | 7.55 | 5.08 | 3.68 | 2.44 | 1.33 | 0.56 | 26.44 | 0.24 | 0.69 | 0.34 |
| Share of avg market cap in BIST (%) | 3.93 | 4.45 | 2.99 | 2.17 | 1.44 | 0.78 | 0.33 | 15.57 | 0.14 | 0.41 | 0.20 |
| Avg daily turnover (mn USD) | 45.50 | 90.24 | 29.04 | 48.95 | 33.74 | 60.78 | 15.97 | 1.27 | 6.57 | 13.81 | 24.36 |
| Share of avg daily turnover in BIST (%) | 1.63 | 3.25 | 1.05 | 1.73 | 1.22 | 2.31 | 0.59 | 0.04 | 0.27 | 0.49 | 1.03 |
| Avg daily number of trades (thousands) | 12.38 | 21.87 | 10.54 | 11.60 | 9.92 | 16.69 | 7.69 | 1.30 | 4.22 | 7.89 | 10.99 |
| Weight in the BIST 100 index | 6.24 | 6.58 | 2.83 | 2.32 | 1.22 | 1.39 | 0.48 | 0.16 | 0.18 | 0.10 | 0.21 |
| Stock beta | 1.31 | 1.35 | 1.23 | 1.24 | 1.52 | 1.34 | 1.07 | 1.89 | 1.29 | 1.11 | 1.14 |
| Number of analysts following the stock | 12 | 12 | 11 | 12 | 11 | 11 | 3 | 0 | 0 | 0 | 1 |
| Foreign ownership in floating shares (%) | 64.87 | 69.99 | 55.97 | 37.25 | 63.52 | 43.21 | 34.06 | 0.01 | 8.66 | 0.69 | 13.70 |
Notes: The source for corporate data and financial statements is the Banks Association of Türkiye (TBB), the one for trading statistics is LSEG Eikon, and the one for foreign ownership is Central Securities Depository & Trade Repository of Türkiye (MKK). Corporate data are for 2021, financial statements are for 2020 and other data (trading statistics and foreign ownership) are for the period of the analysis (from 2 January 2020 to 23 March 2020). Panel A (Panel B) shows the statistics of the banks used (not used) in the analysis.
Table 2.
Investor groups.
| Symbol | Investor Type | Definition |
|---|---|---|
| OSTB | Own Stock Trading Bank | Bank-owned broker with access to colocation, trading the owner bank’s stock |
| HFTF | HFT Foreign | Broker with access to colocation, serving to foreign investors |
| NHFTF | Non-HFT Foreign | Broker without access to colocation, serving to foreign investors |
| OHFTB | Other HFT Bank | Bank-owned broker with access to colocation, trading another bank’s stock |
| ONHFTB | Other Non-HFT Bank | Bank-owned broker without access to colocation, trading another bank’s stock |
| HFTBr | HFT Broker | Non-bank-owned broker with access to colocation |
| NHFTBr | Non-HFT Broker | Non-bank-owned broker without access to colocation |
Table 3.
Correlation matrix for intraday returns and net purchases of various investor types for pre-COVID-19 and COVID-19 crash periods.
Table 3.
Correlation matrix for intraday returns and net purchases of various investor types for pre-COVID-19 and COVID-19 crash periods.
| Panel A. Pre-COVID-19 Period (2 January–19 February 2020) | ||||||||
| RINTRADAY | OSTB | HFTF | NHFTF | OHFTB | ONHFTB | HFTBr | NHFTBr | |
| RINTRADAY | ||||||||
| OSTB | 0.01 * | |||||||
| HFTF | 0.09 *** | −0.16 *** | ||||||
| NHFTF | 0.12 *** | −0.03 *** | 0.05 *** | |||||
| OHFTB | −0.01 | −0.47 *** | −0.28 *** | −0.22 *** | ||||
| ONHFTB | −0.02 ** | −0.06 *** | −0.06 *** | −0.09 *** | −0.23 *** | |||
| HFTBr | −0.09 *** | −0.07 *** | −0.15 *** | −0.13 *** | −0.41 *** | −0.02 ** | ||
| NHFTBr | −0.08 *** | −0.02 ** | −0.12 *** | −0.06 *** | −0.31 *** | 0.00 | −0.02 ** | |
| Panel B. COVID-19 Crash Period (20 February–23 March 2020) | ||||||||
| RINTRADAY | OSTB | HFTF | NHFTF | OHFTB | ONHFTB | HFTBr | NHFTBr | |
| RINTRADAY | ||||||||
| OSTB | 0.03 *** | |||||||
| HFTF | 0.02 * | −0.09 *** | ||||||
| NHFTF | 0.10 *** | −0.09 *** | −0.12 *** | |||||
| OHFTB | −0.04 *** | −0.31 *** | −0.25 *** | −0.18 *** | ||||
| ONHFTB | −0.05 *** | −0.12 *** | −0.06 *** | −0.09 *** | −0.11 *** | |||
| HFTBr | −0.01 | −0.16 *** | −0.15 *** | −0.01 | −0.45 *** | −0.10 *** | ||
| NHFTBr | −0.00 | −0.11 *** | −0.11 *** | 0.03 *** | −0.46 *** | −0.04 *** | −0.02 | |
Notes: *, ** and *** indicate significance at 10%, 5% and 1%, respectively.
Table 4.
The dynamic relation between intraday returns and net purchases of various investor types before and during the COVID-19 market crash.
Table 4.
The dynamic relation between intraday returns and net purchases of various investor types before and during the COVID-19 market crash.
| RINTRADAY | OSTB | HFTF | NHFTF | |||||
| Pre-Crash | Crash | Pre-Crash | Crash | Pre-Crash | Crash | Pre-Crash | Crash | |
| RINTRADAY(-1) | −0.070 | 3 × 10⁶ | 3 × 10⁶ | 3 × 10⁶ | ||||
| 0.000 | 0.017 | 0.007 | 0.000 | |||||
| RINTRADAY(-2) | −0.069 | −0.067 | 3 × 10⁶ | |||||
| 0.000 | 0.000 | 0.019 | ||||||
| RINTRADAY(-3) | −0.020 | −0.035 | 4 × 10⁶ | |||||
| 0.026 | 0.001 | 0.002 | ||||||
| RINTRADAY(-4) | −0.022 | −0.031 | 2 × 10⁶ | |||||
| 0.009 | 0.001 | 0.027 | ||||||
| OSTB(-1) | 0.132 | −0.085 | ||||||
| 0.008 | 0.009 | |||||||
| OSTB(-2) | 0.113 | 0.102 | 0.091 | |||||
| 0.023 | 0.040 | 0.039 | ||||||
| OSTB(-3) | 0.194 | 0.122 | ||||||
| 0.000 | 0.000 | |||||||
| OSTB(-4) | −8 × 10⁻¹⁰ | 9 × 10⁻¹⁰ | 0.099 | |||||
| 0.014 | 0.028 | 0.043 | ||||||
| HFTF(-1) | 9 × 10⁻¹⁰ | 0.128 | 0.170 | |||||
| 0.004 | 0.000 | 0.000 | ||||||
| HFTF(-2) | 0.124 | 0.223 | ||||||
| 0.000 | 0.000 | |||||||
| HFTF(-3) | 0.117 | 0.233 | 0.114 | |||||
| 0.020 | 0.000 | 0.010 | ||||||
| HFTF(-4) | −7 × 10⁻¹⁰ | 1 × 10⁻⁹ | ||||||
| 0.031 | 0.019 | |||||||
| NHFTF(-1) | 9 × 10⁻¹⁰ | −0.188 | 0.227 | 0.466 | ||||
| 0.006 | 0.000 | 0.000 | 0.000 | |||||
| NHFTF(-2) | 0.150 | 0.058 | ||||||
| 0.000 | 0.034 | |||||||
| NHFTF(-3) | 0.142 | 0.151 | 0.106 | |||||
| 0.006 | 0.000 | 0.000 | ||||||
| NHFTF(-4) | 1 × 10⁻⁹ | 0.142 | 0.129 | |||||
| 0.022 | 0.000 | 0.000 | ||||||
| OHFTB(-1) | −0.081 | |||||||
| 0.012 | ||||||||
| OHFTB(-2) | 0.106 | |||||||
| 0.015 | ||||||||
| OHFTB(-3) | 0.135 | 0.131 | ||||||
| 0.005 | 0.000 | |||||||
| OHFTB(-4) | −7 × 10⁻¹⁰ | |||||||
| 0.017 | ||||||||
| ONHFTB(-1) | −0.141 | |||||||
| 0.000 | ||||||||
| ONHFTB(-2) | ||||||||
| ONHFTB(-3) | 0.115 | 0.154 | ||||||
| 0.025 | 0.000 | |||||||
| ONHFTB(-4) | −7 × 10⁻¹⁰ | 0.053 | ||||||
| 0.027 | 0.031 | |||||||
| HFTBr(-1) | −0.101 | −0.077 | ||||||
| 0.036 | 0.018 | |||||||
| HFTBr(-2) | 0.100 | |||||||
| 0.023 | ||||||||
| HFTBr(-3) | 0.112 | 0.117 | ||||||
| 0.022 | 0.000 | |||||||
| HFTBr(-4) | −8 × 10⁻¹⁰ | |||||||
| 0.008 | ||||||||
| NHFTBr(-1) | −0.107 | |||||||
| 0.001 | ||||||||
| NHFTBr(-2) | 0.128 | 0.092 | ||||||
| 0.012 | 0.037 | |||||||
| NHFTBr(-3) | 0.130 | 0.161 | ||||||
| 0.010 | 0.000 | |||||||
| NHFTBR(-4) | −8 × 10⁻¹⁰ | |||||||
| 0.015 | ||||||||
| Block exogeneity | 0.000 | 0.000 | 0.000 | 0.000 | 0.000 | 0.000 | 0.000 | 0.001 |
| Adj. R-squared | 0.019 | 0.031 | 0.040 | 0.034 | 0.088 | 0.100 | 0.232 | 0.225 |
| OHFTB | ONHFTB | HFTBr | NHFTBr | |||||
| Pre-Crash | Crash | Pre-Crash | Crash | Pre-Crash | Crash | Pre-Crash | Crash | |
| RINTRADAY(-1) | −1 × 10⁷ | −2 × 10⁶ | 3 × 10⁶ | 3 × 10⁶ | ||||
| 0.000 | 0.002 | 0.039 | 0.001 | |||||
| RINTRADAY(-2) | −4 × 10⁶ | 2 × 10⁶ | ||||||
| 0.047 | 0.016 | |||||||
| RINTRADAY(-3) | ||||||||
| RINTRADAY(-4) | −1 × 10⁶ | 2 × 10⁶ | ||||||
| 0.047 | 0.008 | |||||||
| OSTB(-1) | 0.097 | 0.104 | 0.160 | |||||
| 0.000 | 0.021 | 0.001 | ||||||
| OSTB(-2) | −0.162 | 0.185 | −0.136 | 0.170 | ||||
| 0.036 | 0.000 | 0.011 | 0.000 | |||||
| OSTB(-3) | −0.239 | −0.149 | −0.172 | |||||
| 0.001 | 0.000 | 0.000 | ||||||
| OSTB(-4) | −0.096 | |||||||
| 0.043 | ||||||||
| HFTF(-1) | 0.112 | −0.080 | 0.179 | 0.185 | ||||
| 0.000 | 0.006 | 0.000 | 0.000 | |||||
| HFTF(-2) | −0.150 | 0.206 | −0.196 | 0.123 | ||||
| 0.044 | 0.000 | 0.000 | 0.012 | |||||
| HFTF(-3) | −0.202 | −0.172 | −0.166 | |||||
| 0.007 | 0.000 | 0.001 | ||||||
| HFTF(-4) | −0.201 | |||||||
| 0.005 | ||||||||
| NHFTF(-1) | −0.263 | 0.149 | −0.077 | 0.123 | ||||
| 0.001 | 0.000 | 0.013 | 0.017 | |||||
| NHFTF(-2) | −0.179 | 0.181 | −0.154 | |||||
| 0.020 | 0.000 | 0.010 | ||||||
| NHFTF(-3) | −0.220 | −0.089 | −0.149 | −0.129 | ||||
| 0.004 | 0.001 | 0.000 | 0.016 | |||||
| NHFTF(-4) | −0.302 | −0.066 | ||||||
| 0.000 | 0.039 | |||||||
| OHFTB(-1) | 0.224 | 0.163 | 0.101 | −0.085 | 0.093 | 0.194 | ||
| 0.001 | 0.031 | 0.000 | 0.003 | 0.036 | 0.000 | |||
| OHFTB(-2) | 0.196 | −0.133 | 0.127 | |||||
| 0.000 | 0.011 | 0.008 | ||||||
| OHFTB(-3) | −0.145 | −0.154 | −0.151 | |||||
| 0.044 | 0.000 | 0.001 | ||||||
| OHFTB(-4) | ||||||||
| ONHFTB(-1) | 0.224 | 0.181 | 0.114 | 0.083 | 0.195 | |||
| 0.000 | 0.000 | 0.014 | 0.005 | 0.000 | ||||
| ONHFTB(-2) | 0.273 | −0.111 | ||||||
| 0.000 | 0.035 | |||||||
| ONHFTB(-3) | −0.220 | −0.116 | 0.150 | −0.188 | ||||
| 0.004 | 0.000 | 0.000 | 0.000 | |||||
| ONHFTB(-4) | 0.058 | −0.073 | −0.099 | |||||
| 0.042 | 0.014 | 0.035 | ||||||
| HFTBr(-1) | 0.190 | 0.083 | −0.083 | 0.187 | 0.175 | |||
| 0.007 | 0.001 | 0.004 | 0.000 | 0.000 | ||||
| HFTBr(-2) | 0.185 | −0.123 | 0.133 | |||||
| 0.000 | 0.021 | 0.006 | ||||||
| HFTBr(-3) | −0.221 | −0.142 | 0.098 | |||||
| 0.002 | 0.000 | 0.031 | ||||||
| HFTBr(-4) | ||||||||
| NHFTBr(-1) | 0.128 | −0.092 | 0.111 | 0.070 | 0.276 | |||
| 0.000 | 0.002 | 0.016 | 0.019 | 0.000 | ||||
| NHFTBr(-2) | −0.269 | 0.194 | −0.138 | 0.112 | 0.164 | |||
| 0.000 | 0.000 | 0.009 | 0.000 | 0.001 | ||||
| NHFTBr(-3) | −0.248 | −0.175 | −0.178 | |||||
| 0.001 | 0.000 | 0.000 | ||||||
| NHFTBr(-4) | −0.193 | |||||||
| 0.008 | ||||||||
| Block exogeneity | 0.000 | 0.000 | 0.000 | 0.000 | 0.000 | 0.000 | 0.000 | 0.000 |
| Adj. R-squared | 0.069 | 0.058 | 0.034 | 0.118 | 0.037 | 0.032 | 0.052 | 0.030 |
Notes: The table gives the results of panel VAR regression with eight variables (RINTRADAY, OSTB, HFTF, NHFTF, OHFTB, ONHFTB, HFTBr and NHFTBr) and four lags in each. Only significant coefficients are displayed with the associated p-values below. Positive (negative) coefficients are colored green (red).
Disclaimer/Publisher’s Note: The statements, opinions and data contained in all publications are solely those of the individual author(s) and contributor(s) and not of MDPI and/or the editor(s). MDPI and/or the editor(s) disclaim responsibility for any injury to people or property resulting from any ideas, methods, instructions or products referred to in the content. |
© 2024 by the authors. Licensee MDPI, Basel, Switzerland. This article is an open access article distributed under the terms and conditions of the Creative Commons Attribution (CC BY) license (https://creativecommons.org/licenses/by/4.0/).
Share and Cite
MDPI and ACS Style
Ekinci, C.; Ersan, O. Impact of the COVID-19 Market Turmoil on Investor Behavior: A Panel VAR Study of Bank Stocks in Borsa Istanbul. Int. J. Financial Stud. 2024, 12, 14. https://doi.org/10.3390/ijfs12010014
AMA Style
Ekinci C, Ersan O. Impact of the COVID-19 Market Turmoil on Investor Behavior: A Panel VAR Study of Bank Stocks in Borsa Istanbul. International Journal of Financial Studies. 2024; 12(1):14. https://doi.org/10.3390/ijfs12010014
Chicago/Turabian StyleEkinci, Cumhur, and Oğuz Ersan. 2024. "Impact of the COVID-19 Market Turmoil on Investor Behavior: A Panel VAR Study of Bank Stocks in Borsa Istanbul" International Journal of Financial Studies 12, no. 1: 14. https://doi.org/10.3390/ijfs12010014
Note that from the first issue of 2016, this journal uses article numbers instead of page numbers. See further details here.