Abstract
Background: There is insufficient clarity about the different outcomes between unvaccinated and vaccinated people hospitalized with Covid-19, with reference to the variables “Intensive Care Unit” and “Deaths”. Moreover, it is unclear the real effectiveness of the vaccine boosters on the risks of infection and Covid-19 deaths, beyond the first few months after the booster. To verify the hypotheses that repeated vaccinations might expose to a progressively greater risk of severe Covid-19, and of a growing weakening of the immune response, primarily against infection, as the distance from the booster dose increases.
Methods: Through an analysis of the official Italian data we calculated significant differences, percentage variations and trends in the variables “Intensive Care Units” and “Deaths” in hospitalized patients among four groups with different vaccination status, and between the Unvaccinated and Vaccinated groups.
Through analyses of the UK Security Agency data in the weekly COVID-19 vaccine surveillance reports we explored the vaccine effectiveness against SARS-CoV-2 infections and against COVID-19 deaths in relation to the time elapsed from the booster doses.
Results: Repeated vaccinations seem to expose the recipients to a growing risk of severe Covid-19, and fewer vaccinations might be enough to protect persons at greater risk.
The vaccine effectiveness against infection vanished and reversed in the medium term, and vaccinated persons with three doses become increasingly more infected versus unvaccinated persons.
Conclusions: The starting hypotheses have been supported, together with the need to combine carefully rethought vaccination campaigns with the implementation of other strategies, with the achievement of a healthy living and working environment, healthy lifestyles, and effective, safe and sustainable care.
Revised
Amendments from Version 1
No changes have been made in the title, authors and abstracts. We have added some clarification sentences in the Introduction section and the p - value of the percentage variations as requested by the reviewer. Furthermore, we explained how we calculated these significance levels in the Statistical Analysis section.
The longitudinal subfigures have been modified by adding descriptions of the axes and we have expanded the statistical model already described to all age groups (see Supplementary Material), inasmuch, the ISS official bulletins do not provide all the data and variables needed to implement a multivariate logistic analysis as requested by the reviewer.
The p - value values have been added to the tables of the percentage variations and we have added table 6 which describes the relative risk of reported COVID-19 cases, hospitalization, ICU admission and death per 100,000 by vaccination status in Italy.
In the Results section we have added the paragraph describing the results of the statistical analysis for all age groups.
4 references have been added to justify increase in hazard ratio for infections within the 13 days from first injection.
Finally, we have now implemented also a standardization based on the age structure of the English population, as request by the reviewer.
See the authors' detailed response to the review by Gokhan Tut
Introduction
Most Italian mainstream media emphasize the success of the Covid-19 vaccination campaign, following the information provided by the Istituto Superiore di Sanità (ISS). However, there is insufficient clarity about the different outcomes between unvaccinated and vaccinated people hospitalized with Covid-19, with reference to the variables “Intensive Care Unit (ICU)” and “Deaths”. Moreover, it is unclear the real effectiveness of the vaccine boosters on the risks of infection and of Covid-19 death in a period of time not limited to the first months after the booster.
The effects of repeated vaccinations on lowering the risk of disease have been shown for other infectious diseases.
In the Canadian influenza season 2014 – 2015 repeated vaccinations increased the risk of medically attended A(H3N2) disease up to 50% versus unvaccinated people.1 Similar results were also shown in Italy, where most participants had received repeated doses,2 and in Michigan, where the influenza vaccine effectiveness was lower in subjects vaccinated in both the current and prior season in all age groups. On the contrary, in subjects with no evidence of prior vaccination, the vaccine effectiveness was higher for all age groups.3 Moreover, the dose-response relationship, calculated with adjusted geometric mean fold rise (MFR) after influenza vaccination, seems to be inversely related to the number of prior vaccinations, with higher protection without prior vaccination and lower protection in subjects up to four prior vaccination.4
Some authors provide two hypotheses as potential explanation of these phenomena. The first is the Antigenic Distance hypothesis, meaning that variation in repeated vaccine effectiveness (VE) is due to differences in antigenic distances among vaccine strains and between the vaccine strains and the epidemic strain in each outbreak; if antibody titer is high for more than a year, it has the potential to negatively interfere with a subsequent revaccination if the antigenic similarity between the prior season vaccine strain and the epidemic strain is high.5 The second hypothesis is the Original Antigenic Sin (OAS), meaning that the immunity response to the previous met viral strain permanently shapes itself in order to boost the antibody production to related strain.6
Moreover, it seems that the hypothesis based entirely on the antibody response to a unique viral antigen is not enough, but it is likely that the adaptive immune response to other virus components might contribute.7 In fact, a recent study suggests that the presence of pre-existing non-spike cross-reactive memory T cells protects the SARS-CoV-2-naïve contacts from infection.8
Although many important questions related to the mechanism of OAS remain unanswered,9 it seems that the effectiveness of the current vaccine will be higher in people not previously vaccinated, or if the previous vaccine strain cross-reacts minimally with the current vaccine strain, even with no close match to the circulating strain.6
Moreover, it has been hypothesized that anti-COVID-19 vaccinations, too frequently or too close repeated, could weaken the immune response or damage the immune system itself.
The aim of this study is to verify significant differences, percentage variations and trends in the ICU and Deaths variables, in the hospitalized population among four groups: an Incomplete Cycle (IC – defined as all reported cases with a confirmed diagnosis of SARS-CoV-2 virus infection, occurring at least 14 days after the first dose – in subjects who have received a two-dose vaccine course – or, within 14 days days after administration of the second dose10) group, a double dose since less than 4 months (2D<4) group, a double dose more than 4 months ago (2D>4) group, and a third dose (3D) group.
Furthermore, we aim to verify significant differences, percentage variations and trends in the same variables between the Unvaccinated (UV) and Vaccinated (V) groups.
We hypothesize that repeated vaccinations might expose the recipients to a progressively greater risk of Covid-19, included severe diseases, and that fewer vaccinations might be enough to protect the subjects at greater risk.
Finally, we have verified the hypothesis of a progressive weakening of the immune response as the time elapsed from the booster dose increased, analyzing the data published weekly by the UK Security Agency in the COVID-19 vaccine surveillance reports.
Methods
The official data relating to Covid-19 Hospitalizations, ICU and Deaths between Unvaccinated and Vaccinated (and their subgroups: IC, 2D<4, 2D>4, 3D) were collected from the ISS bulletins starting by January 14, 2022 until February 18, 2022. For the variable Deaths data were collected starting from January 21, 2022 because the division between <4 and >4 months started from this date.
The reference populations among the bulletins were never aligned with the observation period of all 3 variables taken into consideration. Therefore, it was necessary to proceed with this alignment considering the “median date” of the observation period of each variable and using the populations of the previous bulletins whose reference date coincided with the median date.
The observation period of one month allowed us to carry out analyzes on populations stable enough, despite the changes of parts of the population among the groups (</> 5 months, </> 4 months, and third doses).
Rates/1,000 were calculated for both total events and for each group on the “Intensive Care Unit (ICU)” and “Deaths” variables.
The rates of the variable “ICU” were calculated on the hospitalized population, while the rates of the variable Covid-19 “Deaths” were calculated on the hospitalized population added to the ICU population. The reason for this choice is based on the fact that the number of deaths was higher than the number of accesses to ICU.
The calculation of the variation in the rates rate variations was carried out according to the formula:
To compare the Unvaccinated group and Vaccinated group, data of IC, 2D<4, 2D>4 and 3D were aggregated and was calculated the total rate of Vaccinated group. The reason for this choice is that the ISS considers Unvaccinated even people “… vaccinated with either the first dose or single-dose vaccine within the 14 days prior to diagnosis.” (although, in our opinion, this can introduce a bias and a systematic error).10
The VIVALDI Study11 showed a marginally greater hazard ratio for PCR-positive infection among vaccinated people after first dose of BNT162b2 vaccine within 7-13 days compared to unvaccinated people. This data, albeit non-significant, represent a tendency confirmed by data from Qatar in the two weeks following the first dose, mostly for asymptomatic infections.12,13 This phenomenon might be related to a post-vaccination fall in neutrophil and lymphocyte.14,15
Examples of some increase in hazard ratio for infections within the 13 days from first injection are are highlighted by several authors.16–19
The same proceeding above described was used for analysis of the trend of the rates for the all age groups (see Extended data).
Data published weekly by the UK Health Security Agency in the COVID-19 vaccine surveillance reports were analyzed from the time the majority of the population (>30 million people) received the third dose, in order to verify the immune response as the time elapsed from the booster dose increased, calculating the ratio of deaths of unvaccinated versus vaccinated persons with at least 3 doses.
Statistical analysis
A non-parametric statistic was used after performing the Shapiro – Wilk normality test, inasmuch the distribution of the rates of the variables considered (“Intensive Care Unit” and “Deaths”) do not show a normal distribution.
The Kruskal-Wallis test with Dunn’s post-hoc test was used to compare Incomplete Cycle (IC), double dose <4 months (2D<4), double dose >4 months (2D>4) and third doses (3D) groups, while the Mann-Whitney test was used to compare Unvaccinated (UV) and Vaccinated (V) groups.
The level of significance of the rates variation was calculated using the linear regression between rates and date of the bulletins considering the rates as dependent variable.
For the descriptive statistic, data were processed using Excel, while for the inferential statistic was used GraphPad Prism 5 software (GraphPad Software, Inc., USA); the “p” significance level was fixed at <0.05.
Results
Comparison between Incomplete Cycle (IC), double dose <4 months (<4), double dose> 4 months (>4) and third doses (3D) groups.
Statistical significant difference (p=0.0001) was observed among groups. Pairwise comparisons using Dunn’s test indicated that IC group was significantly different from the 3D group and 2D>4m. The 2D<4m group was significantly different by the 2D>4m.
The trend of 3D group is growing with an increase of the 253.3% (p=0.0001), while the trend of 2D>4m is degrowing with a decrease of the 39.7% (p=0.0001). The trend of IC group and 2D<4m are overlapping and show a decrease respectively of 45.5% (p=0.001) and 13.9% (p=0.28) (Figure 1 and Table 1).

Figure 1. Significant difference (p<.05) and trend between IC, <4, >4, 3D for the ICU variable.
Table 1.
Rate/1,000 ICU variable.
| | Rate/1,000 | | |
|---|
| Date | IC | 2D<4m | 2D>4m | 3D |
|---|
| 1-14/01/2022 | 2,2 | 3,6 | 27,2 | 3 |
| 2-21/01/2022 | 2 | 3,1 | 25,2 | 3,9 |
| 3-28/01/2022 | 1,7 | 2,7 | 22,1 | 5,7 |
| 4-04/02/2022 | 1,6 | 2,8 | 19,6 | 7,1 |
| 5-11/02/2022 | 1,5 | 2,8 | 18,2 | 8,6 |
| 6-18/02/2022 | 1,2 | 3,1 | 16,4 | 10,6 |
| Variations (%) | -45,5 | -13,9 | -39,7 | 253,3 |
| P-value | 0.001* | 0.28 | 0.0001* | 0.0001* |
Statistical significant difference (p=0.001) was observed among groups. Pairwise comparisons using Dunn’s test indicated that IC group was significantly different from the 2D>4m. The 2D<4m group was significantly different by the 2D>4m group.
The trend of 3D group and 2D>4m are growing with an increase respectively of the 416 % (p=0.003) and 3.5%. The trend of IC group and 2D<4m are overlapping and show an increase respectively of 39.9% (p=0.04) and 49.8% (p=0.017) (Figure 2 and Table 2).

Figure 2. Significant difference (p<.05) and trend between IC, <4, >4, 3D for the deaths variable.
Table 2.
Rate/1,000 deaths variable.
| | Rate/1,000 | | |
|---|
| Date | IC | 2D<4m | 2D>4m | 3D |
|---|
| 1-21/01/2022 | 3,8 | 3,9 | 55,9 | 7,8 |
| 2-28/01/2022 | 3,4 | 3,8 | 50,0 | 12,0 |
| 3-04/02/2022 | 4,0 | 4,3 | 51,1 | 19,2 |
| 4-11/02/2022 | 4,7 | 4,9 | 53,1 | 28,2 |
| 5-18/02/2022 | 5,3 | 5,8 | 57,8 | 40,2 |
| Variations (%) | 39,9 | 49,8 | 3,5 | 416,0 |
| P-value | 0.04* | 0.017* | 0.58 | 0.003 |
Comparison between Unvaccinated (UV) and Vaccinated (V) groups
Statistical significant difference (p=0.0087) was observed between groups. The trend of UV group and V are both degrowing with an decrease of 51.1% (p=0.0001) and 12.8% (p=0.02) respectively (Figure 3 and Table 3).

Figure 3. Significant difference (p<.05) and trend between UV versus V for the ICU variable.
Table 3.
Rate/1,000 ICU variable
| Rate/1,000 |
|---|
| Date | UV | V |
|---|
| 1-14/01/2022 | 69,6 | 36 |
| 2-21/01/2022 | 61,9 | 34,2 |
| 3-28/01/2022 | 52,7 | 32,1 |
| 4-04/02/2022 | 45,4 | 31,1 |
| 5-11/02/2022 | 38,8 | 31,1 |
| 6-18/02/2022 | 34 | 31,4 |
| Variations (%) | -51,1 | -12,8 |
| P-value | 0.0001* | 0.02* |
Statistical significant difference (p=0.0159) was observed between groups. The trend of UV and V groups are both growing with an increase of 9.5% (p=0.178) and 53.2% (p=0.021) respectively (Figure 4 and Table 4).

Figure 4. Significant difference (p<.05) and trend between UV versus V for the deaths variable.
Table 4.
Rate/1,000 deaths variable.
| Rate/1,000 |
|---|
| Date | UV | V |
|---|
| 1-21/01/2022 | 64,3 | 71,3 |
| 2-28/01/2022 | 58,7 | 69,2 |
| 3-04/01/2022 | 61,9 | 78,6 |
| 4-11/02/2022 | 66,5 | 90,8 |
| 5-18/02/2022 | 70,4 | 109,2 |
| Variations (%) | 9,5 | 53,2 |
| P-value | 0.178 | 0.021* |
Comparison amongst Incomplete Cycle (IC), double dose <4 months (<4), double dose> 4 months (>4) and third doses (3D) groups, Unvaccinated (UV) and Vaccinated (V) groups for all age groups (see Extended data)
The IC group showed rates significant lower for all age groups compared to 2D>4m or 2D<4m doses, both in the ICU variable and Death variable. For the all age groups, the 2D<4m did not show a significant difference compared to IC group both in the ICU variable and Death variable. Only in the 12–39 age group we observed a significant increase of the 2D<4m group compared to IC group in the ICU variable (S1). Furthemore, the trend of IC group shows a significant decrease for the age group 60–79 and 80+ both in the ICU variable and Death variable.
The 2D>4m group showed a significant decrease of the trend in the 60–79 and 80+ age group both in the ICU variable and Death variable while we observed a significant decrease of the trend in the 2D<4m in the 12–39 age group in the ICU variable.
The third doses show a significant increase of the trend in all age groups both in the ICU variable and Death variable. In particular, in the 80+ group we observed a trend reversal between 2D>4m group and 3D group both in the ICU variable and Death variable (S13–S14).
The comparison between UV and V groups shows: 1. no significant difference in the 12–39 age group but a significant decrease in the trend of UV group in the ICU variable. Furthermore we observed a trend reversal near the fifth bulletin in the ICU variable (S3); 2. significant difference in the 40–59 age group both in the ICU variable and Death variable to the disadvantage of the UV group, but a significant decrease in the trend of UV group accompanied by a significant increase on V group in the ICU variable, while in the Death variable we observed a significant increase of the trend of V group; 3. significant difference in the 60–79 age group in the ICU variable to the disadvantage of the UV group but no significant difference in the Death variable. The trend in the ICU variable decrease in both group but to a greater extent in the UV group (S11), while in the Death variable we observed a trend reversal between second and third bulletin (S12); 4. significant difference both in the ICU variable and Death variable to the disadvantage of the V group in the 80+ age group and a decrease trend both UV group and V group only in the ICU variable.
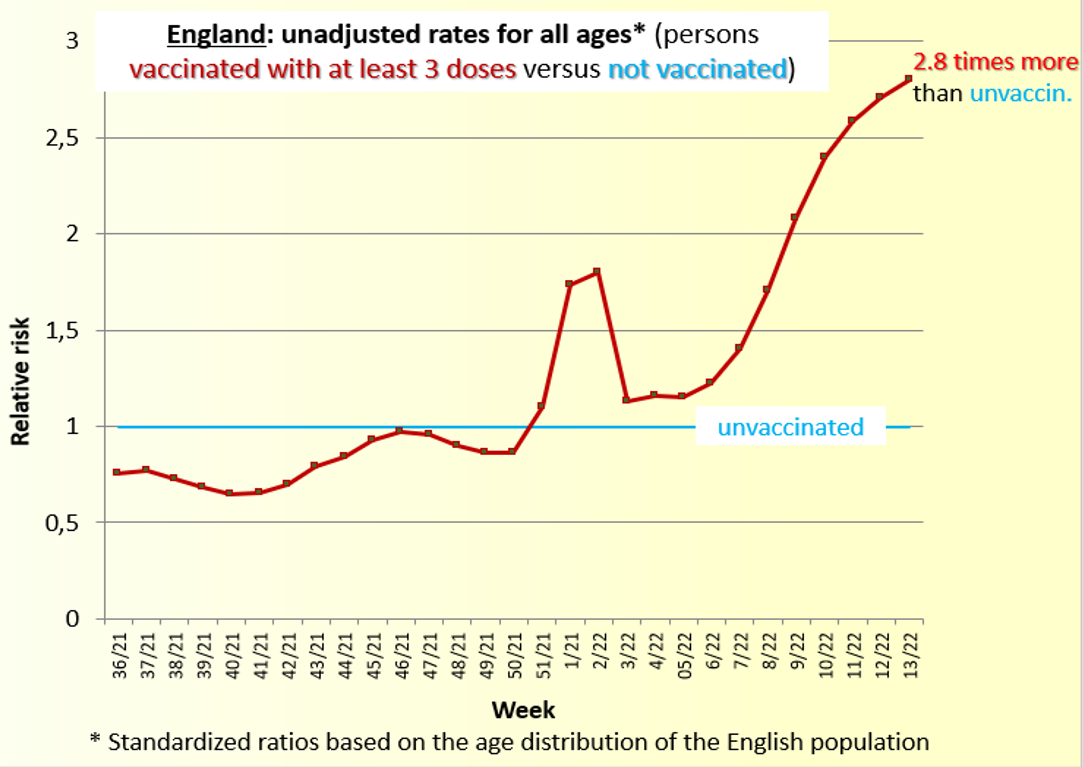
The reports of COVID-19 vaccine surveillance, weekly published by the UK Health Security Agency, show a clear trend towards an increase in infections in vaccinated persons versus not vaccinated persons per 100,000, compared in each of eight age classes: under 18, 18 to 29, 30 to 39, 40 to 49, 50 to 59, 60 to 69, 70 to 79, 80 or over. Indeed, the Week 36 of 2021 showed an unbalancement in age classes from 40 to 79 years, in which COVID-19 cases in vaccinated exceeded those in not vaccinated persons, although the entire column of vaccinated persons still outnumbered (−13%) the column of not vaccinated.
In the following weeks the COVID-19 cases among the vaccinated persons continued to increase more than proportionally, until in Week 39 the ratio was reversed, with more COVID-19 cases among the vaccinated persons (+7% overall). Thereafter, the relative increases among the vaccinated persons were always higher than those in their counterpart, up to Week 2 of 2022, when the excess reached +117%. From Week 3 of 2022 the tables published in the reports show the comparison only between unvaccinated versus vaccinated persons “with at least 3 doses”, with an attenuated excess of cases temporarily in vaccinated (+34%). However, in the following weeks the excess of cases has continued incessantly to increase, to reach +275% in Week 13, when the UK Health Security Agency announced the decision to stop the publication of these data and of the related table.
Someone might observe that these are raw data, without multivariable adjustment. However, there are three considerations in this regard.
First, we lack too many informations to implement a multivariable correction.
Second, why UK Health Security Agency itself has not implemented these corrections, owning all the needed informations? A possible answer is that the results are not so striking, and that the substance would not change much.
Third, in the face of an impressive trend such as the one highlighted, we think it is more important to bring it to the attention of the scientific community, to open a debate on the subject, also soliciting the necessary investigations/appropriate adjustments. Suppressing the reporting of the phenomenon because the methodological rules have not been previously and meticulously observed risks further delaying awareness of a trend with profound possible public health implications.
In the weeks when more than half of the English people have received the vaccine booster (from Week 3 of 2022 onwards),23 the Week 3 shows a death rate of unvaccinated 9.4 times than the one of the vaccinated persons, while Week 11 shows a rate unvaccinated/vaccinated persons only about 1.6 (Table 5). We have now the first consistent Italian data, beginning from the age classes that anticipated a turnaround also in England (Table 6).
Table 5.
Covid Vaccine Surveillance Report – UK Security Agency – Unadjusted rates of COVID-19 deaths (per 100,000) in vaccinated (≥3 doses) and unvaccinated persons by week 3 to 11 of 2022.
| Week/2022 | Death within 28 days of positive Covid-19 test | Not vaccinated/Vaccinated | Death within 60 days of positive Covid-19 test | Not vaccinated/Vaccinated |
|---|
Unadjusted rates among persons vaccinated
≥3 doses (per 100,000) | Unadjusted rates among persons not vaccinated
≥3 doses (per 100,000) | Unadjusted rates among persons vaccinated
≥3 doses (per 100,000) | Unadjusted rates among persons not vaccinated
≥3 doses (per 100,000) |
|---|
| 3 | 42.0 | 438.4 | 10.438 |  | 50.3 | 473.1 | 9.405 |  |
| 4 | 62.2 | 453.1 | 7.284 | 71.3 | 487.4 | 6.835 |
| 5 | 86.9 | 459.6 | 5.288 | 98.8 | 501.9 | 5.079 |
| 6 | 107.8 | 431.3 | 4.000 | 128.9 | 482.5 | 3.743 |
| 7 | 111.6 | 353.8 | 3.170 | 142.6 | 411.8 | 2.887 |
| 8 | 105.5 | 276.2 | 2.618 | 148.4 | 349.5 | 2.355 |
| 9 | 91.5 | 197.6 | 2.159 | 148.6 | 272.7 | 1.835 |
| 10 | 71.0 | 142.4 | 2.005 | 136.3 | 192.9 | 1.415 |
| 11 | 59.4 | 118.8 | 2.000 | 124.9 | 198.1 | 1.586 | |
Table 6.
Relative risk of reported COVID-19 cases, hospitalization, ICU admission and death per 100,000 by vaccination status (Epidemia COVID-19 (iss.it)).
Persons
40-59 years
Date | DIAGNOSIS
Not vacc. vs vacc. complete cycle ≤120 days | DIAGNOSIS
Not vacc. vs vacc. complete cycle +
booster | HOSPITALIZATION
Not vaccinated vs vacc. complete cycle ≤120 days | HOSPITALIZATION
Not vaccinated vs vacc. complete cycle + booster | Intensive Care Unit
Not vaccinated vs vacc. Complete
cycle ≤120 days | Intensive Care Unit
Not vacc. vs vacc. complete cycle +
booster | DECEASED
Not vacc. vs vacc. complete cycle ≤120 days | DECEASED
Not vacc. vs vacc. complete cycle + booster |
|---|
| 19/01/2022 | 2.1 | 2.6 | 13.8 | 9.4 | 27.6 | 32.2 | 27.0 | 7.7 |
| 26/01/2022 | 2.0 | 2.8 | 9.1 | 7.7 | 21.3 | 21.3 | 16.2 | 9.3 |
| 02/02/2022 | 1.9 | 3.1 | 6.8 | 7.4 | 21.3 | 17.8 | 18.0 | 18.0 |
| 09/02/2022 | 1.9 | 3.4 | 5.1 | 6.9 | 15.1 | 16.3 | 15.1 | 17.7 |
| 16/02/2022 | 1.9 | 3.5 | 3.8 | 5.8 | 8.8 | 12.2 | 11.9 | 13.6 |
| 23/02/2022 | 1.8 | 3.5 | 3.0 | 5.4 | 5.4 | 10.3 | 8.0 | 11.0 |
| 02/03/2022 | 1.7 | 3.2 | 2.6 | 5.3 | 3.6 | 10.7 | 5.0 | 7.8 |
| 09/03/2022 | 1.7 | 2.8 | 2.3 | 4.9 | 2.5 | 8.9 | 3.1 | 7.6 |
| 16/03/2022 | 1.6 | 2.2 | 2.2 | 4.6 | 2.0 | 6.8 | 2.4 | 8.2 |
| 23/03/2022 | 1.4 | 1.7 | 2.0 | 4.0 | 2.0 | 5.3 | 2.0 | 6.0 |
| 30/03/2022 | 1,2 | 1.4 | 1.8 | 3.3 | 2.0 | 4.4 | 1.8 | 8.0 |
| 06/04/2022 | 1.2 | 1.3 | 1.6 | 2.5 | 1.7 | 3.2 | 2.6 | 6.0 |
| 13/04/2022 | 1.1 | 1.2 | 1.6 | 2.3 | 1.8 | 3.7 | 4.2 | 7.0 |
| 20/04/2022 | 1.0 | 1.1 | 1.4 | 2.0 | 2.4 | 3.4 | 5.2 | 7.0 |
| 27/04/2022 | 1.0 | 1.1 | 1.4 | 2.0 | 3.7 | 3.1 | 4.2 | 5.2 |
| 04/05/2022 | 0.9 | 0.9 | 1.2 | 1.8 | 3.1 | 3.1 | 5.2 | 5.2 |
| 11/05/2022 | 0.9 | 0.9 | 1.2 | 1.7 | 3.3 | 2.9 | 3.3 | 5.0 |
| 18/05/2022 | 0.9 | 0.9 | 1.2 | 1.5 | 2.4 | 2.0 | 2.6 | 4.5 |
| 25/05/2022 | 0.9 | 0.9 | 1.2 | 1.5 | 2.4 | 2.0 | 2.6 | 4.5 |
| 31/05/2022 | 0.8 | 0.8 | 1.1 | 1.3 | 2.2 | 2.2 | 1.4 | 2.8 |
| 08/06/2022 | 0.8 | 0.9 | 1.0 | 1.4 | 1.5 | 2.2 | 1.3 | 3.0 |
| 15/06/2022 | 0.8 | 0.9 | 0.9 | 1.5 | 2.0 | 2.5 | 2.7 | 2.7 |
| 22/06/2022 | 0.9 | 0.8 | 0.9 | 1.6 | 2.0 | 3.3 | 1.0 | 2.5 |
| 28/06/2022 | 1.0 | 0.8 | 0.8 | 1.6 | 0.7 | 2.0 | 2.3 | 3.5 |
| 06/07/2022 | 1.0 | 0.8 | 0.9 | 1.6 | 0.7 | 1.7 | inf | 6.0 |
Discussion
The aim of this study was to understand the impact of the Covid-19 vaccine boosters in the ICU and Deaths variables and to compare the weight of the Unvaccinated and Vaccinated groups in the same variables.
The results support our hypothesis.
In fact, the Kruskal-Wallis test used to compare IC, 2D<4, 2D>4, 3D groups have shown that, from the comparison between the rates, a single dose is already associated with reduced access to ICU and Deaths, and that the third doses are associated with increased accesses in ICU and Deaths, unlike the second doses and incomplete cycles (IC).
Moreover, the 2D>4m are associated with significantly greater values than the IC and 2D<4m both in the ICU and Deaths variables. However, on the whole, the 2D>4m show a progressive and continuous decrease over time up to levels almost comparable for the ICU variable to the 3D values (which instead seem to worsen constantly); instead, in Deaths variable the 2D>4m show a slight rise during the considered period.
Overall, the 2D <4m do not seem to improve ICU accesses and deaths, if compared to the single doses (IC) and, moreover, they show a trend over time similar to the IC group.
The Mann-Whitney test was used to compare Unvaccinated (UV) and Vaccinated (V) groups shows that, overall, the UV group has significantly higher ICU accesses, but it shows a sharp declining trend over the whole period considered (-51%), while the V group shows only a 13% decrease.
There is an overlap of values between UV and V groups in the last bulletin of the period considered for the ICU variable; instead, the Deaths variable shows a progressive divergence of values throughout the considered period.
In contrast to the ICU variable, the deaths in the UV group are significantly lower than those in V group, with an increase of 9.5% over the considered period, while the increase in the V group is 53.2%.
The analysis by age groups shows an increase in rates both in the ICU variable and in the Death variable in all age groups in the 3D group. Furthermore, the weaker age groups seem to show greater sensitivity to this phenomenon inasmuch a trend reversal is observed between the 2D group> 4m and the 3D group. This observation seems to be congruent with what has already been observed in Canada, Italy and Michigan,1–4 where it has been shown that repeated vaccinations increase the risk of disease.
The hypothesis of a progressive weakening of the immune response with the increase of the time from the booster dose is supported by the data in the weekly publications of the UK Health Security Agency - COVID-19 vaccine surveillance reports.
In fact, such a clear trend not only argues for the waning of the 3rd dose effectiveness in preventing SARS-CoV-2 infection, but also for a possible, progressive worsening of the immune response.
Note that the Authors of the UK Health Security Agency Report always repeat that: “Comparing case rates among vaccinated and unvaccinated populations should not be used to estimate vaccine effectiveness against COVID-19 infection. Vaccine effectiveness (VE) has been formally estimated from a number of different sources and is summarised on pages 4 to 15 in this report.” However, the four cohort studies mentioned in the Report in the paragraph “Effectiveness against infection”11,20–22 have a short follow-up, ranging on average from 45 to 80 days, during the so-called honeymoon between the vaccine and the vaccinated persons. In this period the protection is at its maximum, also against the infection, and it is before the beginning of its rapid decline. Moreover, these inconsistent arguments of the Report authors do not stand up to comparison with the very strong and linear trend of increasing infections in vaccinated individuals shown by the weekly data, albeit unadjusted.
It is not enough. Looking at the weeks when more than half of the English people have received the vaccine booster (from Week 3 of 2022 onwards),23 it is detectable a clear trend to an attenuation of the VE even towards deaths, because in Week 3 the death rate of unvaccinated was 9.4 times the vaccinated rate, while in the Week 10 the rate unvaccinated/vaccinated was only about 1.4 (Table 5). [Note that this trend seems in place in Italy as well, starting from the age group 40-59 (Table 6)]. The rate in England week 11, nearly 1.6, might be an interruption of this trend, or an effect of chance, or an interference with the (temporary?) effects of the fourth dose, reported only from 9 March 2022.23
The usual explanation is to acknowledge a progressive attenuation of the VE against the infection (although for now, despite mounting evidence,12,13,24–26 most main stream researchers are far from admitting a VE negativization in the medium period, in comparison to the unvaccinated persons). But, together, the typical narrative states definitely that the VE remains very good against a severe or critical COVID-19. Unfortunately, the data in Tables 5 and 6 show a clear trend towards an attenuation of the VE even for deaths, and the data should call into question the strategy of repeated, continuous vaccine boosters. Other strategies as well should be debated and studied in depht and implemented, from allowing natural infections (as Icelandic Public Healthcare is proposing,27 in the setting of a mild dominant variant such as Omicron), to implementation of safer environments,28–30 healthy lifestyles,31–36 and reasonably effective, safe and sustainable early care.37–41
Conclusion
The results do not provide support to vaccination campaigns with multiple and repeated doses (and related obligations), both because of the doubtful net advantage of subsequent doses, and because of the suspicion that the repeated stimulation of the immune system with this type of vaccine may expose the vaccinated people to an increased risk of serious disease.
The negative effect of this uninterrupted vaccination campaign seems to affect particularly the age groups that the campaign aims to protect; moreover, the net benefits declared for the younger are not evident.
In addition to continuing researching for better vaccines, it would be time to implement different strategies as well, to tackle this and other pandemics: from the achievement of a healthy living and working environment, to healthy lifestyles, to accessible early, safe and sustainable care.
Data availability
Underlying data
As the data are not owned by the authors, it is not possible to upload the data to a repository. Data analysed will be available in an accessible form by contacting the corresponding author.
References
- 1.
Skowronski DM, Chambers C, Serres D, et al.:
Serial Vaccination and the Antigenic Distance Hypothesis: Effects on Influenza Vaccine Effectiveness During A(H3N2) Epidemics in Canada, 2010-2011 to 2014-2015.
J. Infect. Dis.
2017; 215(7): 1059–1099. PubMed Abstract
| Publisher Full Text
- 2.
Rizzo C, Bella A, Alfonsi V, et al.:
Influenza vaccine effectiveness in Italy: Age, subtype-specific and vaccine type estimates 2014/15 season.
Vaccine.
2016 Jun 8; 34(27): 3102–3108. PubMed Abstract
| Publisher Full Text
- 3.
Ohmit SE, Petrie JG, Malosh RE, et al.:
Influenza vaccine effectiveness in the community and the household.
Clin. Infect. Dis.
2013 May; 56(10): 1363–1369. PubMed Abstract
| Publisher Full Text
- 4.
Thompson MG, Naleway A, Fry AM, et al.:
Effects of Repeated Annual Inactivated Influenza Vaccination among Healthcare Personnel on Serum Hemagglutinin Inhibition Antibody Response to A/Perth/16/2009 (H3N2)-like virus during 2010-11.
Vaccine.
2016 Feb 10; 34(7): 981–988. PubMed Abstract
| Publisher Full Text
- 5.
Smith DJ, Forrest S, Ackley DH, et al.:
Variable efficacy of repeated annual influenza vaccination.
Proc. Natl. Acad. Sci. U. S. A.
1999 Nov 23; 96(24): 14001–14006. PubMed Abstract
| Publisher Full Text
| Free Full Text
- 6.
Lewnard JA, Cobey S:
Immune History and Influenza Vaccine Effectiveness.
Vaccines (Basel).
2018 May 21; 6(2): 28. PubMed Abstract
| Publisher Full Text
- 7.
Belongia EA, Skowronski DM, McLean HQ, et al.:
Repeated annual influenza vaccination and vaccine effectiveness: review of evidence.
Expert Rev. Vaccines.
2017 Jul; 16(7): 1–14. PubMed Abstract
| Publisher Full Text
- 8.
Kundu R, Narean JS, Wang L, et al.:
Cross-reactive memory T cells associate with protection against SARS-CoV-2 infection in COVID-19 contacts.
Nat. Commun.
2022 Jan 10; 13(1): 80. PubMed Abstract
| Publisher Full Text
- 9.
Zhang A, Stacey HD, Mullarkey CE, et al.:
Original Antigenic Sin: How First Exposure Shapes Lifelong Anti-Influenza Virus Immune Responses.
J. Immunol.
2019 Jan 15; 202(2): 335–340. PubMed Abstract
| Publisher Full Text
- 10.
Donzelli A, Alessandria M, Orlando L:
Comparison of hospitalizations and deaths from COVID-19 2021 versus 2020 in Italy: surprises and implications.
F1000Res.
2021 Sep 24; 10: 964. PubMed Abstract
| Publisher Full Text
| Free Full Text
- 11.
Shrotri M, Krutikov M, Palmer T, et al.:
Vaccine effectiveness of the first dose of ChAdOx1 nCoV-19 and BNT162b2 against SARS-CoV-2 infection in residents of long-term care facilities in England (VIVALDI): a prospective cohort study.
Lancet Infect. Dis.
2021 Nov; 21(11): 1529–1538. PubMed Abstract
| Publisher Full Text
- 12.
Chemaitelly H, Tang P, Hasan MR, et al.:
Waning of BNT162b2 Vaccine Protection against SARS-CoV-2 Infection in Qatar.
N. Engl. J. Med.
2021 Dec 9; 385(24): e83.Epub 2021 Oct 6. PubMed Abstract
| Publisher Full Text
| Free Full Text
- 13.
Abu-Raddad LJ, Chemaitelly H, Bertollini R:
National Study Group for COVID-19 Vaccination. Waning mRNA-1273 Vaccine Effectiveness against SARS-CoV-2 Infection in Qatar.
N. Engl. J. Med.
2022 Mar 17; 386(11): 1091–1093. PubMed Abstract
| Publisher Full Text
| Free Full Text
- 14.
Muturi-Kioi V, Lewis D, Launay O, et al.:
Neutropenia as an Adverse Event following Vaccination: Results from Randomized Clinical Trials in Healthy Adults and Systematic Review.
PLoS One.
2016 Aug 4; 11(8): e0157385. PubMed Abstract
| Publisher Full Text
- 15.
Munyer TP, Mangi RJ, Dolan T, et al.:
Depressed lymphocyte function after measles-mumps-rubella vaccination.
J. Infect. Dis.
1975 Jul; 132(1): 75–78. PubMed Abstract
| Publisher Full Text
- 16.
Day M:
Covid-19: Stronger warnings are needed to curb socialising after vaccination, say doctors.
BMJ
.2021 Mar; 19(372):n783. PubMed Abstract
| Publisher Full Text
- 17.
Craig C:
Thinking beyond behavioural change as an explanation for increased COVID post vaccination.BMJ 26 March 2021. Rapid response to: Covid-19: Stronger warnings are needed to curb socialising after vaccination, say doctors and behavioural scientists.
- 18.
U.S. Food and Drug Administration: Emergency Use Authorization (EUA) for an Unapproved Product Review Memorandum.
https://www.fda.gov/media/144416/download
- 19.
Hitchings MDT, Ranzani OT, Torres MSS, et al.:
Effectiveness of CoronaVac among healthcare workers in the setting of high SARS-CoV-2 Gamma variant transmission in Manaus, Brazil: A test-negative case-control study.
Lancet Reg. Health Am.
2021 Sep;1: 100025.
- 20.
Pritchard E, Matthews PC, Stoesser N, et al.:
Impact of vaccination on SARS-CoV-2 cases in the community: a population-based study using the UK’s COVID-19 Infection Survey. medRxiv 2021: 2021.04.22.21255913 COVID-19 vaccine surveillance report – week 11 56.
- 21.
Hall VJ, Foulkes S, Saei A, et al.:
COVID-19 vaccine coverage in health-care workers in England and effectiveness of BNT162b2 mRNA vaccine against infection (SIREN): a prospective, multicentre, cohort study.
Lancet.
2021.
- 22.
Menni C, Klaser K, May A, et al.:
Vaccine side-effects and SARS-CoV-2 infection after vaccination in users of the COVID-19 Symptom Study app in the U K: a prospective observational study.
Lancet Infect. Dis.
2021; 21: 939–949. PubMed Abstract
| Publisher Full Text
Reference Source
- 23.
Nordström P, Ballin M, Nordström A:
Risk of infection, hospitalisation, and death up to 9 months after a second dose of COVID-19 vaccine: a retrospective, total population cohort study in Sweden.
Lancet.
2022 Feb 26; 399(10327): 814–823.Epub 2022 Feb 4. PubMed Abstract
| Publisher Full Text
| Free Full Text
- 24.
Fabiani M, Puopolo M, Morciano C, et al.:
Italian Integrated Surveillance of covid-19 study group and Italian covid-19 Vaccines Registry group. Effectiveness of mRNA vaccines and waning of protection against SARS-CoV-2 infection and severe covid-19 during predominant circulation of the delta variant in Italy: retrospective cohort study.
BMJ.
2022 Feb 10; 376: e069052. PubMed Abstract
| Publisher Full Text
| Free Full Text
- 25.
Hansen CH, Schelde AB, Moustsen-Helm IR, et al.:
Vaccine effectiveness against SARS-CoV-2 infection with the Omicron or Delta variants following a two-dose or booster BNT162b2 or mRNA-1273 vaccination series: A Danish cohort study.medRxiv 2021.12.20.21267966.Publisher Full Text
- 26.
Dorabawila V, Hoefer D, Bauer UE, et al.:
Effectiveness of the BNT162b2 vaccine among children 5-11 and 12-17 years in New York after the Emergence of the Omicron Variant.medRxiv 2022.02.25.22271454. Publisher Full Text
- 27.
http
- 28.
Wu X, Nethery RC, Sabath MB, et al.:
Air pollution and COVID-19 mortality in the United States: Strengths and limitations of an ecological regression analysis.
Sci. Adv.
2020 Nov 4; 6(45): eabd4049. PubMed Abstract
| Publisher Full Text
| Free Full Text
- 29.
Fiasca F, Minelli M, Maio D, et al.:
Associations between COVID-19 Incidence Rates and the Exposure to PM2.5 and NO2: A Nationwide Observational Study in Italy.
Int. J. Environ. Res. Public Health.
2020 Dec 13; 17(24): 9318. PubMed Abstract
| Publisher Full Text
| Free Full Text
- 30.
Di Ciaula A, Bonfrate L, Portincasa P, et al.:
Nitrogen dioxide pollution increases vulnerability to COVID-19 through altered immune function.
Environ. Sci. Pollut. Res. Int.
2022 Feb 8.Epub ahead of print. PubMed Abstract
| Publisher Full Text
- 31.
da Silveira MP , da Silva Fagundes KK , Bizuti MR, et al.:
Physical exercise as a tool to help the immune system against COVID-19: an integrative review of the current literature.
Clin. Exp. Med.
2021 Feb; 21(1): 15–28. PubMed Abstract
| Publisher Full Text
| Free Full Text
- 32.
Sallis R, Young DR, Tartof SY, et al.:
Physical inactivity is associated with a higher risk for severe COVID-19 outcomes: a study in 48 440 adult patients.
Br. J. Sports Med.
2021 Oct; 55(19): 1099–1105. PubMed Abstract
| Publisher Full Text
| Free Full Text
- 33.
Popkin BM, Du S, Green WD, et al.:
Individuals with obesity and COVID-19: A global perspective on the epidemiology and biological relationships.
Obes. Rev.
2020 Nov; 21(11): e13128.Epub 2020 Aug 26. Erratum in: Obes Rev. 2021 Oct; 22(10): e13305. PubMed Abstract
| Publisher Full Text
| Free Full Text
- 34.
Demasi M:
COVID-19 and metabolic syndrome: could diet be the key?.
BMJ Evid Based Med.
2021 Feb; 26(1): 1–2.Epub 2020 Jul 10. Free Full Text
Publisher Full Text
|
- 35.
Farsalinos K, Barbouni A, Poulas K, et al.:
Current smoking, former smoking, and adverse outcome among hospitalized COVID-19 patients: a systematic review and meta-analysis.
Ther. Adv. Chronic Dis.
2020 Jun; 25(11): 2040622320935765. PubMed Abstract
| Publisher Full Text
| Free Full Text
- 36.
Patanavanich R, Glantz SA:
Smoking Is Associated With COVID-19 Progression: A Meta-analysis.
Nicotine Tob. Res.
2020 Aug 24; 22(9): 1653–1656. PubMed Abstract
| Publisher Full Text
| Free Full Text
- 37.
Reis G, Dos Santos Moreira-Silva EA, Silva DCM, et al.:
TOGETHER investigators. Effect of early treatment with fluvoxamine on risk of emergency care and hospitalisation among patients with COVID-19: the TOGETHER randomised, platform clinical trial.
Lancet Glob. Health.
2022 Jan; 10(1): e42–e51.Epub 2021 Oct 28. Erratum in: Lancet Glob Health. 2022 Feb 24. PubMed Abstract
| Publisher Full Text
| Free Full Text
- 38.
Choudhury IM, Shabnam N, Ahsan T, et al.:
Effect of 1% Povidone Iodine Mouthwash/Gargle, Nasal and Eye Drop in COVID-19 patient.
Bioresearch Communications-(BRC).
2021; 7(1): 919–923.Dhaka, Bangladesh. Publisher Full Text
Reference Source
- 39.
Hasan ZT, Atrakji DMQYMAA, Mehuaiden DAK:
The Effect of Melatonin on Thrombosis, Sepsis and Mortality Rate in COVID-19 Patients.
Int. J. Infect. Dis.
2022 Jan; 114: 79–84. PubMed Abstract
| Publisher Full Text
| Free Full Text
- 40.
Pawar KS, Mastud RN, Pawar SK, et al.:
Oral Curcumin With Piperine as Adjuvant Therapy for the Treatment of COVID-19: A Randomized Clinical Trial.
Front. Pharmacol.
2021 May 28; 12: 669362. PubMed Abstract
| Publisher Full Text
| Free Full Text
- 41.
Marco A:
Supplementary material.pdf.
figshare. Figure.
2022.Publisher Full Text
Comments on this article Comments (0)