

Abstract
There is overwhelming evidence that minority populations across the United States (US) have been disproportionately affected by the coronavirus (COVID-19) pandemic. While the disparities are clear, the reasons underlying the rapidity of disease spread—characterized by the basic reproduction ratio R0—in these communities are less so. Here, we investigate the relative impact of disparities in socioeconomic, environmental, and lung health factors on R0 across 12 major metropolitan statistical areas (MSAs) in the US at the county-level. We inferred county-level R0 values using an established metapopulation epidemiological model corresponding to the period 1 March–30 April 2020 marked by a rapid surge in COVID-19 cases across the US and implementation of strict lockdown measures. We find that disparities in long-term, ambient PM2.5 exposure (particulate matter with aerodynamic diameter 2.5 μm or less) and population density have an outsized effect on R0 in comparison to disparities in the other factors. We also find that the effect of increasing population density on R0 is dependent on ambient PM2.5 mass concentrations. PM2.5 exposure has a well-established causal effect with increased risks and severe outcomes during previous infectious disease outbreaks. Overall, we find the largest disparities in PM2.5 exposure, population density, and associated increase in R0 among the Hispanic-American population, followed by Asian-American and African-American populations, respectively. Longstanding geographic segregation of minority communities has led to extremely large fluctuations in county-level racial and ethnic minority fractions. As such, we conclude by providing each MSA with a roadmap for identifying which communities should be targeted for PM2.5 mitigation policy implementation. The methodology and results of this study may be extrapolatable to the rest of the world toward discerning the consequences of population density and PM2.5 disparities in COVID-19 spread.
Export citation and abstract BibTeX RIS

Original content from this work may be used under the terms of the Creative Commons Attribution 4.0 license. Any further distribution of this work must maintain attribution to the author(s) and the title of the work, journal citation and DOI.
1. Introduction
In late 2019, a novel coronavirus, SARS-CoV-2, was discovered in the Wuhan Province of China. In the early months of 2020, the disease caused by this coronavirus (COVID-19) spread rapidly around the globe, including the United States (US) (Chinazzi et al 2020, Xu et al 2020, Li et al 2020a, Wu et al 2020a). Within the US, it has been found that a disproportionate number of COVID-19 cases and deaths are concentrated among racial and ethnic minority populations (Tai et al 2020). The reasons underlying these disparities likely arise from a combination of population density, poor living and working conditions, medical comorbidities, and long-term exposure to fine particulate matter (PM2.5; ambient particulate matter with aerodynamic diameter 2.5 μm or less), all of which has its roots in structural racism (Tessum et al 2019). A recent retrospective study has found that while PM2.5 concentrations have fallen steadily since the 1980s, disparities in PM2.5 exposure are persistent (Colmer et al 2020). Increasing minority fraction of total population correlates with worsening of relative air quality, while increases in white fraction of total population correlates with improvement in relative air quality (Colmer et al 2020). The persistence of inequities in PM2.5 exposure among minority communities inevitably leads to disparities health risks associated with chronic exposure to PM2.5.
Exposure to PM2.5 has been causally linked to increased death rates and severe outcomes during previous infectious disease outbreaks (Morales et al 2017, Clay et al 2018, 2019), and has recently been linked to the basic reproduction ratio R0–a dimensionless epidemic measure of the rapidity of disease spread through a population—and COVID-19 mortality rate in the US (Chakrabarty et al 2021, Wu et al 2020b). Following the deadly first wave of COVID-19 in Italy, Italian medical researchers posited a causal link between long-term air pollution exposure and SARS-CoV-2 infection–the 'double-hit phenomenon' (Frontera et al 2020). Patients chronically exposed to high concentrations of PM2.5 exhibit an overexpression of angiotensin-converting enzyme 2 (ACE2) (Lin et al 2018), which readily facilitates for the viral entry of SARS-CoV-2 and subsequent infection of cells in the early stages of the disease (Wan et al 2020). Over time, clinical observations of COVID-19 patients have suggested that viral loads of SARS-CoV-2 deplete residual ACE2 activity (Guan et al 2020). ACE2, to which the SARS-CoV-2 binds, plays an important role in lung protection by cleaving and converting angiotensin II (Ang II) to angiotensin 1–7 (Ang 1–7) (Tikellis and Thomas 2012). Depletion of ACE2 results in high circulating levels of Ang II, leading to conditions such as pulmonary vasoconstriction inflammation, and oxidative stress (Samir 2020). As a result, the disease takes a more severe form and spreads faster among the more vulnerable population.
Here, performing ecological regression modeling of an extensive set of confounding parameters, we show the dominant role of long-term ambient PM2.5 exposure and population density in the exponentially fast spread of COVID-19 among racial and ethnic minority communities in 12 US metropolitan statistical areas (MSAs) at the county level. The full names of each MSA can be found in table S1 (available online at stacks.iop.org/ERL/16/104046/mmedia) of the supplementary information (SI), they are namely, Saint Louis (STL), Chicago (CHI), Detroit (DET), Atlanta (ATL), New York City (NYC), San Francisco-Oakland (SFO), Portland (POR), Denver (DEN), Louisville (LOU), Cleveland (CLE), Philadelphia (PHI), and Dallas (DAL). A full list of the counties included as part of each MSA can be found in table S2. These MSAs were chosen based on their diverse racial and ethnic demographics, political ideologies, COVID-19 containment strategies, and geographic locations (see tables S3 and S4).
2. Methods
2.1. Rapidity of COVID-19 spread
The rapidity of COVID-19 spread in county n is measured using the time-average basic reproduction ratio ( ). The basic reproduction ratio is defined as the average number of individuals that an infected individual would infect per day in an entirely susceptible population. Thus, with increasing
  , disease spread among the population of county n becomes more rapid. The time period of 1 March to 30 April 2020 was selected for time-averaging because it corresponded to strict stay-at-home orders, targeted to mitigate the effects of disease transmission among different subsets of the population (Li et al
2020b). This time period also corresponded to the initial wave of the COVID-19 pandemic in the US, when there were no available COVID-19 vaccines. Details on the methodology used for acquisition of
, disease spread among the population of county n becomes more rapid. The time period of 1 March to 30 April 2020 was selected for time-averaging because it corresponded to strict stay-at-home orders, targeted to mitigate the effects of disease transmission among different subsets of the population (Li et al
2020b). This time period also corresponded to the initial wave of the COVID-19 pandemic in the US, when there were no available COVID-19 vaccines. Details on the methodology used for acquisition of  for each county can be found in two recent publications (Chakrabarty et al
2021, Liu et al
2020), as well as section S1 of the SI.
for each county can be found in two recent publications (Chakrabarty et al
2021, Liu et al
2020), as well as section S1 of the SI.
2.2. PM2.5 exposure profiles
We define long-term PM2.5 exposure in county n (PM2.5,n ) by averaging annually-resolved PM2.5 mass concentration in county n between 2000 and 2018. This data was gathered from recently published datasets, which combine ground-based observations, NASA's GEOS-CHEM model outputs, and satellite observations (van Donkelaar et al 2019). Full details regarding the acquisition of PM2.5 exposure profiles can be found in section S2 of the SI, and yearly resolved county-level PM2.5 exposure profiles can be found in table S5.
2.3. Population density, racial and ethnic demographics, and other confounding factors
The share of each county population is categorized under four groups as defined by the US Office of Management and Budget (Anon 2020): African-American, Asian-American, Hispanic-American, and white (see section S3 of SI). Figure 1 shows the geographic locations and racial and ethnic demographics of the 12 MSAs investigated in this study. Previous studies have established that increased  is associated with increased population density (Chakrabarty et al
2021, Smith et al
2021), and that increased urbanization is linked to increased ambient PM2.5 concentrations (Yang et al
2018, Han and Sun 2019). In order to separately investigate the effects of population density and PM2.5 on
is associated with increased population density (Chakrabarty et al
2021, Smith et al
2021), and that increased urbanization is linked to increased ambient PM2.5 concentrations (Yang et al
2018, Han and Sun 2019). In order to separately investigate the effects of population density and PM2.5 on  , county-wise population density is also collected from the 2019 American Community Survey (Anon 2020). To account for other outside factors which may also contribute to COVID-19 spread, 16 confounding factors were also investigated. To determine which confounding factors have the greatest effect on
  , we first group the confounding factors into three categories: environmental factors, socioeconomic factors, and health factors. Environmental factors include PM2.5 exposure, exposure to gaseous pollutants, and meteorology. Socioeconomic factors include population density, housing, and income. Health factors which are considered are prevalence of smoking and chronic obstructive pulmonary disease. We do not consider here other health factors which may lead to severe forms of COVID-19, and only investigate risk factors for disease onset, which include smoking and pulmonary disease (Tao et al
2020). A full list of the confounding variables investigated can be found in section S4 of the SI and table S3.
, we first group the confounding factors into three categories: environmental factors, socioeconomic factors, and health factors. Environmental factors include PM2.5 exposure, exposure to gaseous pollutants, and meteorology. Socioeconomic factors include population density, housing, and income. Health factors which are considered are prevalence of smoking and chronic obstructive pulmonary disease. We do not consider here other health factors which may lead to severe forms of COVID-19, and only investigate risk factors for disease onset, which include smoking and pulmonary disease (Tao et al
2020). A full list of the confounding variables investigated can be found in section S4 of the SI and table S3.
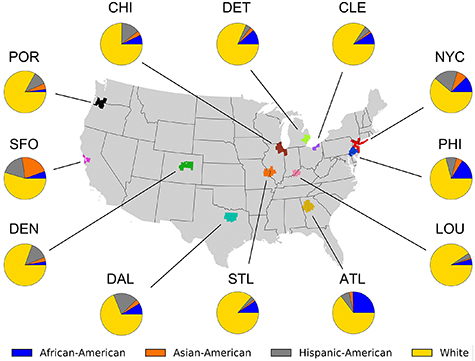
Figure 1. Geographic locations and racial and ethnic demographics of MSAs included in this study.
Download figure:
Standard image High-resolution image2.4. Disparities in PM2.5 exposure and population density
We next define a parameter, the bias factor (BFn,x ), to perform comparisons between the diverse group of MSAs investigated in this study. The BF is calculated by normalizing data points for a particular county by the MSA-average of county-wise variables, and is given by:
here, xn
generically denotes the variable of interest (PM2.5 concentration,  , population density, etc) for county n, and
  is the average value of xn
in the MSA where n is located; given by:
is the average value of xn
in the MSA where n is located; given by:
Subscript y represents the MSA in which n is located, and N represents the total number of counties contained in y. Values of  for each MSA are listed in tables S3 and S4. When BFn,x
is greater than one, it means that xn
is elevated relative to the surrounding region. For instance, a PM2.5 BF equal to 2 means that the PM2.5 concentration in county n is twice than that of the average county residing in the same MSA as county n. Use of BFs in analyzing data from an ecological regression model is extremely useful when examining
for each MSA are listed in tables S3 and S4. When BFn,x
is greater than one, it means that xn
is elevated relative to the surrounding region. For instance, a PM2.5 BF equal to 2 means that the PM2.5 concentration in county n is twice than that of the average county residing in the same MSA as county n. Use of BFs in analyzing data from an ecological regression model is extremely useful when examining  , as it allows for comparisons between MSAs which experienced epidemic peaks at differing times, have varying social and cultural norms, and subsequently implemented various virus containment strategies. Because of the desynchronization of early pandemic dynamics, and subsequent disease mitigation strategies between regions, use of BFs allows for more nuanced, relative comparisons
within
MSAs, where disease mitigation strategies are implemented in a more synchronized fashion (see figure S1). The use of BFs also allows for more nuanced investigations of PM2.5 exposure in relation to racial and ethnic demographics. The MSAs investigated in this study represent a wide range of PM2.5 concentrations, as well as a wide range of racial and ethnic demographics. For example, the Portland MSA is one of the whitest (∼87% white) and cleanest (PM2.5 concentrations < 5 μg m−3), and Atlanta is one of the most diverse (∼68% white) and most polluted (PM2.5 concentrations > 10 μg m−3). However, the Portland and Atlanta MSAs both exhibit large variability in PM2.5 exposure and racial and ethnic demographics. Therefore, normalization of county-wise data allows for investigation of disparities within MSAs (see figure S2 for visual representation of this example). It should be noted here that in the following text, we omit subscript n in the notation if there is no need to discriminate the county-wise statistics.
, as it allows for comparisons between MSAs which experienced epidemic peaks at differing times, have varying social and cultural norms, and subsequently implemented various virus containment strategies. Because of the desynchronization of early pandemic dynamics, and subsequent disease mitigation strategies between regions, use of BFs allows for more nuanced, relative comparisons
within
MSAs, where disease mitigation strategies are implemented in a more synchronized fashion (see figure S1). The use of BFs also allows for more nuanced investigations of PM2.5 exposure in relation to racial and ethnic demographics. The MSAs investigated in this study represent a wide range of PM2.5 concentrations, as well as a wide range of racial and ethnic demographics. For example, the Portland MSA is one of the whitest (∼87% white) and cleanest (PM2.5 concentrations < 5 μg m−3), and Atlanta is one of the most diverse (∼68% white) and most polluted (PM2.5 concentrations > 10 μg m−3). However, the Portland and Atlanta MSAs both exhibit large variability in PM2.5 exposure and racial and ethnic demographics. Therefore, normalization of county-wise data allows for investigation of disparities within MSAs (see figure S2 for visual representation of this example). It should be noted here that in the following text, we omit subscript n in the notation if there is no need to discriminate the county-wise statistics.
2.5. Associating PM2.5 exposure, population density, and COVID-19 spread
We find that the most significant predictors of  are PM2.5 exposure (p-value = 0.02) and population density (p-value = 1.69 × 10⁻⁹) (see table S6). Additionally, we find that there is not a statistically significant relationship between
  and any of the health factors considered as part of this study. Based on this finding, our analysis is focused on PM2.5 exposure and population density as the main determinants of
  . We used the Johnson-Neyman technique to investigate two-way interactions between PM2.5 BF and population density BF in predicting
  BF. The Johnson-Neyman technique allows one to investigate the effect that an independent 'predictor' variable has on the dependent 'response' variable (in this case
  BF), given the value of a second 'moderating' variable (Carden et al
2017). We also examine univariate relationships between PM2.5 BF, population density BF, and racial and ethnic demographic BFs using the widely-adopted generalized additive model (GAM) (Wood 2001, Zhang et al
2019) (average values of
BF), given the value of a second 'moderating' variable (Carden et al
2017). We also examine univariate relationships between PM2.5 BF, population density BF, and racial and ethnic demographic BFs using the widely-adopted generalized additive model (GAM) (Wood 2001, Zhang et al
2019) (average values of  and racial and ethnic demographics for each MSA can be found in table S4). The underlying function of GAM is given by:

where b denotes a constant intercept; s(,) denotes a thin-plate basis smooth function;  denotes a zero centered Gaussian noise, and df stands for degrees of freedom; df = 4 was chosen because a high-level of nonlinearity was not observed in the data trends. The restricted maximum likelihood method was adopted in the optimization to prevent overfitting. Independent variables in GAM analysis are bounded by the mean value ± two standard deviations.
3. Results
We find that there is a two-way interaction between PM2.5 BF and population density BF in predicting  BF. Figure 2 (left) shows the results of Johnson-Neyman moderation analysis as a best-fit surface of
  BF as a function of PM2.5 BF and population density BF, given by:

Figure 2. (Left) Best-fit surface from Johnson-Neyman moderation analysis for  BF as a function of PM2.5 BF and population density BF. Points show values used in Johnson-Neyman analysis with color representing the value of
  bias factor. (Right) The predicted value of
  using the PM2.5 and population density (pd) BFs (denoted as PM2.5—pd predicted
  ), yielded by the best-fit surface of the left panel, as a function of the observed value of
  . The best-fit surface overpredicts
  in areas with low population density BF and high PM2.5 BF, and underpredicts
  in areas with high population density BF and low PM2.5 BF. Overall, the best fit surface estimates
  with root mean squared error (RMSE) equal to 0.435.
Download figure:
Standard image High-resolution imagewhere pd BF is the population density BF, A = 0.1902, B = 0.3598, C = 0.2522, and D = 0.7271. Figure 2 (right) shows the accuracy of the best-fit surface by plotting observed values of  with the value of
  predicted from equation (4) (PM2.5—pd predicted
  , the result of equation (4) multiplied by
  ). The right panel of figure 2 shows that equation (4) overpredicts
  in areas with low population density BF and high PM2.5 BF, and underpredicts
  in areas with high population density BF and low PM2.5 BF. However, since areas with high population density BF tend to also have high PM2.5 BF (see figure S3). Therefore, equation (4) predicts
  with RMSE = 0.435. The finding that
  BF is dependent on both PM2.5 BF and population density BF leads to questions regarding which populations are subject to elevated PM2.5 concentrations and population density.
Figure 3 shows the slope of univariate GAM analysis of PM2.5 BF, population density BF, and the product of PM2.5 BF and population density BF vs the BF of three racial/ethnic minority groups, as well as BF of fraction of the population made up of white residents. These three measures correspond to the first, second, and third terms of equation (4). Residual plots for GAM fitting of the data shown in figure 3 can be found in supplementary figures S4–S6. The results contained in figure 3 show that counties which are relatively more diverse are associated with relatively high PM2.5 concentrations and relatively high population density. Figure 3 shows that communities with relatively high Hispanic-American populations are associated with the largest relative increase in PM2.5 concentration and population density, followed by Asian-Americans and African-Americans. It was also found that communities with relatively large White populations are associated with relative decreases in PM2.5 concentration and population density.
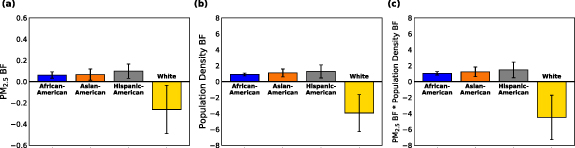
Figure 3. Average slope of univariate GAM analysis of (a) PM2.5 BF (PM2.5 BF), (b) population density BF (population density BF), and (c) the product of PM2.5 BF and population density BF as a function of racial/ethnic fraction BF. Increases in Hispanic-American fraction correspond to the largest increases in PM2.5 BF and population density BF, followed by Asian-Americans and African-Americans. Increases in the fraction of white residents correspond to decreases in PM2.5 BF and population density BF. The three panels of this figure correspond to the three terms contained in equation (4). Error bars show 95% confidence intervals.
Download figure:
Standard image High-resolution imageThe data contained in figure 3 give
relative
changes in PM2.5 concentration per
relative
change in racial and ethnic demographics. However, inter-MSA changes in county-wise racial and ethnic demographics can be converted to corresponding changes in  using the relation:
here, y is the MSA of interest,  is MSA-average of county-wise
  in y,
in y,  is the change in African-American, Asian-American, Hispanic-American, or White fraction,
  is MSA-average of county-wise x (contained in table S4),
  is the average slope of PM2.5 BF vs x BF (figure 3(a)),
  is the average slope of population density BF vs x BF (figure 3(b)), and
  is the average slope of the product of population density BF and PM2.5 BF vs x BF (figure 3(c)).
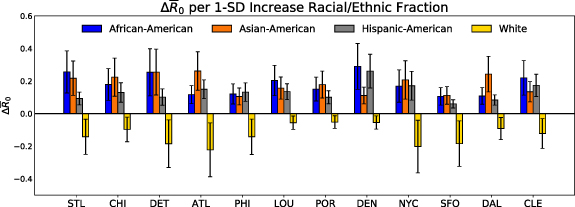
The change in  corresponding to a 1-standard deviation (1-SD) increase in racial and ethnic minority fraction has been calculated for each MSA (
 ), and the results are shown in figure 4. A 1-SD increase in racial and ethnic fraction was chosen because MSAs which demonstrate high degrees of geographic segregation of racial and ethnic minority populations will correspondingly exhibit large standard deviations of racial and ethnic minority fractions (SD for each MSA can be found in table S7). Therefore, the information contained in figure 4 can be used to determine the consequences of elevated long-term PM2.5 exposure and population density on the speed of COVD-19 spread among racial and ethnic minority communities in each MSA. For example, Jefferson county in the Denver MSA has 50% higher African-American fraction than the average Denver county. The residents of Jefferson county have historically been exposed to higher concentrations of PM2.5 than the average Denver county (+19%). The disparity in long term PM2.5 exposure has left this population more susceptible to decreased lung function, and more susceptible to COVID-19. Increased susceptibility to COVID-19 among Jefferson county residents, paired with higher population density than the average Denver county (+32%) has translated to faster spread of COVID-19 among this subset of the Denver population (20% higher
  ). Since Jefferson county has a larger African-American fraction than the average Denver county, the Denver MSA has a relatively large standard deviation of African-American fraction (
 in equation (5)). This means that overall, African-American communities of Denver have had the highest
  due to PM2.5 exposure and population density.
Figure 4. Average change in  corresponding to a 1-SD increase in racial and ethnic minority population has been calculated for each MSA. (These results show which racial and ethnic groups have experienced the largest disparities
  in each MSA. Error bars show 95% confidence intervals.)
Download figure:
Standard image High-resolution image
It is important to consider that county-level ecological regression models, such as ours, are subject to limitations. These include an inability to account for individual-level associations or risk factors, discrepancy between county-average features and COVID-19 patient features, and results that are sensitive to underlying assumptions of the statistical model (Wu et al 2020b). In addition, the use of county-level long-term PM2.5 exposure assumes that all residents of a particular county are exposed to equal PM2.5 concentrations, leading to exposure misclassifications (Wu et al 2020b). However, county-level ecological regression models allow for computationally efficient inferences, utilize data that is representative of the entire county population, and make use of well-validated surface level-PM2.5 datasets (van Donkelaar et al 2019) which are aggregated to assess the distribution of exposures across entire counties.
4. Discussion
The overall implications of our findings are that racial and ethnic minority communities have been historically subject to elevated PM2.5 exposure, leaving these communities more susceptible to COVID-19. The susceptibility of racial and ethnic minority populations to COVID-19, coupled with high population density among these communities leads to faster disease spread. It should be noted that the overall conclusion that minority communities in US MSAs are subject to increased PM2.5 exposure, population density, and subsequently more rapid COVID-19 spread holds even when the extremes of the error bars of figure 4 are considered.
From the policy perspective, there has been a recent push from the Biden administration to address racial and ethnic disparities related to the COVID-19 pandemic. This push includes the creation of a task force with the goal of describing 'the drivers of observed COVID-19 inequities, the potential for ongoing disparities faced by COVID-19 survivors, and actions to ensure that future pandemic responses do not ignore or exacerbate health inequities' (Anon 2021). The findings outlined in this study show that PM2.5 exposure is one such driver of observed COVID-19 inequities, as well as an ongoing disparity faced by COVID-19 survivors, and highlight the urgency needed to address these inequities. The data contained in figure 4 provide insight as to which racial and ethnic groups have been most impacted by long-term PM2.5 exposure and elevated population density in each MSA, and should be used to inform policy which is specifically aimed at reducing inequities. A recent study of PM2.5 concentrations among US census tracts has shown that PM2.5 concentrations in the US have fallen steadily since the 1980s. However, the most polluted census tracts in 1981 remain the most polluted in 2016, indicating that the decrease in PM2.5 concentrations has not addressed relative disparities in exposure to PM2.5 (Colmer et al 2020). This study adds to a growing body of evidence that previous attempts to decrease PM2.5 concentrations in the US have overall succeeded, but they have not addressed racial and ethnic disparities in PM2.5 exposure, which has contributed to the rapid spread of COVID-19 among these communities. In order to address the disparity of COVID-19 spread among racial and ethnic minority communities, lingering disparities in PM2.5 exposure and population density must be addressed using MSA-specific policy, including reducing PM2.5 concentrations in targeted areas.
We show here that  is sensitive to population density and PM2.5 exposure, and that minority populations in the US are particularly vulnerable to increases in these two variables, which has cause elevated
  in minority communities. While we investigate only cities within the US, the methods utilized in this work can be extrapolated to other regions of the globe. Our methods may be especially useful for studies on the consequences of population density and PM2.5 disparities in Europe, where there is evidence of increasing segregation of minority communities (Tammaru et al
2016).
in minority communities. While we investigate only cities within the US, the methods utilized in this work can be extrapolated to other regions of the globe. Our methods may be especially useful for studies on the consequences of population density and PM2.5 disparities in Europe, where there is evidence of increasing segregation of minority communities (Tammaru et al
2016).
We consider it important to acknowledge the limitations of this study. First, the robustness of our model prediction could be limited by the coarse-grain spatial representation of model variables, such as the PM2.5 exposure profile and  . Census tract-level distributions of PM2.5 exposures are readily washed away upon averaging the data points residing within county lines. Based on past findings (Crouse et al
2020), we anticipate a census tract-level analysis will not alter the nature of the relationship established between the variables in this study, although the strength of their associations might vary. Future analysis should include COVID-19 epidemic parameters and PM2.5 exposure data at finer-grain levels, e.g. census tract-level (Gershengorn et al
2021). We also divide racial and ethnic minority populations into three groups which encompass a wide range of individuals. Future work should be directed at investigating nuances in PM2.5 exposure, population density, and
. Census tract-level distributions of PM2.5 exposures are readily washed away upon averaging the data points residing within county lines. Based on past findings (Crouse et al
2020), we anticipate a census tract-level analysis will not alter the nature of the relationship established between the variables in this study, although the strength of their associations might vary. Future analysis should include COVID-19 epidemic parameters and PM2.5 exposure data at finer-grain levels, e.g. census tract-level (Gershengorn et al
2021). We also divide racial and ethnic minority populations into three groups which encompass a wide range of individuals. Future work should be directed at investigating nuances in PM2.5 exposure, population density, and  among racial and ethnic groups which fall under these umbrella classifications. Future work should also be directed at investigating age-stratified nuances in PM2.5 exposure and
  .
.
Acknowledgments
The authors would like to thank Dr C Arden Pope III (Brigham Young University) and Dr Pai Liu (Beijing Institute of Technology) for their guidance and insightful suggestions in carrying out this study.
Data availability statement
All data that support the findings of this study are included within the article (and any supplementary files).
Funding
This project was supported in part by funds from the NIH Grant No. U01AA029331 and by funds from the Social Policy Institute and McDonnell International Scholars Academy.
Ethical statement
The authors declare that they have no known competing financial interests or personal relationships that could have appeared to influence the work reported in this paper.