1. Introduction
The COVID-19 (coronavirus disease) pandemic spread has virtually paralyzed daily life, and the world is facing huge challenges getting back to normal. COVID-19 affects economies, societies and the environment worldwide, in particular, by modifying human mobilization and transportation patterns. The indirect effects on the environment that this situation is causing on Earth have been recently highlighted by different scientists throughout the world, as a decrease in air pollution in Europe shown by the European Space Agency (ESA) and in Asia shown by the National Aeronautics and Space Administration (NASA) [
1], decrease in turbidity and a healthy state of aquatic environments as in Venice Lagoon [
2] and in the Indian Vembanad Lake [
3] or decrease in cities’ pollution due to reduction in automobile traffic [
4]. Some of these positive impacts have been confirmed thanks to satellite technology, the only methodology able to provide global, synoptic and mesoscale data in short periods of time.
Monitoring the maritime traffic is key as a socioeconomic and human indicator. Quantifying these transportation services at local, regional and national scales from space could advise on identifying the most affected regions as well as national and international activities and businesses. One of the affected means of transport has been maritime traffic. This modality is one of the oldest in humanity, and today, it is essential for the transport of goods and passengers, especially in isolated areas, as are many regions in Patagonia. The maritime connectivity in Latin America was affected by the state of emergency declared by the governments in most of the countries immediately after the declaration of the pandemic by the United Nations. The countries that include Patagonia, Chile and Argentina (
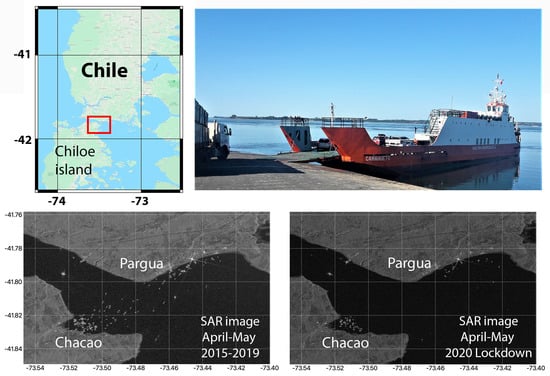
Figure 1) were immediately affected. The connectivity in the area started to be affected after the closure declared by the Chilean Government on 24 March 2020 [
5] due to the COVID-19 pandemic that plagues the world.
The detection of ships from space for maritime surveillance and security applications has expanded its use due to the worldwide increase in maritime traffic, environmental surveillance and illegal fishing. Traditionally, the identification of ships by human observers is time-consuming and cannot be conducted on a very large scale. For this reason, the development of algorithms to detect ships from synthetic aperture radar (SAR) has increased during the last decades and nowadays is used operationally [
6]. This type of radar uses electromagnetic wave spectrum in a range of frequencies between 0.3 and 300 GHz, equivalent to wavelengths between 1 cm and 1 m. This radiation can penetrate the majority of clouds and provides data about the oceanic surface features, waves, currents, oil spills, wind fields and vessel detection at any time of the day [
7]. SAR information can be combined with the automatic identification system (AIS) signals to identify ships as routine surveillance. This technology was used to detect ships in the coastal regions of Indonesia [
8], Italy [
9] and India [
10], among others. In our region of study, SAR data for ship detection applications are routinely used for surveillance by governmental institutions as the Argentinean Naval Coastguard, the Argentinean Navy and the Chilean Navy. However, as far as we know, no scientific research has been conducted before with Sentinel-1, which is the aim of this study.
Sentinel-1 is the first of the five missions that the European Commission and ESA are developing for the Earth Observation Copernicus programme. Sentinel-1 data are used across many meaningful domains, including maritime activity, sea-ice mapping, humanitarian aid, crisis response, forest management, and flooding, among others. Compared to other ESA instruments, Sentinel-1 provides wide coverage for vessel surveillance with improved revisit times and allows the detection of smaller vessels, such as pleasure crafts. The mission’s ability to observe with all weather conditions, during day and night, facilitates frequent monitoring, making it ideal for the precise location of vessel activities at sea, and enabling for more efficient and profitable use of other security assets [
11]. Sentinel-1 is working in a preprogrammed operational mode and produces a consistent long-term data archive built for applications based on long time-series. Sentinel-1 data availability started in 2014 and continues up to the present.
Google Earth Engine (GEE) is a free cloud-based platform for planetary-scale geospatial analysis [
12], developed by the company Google. This tool can be used for scientific analysis on a petabyte (PB) scale and the visualization of geospatial data sets, both for the public benefit and for commercial and government users. The main benefit of this platform is the data analysis capacity since it stores satellite images, organizes them and makes them available for the first time for data extraction on a global scale, open to the public. The data archive includes historical images that go back more than forty years. GEE also provides APIs in JavaScript, as well as other tools, which were implemented in this study to allow the analysis of many sets of Earth Observation data as products from the European Commission’s Copernicus programme. EO Browser [
13] is an open-source web-based tool for browsing, visualization and analysis of satellite imagery available at various platforms, such as the Sentinel missions. The application makes it possible for anyone with Internet and web browser to find out, which data are available at a specific location, instantly visualize it up to the full resolution, perform various analytics, compare data from various acquisitions, create time-lapses, and export data for further analysis in desktop GIS tools, among others.
The aim of this study is to demonstrate that the combination of remote sensing data, in particular Sentinel-1 imagery, and global platforms as GEE and EO Browser can be exploited in remote areas, as several strategic channels and straits in South America, under emergencies and exceptional situations as was during the COVID-19 lockdown. These methodologies are relevant for maritime surveillance not only during pandemic periods in relation to the socioeconomic significance of the maritime traffic but also for other operational applications, such as illegal fishing, salvage and environmental monitoring. In this study, we focused on the western area, the Chilean territory interrupted by fjords and channels where there is not any road available to get to the south of the continent, for which the maritime connection is daily used by the citizens. Maritime connectivity in these Patagonian regions has been an essential element in the history of regional development since during most of the 20th century; this territory was only accessible by means of ships and aircraft due to the absence of roads. The only land route with the rest of the country is by crossing through the Argentinean territory.
2. Study Area
On a 1600 km north-south line, the coastline of the study region comprises an extended number of kilometers due to the complex geomorphology of the area [
14], including the Andes Mountains, channels, fjords and glaciers. The expansion of the population was developed in small coastal settlements communicated by the sea or in small towns located in the valleys with very limited connectivity. The maritime connections analyzed in this work include three areas located along Patagonia (
Figure 1). The three selected regions of interest are along the coast of Chile: two in the so-called lakes region and the third one in the Magellan region. The sites corresponded to the Chacao Channel, the first maritime connection in the austral road, the cross of the Reloncavi Fjord, and the navigation across the Strait of Magellan to Tierra del Fuego, the most southern land area of the American continent.
The Chacao channel is located in the south of Chile at latitude 41°S (41°47′12′′ S 73°31′59′′ W;
Figure 1). It separates the continental area of the country from the insular territory of western Patagonia in Latin America. The first mention of this channel was reported by Francisco de Ulloa in 1553. The north side of the channel marks the end of the South Pan-American Highway, which crosses the entire American continent 48,000 km from Prudhoe Bay in Alaska up to Ushuaia in Argentina. This channel is one of the most relevant logistic connections of the Southern regions of Chile, as it allows the exchange of goods with Isla Chiloé, a region of the country, which covers around 9000 km
2 and it is inhabited by more than 168,185 people, according to the census carried out in 2017 by the National Institute of Statistics of Chile [
15]. This channel has a width of 1 nm (1.8 km) in its narrowest part and 2.5 nm (4.6 km) in its widest part. Maritime connectivity is carried out by barges managed by two national companies: Transmachilay and Cruz del Sur. Currently, each company has four ferries that operate 24 h a day, 7 days a week, 365 days a year. It is worth highlighting the relevance of the big Island in terms of the logistics for the salmon farming companies located along this region of Chile and southwards. The coastal ecosystems on which the population depends are areas of high biological diversity with complex oceanographic dynamics allowing the development of artisanal fishing. Nowadays the aquaculture activity plays a major role in the economy of these regions and in the country [
16]. The Chilean aquaculture industry has the second position worldwide in relation to the production volume, and it is the third economic activity of the country [
16].
The second maritime crossing analyzed in this work is located 46 km after Puerto Montt, the last city of the austral road (
Figure 1). The crossing is located in Caleta La Arena at 41°41.558′S and 72°38.515′W and connects with Caleta Puelche after navigation of 3.6 nm (6 km), 30 min crossing the mouth of the Reloncavi Estuary. This is the first point in the bi-modal route towards the region of Magellan. It is connected by road and barges, and part of the Argentinean territory as the roads in Chile do not exist due to the presence of the big northern and southern ice fields. The company that operates 365 days a year in this crossing is Transportes del Estuario. This is the safer option to arrive at Caleta Puelche as the alternative is a road of more than 200 km, with a large dangerous stretch of more than 50 km of roads in unsafe conditions of cliffs next to the road, landslide areas of mountain ranges, among others aspects, which makes the maritime option safer and faster.
The third case of study is the Strait of Magellan (
Figure 1). This is the southern sea route in Chile, which separates mainland South America to the north and Tierra del Fuego to the south. The strait is considered the most important natural passage between the Atlantic and Pacific oceans. Described 500 years ago by the European explorer Fernando de Magallanes, it is difficult to navigate due to frequent bad weather fronts and unpredictable winds and currents. Nevertheless, two companies carry out the navigation and transport of people and vehicles to Tierra del Fuego: Austral Broom and Naviera Puelche-Tierra del Fuego. The width of this channel is 2 km (1.2 nm) at the narrowest point to Tierra del Fuego. This big island is divided territorially between Chile and Argentina. The Chilean part has a population of 8364 inhabitants, and its main city is Porvenir. The Argentine part has a population of 160,720 inhabitants, according to the 2010 census. Its main city is Ushuaia, and the main population is located in the Rio Grande.
All these maritime connections are very relevant for the economic activities of the region, the healthcare and the supply of goods to the isolated populations. In this paper, we focused on the changes in the maritime traffic patterns in relation to the outbreak of the COVID-19, which especially implicated travel and marine mobility restrictions not only in Chile, as demonstrated in this study, but globally.
3. Materials and Methods
SAR data from the sensors onboard the Sentinel-1 satellites were used to detect vessels on the three maritime lines in Patagonia. SAR is a type of active data collection; a sensor produces its own energy and then records the amount of that energy reflected back after interacting with the Earth. This energy interacts with the target, so targets with high backscattered signals are identified as bright spots and flat smooth surfaces as dark areas in the radar images. This concept allows the identification of objects on Earth depending on the physical and electrical properties of the object [
17]. SAR instrument onboard Sentinel-1 provides continuous, all-weather, day-and-night imagery at C-band SAR for operational applications. The Sentinel-1 mission comprises a constellation of two polar-orbiting satellites. The products are available in single-polarization (VV or HH, where VV is single co-polarization, vertical transmit/vertical receive and HH is single co-polarization, horizontal transmit/horizontal receive) for WM (wave) acquisition mode and double polarization (VV + VH or HH + HV) or single polarization (HH or VV) for all other SM (stripmap), IW (interferometric wide swath), and EW (extra-wide swath) modes. The information is available systematically and is free of charge to all users. Data are distributed 1 h after receipt for near-real-time (NRT) emergency response, within 3 h for NRT priority areas, and within 24 h for systematically archived data. For this study, daily SAR Sentinel-1 data from ascending and descending orbits, IW swath mode and VH polarization images were downloaded from the Sentinel EO Browser. A total of 44 daily images were used for the Canal Chacao, including ascending and descending passes, 43 for the Reloncavi Fjord and 57 for the Strait of Magellan. In addition, the Sentinel-1 data from the Copernicus Collection on GEE was used (2015–2020).
Two approaches to detect vessels were carried out. The first one was proposed by Gascoin (2019) [
18], based on a maximum map composite developed in GEE from its Sentinel-1 image collection [
12]. A preliminary analysis using the GEE platform and Sentinel-1 data (
Figure 2) was developed to define the precise areas of interest as input to quantify the anchored ships and to determine ships in navigation in order to generate the products used in this study. A second approach based on object-oriented programming was implemented using daily Sentinel-1 imagery in order to have a quantitative method to analyze the number of vessels along the years of the studied period. GEE allowed us to implement spatial and mathematical operations on satellite imagery using the Code Editor. Gascoin (2019) provides a GEE script code as a simple way to visualize the sea lanes in Sentinel-1 images time-series. It is based on the contrast between the scattering of surface water, which is very low, and the scattering of vessels that is very high. The results are black pixels for water and bright pixels for vessels, displayed as black and white areas, respectively. The output is a map composite from the maximum of each pixel across a time-series of Sentinel-1 images collection on GEE. The products used in this study were provided by the Sentinel-1 satellites in GEE (ID collection COPERNICUS/S1_GRD). These data correspond to IW, including ascending orbit pass (acquisition time around 23:40 GMT) and descending orbit pass (acquisition time around 9:20 GMT), both with transmitter–receiver polarization (VH). This collection contains all of the ground range detected (GRD) scenes. Each scene has one of three resolutions (10, 25 or 40 m), 4 band combinations (corresponding to scene polarization) and 3 instrument modes. Use of the collection in a mosaic context required filtering down to a homogeneous.
Once the Sentinel-1 from Copernicus Collection on GEE was loaded, a filter by metadata properties was applied in order to get images with VH polarization and interferometric wide swath mode. In addition, a date filter was applied, considering the months April to May of 2015–2020. Finally, the maximum composite was done after filtering the images to get images from similar angles of view. After generating the products with GEE, the maps were exported to GeoTIFF format (
Figure 2).
To identify each vessel on daily radar images, a search method was implemented using object-oriented code to classify similar data values within the images. It was assumed that the water reflectance values were equal to zero, and values originated from vessels were higher on the Sentinel VH decibel gamma orthorectified images. To avoid interference, the land was masked prior to analysis. Given a starting location and search range, all the pixels connected with the starting point within the specific range were selected, and an identifier value was assigned to these vessel pixels. These daily detections were used to compute the total number of vessels and those vessels that were sailing and crossing the channels. Moreover, a seasonal composite was made of all vessel detections in April–May, and then all the years were combined into a single image to visualize the entire study period. The results of the daily vessel detections were summarized for the months April–May of each year from 2017 to 2020. To carry out the analysis, the total number of radar images used, the total number of vessels for the whole period, the total number of vessels underway, and the average number of vessels per day were considered.
4. Results and Discussion
The maps of the total number of ships for the entire study period in each area of interest are presented in
Figure 3. These are GEE products of the maximum composite method.
As of early April 2020, the ship reduction was drastically diminished in the areas of study. The maritime route of the Chacao Channel is the main gateway to Chiloe Island. The ferries run 24 h a day and 7 days a week. The lane crosses from the small town of Pargua (on the mainland) to Chacao (on the island). The results show the complete absence of ship traffic, with dense anchored vessels on both sides of the channel (
Figure 3A). In the case of the Reloncavi Estuary, most of the vessels were anchored in Caleta La Arena (north side). The sea lane is well defined for this area, from Caleta La Arena to Caleta Puelche (
Figure 3B). The maximum composite for the Strait of Magellan showed a sea lane from Bahia Azul to Punta Delgada. Most of the vessels were anchored north of Punta Delgada (
Figure 3C) during the period of study. These preliminary analyses were used to define the maritime routes to quantify vessels in navigation for each year.
The oriented object algorithm was able to successfully represent the observed vessels in the three study areas for the study period April–May 2017–2020 (
Figure 4,
Figure 5 and
Figure 6). The results for the Chacao Channel were computed from 44 Sentinel-1 scenes; 24 in ascending and 20 in descending mode acquisition (
Table 1). The number of images available for each year was the same for the descending pass, and the cumulated frequency remained similar between years (
Table 1). However, no vessels were recorded in the descending passes for the lockdown of April–May 2020 (
Figure 4;
Table 1). The impact of the lockdown was clearer in the descending pass with a total absence of vessels; although there were some vessels in the ascending passes, the average number of ships in the sea lane per day was minimum in 2020 (
Table 1).
For the Reloncavi Estuary, a total of 43 SAR Sentinel-1 images were used for vessel detection; 26 in ascending mode and 17 in descending mode (
Table 2). More detections were recorded in the ascending passes, approximately 23:40 UTC; 19:40 h local time (
Figure 5). The maritime traffic decreased at dawn, and this is reflected in the descending pass at approximately 10:00 UTC (06:00 local time) when there were no vessels crossing the Reloncavi Estuary in the radar images available in 2020 (
Table 2,
Figure 5). The number of vessels in the sea lane by day is low in 2020 for both ascending and descending passes.
In the Strait of Magellan, 41 SAR Sentinel-1 ascending passes and 16 in descending passes were encountered (
Table 3). In this case, since the service is not 24 h in the descending passes, no ferry traffic was observed throughout the study period, with the exception of 3 vessels detected in 2020. When these vessels were observed on the vessel detection map for the descending pass, it was observed that they were not on the sea lane Bahia Azul-Punta Delgada, but they were crossing the strait in an east-west direction (
Figure 6). The number of ships by route per day decreased throughout the study period, with the lowest value reached in 2020 (
Table 3). During the lockdown months of April–May 2020, most of the vessels were anchored on both sides of the strait.
Pandemic response monitoring is a very time-sensitive application and can be supervised through simple statistical analysis along the study period, as indicated in this research. Using remotely sensed SAR data, we showed how to automatically detect ship traffic over time and how to automatically identify anomalies in temporal sequences, which can be used to keep track of several places of interest simultaneously (
Figure 3,
Figure 4 and
Figure 5). The significant reduction in ship travel during the COVID-19 confinement was demonstrated in this study, where the pattern began rapidly over the period when the lockdown was initiated on 24 March 2020.
The COVID-19 custom script contest by Euro Data Cube has already demonstrated the potential of Earth Observation data to support the COVID-19 crisis [
19]. The ESA, in coordination with the European Commission, has launched this special edition of the custom script contest for ideas on how satellite data could help monitor and mitigate the situation for the upcoming months, while the world needs to adapt to this crisis. One of the awarded proposals was focused on monitoring boat traffic before/during/after COVID-19 with Sentinel-2 imagery [
20]. However, optical imagery from the Sentinel-2 twin satellite mission may present critical time gaps and limitations; clouds, snow, ice, smoke, wave, and algae will be detected as false-positive. In addition, the Sentinel-2 based algorithm can fail in places where boats are stationary or if traffic is congested. By using Sentinel-1 SAR data, those issues can be overcome [
21,
22]. The Sentinel-1 mission’s ability to observe in all weather and in day or nighttime makes it ideal for precise cueing and location of ship activities at sea, allowing for more efficient and cost-effective use of other security assets, such as patrol aircraft and ships [
23]. Sentinel-1 uses wide area coverage with improved revisit times and is able to potentially detect smaller ships than other SAR instruments [
24]. Sentinel-1 routinely produces a large number of images over the seas and coasts, in particular in Europe and the Arctic, but also elsewhere on the globe, as demonstrated in this study. Up to now, software to analyze satellite SAR images for ship detection was limited to handle a few images at the time, so it was not up to the high production volume of Sentinel-1. In this sense, GEE and EO Browser are a significant advantage to fully automate the processing of large amount of images [
12]. With this increased capability, time-series of many months/years of Sentinel-1 images can be evaluated by remote sensing experts, scientists, managers and the interested public, as, e.g., revealing the decrease in boat traffic during COVID-19 lockdown.
Monitoring boat traffic during pandemic and crisis events could help understand the modal transportation shift and help businesses reorganize, as well as provide transparency to citizens and governments in a more comprehensive way. The straightforward approach proposed in this study combining Sentinel-1 with GEE and EO Browser would benefit from complementary land and aerial transportation data developed under the Copernicus program. This approach will definitely bring key information on when and how quickly boat traffic numbers will be recovered since measurement of international (or domestic) passenger ship travel volumes can be used as a proxy for many economic activities. Besides these economic and emergency aspects, ship tracking may also help to indicate the patterns of movement and concentration of people to assist policymakers in coordinating post-lockdown pandemic suppression measures. It can also be extended to address different research questions or potential applications in different contexts in the frame of the sustainable development goals, such as monitoring fisheries in marine protected areas or UNESCO world heritage sites. In addition, during the period when this work was carried out, various sources from the press and from Institutions, such as the Argentinean Coast Guard [
25], have mentioned the major frequency of marine mammals, particularly killer whales, in the Strait of Magellan. The reasons would theoretically be associated with the decrease in maritime traffic. These observations should be analyzed in future studies in relation to the post-pandemic period. By using the techniques presented in this work, it will be possible to combine in situ coastal observations and remote sensing data to contribute to coastal monitoring of the marine fauna in Patagonia.


