
Factor Analysis of Students’ Knowledge Assessment Based on the Results of Online Entrance Testing in Mathematics to the University under the Conditions of COVID-19


Abstract
:1. Introduction
- As far as we know, this is the first work addressing the problem of quantifying the objectivity of the university entrance exam results in an online format.
- We collected a new dataset of students’ performance in mathematics based on online entrance tests and exam sessions. The dataset also contains socio-demographic indicators, including gender, age, citizenship, level of previous education, etc.
- We conducted a factor analysis of students’ knowledge assessments based on the results of online entrance testing to the university under the conditions of COVID-19.
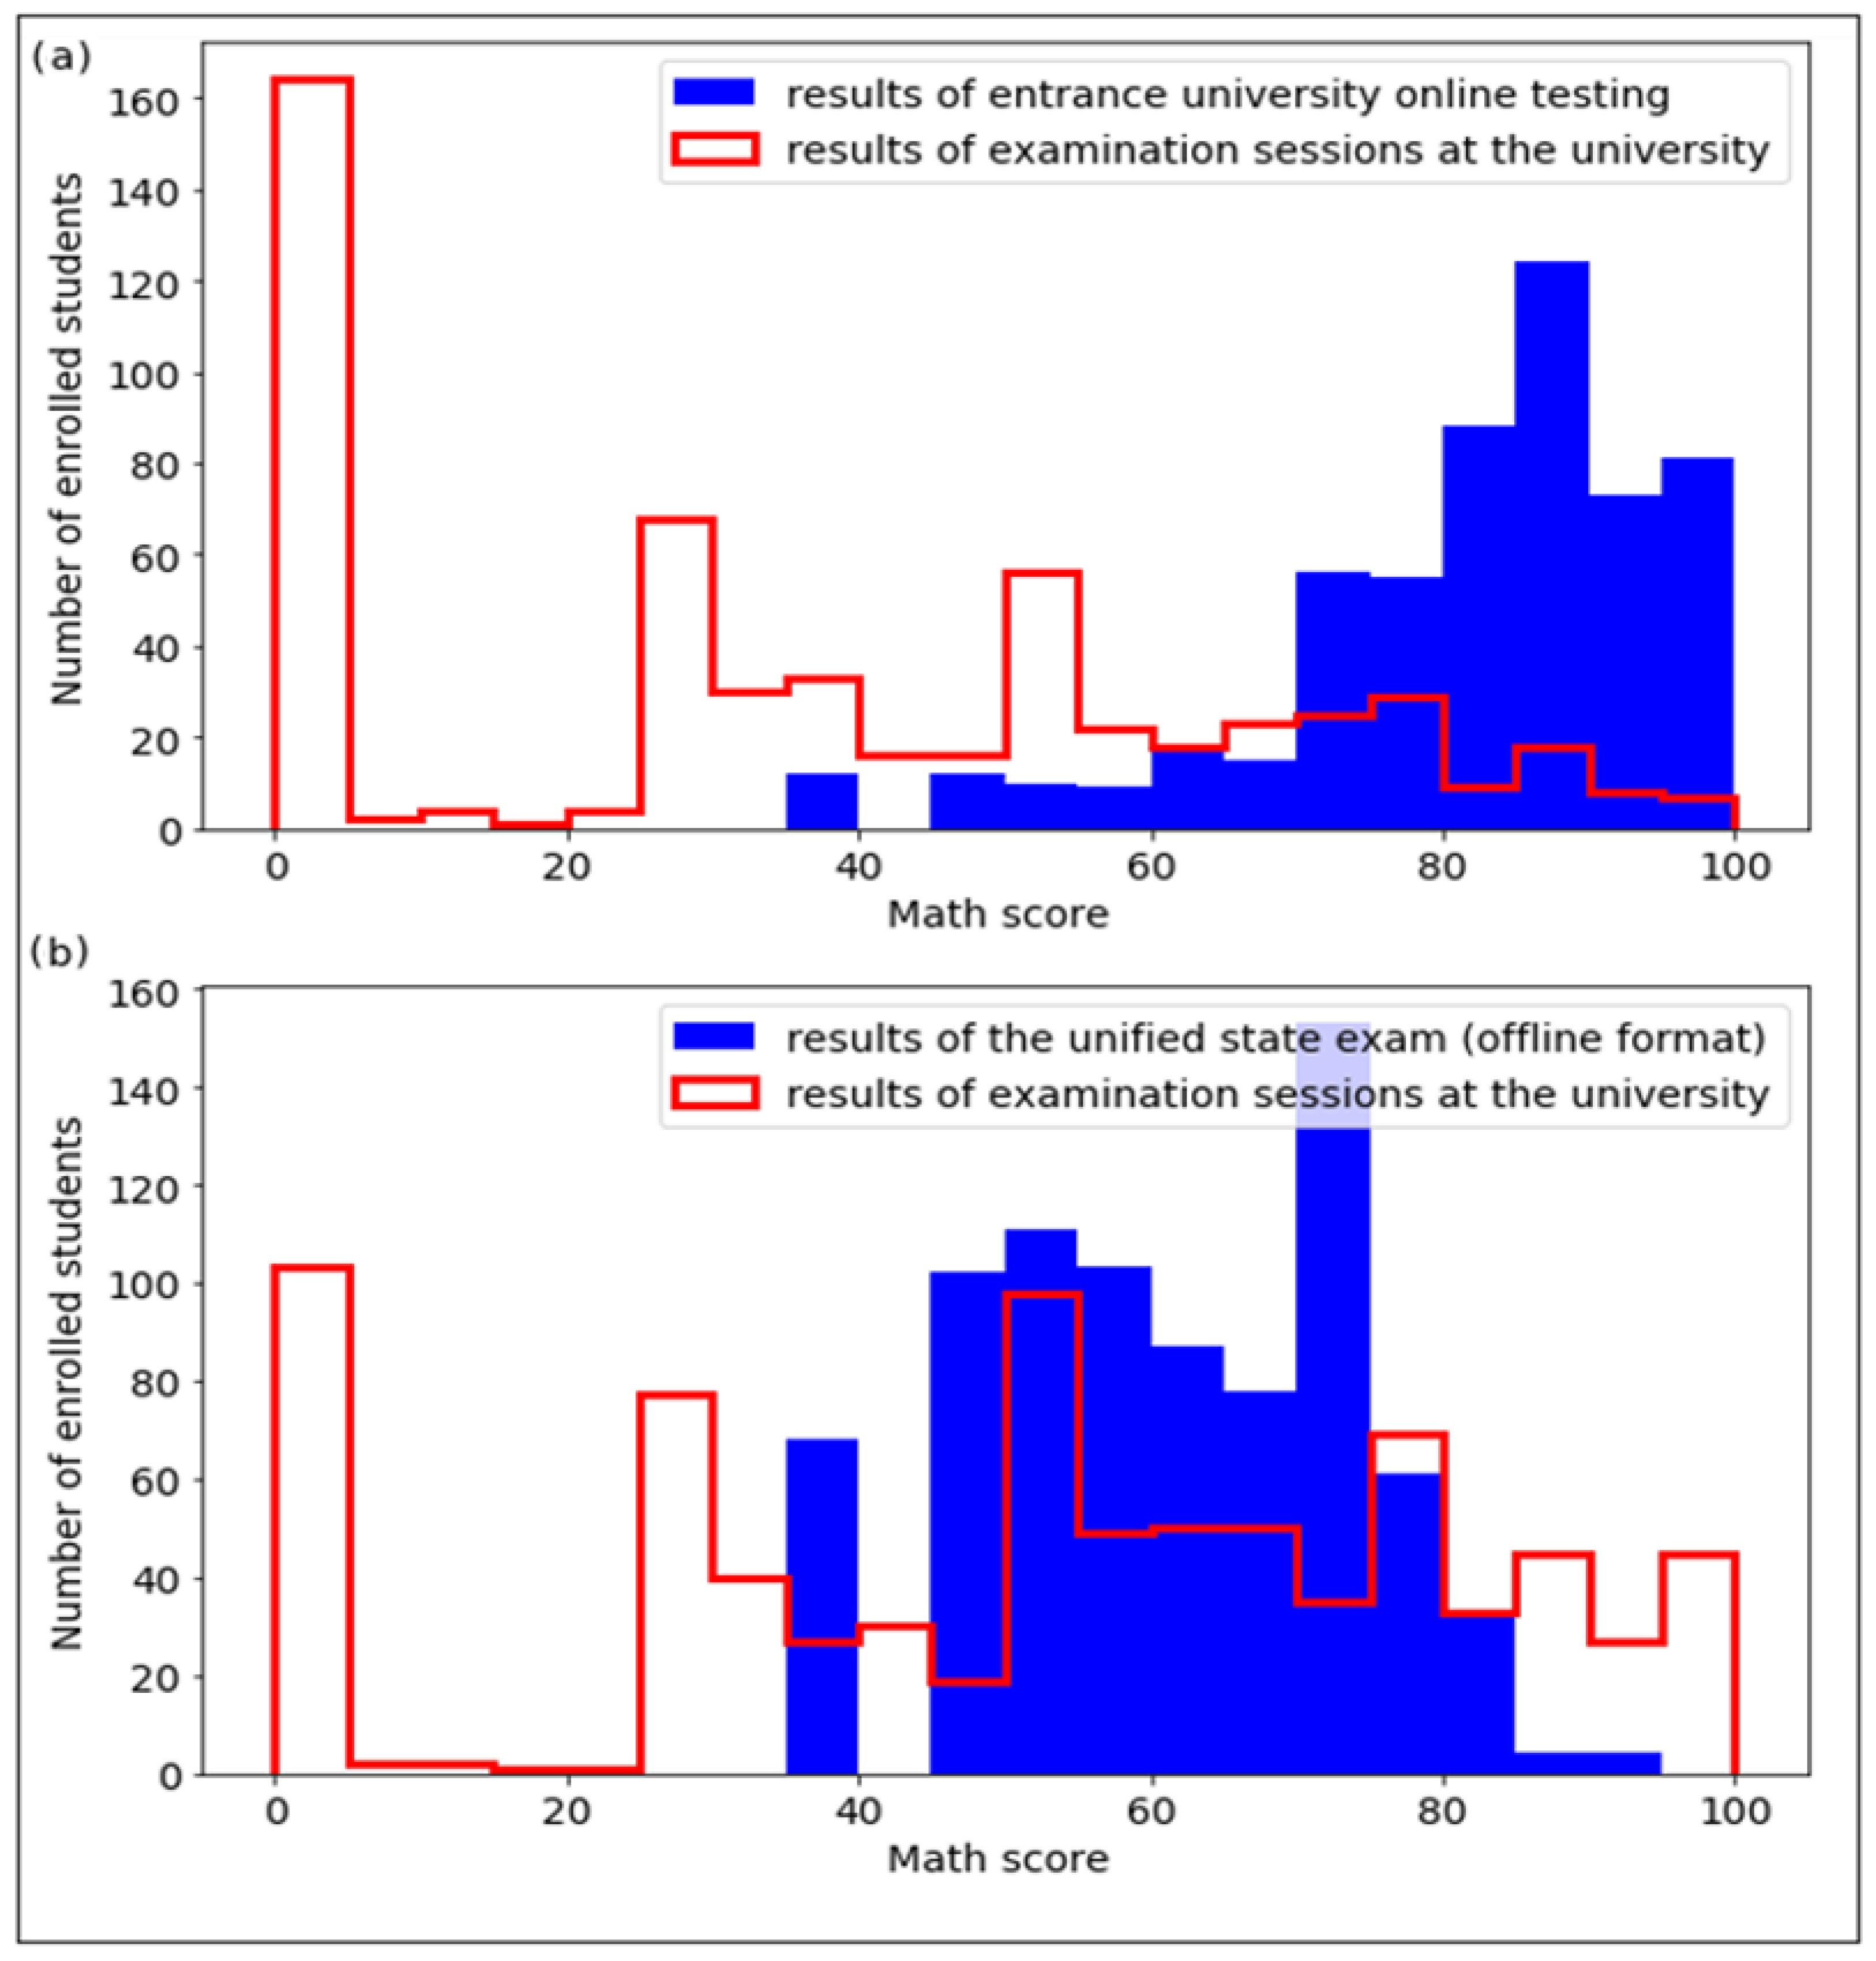
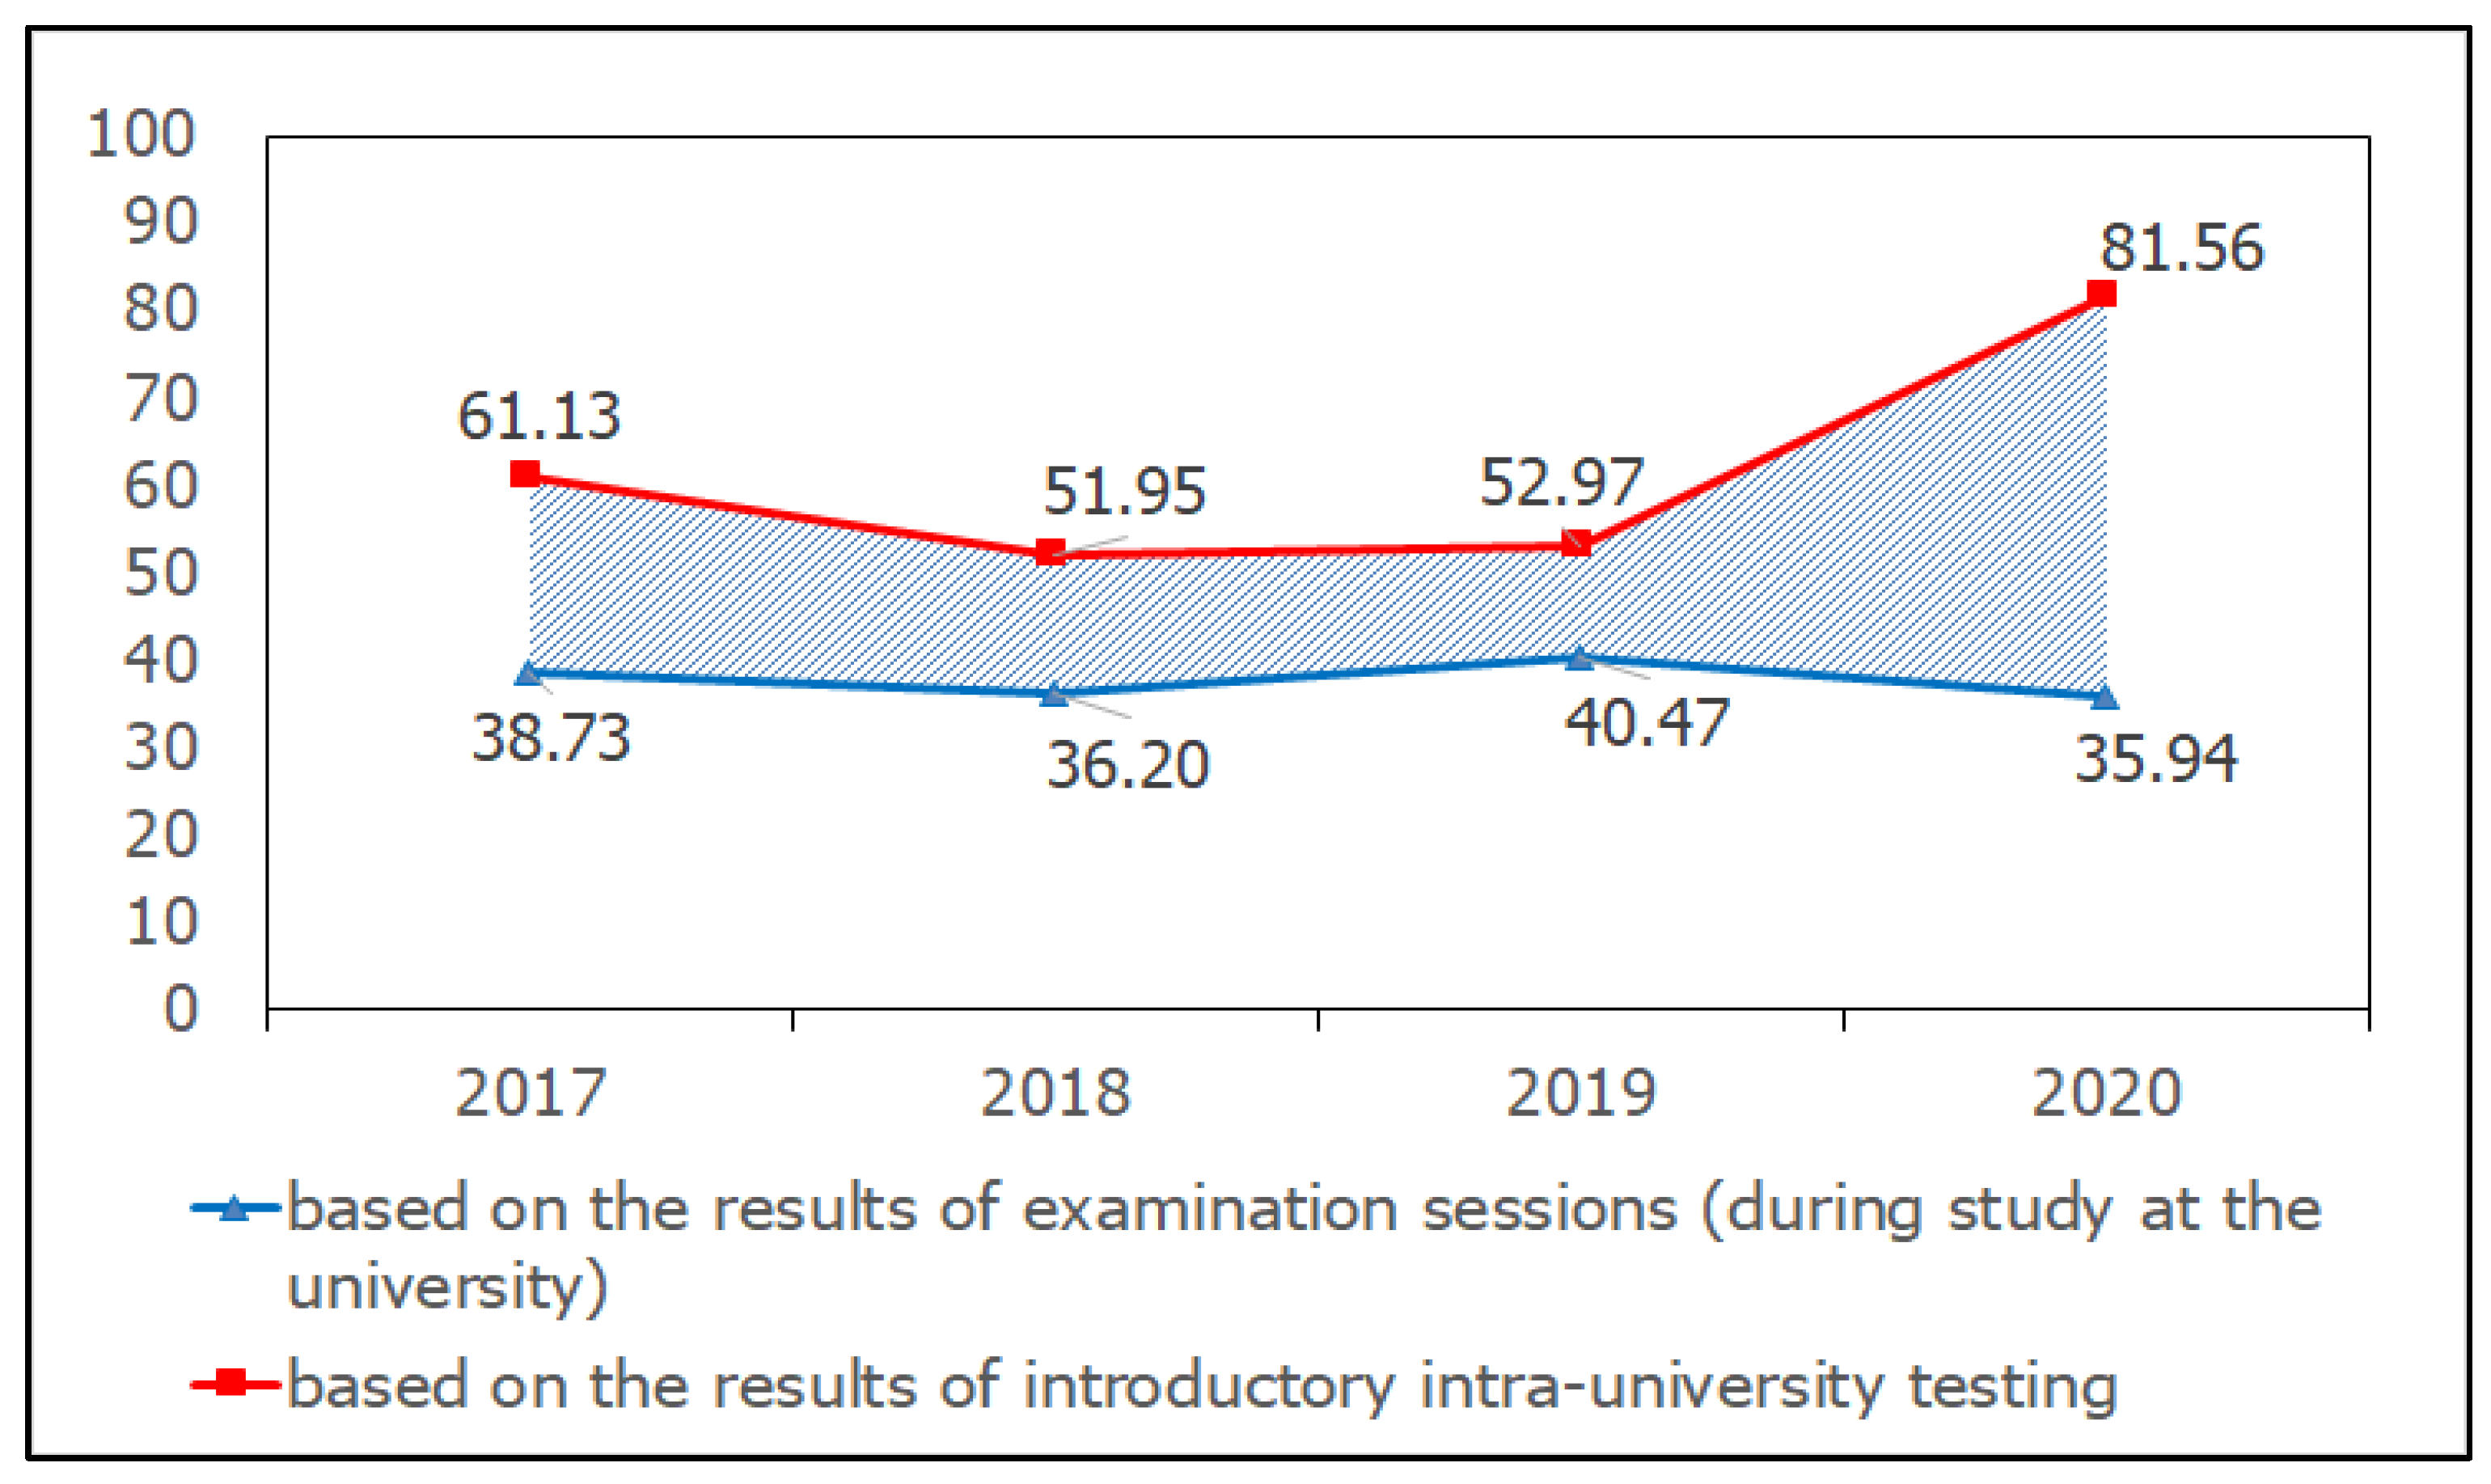
- We conducted a comparative analysis of students’ grades in mathematics before enrolling at the university (according to the results of the university entrance exam and the USE, in online and offline formats) and after enrolling at the university (according to the results of examination sessions in the first year).
2. Related Works
3. Materials and Methods
3.1. Characteristics of the Data Sample
3.2. Methods
3.3. Software and Hardware
4. Results
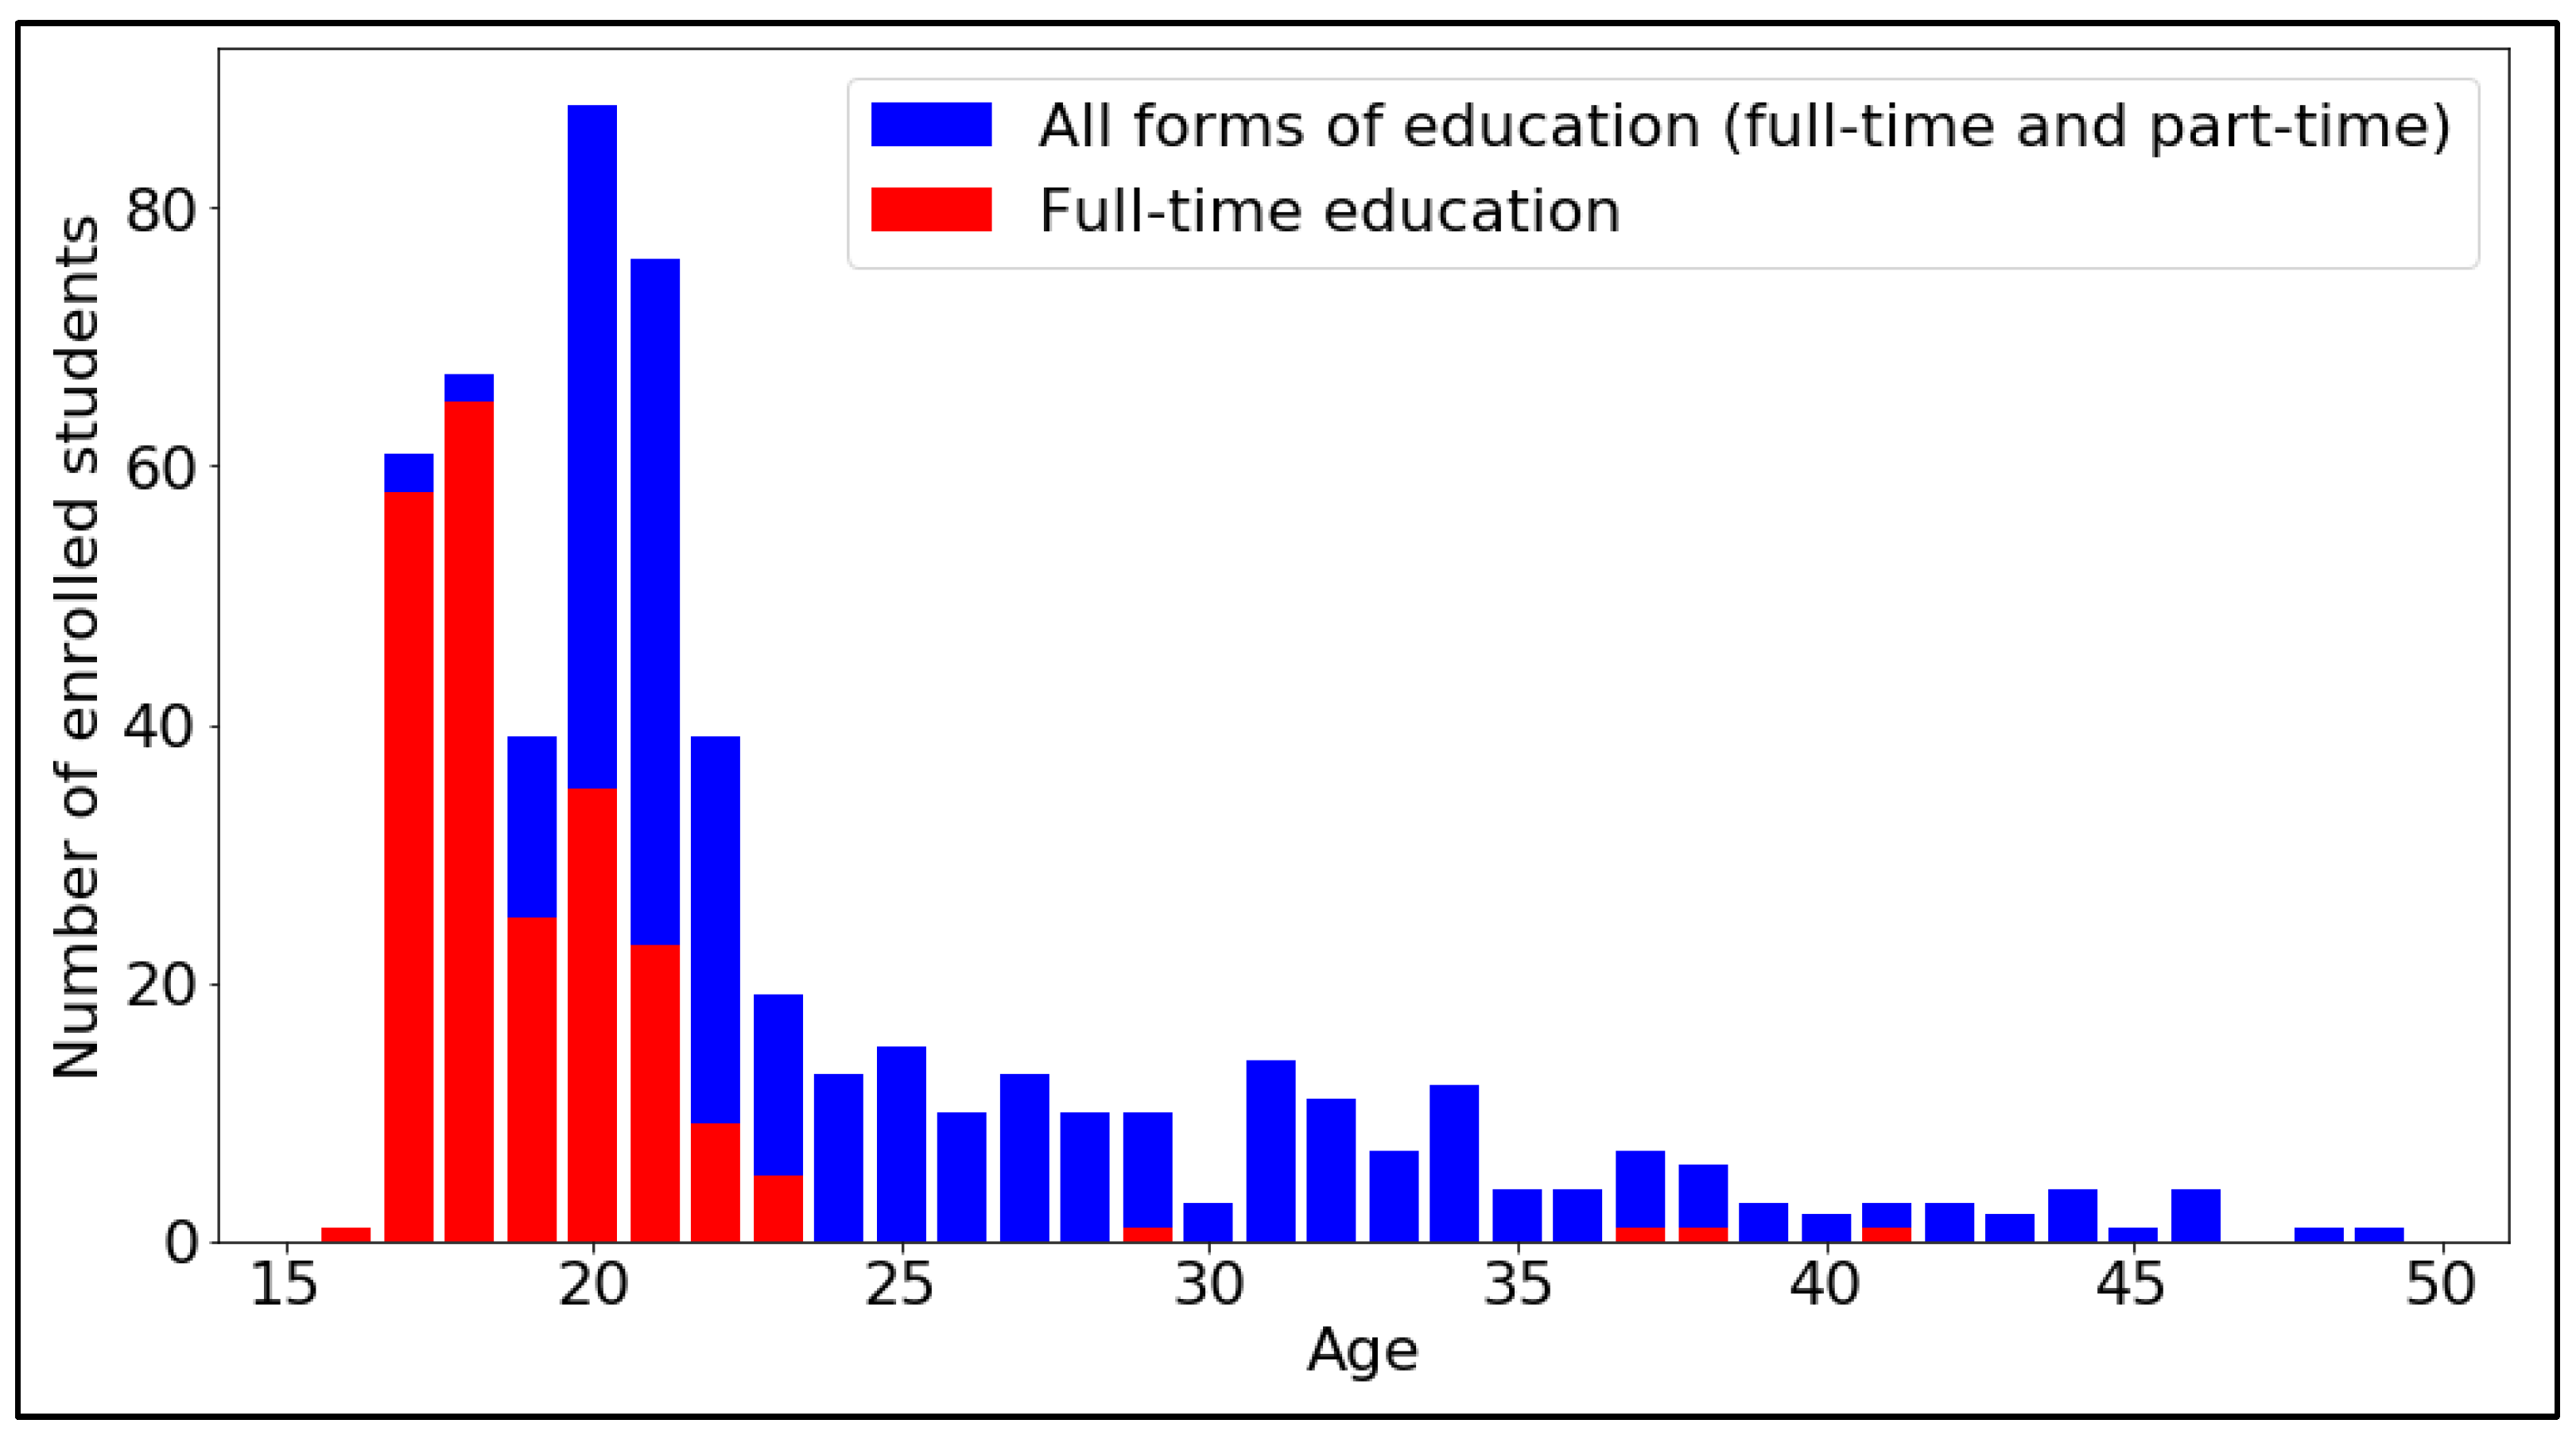
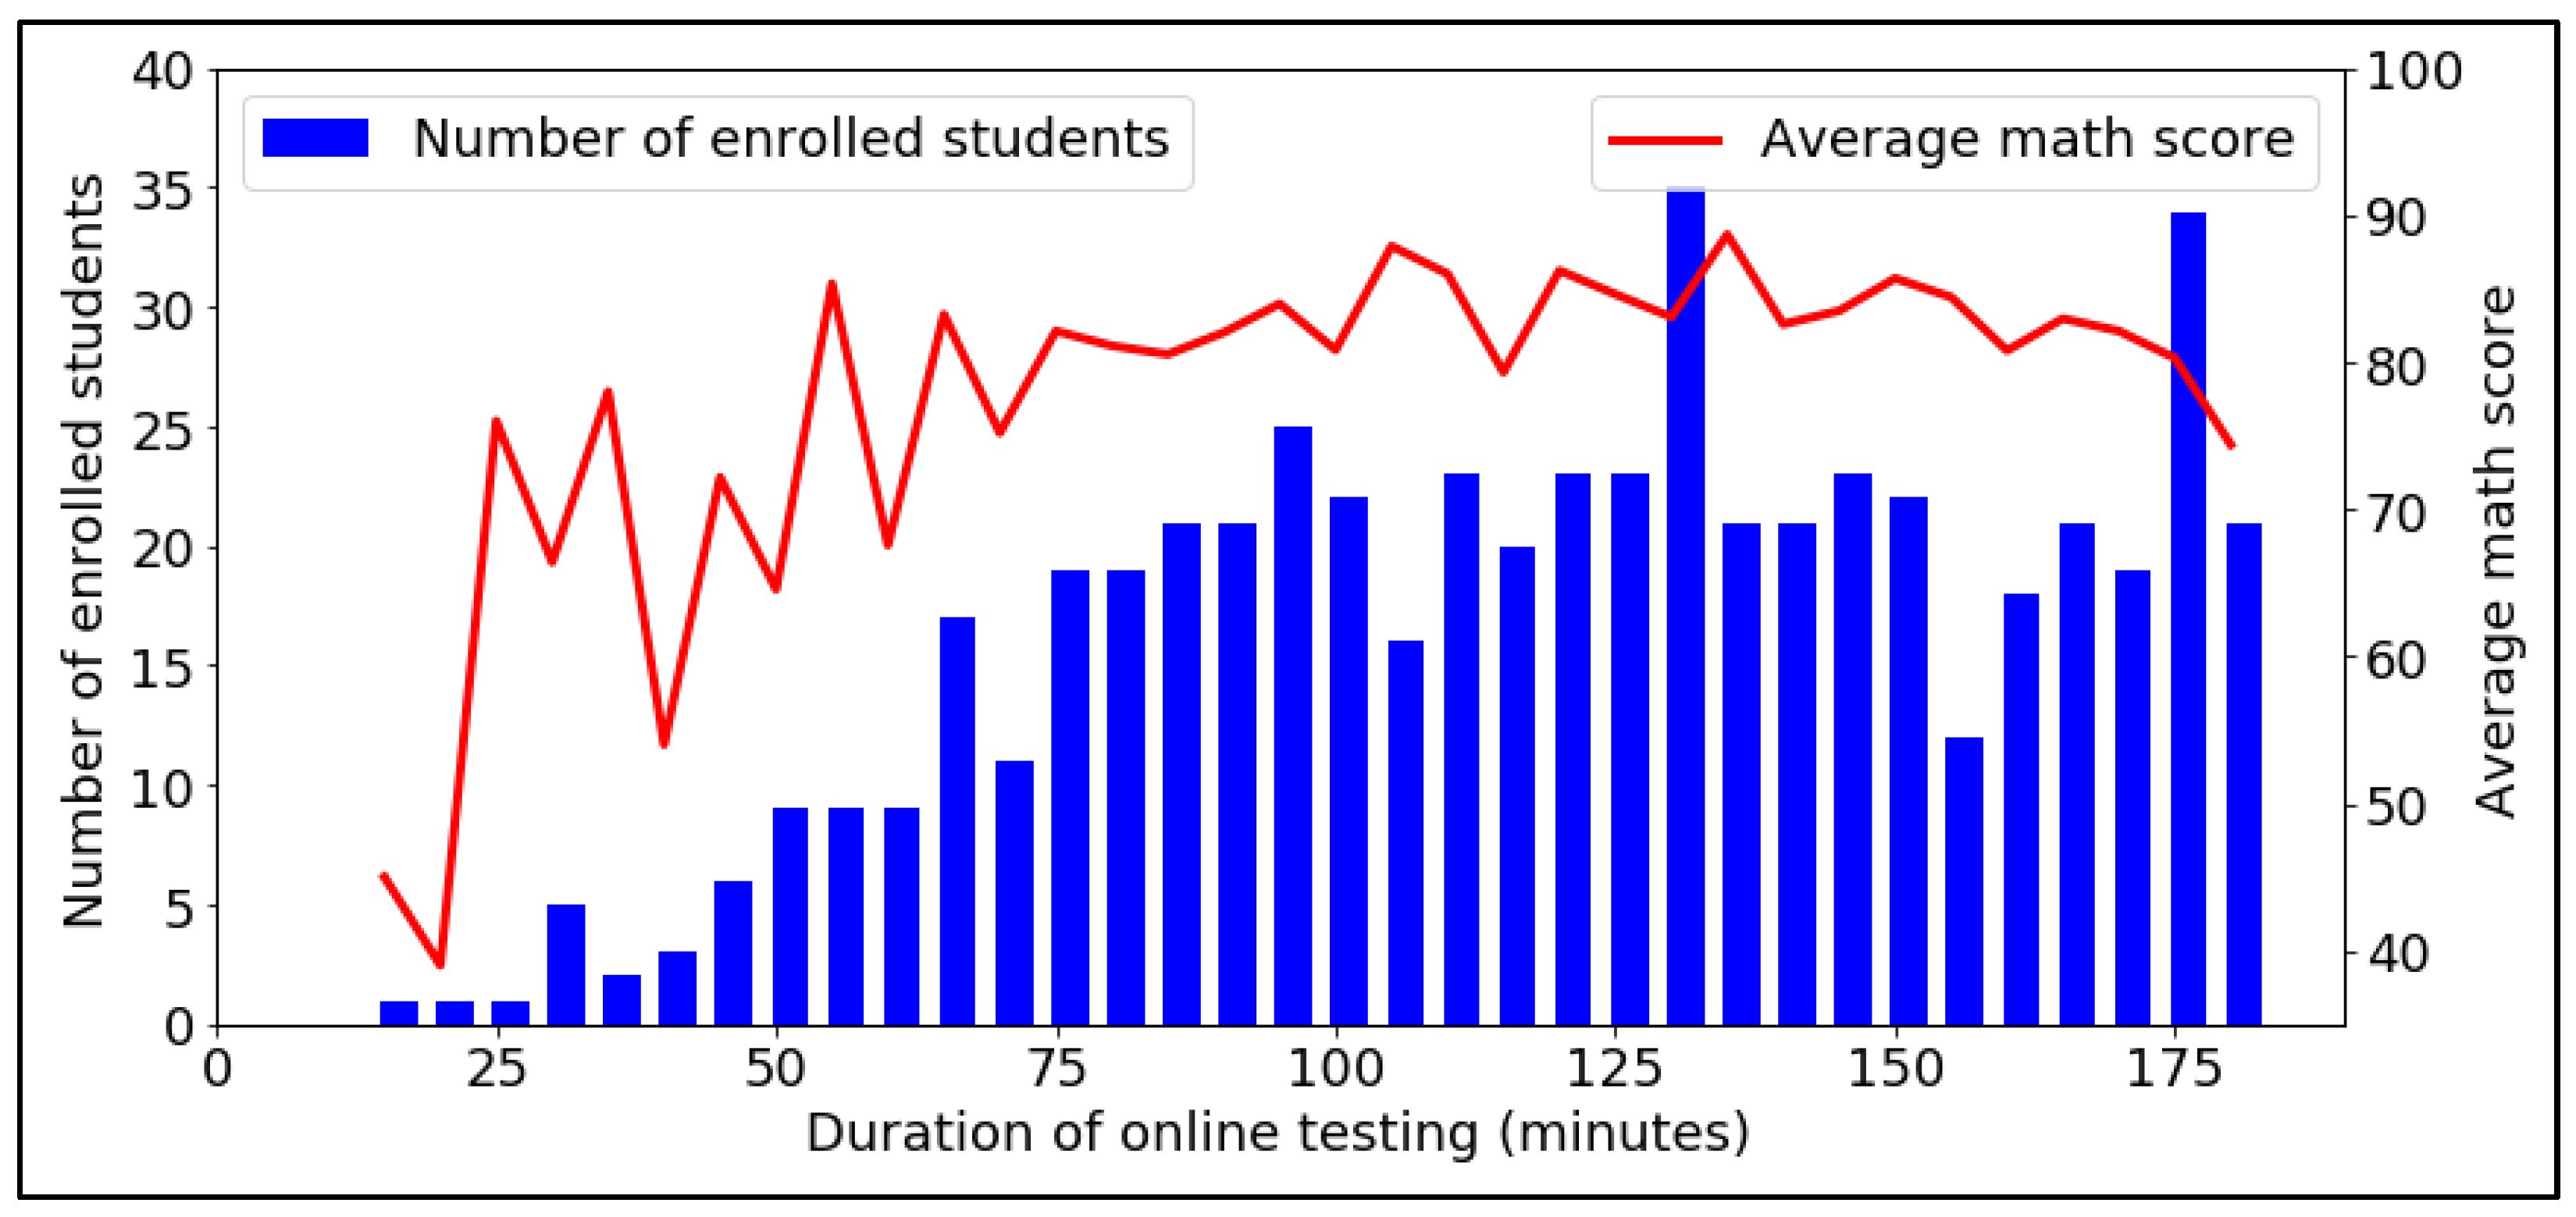
4.1. Analysis of the Distribution of a Data Sample
- Persons who have a document of secondary vocational education (SVE) or a document of higher education (HE).
- Foreign citizens.
- Citizens of the RF who in 2020 received a document on secondary general education in a foreign organization and did not pass the USE.
- Disabled people and children with disabilities.
4.2. Factors of Influence on the Dispersion of Students’ Grades in Mathematics Based on the Results of the Entrance Examination and the Basis of the Results of Examination Sessions
4.3. Factors of Influence on the Assessment of Students’ Knowledge in Mathematics upon Admission to the University Based on the Results of Online Testing and Subsequent Training
5. Discussion and Conclusions
Author Contributions
Funding
Institutional Review Board Statement
Informed Consent Statement
Data Availability Statement
Acknowledgments
Conflicts of Interest
Abbreviations
| Abbreviation | Explanation of the Abbreviation |
| SEE | Sim Entrance Exam |
| UMAT | Undergraduate Medicine and Health Sciences Admission Test |
| ENEM | Exame Nacional do Ensino Médio |
| USE | Unified State Exam |
| RF | Russian Federation |
| AltSTU | Altai State Technical University named after I.I. Polzunova |
| VK | Vkontakte |
| SVE | Secondary vocational education |
| HE | Higher education |
Appendix A

| Attribute | Value in Line 1 | Value in Line 2 |
|---|---|---|
| Human test code | 1732 | 2332 |
| Test time, minutes | 144.5 | 88.6 |
| Admission math score (Based on online testing results) | 70 | 51 |
| The correctness of the applicant’s answers for 25 tasks in the test in mathematics (primary scores 3): | ||
| Tasks Nos. 1–5 | 1 0 0 1 1 | 0 1 0 0 1 |
| Tasks Nos. 6–10 | 0 1 0 1 2 | 1 0 0 1 2 |
| Tasks Nos. 11–15 | 0 0 0 2 0 | 0 1 0 0 0 |
| Tasks Nos. 16–20 | 0 1 0 0 1 | 0 1 0 0 1 |
| Tasks Nos. 21–25 | 1 1 0 1 0 | 1 0 0 0 0 |
| Incoming information: | ||
| Gender: M or F | M | M |
| Age (as of 11/01/2020) | 18 | 32 |
| Nationality, country | Kazakhstan | Russian Federation |
| University location region | - | yes |
| Settlement type: city or village | City | City |
| Data on previous education incoming: | ||
| Type of education document | General secondary education certificate | Diploma of Vocational Education |
| Year of education | 2020 | 2019 |
| Average score in mathematics in 2020 for applicants from educational institutions 1 (number of such applicants) | 80.5 (2) | 51 (1) |
| University enrollment information: | ||
| Direction of preparation | Power Engineering | Power industry |
| Form of study | Full-time | Part-time |
| Financing conditions 2 | Budget place | Off-budget place |
| Average score in mathematics in 2020 enrolled in the same area of study and in the same form of study (number of enrolled) | 56.6 (47) | 77.42 (73) |
| Score in other subjects at admission | 46.5 | 48.5 |
| Score in mathematics when studying at the university (Based on the results of exam sessions) | 0 | 30 |
| Student status | Expelled | Continues education |
| Variety of grades in mathematics at university and at admission | −70 | −21 |
References
- Topuz, A.C.; Saka, E.; Fatsa, Ö.F.; Kurşun, E. Emerging Trends of Online Assessment Systems in the Emergency Remote Teaching Period. Smart Learn. Environ. 2022, 9, 17. [Google Scholar] [CrossRef]
- Schultz, M.; Callahan, D.L. Perils and Promise of Online Exams. Nat. Rev. Chem. 2022, 6, 299–300. [Google Scholar] [CrossRef] [PubMed]
- Gamage, K.A.A.; Wijesuriya, D.I.; Ekanayake, S.Y.; Rennie, A.E.W.; Lambert, C.G.; Gunawardhana, N. Online Delivery of Teaching and Laboratory Practices: Continuity of University Programmes during COVID-19 Pandemic. Educ. Sci. 2020, 10, 291. [Google Scholar] [CrossRef]
- Lassoued, Z.; Alhendawi, M.; Bashitialshaaer, R. An Exploratory Study of the Obstacles for Achieving Quality in Distance Learning during the COVID-19 Pandemic. Educ. Sci. 2020, 10, 232. [Google Scholar] [CrossRef]
- Saikat, S.; Dhillon, J.S.; Wan Ahmad, W.F.; Jamaluddin, R.A. A Systematic Review of the Benefits and Challenges of Mobile Learning during the COVID-19 Pandemic. Educ. Sci. 2021, 11, 459. [Google Scholar] [CrossRef]
- Reedy, A.; Pfitzner, D.; Rook, L.; Ellis, L. Responding to the COVID-19 Emergency: Student and Academic Staff Perceptions of Academic Integrity in the Transition to Online Exams at Three Australian Universities. Int. J. Educ. Integr. 2021, 17, 1–32. [Google Scholar] [CrossRef]
- Robu, A.; Filip, I.; Robu, R.; Szeidert, I.; Vasar, C. Online Platform for University Admission. In Proceedings of the 2018 9th International Conference on Information, Intelligence, Systems and Applications (IISA), Zakynthos, Greece, 23–25 July 2018; pp. 1–5. [Google Scholar]
- Early, E.; Miller, S.; Dunne, L.; Moriarty, J. The Influence of Socio-Demographics and School Factors on GCSE Attainment: Results from the First Record Linkage Data in Northern Ireland. Oxf. Rev. Educ. 2022, 0, 1–19. [Google Scholar] [CrossRef]
- da Silveira, F.L.; Barbosa, M.C.B.; da Silva, R. Exame Nacional do Ensino Médio (ENEM): Uma análise crítica. Rev. Bras. Ensino Fís. 2015, 37, 1101. [Google Scholar] [CrossRef] [Green Version]
- Pinheiro, H.P.; Sen, P.K.; Pinheiro, A.; Kiihl, S.F. A Nonparametric Approach to Assess Undergraduate Performance. arXiv 2018, arXiv:1810.00678. [Google Scholar]
- Barroso, M.F.; Massunaga, M.S.O.; Rubini, G. Brazilian National High School Examination: Assessing Student’s Learning in Physics. arXiv 2017, arXiv:1707.04181. [Google Scholar]
- da Silva, R.; Lamb, L.C.; Barbosa, M.C. Universality, Correlations, and Rankings in the Brazilian Universities National Admission Examinations. Phys. A Stat. Mech. Its Appl. 2016, 457, 295–306. [Google Scholar] [CrossRef] [Green Version]
- Schwerter, J.; Dimpfl, T.; Bleher, J.; Murayama, K. Benefits of Additional Online Practice Opportunities in Higher Education. Internet High. Educ. 2022, 53, 100834. [Google Scholar] [CrossRef]
- Gawlak, A.; Pruszewicz-Sipińska, E.; Bonenberg, W. Drawing Skills of Candidates for Architectural Studies vs. Learning Outcomes of Graduates. Comparative Research Based on the Example of the Faculty of Architecture, Poznan University of Technology. Educ. Sci. 2021, 11, 339. [Google Scholar] [CrossRef]
- Jaap, A.; Dewar, A.; Duncan, C.; Fairhurst, K.; Hope, D.; Kluth, D. Effect of Remote Online Exam Delivery on Student Experience and Performance in Applied Knowledge Tests. BMC Med. Educ. 2021, 21, 86. [Google Scholar] [CrossRef]
- Abdelrahim, D.Y.; Abdelrahim, D.Y. The Effects of COVID-19 Quarantine on Online Exam Cheating: A Test of COVID-19 Theoretical Framework. J. Southwest Jiaotong Univ. 2021, 56, 1–9. [Google Scholar] [CrossRef]
- Noorbehbahani, F.; Mohammadi, A.; Aminazadeh, M. A Systematic Review of Research on Cheating in Online Exams from 2010 to 2021. Educ. Inf. Technol. 2022, 27, 8413–8460. [Google Scholar] [CrossRef]
- Gorgani, H.H.; Shabani, S. Online Exams and the COVID-19 Pandemic: A Hybrid Modified FMEA, QFD, and k-Means Approach to Enhance Fairness. SN Appl. Sci. 2021, 3, 818. [Google Scholar] [CrossRef]
- Lee, K.; Fanguy, M. Online Exam Proctoring Technologies: Educational Innovation or Deterioration? Br. J. Educ. Technol. 2022, 53, 475–490. [Google Scholar] [CrossRef]
- Fask, A.; Englander, F.; Wang, Z. Do Online Exams Facilitate Cheating? An Experiment Designed to Separate Possible Cheating from the Effect of the Online Test Taking Environment. J. Acad. Ethics 2014, 12, 101–112. [Google Scholar] [CrossRef]
- Adi Badiozaman, I.F.; Segar, A.R. Exploring Online Teaching Competence in the Context of the COVID 19 Pandemic: Insights from Sarawak, Malaysia. J. Furth. High. Educ. 2021, 46, 766–779. [Google Scholar] [CrossRef]
- Le, V.T.; Nguyen, N.H.; Tran, T.L.N.; Nguyen, L.T.; Nguyen, T.A.; Nguyen, M.T. The Interaction Patterns of Pandemic-Initiated Online Teaching: How Teachers Adapted. System 2022, 105, 102755. [Google Scholar] [CrossRef]
- Fayed, I.; Cummings, J. Teaching in the Post COVID-19 Era. World Education Dilemmas, Teaching Innovations and Solutions in the Age of Crisis; Springer Nature Switzerland AG: Cham, Switzerland, 2021; Volume 1, p. 808. ISBN 978-3-030-74088-7. [Google Scholar]
- Majola, M.X.; Mudau, P.K. Lecturers’ Experiences of Administering Online Examinations at a South African Open Distance e-Learning University during the COVID-19. Int. J. Educ. Methodol. 2022, 8, 275–283. [Google Scholar] [CrossRef]
- Šromeková, K. Physics Exam in Distance Learning in the Context of Formative and Summative Assessment. AIP Conf. Proc. 2022, 2458, 030031. [Google Scholar] [CrossRef]
- Komotskiy, E.; Oreshkina, T.; Zabokritskaya, L.; Medvedeva, M.; Sozykin, A.; Khlebnikov, N. Analysis of Students Educational Interests Using Social Networks Data. In Analysis of Images, Social Networks and Texts; van der Aalst, W.M.P., Batagelj, V., Ignatov, D.I., Khachay, M., Kuskova, V., Kutuzov, A., Kuznetsov, S.O., Lomazova, I.A., Loukachevitch, N., Napoli, A., et al., Eds.; Springer International Publishing: Cham, Switzerland, 2019; pp. 257–264. [Google Scholar] [CrossRef]
- Navickiene, V.; Dagiene, V.; Jasute, E.; Butkiene, R.; Gudoniene, D. Pandemic-Induced Qualitative Changes in the Process of University Studies from the Perspective of University Authorities. Sustainability 2021, 13, 9887. [Google Scholar] [CrossRef]
- Guncaga, J.; Lopuchova, J.; Ferdianova, V.; Zacek, M.; Ashimov, Y. Survey on Online Learning at Universities of Slovakia, Czech Republic and Kazakhstan during the COVID-19 Pandemic. Educ. Sci. 2022, 12, 458. [Google Scholar] [CrossRef]
- Dodd, R.H.; Dadaczynski, K.; Okan, O.; McCaffery, K.J.; Pickles, K. Psychological Wellbeing and Academic Experience of University Students in Australia during COVID-19. Int. J. Environ. Res. Public Health 2021, 18, 866. [Google Scholar] [CrossRef]
- Etajuri, E.A.; Mohd, N.R.; Naimie, Z.; Ahmad, N.A. Undergraduate Dental Students’ Perspective of Online Learning and Their Physical and Mental Health during COVID-19 Pandemic. PLoS ONE 2022, 17, e0270091. [Google Scholar] [CrossRef]
- Gherheș, V.; Șimon, S.; Para, I. Analysing Students’ Reasons for Keeping Their Webcams on or off during Online Classes. Sustainability 2021, 13, 3203. [Google Scholar] [CrossRef]
- Drašler, V.; Bertoncelj, J.; Korošec, M.; Pajk Žontar, T.; Poklar Ulrih, N.; Cigić, B. Difference in the Attitude of Students and Employees of the University of Ljubljana towards Work from Home and Online Education: Lessons from COVID-19 Pandemic. Sustainability 2021, 13, 5118. [Google Scholar] [CrossRef]
- Chen, V.; Sandford, A.; LaGrone, M.; Charbonneau, K.; Kong, J.; Ragavaloo, S. An Exploration of Instructors’ and Students’ Perspectives on Remote Delivery of Courses during the COVID-19 Pandemic. Br. J. Educ. Technol. 2022, 53, 512–533. [Google Scholar] [CrossRef]
- Wittrin, R.T.; Wüstenfeld, V.; Spranger, M.; Tolkmitt, V. Identifying the Impact of Online Tests in Learning Management Systems on Learning Success. Int. J. Inf. Educ. Technol. 2022, 12, 443–448. [Google Scholar] [CrossRef]
- Jojoa, M.; Lazaro, E.; Garcia-Zapirain, B.; Gonzalez, M.J.; Urizar, E. The Impact of COVID 19 on University Staff and Students from Iberoamerica: Online Learning and Teaching Experience. Int. J. Environ. Res. Public Health 2021, 18, 5820. [Google Scholar] [CrossRef] [PubMed]
- Comas-Forgas, R.; Lancaster, T.; Calvo-Sastre, A.; Sureda-Negre, J. Exam Cheating and Academic Integrity Breaches during the COVID-19 Pandemic: An Analysis of Internet Search Activity in Spain. Heliyon 2021, 7, e08233. [Google Scholar] [CrossRef] [PubMed]
- Scheffé, H. The Analysis of Variance, 1st ed.; Wiley-Interscience: New York, NY, USA, 1999; ISBN 978-0-471-34505-3. [Google Scholar]
- Leischner, K. Linear Regression and Correlation Coefficient: Knowledge of Statistics: Simple Linear Regression and Correlation; Independently Published: Portland, OR, USA, 2021; ISBN 9798529780848. [Google Scholar]
- Özgen, A.C.; Öztürk, M.U.; Bayraktar, U. Cheating Detection Pipeline for Online Interviews and Exams. arXiv 2021, arXiv:2106.14483. [Google Scholar]
- Li, H.; Xu, M.; Wang, Y.; Wei, H.; Qu, H. A Visual Analytics Approach to Facilitate the Proctoring of Online Exams. In Proceedings of the 2021 CHI Conference on Human Factors in Computing Systems, Yokohama, Japan, 8–13 May 2021; pp. 1–17. [Google Scholar] [CrossRef]


| Year | According to the University Testing | According to the USE |
|---|---|---|
| 2017 | 641 | 1271 |
| 2018 | 504 | 1195 |
| 2019 | 576 | 1000 |
| 2020 | 553 | 803 |
| Total | 2274 | 4269 |
| Form of Education | University Online Testing | USE |
|---|---|---|
| Full-time | 225 (16.6%) | 761 (56.1%) |
| Part-time | 328 (24.2%) | 42 (3.1%) |
| Total | 553 (40.8%) | 803 (59.2%) |
| Form of Education | Student Category, Type of Education Document | University Online Testing | USE |
|---|---|---|---|
| Full-time | Foreign citizens | 140 (62%) | 0 (0%) |
| RF citizens: | 85 (38%) | 761 (100%) | |
| 1. Certificate of secondary general education | 4 1 | 753 | |
| 2. Vocational diploma | 81 | 8 | |
| Part-time | Foreign citizens | 18 (5%) | 0 (0%) |
| RF citizens: | 310 (95%) | 42 (100%) | |
| 1. Certificate of secondary general education | 2 1 | 38 | |
| 2. Vocational diploma | 278 | 4 | |
| 3. HE diploma (bachelor’s, specialist’s, or master’s degree) | 30 | 0 |
| Admission Year | NUMBER OF ENROLLED | Average Score at Admission | Average Score at the End of Examination Sessions | Deviation (Compared to 2020) |
|---|---|---|---|---|
| 2017 | 641 | 61.13 | 38.73 | −22.40 (23.22) |
| 2018 | 504 | 51.95 | 36.20 | −15.75 (29.87) |
| 2019 | 576 | 52.97 | 40.47 | −12.50 (33.12) |
| 2020 | 553 | 81.56 | 35.94 | −45.62 |
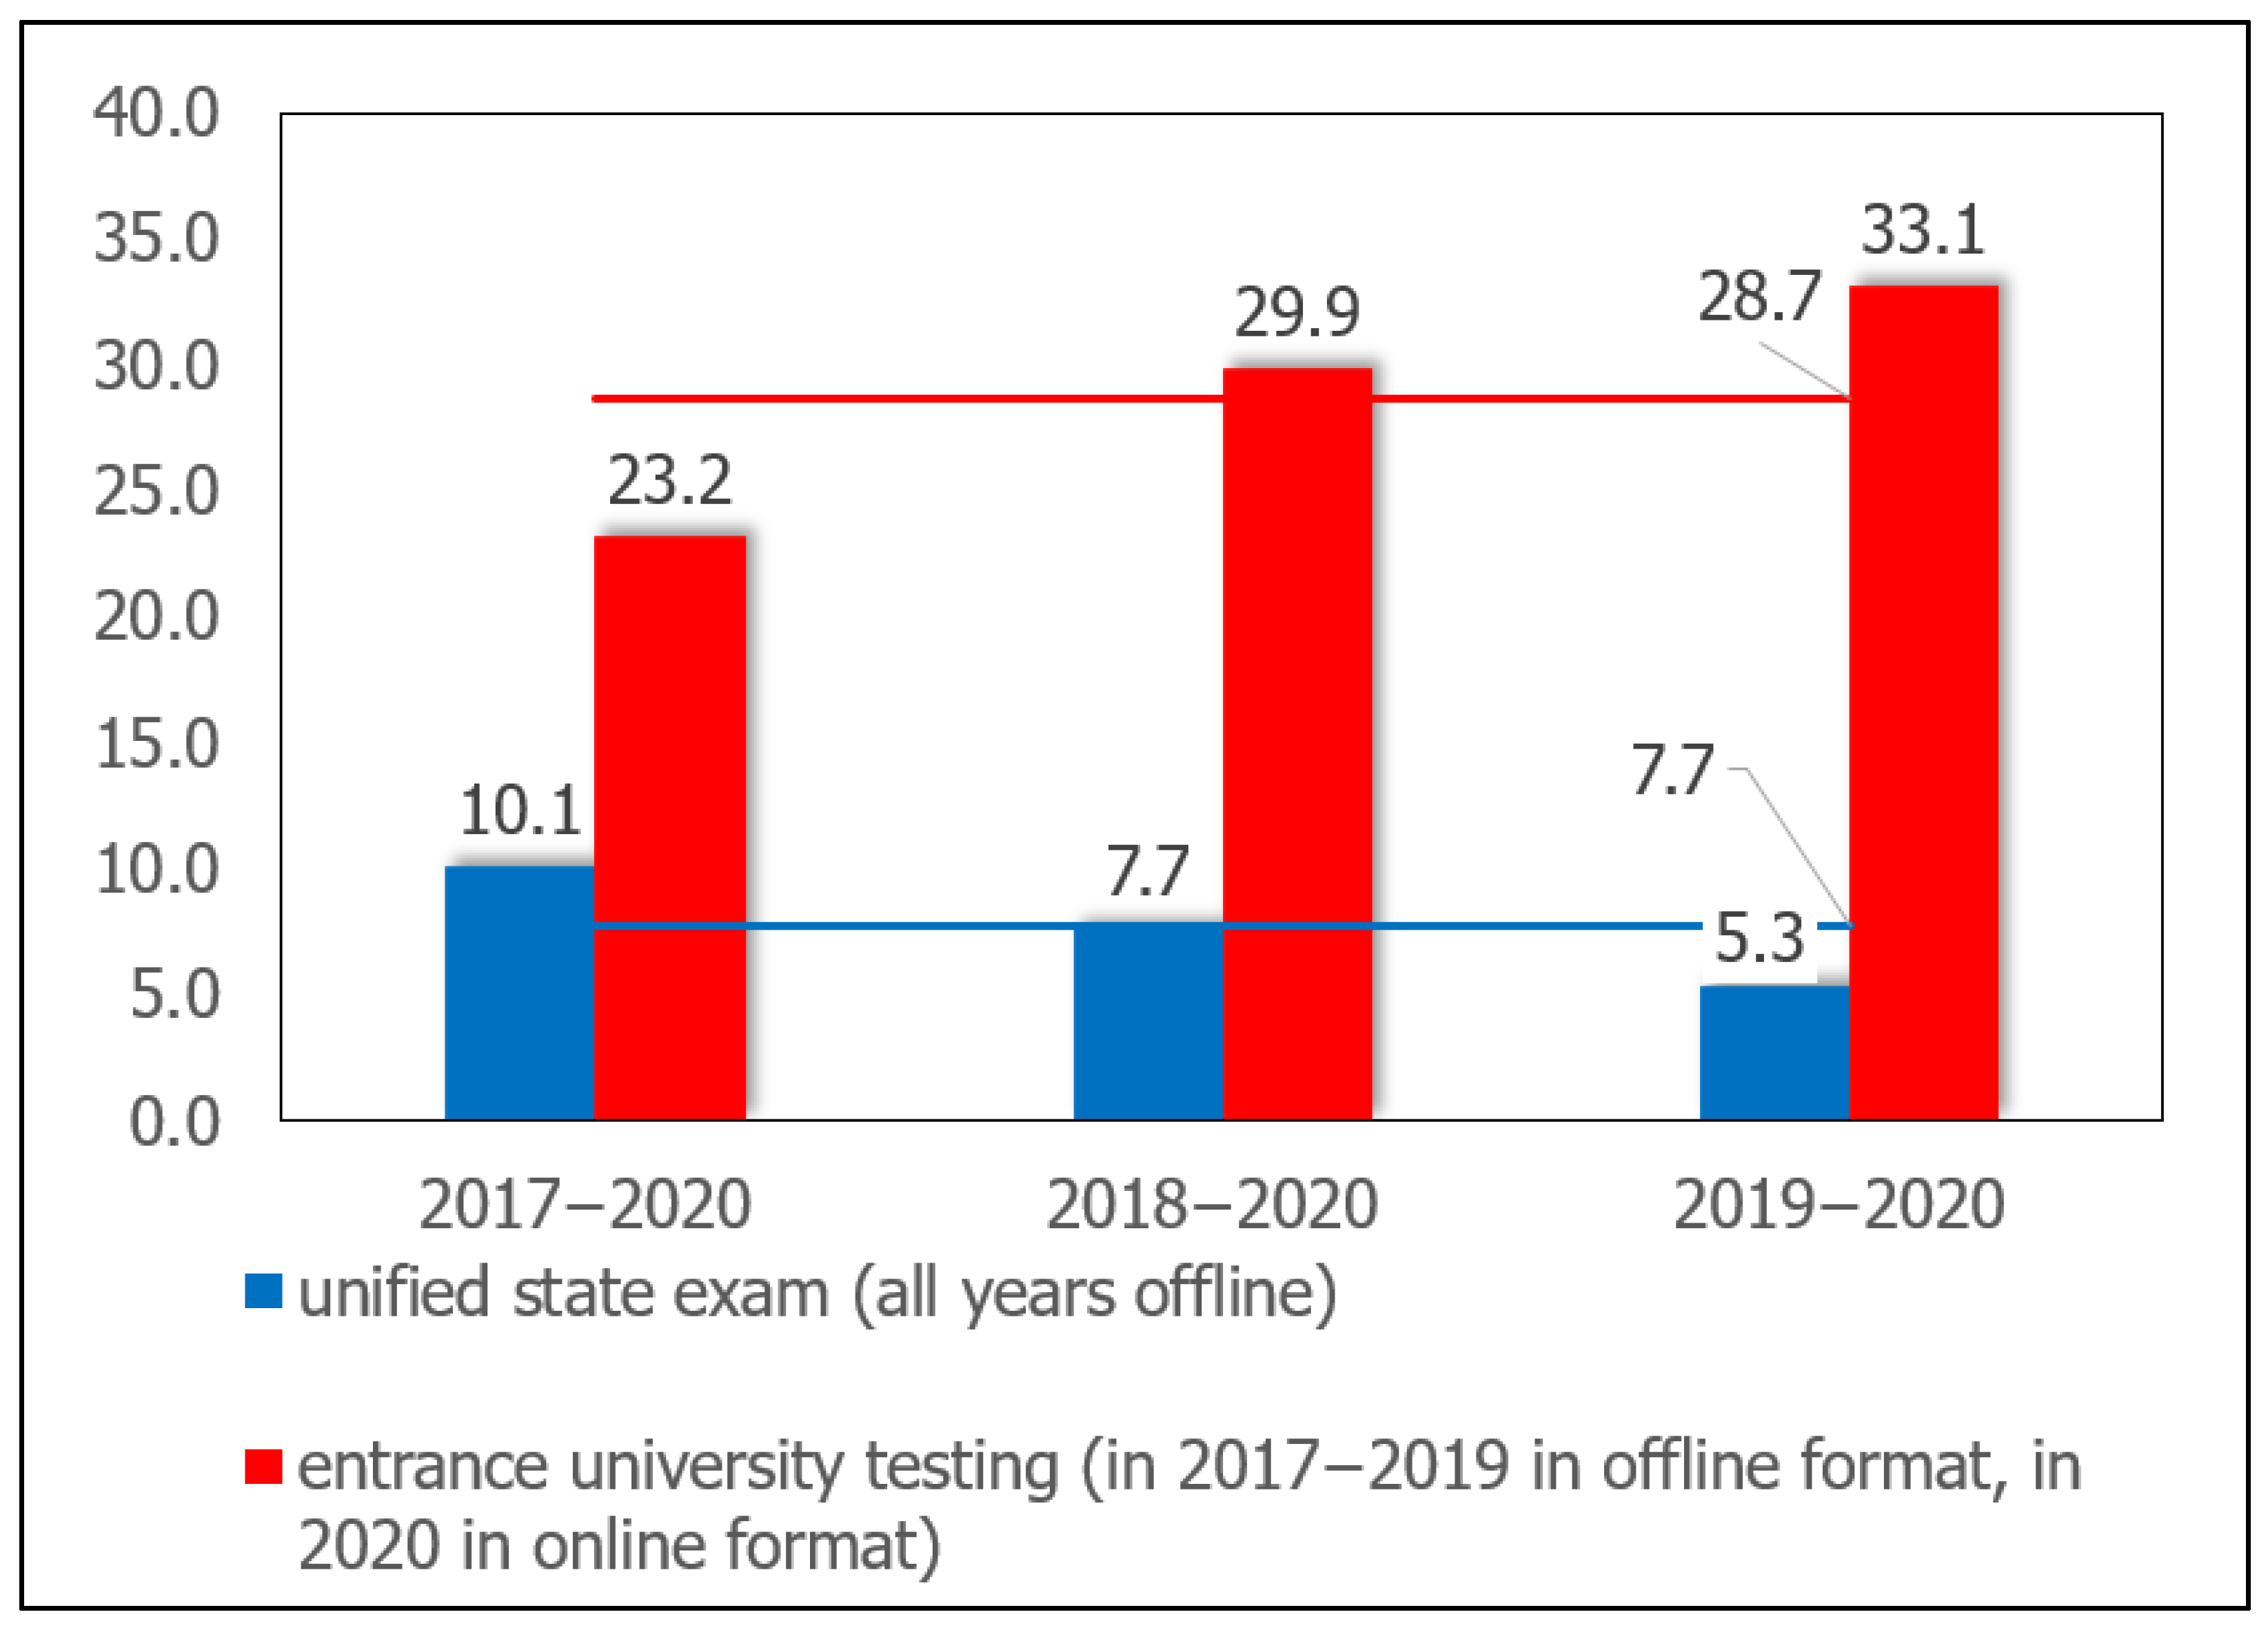
| Admission Year | Deviation 1 (According to Those Enrolled Based on the Results of the USE) 2 | Deviation 1 (According to Enrolled Students Based on the Entrance University Testing) 3 |
|---|---|---|
| 2017 | 10.1 | 23.2 |
| 2018 | 7.7 | 29.9 |
| 2019 | 5.3 | 33.1 |
| Examination Session | |||
|---|---|---|---|
| High Math Score | Low Math Score | ||
| Entrance university testing | High math score | 161 (29%) | 172 (31%) |
| Low math score | 67 (12%) | 153 (28%) | |
Disclaimer/Publisher’s Note: The statements, opinions and data contained in all publications are solely those of the individual author(s) and contributor(s) and not of MDPI and/or the editor(s). MDPI and/or the editor(s) disclaim responsibility for any injury to people or property resulting from any ideas, methods, instructions or products referred to in the content. |
© 2022 by the authors. Licensee MDPI, Basel, Switzerland. This article is an open access article distributed under the terms and conditions of the Creative Commons Attribution (CC BY) license (https://creativecommons.org/licenses/by/4.0/).
Share and Cite
Safonova, A.; Guner, M. Factor Analysis of Students’ Knowledge Assessment Based on the Results of Online Entrance Testing in Mathematics to the University under the Conditions of COVID-19. Educ. Sci. 2023, 13, 46. https://doi.org/10.3390/educsci13010046
Safonova A, Guner M. Factor Analysis of Students’ Knowledge Assessment Based on the Results of Online Entrance Testing in Mathematics to the University under the Conditions of COVID-19. Education Sciences. 2023; 13(1):46. https://doi.org/10.3390/educsci13010046
Chicago/Turabian StyleSafonova, Anastasiia, and Mikhail Guner. 2023. "Factor Analysis of Students’ Knowledge Assessment Based on the Results of Online Entrance Testing in Mathematics to the University under the Conditions of COVID-19" Education Sciences 13, no. 1: 46. https://doi.org/10.3390/educsci13010046