
Broad Cross-Reactive IgA and IgG against Human Coronaviruses in Milk Induced by COVID-19 Vaccination and Infection

 , , , , , and
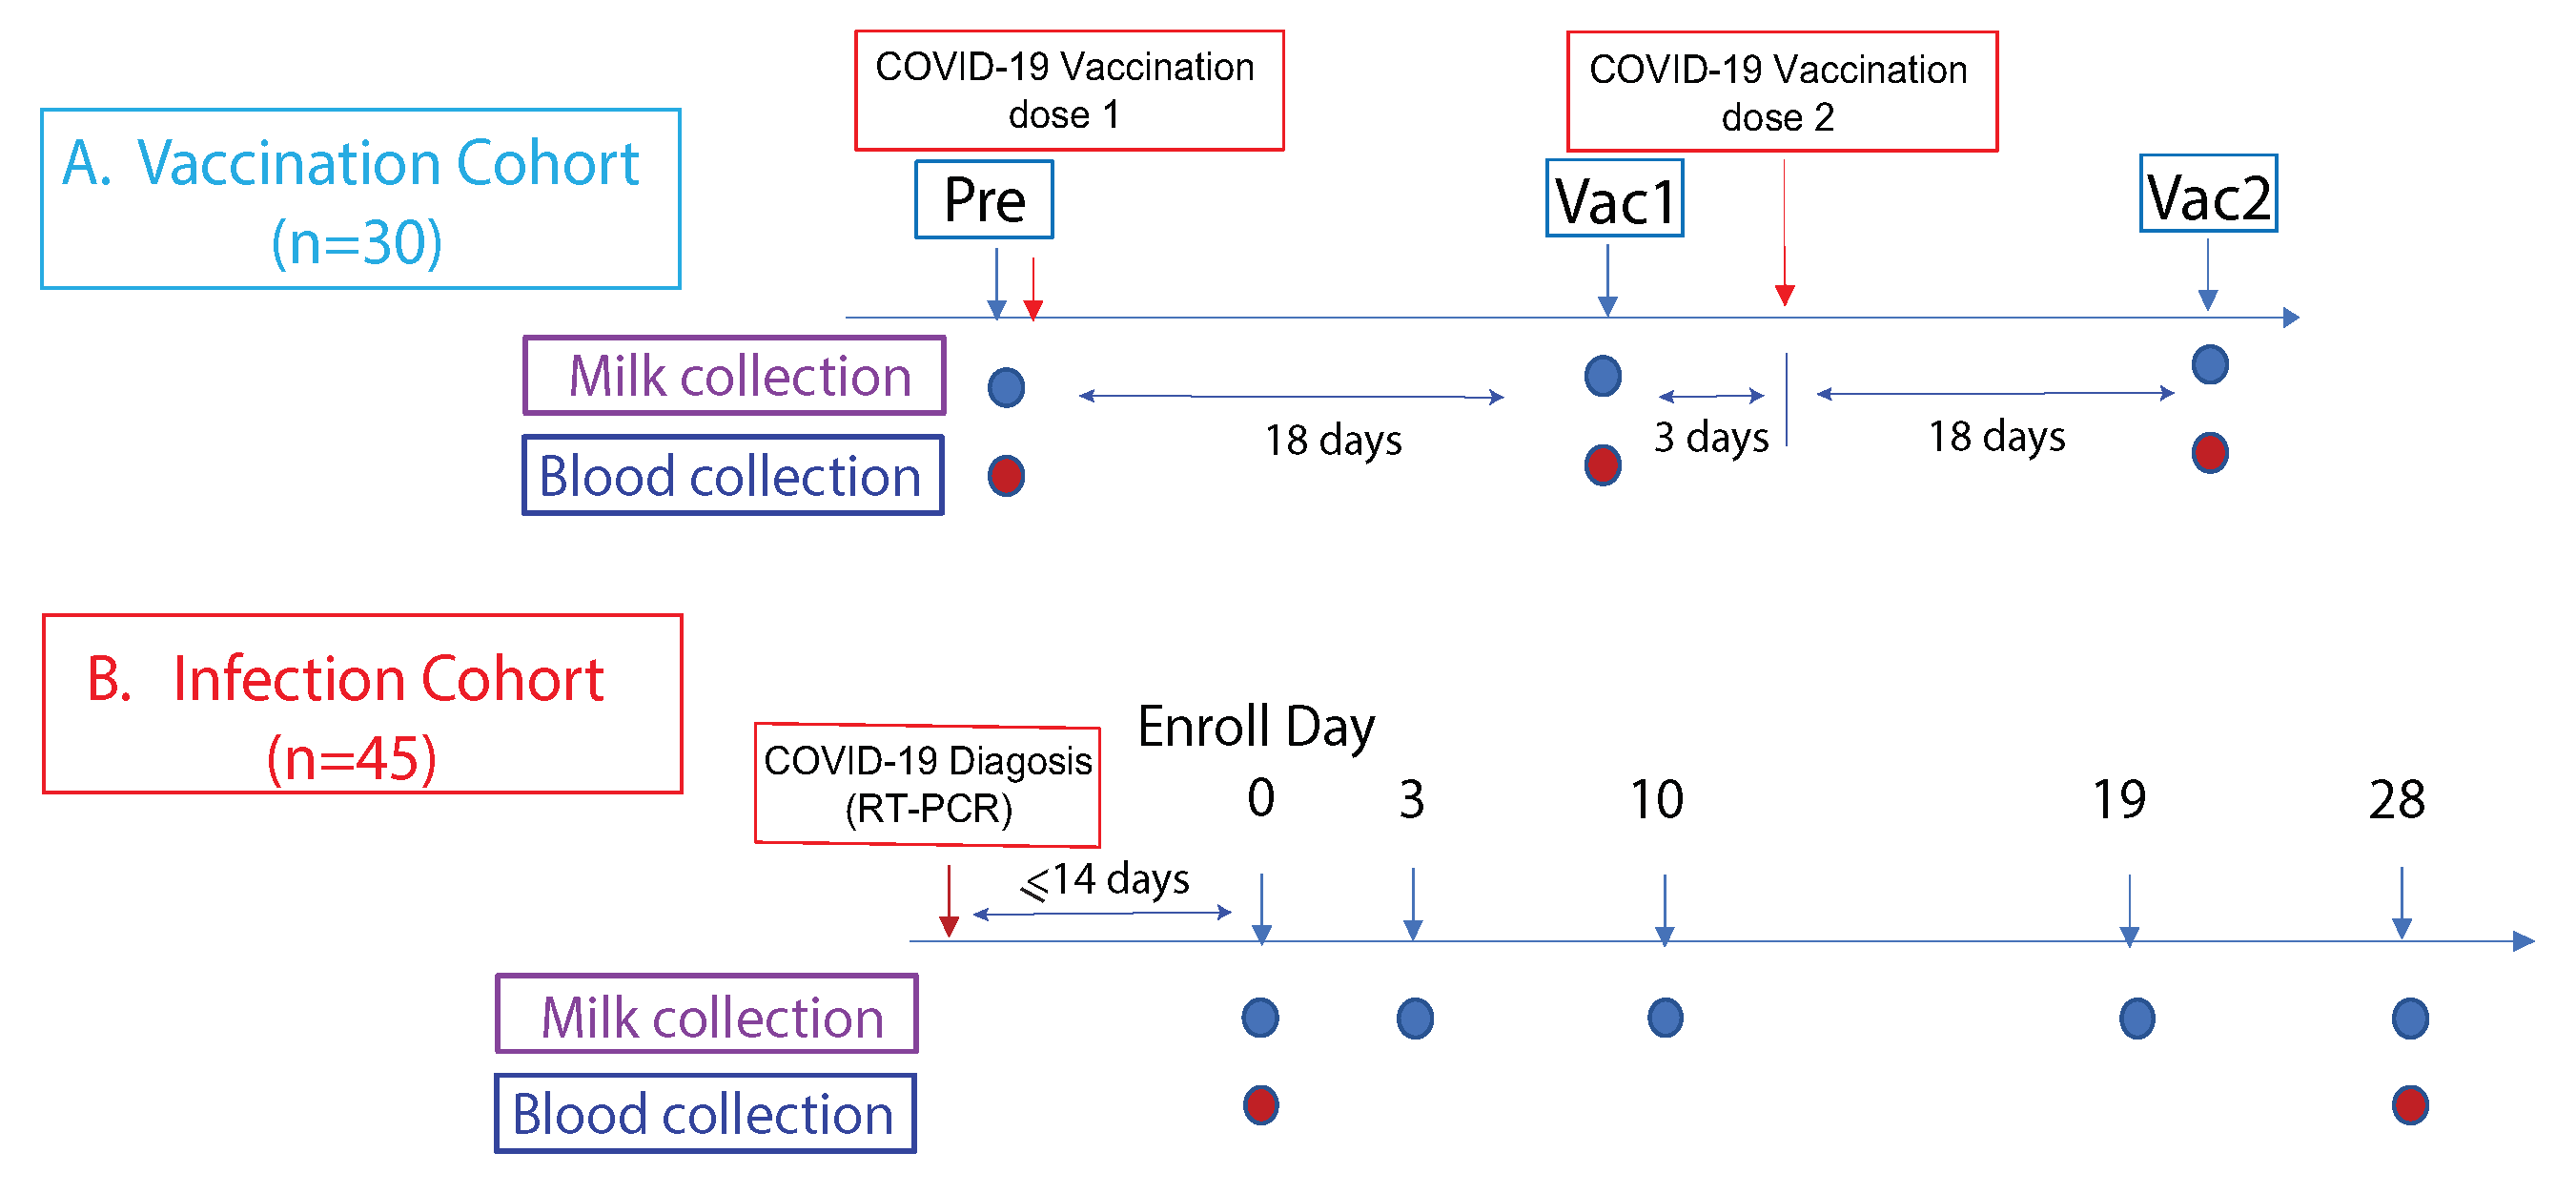
Abstract
:1. Introduction
2. Materials and Methods
2.1. Study Cohorts
2.2. Sample Collection
2.3. mPlex-Cov Assay
2.4. Data Analysis and Statistical Methods
3. Results
3.1. Study Cohorts and Samples
3.2. Vaccination Elicited Strong SARS-CoV-2 Specific IgA and IgG Responses in Blood and Milk
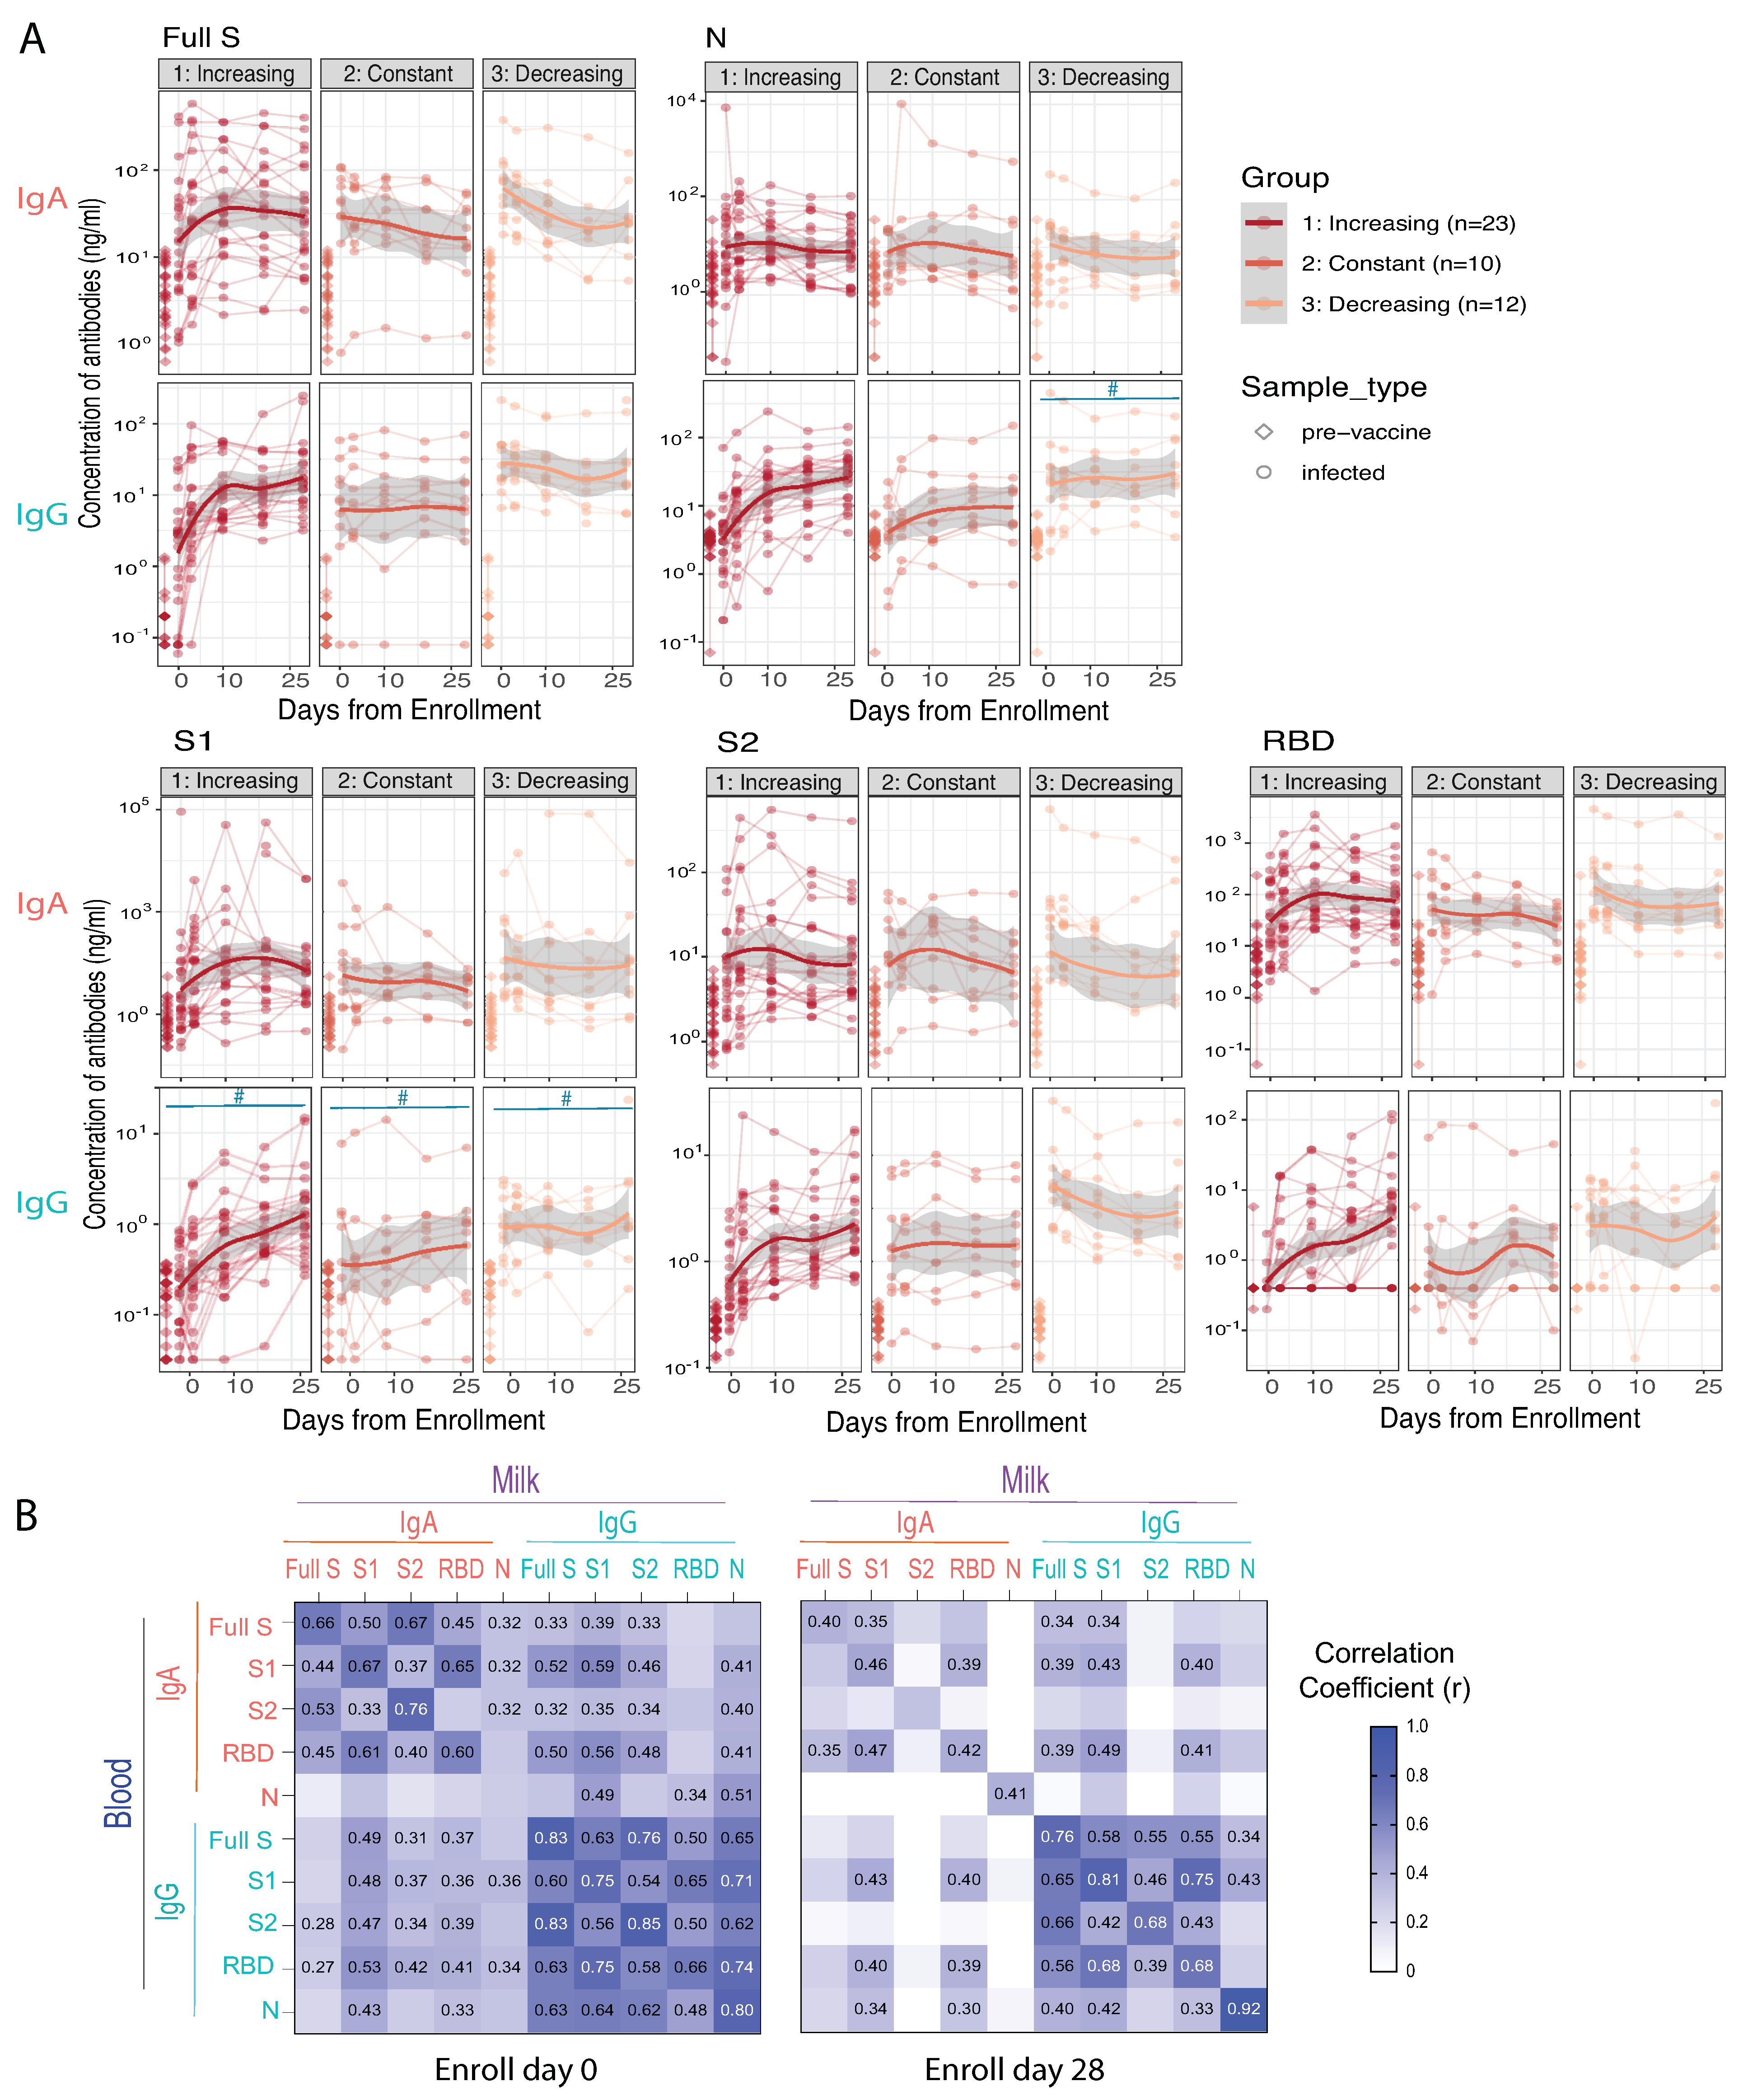
3.3. COVID-19 Infection Significantly Increases SARS-CoV-2 Specific IgA and IgG Antibody Levels in Blood and Milk
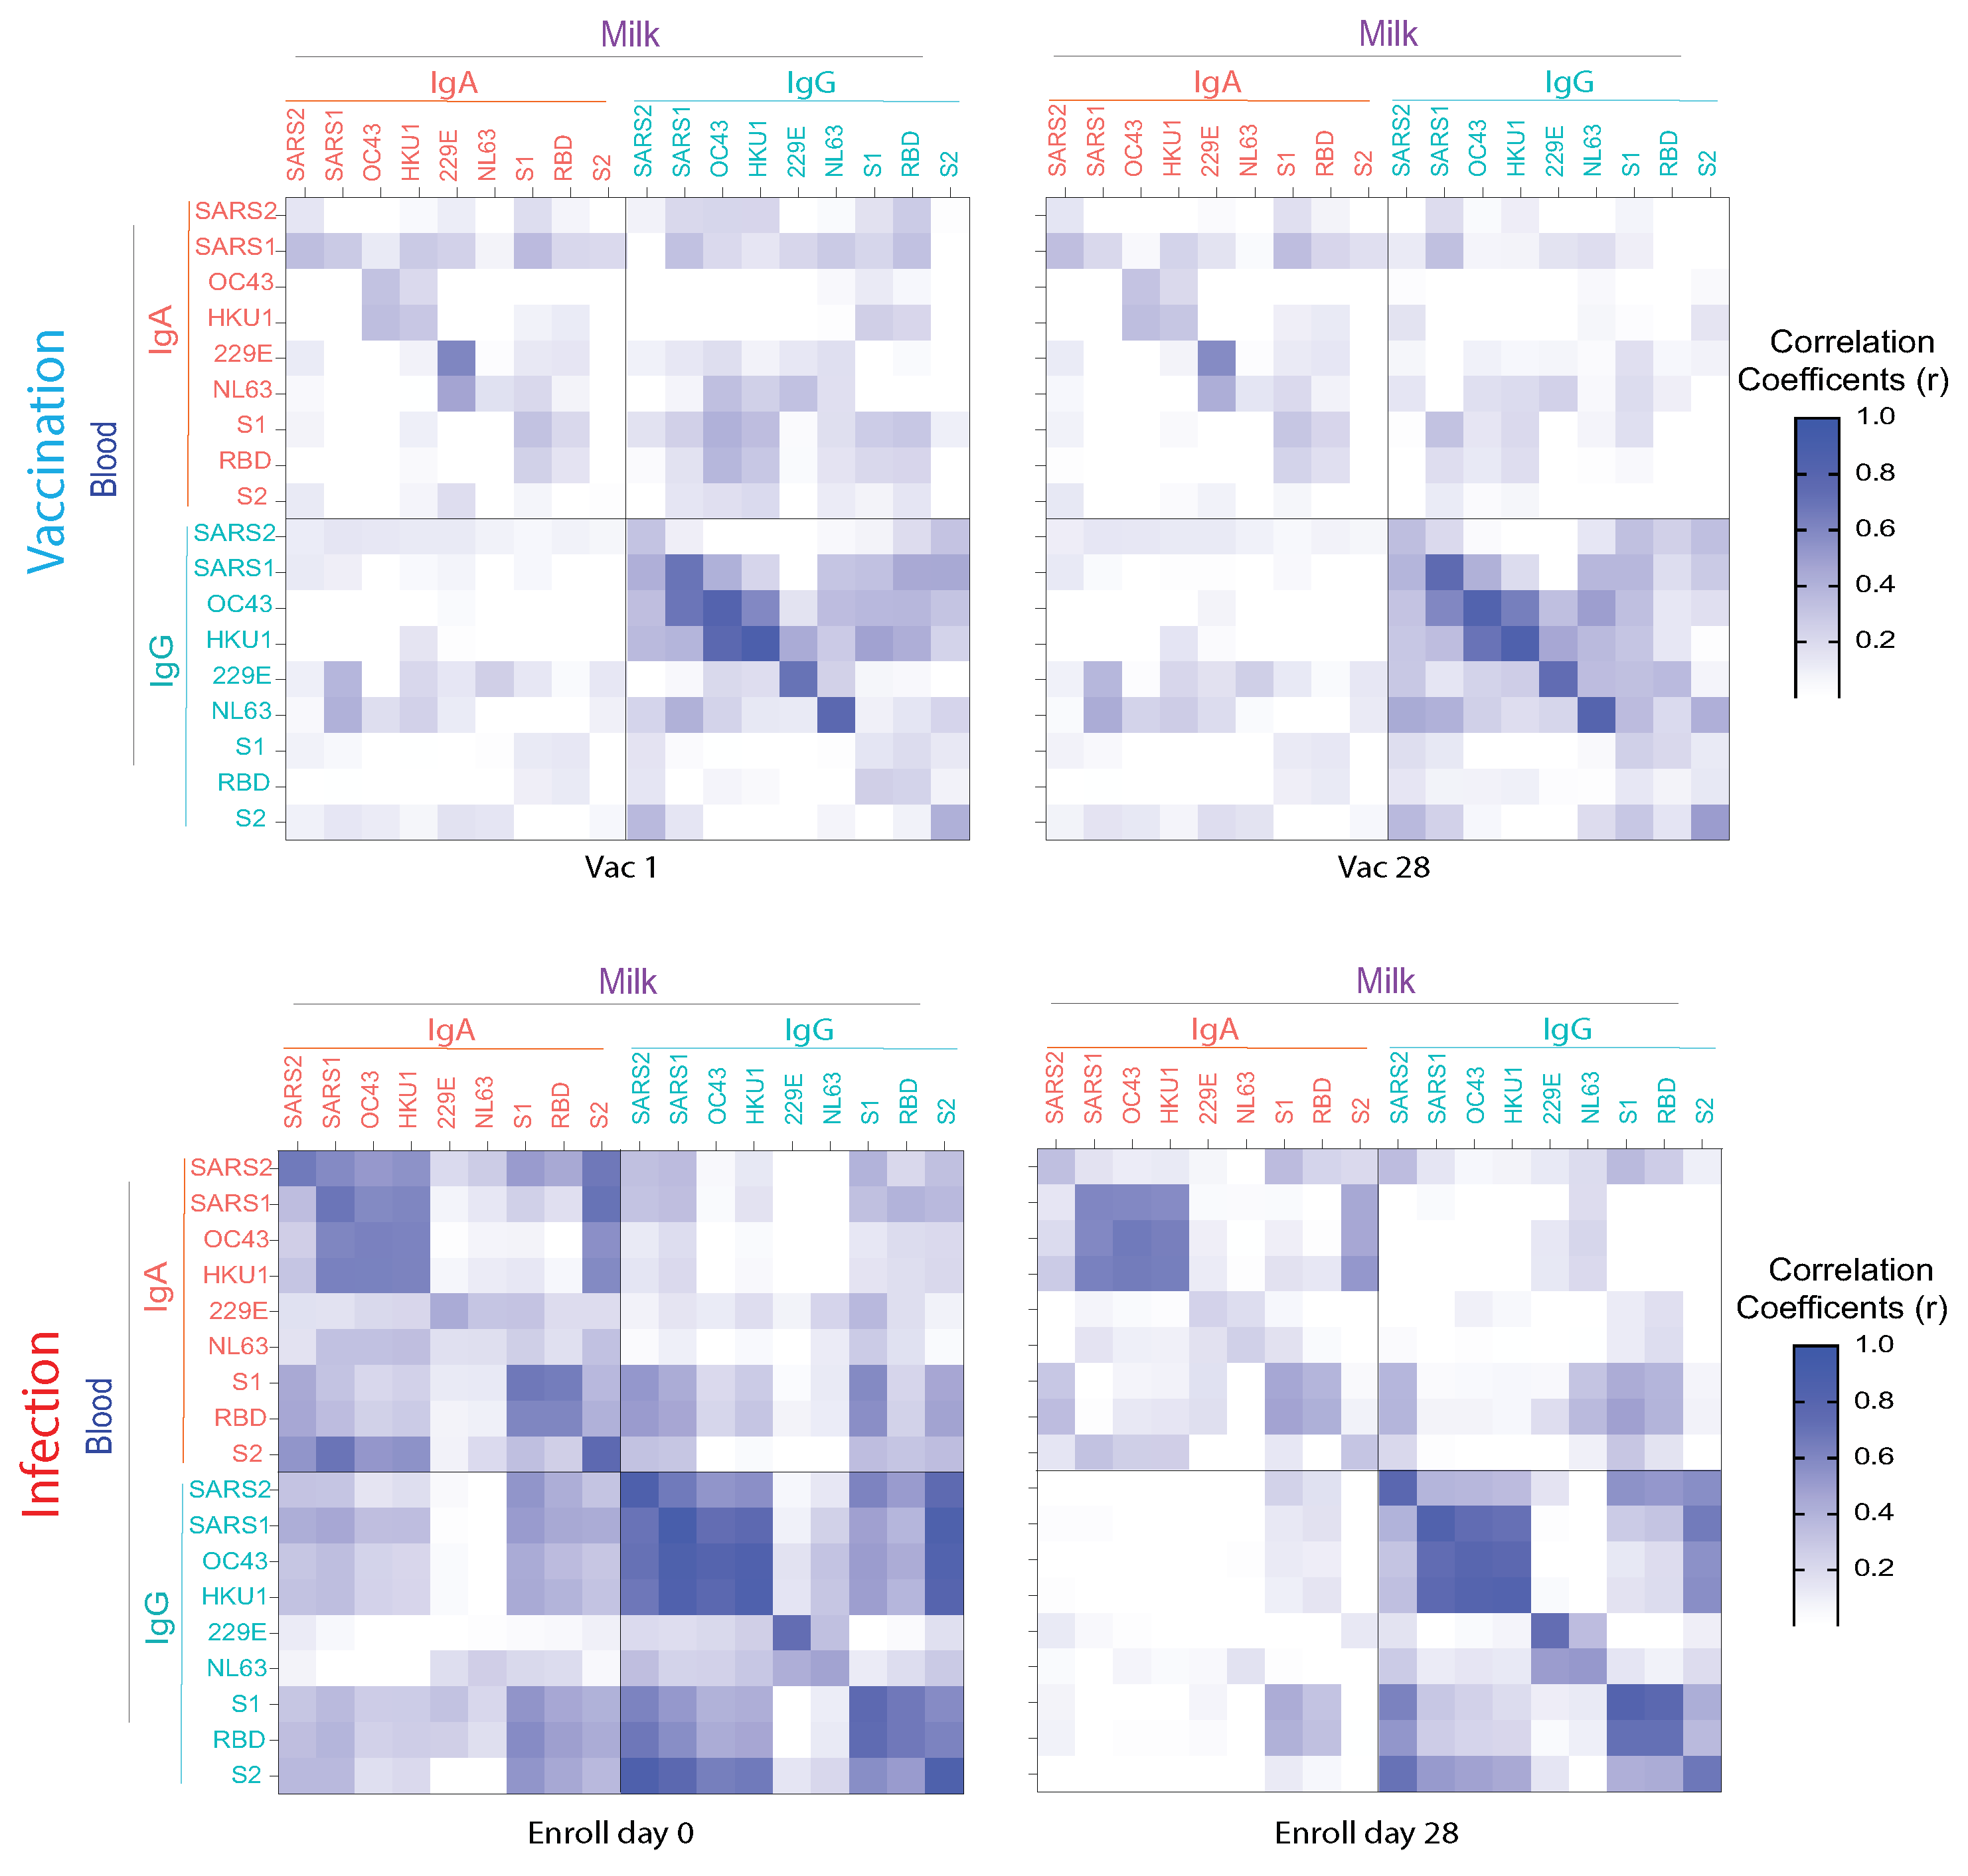
3.4. Anti-HCoV Cross-Reactive IgA and IgG Antibodies in Milk Elicited by COVID-19 Vaccination and Infection
4. Discussion
Supplementary Materials
Author Contributions
Funding
Data Availability Statement
Acknowledgments
Conflicts of Interest
References
- WHO. WHO Coronavirus Disease (COVID-19) Dashboard. 2022. Available online: https://covid19.who.int (accessed on 20 March 2022).
- Andersen, K.G.; Rambaut, A.; Lipkin, W.I.; Holmes, E.C.; Garry, R.F. The proximal origin of SARS-CoV-2. Nat. Med. 2020, 26, 450–452. [Google Scholar] [CrossRef] [Green Version]
- Cui, J.; Li, F.; Shi, Z.L. Origin and evolution of pathogenic coronaviruses. Nat. Rev. Microbiol. 2019, 17, 181–192. [Google Scholar] [CrossRef] [Green Version]
- Lim, Y.X.; Ng, Y.L.; Tam, J.P.; Liu, D.X. Human Coronaviruses: A Review of Virus-Host Interactions. Diseases 2016, 4, 26. [Google Scholar]
- Tyrrell, D.A.; Bynoe, M.L. Cultivation of a Novel Type of Common-Cold Virus in Organ Cultures. Br. Med. J. 1965, 1, 1467–1470. [Google Scholar] [CrossRef] [PubMed] [Green Version]
- Zost, S.J.; Gilchuk, P.; Case, J.B.; Binshtein, E.; Chen, R.E.; Nkolola, J.P.; Schafer, A.; Reidy, J.X.; Trivette, A.; Nargi, R.S.; et al. Potently neutralizing and protective human antibodies against SARS-CoV-2. Nature 2020, 584, 443–449. [Google Scholar] [CrossRef] [PubMed]
- Pan, Y.; Li, X.; Yang, G.; Fan, J.; Tang, Y.; Zhao, J.; Long, X.; Guo, S.; Zhao, Z.; Liu, Y.; et al. Serological immunochromatographic approach in diagnosis with SARS-CoV-2 infected COVID-19 patients. J. Infect. 2020, 81, e28–e32. [Google Scholar] [CrossRef] [PubMed]
- Lan, J.; Ge, J.; Yu, J.; Shan, S.; Zhou, H.; Fan, S.; Zhang, Q.; Shi, X.; Wang, Q.; Zhang, L.; et al. Structure of the SARS-CoV-2 spike receptor-binding domain bound to the ACE2 receptor. Nature 2020, 581, 215–220. [Google Scholar] [CrossRef] [PubMed] [Green Version]
- Zohar, T.; Loos, C.; Fischinger, S.; Atyeo, C.; Wang, C.; Slein, M.D.; Burke, J.; Yu, J.; Feldman, J.; Hauser, B.M.; et al. Compromised Humoral Functional Evolution Tracks with SARS-CoV-2 Mortality. Cell 2020, 183, 1508–1519.e12. [Google Scholar] [CrossRef]
- Zohar, T.; Alter, G. Dissecting antibody-mediated protection against SARS-CoV-2. Nat. Rev. Immunol. 2020, 20, 392–394. [Google Scholar] [CrossRef]
- Wang, J.; Li, D.; Zhou, Q.; Wiltse, A.; Zand, M.S. Antibody Mediated Immunity to SARS-CoV-2 and Human Coronaviruses: Multiplex Beads Assay and Volumetric Absorptive Microsampling to Generate Immune Repertoire Cartography. Front. Immunol. 2021, 12, 696370. [Google Scholar] [CrossRef] [PubMed]
- Hicks, J.; Klumpp-Thomas, C.; Kalish, H.; Shunmugavel, A.; Mehalko, J.; Denson, J.P.; Snead, K.R.; Drew, M.; Corbett, K.S.; Graham, B.S.; et al. Serologic Cross-Reactivity of SARS-CoV-2 with Endemic and Seasonal Betacoronaviruses. J. Clin. Immunol. 2021, 41, 906–913. [Google Scholar] [CrossRef] [PubMed]
- Dan, J.M.; Mateus, J.; Kato, Y.; Hastie, K.M.; Yu, E.D.; Faliti, C.E.; Grifoni, A.; Ramirez, S.I.; Haupt, S.; Frazier, A.; et al. Immunological memory to SARS-CoV-2 assessed for up to 8 months after infection. Science 2021, 371, abf4063. [Google Scholar] [CrossRef] [PubMed]
- Nguyen-Contant, P.; Embong, A.K.; Kanagaiah, P.; Chaves, F.A.; Yang, H.; Branche, A.R.; Topham, D.J.; Sangster, M.Y. S Protein-Reactive IgG and Memory B cell Production after Human SARS-CoV-2 Infection Includes Broad Reactivity to the S2 Subunit. mBio 2020, 11, e01991-20. [Google Scholar] [CrossRef] [PubMed]
- Section on, B. Breastfeeding and the use of human milk. Pediatrics 2012, 129, e827–e841. [Google Scholar] [CrossRef] [Green Version]
- Rio-Aige, K.; Azagra-Boronat, I.; Castell, M.; Selma-Royo, M.; Collado, M.C.; Rodriguez-Lagunas, M.J.; Perez-Cano, F.J. The Breast Milk Immunoglobulinome. Nutrients 2021, 13, 1810. [Google Scholar] [CrossRef]
- Pace, R.M.; Williams, J.E.; Jarvinen, K.M.; Belfort, M.B.; Pace, C.D.; Lackey, K.A.; Gogel, A.C.; Nguyen-Contant, P.; Kanagaiah, P.; Fitzgerald, T.; et al. COVID-19 and human milk: SARS-CoV-2, antibodies, and neutralizing capacity. medRxiv 2020. [Google Scholar] [CrossRef]
- Fox, A.; Marino, J.; Amanat, F.; Krammer, F.; Hahn-Holbrook, J.; Zolla-Pazner, S.; Powell, R.L. Robust and Specific Secretory IgA Against SARS-CoV-2 Detected in Human Milk. iScience 2020, 23, 101735. [Google Scholar] [CrossRef]
- Kaplonek, P.; Wang, C.; Bartsch, Y.; Fischinger, S.; Gorman, M.J.; Bowman, K.; Kang, J.; Dayal, D.; Martin, P.; Nowak, R.; et al. Early cross-coronavirus reactive signatures of protective humoral immunity against COVID-19. bioRxiv 2021. [Google Scholar] [CrossRef]
- Young, B.E.; Seppo, A.E.; Diaz, N.; Rosen-Carole, C.; Nowak-Wegrzyn, A.; Cruz Vasquez, J.M.; Ferri-Huerta, R.; Nguyen-Contant, P.; Fitzgerald, T.; Sangster, M.Y.; et al. Association of Human Milk Antibody Induction, Persistence, and Neutralizing Capacity With SARS-CoV-2 Infection vs mRNA Vaccination. JAMA Pediatr. 2022, 176, 159–168. [Google Scholar] [CrossRef]
- Polack, F.P.; Thomas, S.J.; Kitchin, N.; Absalon, J.; Gurtman, A.; Lockhart, S.; Perez, J.L.; Perez Marc, G.; Moreira, E.D.; Zerbini, C.; et al. Safety and Efficacy of the BNT162b2 mRNA Covid-19 Vaccine. N. Engl. J. Med. 2020, 383, 2603–2615. [Google Scholar] [CrossRef]
- Juncker, H.G.; Mulleners, S.J.; van Gils, M.J.; de Groot, C.J.M.; Pajkrt, D.; Korosi, A.; van Goudoever, J.B.; van Keulen, B.J. The Levels of SARS-CoV-2 Specific Antibodies in Human Milk Following Vaccination. J. Hum. Lact. 2021, 37, 477–484. [Google Scholar] [CrossRef] [PubMed]
- Baird, J.K.; Jensen, S.M.; Urba, W.J.; Fox, B.A.; Baird, J.R. SARS-CoV-2 Antibodies Detected in Mother’s Milk Post-Vaccination. J. Hum. Lact. 2021, 37, 492–498. [Google Scholar] [CrossRef] [PubMed]
- Lackey, K.A.; Pace, R.M.; Williams, J.E.; Bode, L.; Donovan, S.M.; Järvinen, K.M.; Seppo, A.E.; Raiten, D.J.; Meehan, C.L.; McGuire, M.A.; et al. SARS-CoV-2 and human milk: What is the evidence? Matern. Child Nutr. 2020, 16, e13032. [Google Scholar] [CrossRef] [PubMed]
- Pace, R.M.; Williams, J.E.; Jarvinen, K.M.; Belfort, M.B.; Pace, C.D.W.; Lackey, K.A.; Gogel, A.C.; Nguyen-Contant, P.; Kanagaiah, P.; Fitzgerald, T.; et al. Characterization of SARS-CoV-2 RNA, Antibodies, and Neutralizing Capacity in Milk Produced by Women with COVID-19. mBio 2021, 12, e03192-20. [Google Scholar] [CrossRef]
- Aydillo, T.; Rombauts, A.; Stadlbauer, D.; Aslam, S.; Abelenda-Alonso, G.; Escalera, A.; Amanat, F.; Jiang, K.; Krammer, F.; Carratala, J.; et al. Immunological imprinting of the antibody response in COVID-19 patients. Nat. Commun. 2021, 12, 3781. [Google Scholar] [CrossRef]
- Guo, L.; Wang, Y.; Kang, L.; Hu, Y.; Wang, L.; Zhong, J.; Chen, H.; Ren, L.; Gu, X.; Wang, G.; et al. Cross-reactive antibody against human coronavirus OC43 spike protein correlates with disease severity in COVID-19 patients: A retrospective study. Emerg. Microbes Infect. 2021, 10, 664–676. [Google Scholar] [CrossRef]
- Wang, J.; Li, D.; Perry, S.; Hilchey, S.P.; Wiltse, A.; Treanor, J.J.; Sangster, M.Y.; Zand, M.S. Broadly Reactive IgG Responses to Heterologous H5 Prime-Boost Influenza Vaccination Are Shaped by Antigenic Relatedness to Priming Strains. mBio 2021, 12, e0044921. [Google Scholar] [CrossRef]
- Gostic, K.M.; Ambrose, M.; Worobey, M.; Lloyd-Smith, J.O. Potent protection against H5N1 and H7N9 influenza via childhood hemagglutinin imprinting. Science 2016, 354, 722–726. [Google Scholar] [CrossRef] [Green Version]
- Wang, J.; Li, D.; Cameron, A.; Zhou, Q.; Wiltse, A.; Nayak, J.; Pecora, N.D.; Zand, M.S. IgG Against Human beta-Coronavirus Spike Proteins Correlates with SARS-CoV-2 anti-Spike IgG Responses and COVID-19 Disease Severity. J. Infect. Dis. 2022, jiac022. [Google Scholar] [CrossRef]
- Valcarce, V.; Stafford, L.S.; Neu, J.; Cacho, N.; Parker, L.; Mueller, M.; Burchfield, D.J.; Li, N.; Larkin, J., III. Detection of SARS-CoV-2-Specific IgA in the Human Milk of COVID-19 Vaccinated Lactating Health Care Workers. Breastfeed. Med. 2021, 16, 1004–1009. [Google Scholar] [CrossRef]
- Guida, M.; Terracciano, D.; Cennamo, M.; Aiello, F.; La Civita, E.; Esposito, G.; Gargiulo, V.; Maruotti, G.M.; Portella, G.; Sarno, L. COVID-19 Vaccine mRNABNT162b2 Elicits Human Antibody Response in Milk of Breastfeeding Women. Vaccines 2021, 9, 785. [Google Scholar] [CrossRef] [PubMed]
- Seppo, A.E.; Savilahti, E.M.; Berin, M.C.; Sampson, H.A.; Jarvinen, K.M. Breast milk IgA to foods has different epitope specificity than serum IgA-Evidence for entero-mammary link for food-specific IgA? Clin. Exp. Allergy 2017, 47, 1275–1284. [Google Scholar] [CrossRef]
- Juncker, H.G.; Romijn, M.; Loth, V.N.; Ruhe, E.J.M.; Bakker, S.; Kleinendorst, S.; de Groot, C.J.M.; Pajkrt, D.; Korosi, A.; van Goudoever, J.B.; et al. Antibodies Against SARS-CoV-2 in Human Milk: Milk Conversion Rates in the Netherlands. J. Hum. Lact. 2021, 37, 469–476. [Google Scholar] [CrossRef] [PubMed]
- Demers-Mathieu, V.; Do, D.M.; Mathijssen, G.B.; Sela, D.A.; Seppo, A.; Jarvinen, K.M.; Medo, E. Correction: Difference in levels of SARS-CoV-2 S1 and S2 subunits- and nucleocapsid protein-reactive SIgM/IgM, IgG and SIgA/IgA antibodies in human milk. J. Perinatol. 2021, 41, 1207. [Google Scholar] [CrossRef] [PubMed]
- Kaetzel, C.S. Cooperativity among secretory IgA, the polymeric immunoglobulin receptor, and the gut microbiota promotes host-microbial mutualism. Immunol. Lett. 2014, 162, 10–21. [Google Scholar] [CrossRef] [PubMed] [Green Version]
- Hanson, L.A.; Korotkova, M. The role of breastfeeding in prevention of neonatal infection. Semin. Neonatol. 2002, 7, 275–281. [Google Scholar] [CrossRef]
- Roux, M.E.; McWilliams, M.; Phillips-Quagliata, J.M.; Weisz-Carrington, P.; Lamm, M.E. Origin of IgA-secreting plasma cells in the mammary gland. J. Exp. Med. 1977, 146, 1311–1322. [Google Scholar] [CrossRef]
- Shen, L.; Fanger, M.W. Secretory IgA antibodies synergize with IgG in promoting ADCC by human polymorphonuclear cells, monocytes, and lymphocytes. Cell. Immunol. 1981, 59, 75–81. [Google Scholar] [CrossRef]
- Dahlgren, U.I.; Ahlstedt, S.; Hanson, L.A. The localization of the antibody response in milk or bile depends on the nature of the antigen. J. Immunol. 1987, 138, 1397–1402. [Google Scholar]
- Villalpando, S.; Butte, N.F.; Flores-Huerta, S.; Thotathuchery, M. Qualitative analysis of human milk produced by women consuming a maize-predominant diet typical of rural Mexico. Ann. Nutr. Metab. 1998, 42, 23–32. [Google Scholar] [CrossRef]
- Tanneau, G.M.; Hibrand-Saint Oyant, L.; Chevaleyre, C.C.; Salmon, H.P. Differential recruitment of T- and IgA B-lymphocytes in the developing mammary gland in relation to homing receptors and vascular addressins. J. Histochem. Cytochem. 1999, 47, 1581–1592. [Google Scholar] [CrossRef] [PubMed] [Green Version]
- Morteau, O.; Gerard, C.; Lu, B.; Ghiran, S.; Rits, M.; Fujiwara, Y.; Law, Y.; Distelhorst, K.; Nielsen, E.M.; Hill, E.D.; et al. An indispensable role for the chemokine receptor CCR10 in IgA antibody-secreting cell accumulation. J. Immunol. 2008, 181, 6309–6315. [Google Scholar] [CrossRef] [PubMed] [Green Version]
- Peri, B.A.; Theodore, C.M.; Losonsky, G.A.; Fishaut, J.M.; Rothberg, R.M.; Ogra, P.L. Antibody content of rabbit milk and serum following inhalation or ingestion of respiratory syncytial virus and bovine serum albumin. Clin. Exp. Immunol. 1982, 48, 91–101. [Google Scholar] [PubMed]
- Kohler, G.; Milstein, C. Continuous cultures of fused cells secreting antibody of predefined specificity. Nature 1975, 256, 495–497. [Google Scholar] [CrossRef]
- Tuaillon, E.; Valea, D.; Becquart, P.; Al Tabaa, Y.; Meda, N.; Bollore, K.; Van de Perre, P.; Vendrell, J.P. Human milk-derived B cells: A highly activated switched memory cell population primed to secrete antibodies. J. Immunol. 2009, 182, 7155–7162. [Google Scholar] [CrossRef]
- Fouda, G.G.; Yates, N.L.; Pollara, J.; Shen, X.; Overman, G.R.; Mahlokozera, T.; Wilks, A.B.; Kang, H.H.; Salazar-Gonzalez, J.F.; Salazar, M.G.; et al. HIV-specific functional antibody responses in breast milk mirror those in plasma and are primarily mediated by IgG antibodies. J. Virol. 2011, 85, 9555–9567. [Google Scholar] [CrossRef] [Green Version]
- Becquart, P.; Hocini, H.; Garin, B.; Sepou, A.; Kazatchkine, M.D.; Belec, L. Compartmentalization of the IgG immune response to HIV-1 in breast milk. AIDS 1999, 13, 1323–1331. [Google Scholar] [CrossRef]


Publisher’s Note: MDPI stays neutral with regard to jurisdictional claims in published maps and institutional affiliations. |
© 2022 by the authors. Licensee MDPI, Basel, Switzerland. This article is an open access article distributed under the terms and conditions of the Creative Commons Attribution (CC BY) license (https://creativecommons.org/licenses/by/4.0/).
Share and Cite
Wang, J.; Young, B.E.; Li, D.; Seppo, A.; Zhou, Q.; Wiltse, A.; Nowak-Wegrzyn, A.; Murphy, K.; Widrick, K.; Diaz, N.; et al. Broad Cross-Reactive IgA and IgG against Human Coronaviruses in Milk Induced by COVID-19 Vaccination and Infection. Vaccines 2022, 10, 980. https://doi.org/10.3390/vaccines10060980
Wang J, Young BE, Li D, Seppo A, Zhou Q, Wiltse A, Nowak-Wegrzyn A, Murphy K, Widrick K, Diaz N, et al. Broad Cross-Reactive IgA and IgG against Human Coronaviruses in Milk Induced by COVID-19 Vaccination and Infection. Vaccines. 2022; 10(6):980. https://doi.org/10.3390/vaccines10060980
Chicago/Turabian StyleWang, Jiong, Bridget E. Young, Dongmei Li, Antti Seppo, Qian Zhou, Alexander Wiltse, Anna Nowak-Wegrzyn, Katherine Murphy, Kaili Widrick, Nicole Diaz, and et al. 2022. "Broad Cross-Reactive IgA and IgG against Human Coronaviruses in Milk Induced by COVID-19 Vaccination and Infection" Vaccines 10, no. 6: 980. https://doi.org/10.3390/vaccines10060980