

Abstract
A second wave of coronavirus disease 2019 (COVID-19) infections emerged in Beijing in summer 2020, which provided an opportunity to explore the response of air pollution to reduced human activity. Proton-transfer reaction time-of-flight mass spectrometry (PTR-ToF-MS) coupled with positive matrix factorization (PMF) source apportionment were applied to evaluate the pollution pattern and capture the detailed dynamic emission characteristics of volatile organic compounds (VOCs) during the representative period, with the occurrence of O3 pollution episodes and the Beijing resurgence of COVID-19. The level of anthropogenic VOC was lower than during the same period in previous years due to the pandemic and emission reduction measures. More than two thirds of the days during the observation period were identified as high-O3 days and VOCs exhibited higher mixing ratios and faster consumption rates in the daytime on high-O3 days. The identified VOC emission sources and the corresponding contributions during the whole observation period included: vehicle + fuel (12.41 ± 9.43%), industrial process (9.40 ± 8.65%), solvent usage (19.58 ± 13.46%), biogenic (6.03 ± 5.40%), background + long-lived (5.62 ± 11.37%), and two groups of oxygenated VOC (OVOC) factors (primary emission and secondary formation, 26.14 ± 15.20% and 20.84 ± 14.0%, respectively). Refined dynamic source apportionment results show that the 'stay at home' tendency led to decreased emission (−34.47 ± 1.90%) and a weakened morning peak of vehicle + fuel during the Beijing resurgence. However, a growing emission of primary OVOCs (+51.10 ± 8.28%) with similar diurnal variation was observed in the new outbreak and afterwards, which might be related to the enhanced usage of products intended to clean and disinfect. The present study illustrated that more stringent VOC reduction measures towards pandemic products should be carried out to achieve the balanced emission abatement of NOx and VOC when adhering to regular epidemic prevention and control measures.

Original content from this work may be used under the terms of the Creative Commons Attribution 4.0 license. Any further distribution of this work must maintain attribution to the author(s) and the title of the work, journal citation and DOI.
1. Introduction
The unexpected 2019 novel coronavirus (COVID-19) pandemic broke out in China at the beginning of 2020 (Harapan et al 2020, Silver et al 2020). A series of effective countermeasures have been rapidly carried out to inhibit the spread of COVID-19, and Beijing, a megacity of more than 20 million people, appeared to have stamped out the virus for nearly two months. However, a cluster of locally transmitted COVID-19 cases linked to a major wholesale food market emerged, and Beijing re-entered 'wartime emergency mode' on 11 June after the first case was confirmed in the new outbreak. Fortunately, the flare-up that infected 335 people was quelled after 25 days. The evolution of the Beijing resurgence of COVID-19 is presented in figure S1 (available online at stacks.iop.org/ERL/17/024002/mmedia). Instead of the across-the-board lockdown and complete shutdown of most sectors, more targeted measures were developed in the Beijing resurgence, mainly including millions of nucleic acid tests and partial lockdown in high-risk areas. The resumed normal lives of residents were significantly hit during the resurgence, with fewer unnecessary trips and more disinfection practices to avoid infection, while manufacturing activity seemed to be barely affected. The volatile organic compound (VOC) emission and relative environmental effects embodied in human daily life have received increasing attention with the shift of industry to surrounding areas and the continuous growth of population in urban areas, especially in megacities (Karl et al 2018, Fu et al 2020, Zhang et al 2021b). Recent research reported that the secondary organic aerosol (SOA) models involving vehicular and biogenic emissions could only explain half of the measurement and the largest gap was observed in the morning-time urban street canyon, where volatile chemical products (e.g. personal care products) were intensively used (Shah et al 2020). Thus, the Beijing resurgence of COVID-19 provided an unexpectable opportunity to evaluate the sensitivity of the less reported VOC emission sources related to urban daily life.
VOCs, the vital precursor of ozone (O3) and SOA, play an important role in the atmospheric oxidation process (Carter 1994, Guo et al 2014, Liu et al 2015). Most urban areas of China lie under the VOC-limited O3 formation regime, which means that the titration effect of NOx might negatively affect O3 concentration (Xing et al 2017, Li et al 2020). The imbalanced emission abatement of nitrogen oxides (NOx ) and VOC in the megacities in China caused by the COVID-19 outbreak was widely observed, resulting in the enhanced oxidizing capacity of the atmosphere and further leading to the unexpected air pollution in the wintertime of 2020 (Le et al 2020, Wang et al 2020b, Zhao et al 2020b). Although NOx emissions are of concern (Deng et al 2020), Lv et al (2020) suggested that VOCs should be treated as the precedent-controlled - pollutant to achieve air quality improvement in the short term. Ultrahigh-resolution and extremely comprehensive source apportionment results of VOCs are required to resolve the bottleneck restriction of VOC reduction, which poses challenges to the identification and quantification of VOCs in ambient air.
Proton-transfer reaction time-of-flight mass spectrometry (PTR-ToF-MS) is a novel online technology for detecting trace amounts of VOCs with high time resolution and is more suitable for the measurement of oxygenated VOCs (OVOCs), which is not represented in traditional emissions inventories (de Gouw et al 2003, Yuan et al 2017, Karl et al 2018). Our recent study has proved that the combination of PTR-ToF-MS measurement and positive matrix factorization (PMF) source apportionment could provide refined dynamic source apportionment results, which ensured that the variation of emission source distributions and intensities could be well captured (Zhang et al 2021a). In the current study, PTR-ToF-MS measurement coupled with air mass back-trajectory cluster analysis and receptor modelling were applied to discuss the pollution pattern, regional transport, and emission sources of ambient VOCs in Beijing in summer 2020. Based on high time-resolved observation and source apportionment data, the study aims to analyze the detailed dynamic change process of VOC levels and emission sources during the period of high incidence of ozone pollution. Furthermore, by dividing the study into two periods (Beijing resurgence and after Beijing resurgence), we discuss the response of VOC emission (structure and intensity) to the temporary COVID-19 outbreak, hoping to provide information for sustainable air quality improvement under the normalization trend of epidemic prevention and control.
2. Materials and methods
2.1. Sampling site
The present study was conducted in Beijing, the capital city of China, which in 2019 had 21.536 million residents and 6.365 million motor vehicles. Figure S2 shows the location of Beijing city and the sampling site. The location of the VOC monitoring station was on the tenth-floor roof of the School of Environment building in Tsinghua University (THU, 39.998 °N, 116.335 °E), approximately 35 m above ground level, belonging to the surface layer of the troposphere. This site lies within the fifth ring road of Beijing, surrounded by the THU campus, residential and commercial areas with intensive human activities, which is representative of typical urban sites and is widely used for filed observations (Ren et al 2019a, 2019b, An et al 2020).
2.2. PTR-ToF-MS measurements
A commercial highly-sensitive PTR-ToF-MS 4000 instrument (Ionicon Analytik GmbH, Innsbruck, Austria) was applied for the real-time measurement of VOCs at the sampling site. Ambient air was inhaled into the reaction drift tube through a particulate filter and a 1.5 m long polyetheretherketone tube placed outside. The key operating parameters were 3.00 mbar pressure, 80 °C, and 800 V, obtaining a corresponding electric field strength/gas number density (E/N) ratio of approximately 130 Td (1 Td = 10−7 V cm2). The reagent ion was protonated water (H3O+), and VOCs with a proton affinity higher than that of water (>165 kcal mol−1) can be measured. Thus, alkanes below C3 and alkenes below C2 cannot be captured by PTR-ToF-MS due to the weaker proton affinity than water (Luo et al 2020). Mass spectrometric data were collected every second, and a test file was formed hourly. Measurements and data acquisition were performed by IONICON PTR-TOF Software: TOF 2.0 (Ionicon Analytik GmbH, Innsbruck, Austria) and data analyzing and processing were operated by PTR-MS Viewer-Version 3.2 (Ionicon Analytik GmbH, Innsbruck, Austria). According to the instrument manual, the detection limits were decided by 3 × standard deviation of the background measurement. The multi-component gas standards (Linde Spectra Environment Gases, Alpha, NJ, USA) were dynamically diluted to calibrate the PTR-ToF-MS and the standard curves of 12 VOCs were obtained (benzene, toluene, styrene, ethylbenzene, 1,3,5-trimethylbenzene, methyl ethyl ketone (MEK), ethyl ketone, methyl isobutyl ketone, isopropyl alcohol, acetone, acrolein, and propylene). The concentrations of compounds that have not been calibrated were determined based on the transmission curve coefficients (de Gouw and Warneke 2007, Taipale et al 2008), applying the transmission tool of the PTR-MS Viewer-Version 3.2 (Zhou et al 2019). Regular pollutants and meteorological parameters were measured synchronously.
2.3. PMF, HYSPLIT, and CBPF models
The PMF 5.0 model (United States Environmental Protection Agency) was utilized to identify the potential VOC sources. Briefly, the model assigns substantial ambient concentration data to emission sources based on their intrinsic characteristics of the observation data (Yuan et al 2009). The detailed principles can be found in the SI (text S1). In the current study, 25 representative species, which were the major constituents of the ambient observation and could assist in assigning factors to emission sources, were selected to derive source profiles. The concentration values and uncertainty values for each species were input. Three to nine factors were investigated with the PMF model, and the optimized result was obtained with seven factors in consideration of the Q values and physical plausibility (Chen et al 2014, Hui et al 2020). The detailed PMF performance is exhibited in the SI (text S2).
The National Oceanic and Atmospheric Administration (NOAA) Hybrid Single Particle Lagrangian Integrated Trajectory (HYSPLIT) model was used to identify the potential source region for VOCs at a large scale. The NOAA Air Resource Laboratory archived Global Data Assimilation System was used as meteorological input. We calculated 48 h backward trajectories for every 6 h starting at 00:00 UTC at an arrival altitude of 500 m above ground level in Beijing. Then the backward trajectories were categorized by cluster analysis. The trajectories were divided into four clusters based on their spatial similarity (text S3 in the SI). The conditional bivariate probability function (CBPF) model was applied to assess the influence of both wind speed and wind direction to local emission origins based on the PMF source contribution solution. Further details can be found in text S4 in SI. The CBPF plots were drawn using the open air package in R (Carslaw and Ropkins 2012), and the threshold value was set to the 75th percentile.
3. Results and discussion
3.1. VOC pollution characteristics in Beijing
VOCs were measured by PTR-ToF-MS at a temporal resolution of one second from 9 June to 30 July 2020. A total of 4.49 × 10⁶ series of data were obtained and the average VOC mixing ratios with standard deviations are listed in table S1. The general trends of typical VOC mixing ratios and meteorological parameters are illustrated in figure S1. The temperature ranged from 18.9 °C to 38.6 °C and the relative humidity ranged from 16.5% to 96.6%. The dominant wind direction during the observation was N and SW and the wind speed ranged from 0.2 to 5.0 m s−1.
The measured sum of VOC mixing ratios was averaged for 25.14 ± 9.84 ppbv in the observation period. Due to the analytical difficulty of traditional gas chromatography (GC) methods, large amounts of OVOCs, such as ethanol, propanol, phenol, and macromolecular aldehydes (C7 ∼ C10), were not included in the profiles of previous studies, leading to the loss of pollutant information (Han et al 2019, Liu et al 2020). OVOCs were considered to be the important precursors of SOA because of the high solubilities and low vapor precursors (Karl et al 2001). They can be directly emitted from both anthropogenic (such as vehicle exhausts, biomass burning, industrial processes, and solvent usage) and biogenic sources (Shao et al 2009). Besides, a large part of OVOCs derives from secondary formation, which exerts an important impact on the atmospheric photochemical cycle (Huang et al 2020). The sensitivity of PTR-MS is related to the proton-transfer reaction rate constant, hence it is more suitable for the measurement of OVOCs that cannot be calibrated directly (Sekimoto and Koss 2021). The most abundant OVOC species detected in this study was acetone + propanal (4.07 ± 1.15 ppbv), followed by methanol (3.49 ± 1.66 ppbv) and acetaldehyde (3.42 ± 1.21 ppbv). The ranking of aromatics, which are thought to be mainly derived from primary emissions, was xylene + ethylbenzene (0.35 ± 0.22 ppbv) > toluene (0.35 ± 0.18 ppbv) > benzene (0.29 ± 0.14 ppbv). The average mixing ratios of acetonitrile, the tracer for biomass-burning sources (Wood et al 2010), and isoprene, the marker for biogenic sources (Wu et al 2016), were 0.74 ± 0.85 ppbv and 0.25 ± 0.18 ppbv, respectively.
In table 1 and figure S3, the mean mixing ratios of typical VOCs species were compared with those observed at other urban sites worldwide and at different periods in Beijing, respectively, in order to evaluate the VOC pollution levels in this study. The major overlapping species between the online gas chromatography (GC) system and PTR-MS include C3 ∼ C4 carbonyl compounds, C6 ∼ C9 aromatics, isoprene and acetonitrile. The concentration of isoprene, the tracer for biogenic sources (Wu et al 2016), remained comparable with other observations based in urban Beijing. However, the mixing ratios of aromatics lied in a low concentration queue and were close to the levels measured in some European megacities (e.g. London (Valach et al 2015) and Helsinki (Rantala et al 2016)), and were apparently lower than those measured in 2015, 2016, and 2018 in Beijing (Liu et al 2017, 2020, Sheng et al 2018, Li et al 2019b, 2020, Huang et al 2020). The similar phenomenon that the VOC concentrations in Beijing in summer 2020 were lower than that observed during the same time period in previous years was observed by Li et al (2021) as well. These results indicated the impact of COVID-19 lockdown on emission reduction. Besides, a nationwide summer VOC governance campaign was carried out from June to September 2020 in order to effectively reduce O3 pollution and protect public health, which was regarded as the most stringent VOC control policy ever (MEE 2020). The target fields covered most VOC emission sources, such as industry, coatings, vehicles, fuel, and so on. Thus, the interannual variation of VOC concentration in Beijing in the summer could be explained in terms of both passive emission reduction as a result of the pandemic and active emission reduction to mitigate ozone pollution.
Table 1. Concentrations of VOCs in Beijing for this study and previous studies (in ppbv).
| Beijing | Beijing | Beijing | Beijing | Beijing | Beijing | Beijing | Beijing | |
|---|---|---|---|---|---|---|---|---|
| Sampling period | 2020.06–07 | 2018.05–06 | 2016.12 | 2016.3–2017.1 | 2016 | 2015.12–2016.1 | 2015.08–09 | 2015.01–02 |
| Sampling site | Urban | Urban | Urban | Urban | Urban | Urban | Urban | Urban |
| Sampling method | Continuous | Continuous | Continuous | Continuous | Continuous | Continuous | Continuous | Continuous |
| Analysis | PTR-MS | PTR-MS | PTR-MS | GC-FID | GC-MS/FID | GC-FID | GC-MS/FID | PTR-MS |
| Benzene | 0.29 | — | 2.58 | 1 | 0.92 | 1.8 | 0.61 | 1.93 |
| Toluene | 0.35 | — | 3.68 | 1.2 | 0.98 | 1.7 | 1.25 | 1.51 |
| C8 aromatics | 0.35 | — | 4.47 | 1.3 | 0.88 | 0.49 | 0.38 | 1.25 |
| Acetone + propanal | 4.07 | 4.16 | 5.07 | — | 2.42 | — | 5.27 | 1.59 |
| MEK | 0.65 | 1 | — | — | 0.4 | — | 0.64 | 0.38 |
| MVK + MACR | 0.46 | — | 1.51 | — | 0.09 | — | 0.54 | 0.31 |
| Isoprene | 0.25 | — | 0.67 | 0.3 | 0.09 | 0.12 | 0.33 | 0.04 |
| Acetonitrile | 0.74 | — | 1.34 | — | 0.3 | — | 0.47 | 0.34 |
| References | This study | Huang et al (2020) | Sheng et al (2018) | Li et al (2020) | Liu et al (2020) | Liu et al (2017) | Li et al (2016) | Li et al (2019a, 2019b) |
O3 pollution episodes frequently occurred in hotter months in Beijing (Song et al 2007, Liu et al 2018). According to the Chinese National Ambient Air Quality Standard, a high-O3 day was defined as a day with mean ozone values of the maximum daily 8 h average exceeding 160 μg m−3 (corresponding to 82 ppbv). As shown in figure S4, the present study identified 38 high-O3 days, accounting for more than two thirds of the measuring period. The hourly concentration of O3 was 139.28 μg m−3 during polluted periods, while it was 95.41 μg m−3 on clean days. The diurnal variation of O3 was consistent with temperature and opposite to relative humidity and NO2 (figure S5). The measured sum of VOCs on high-O3 days was 26.80 ± 4.84 ppbv, which was higher than the low-O3 days (21.85 ± 3.32 ppbv).
Figure 1 clearly indicates the diurnal variation of some reactive VOC species under different O3 pollution levels. The diurnal variations of VOCs were divided into emission-dominated, photochemistry-dominated, and dynamic-dominated. Emission source types and source strengths can remarkably influence the diurnal variation of VOCs. Isoprene is mainly emitted from vegetation, and the emission rates increase with temperature and photosynthetically active radiation generally (Guenther et al 1993, Claeys et al 2004). Thus, isoprene exhibited a unimodal diurnal pattern, which was related to the higher emission intensity of biogenic sources in the daytime (figure 1(a)). Benzene presented a bimodal pattern with one peak at approximately 8:00 local time (LT) and another peak at 18:00 LT, which revealed the impact of urban traffic activities (figure 1(b)). While the diurnal variation of toluene (figure 1(c)), xylene + ethylbenzene (figure 1(d)), and OVOCs (figures 1(e)–(k)) mainly reflected the impact of photochemical reactions. The diurnal variation curves presented a progressive decline in the daytime due to strong photochemical reactions with OH radicals, ozone, and other oxidants. For instance, toluene and C8 aromatics react with OH at faster rates than benzene, leading to photochemical-derived curves, though aromatics have similar emission sources (toluene: kOH = 5.93 × 10⁻¹² cm3 molecule−1 s−1; ethylbenzene: kOH = 7.00 × 10⁻¹² cm3 molecule−1 s−1; benzene: kOH = 1.22 × 10⁻¹² cm3 molecule−1 s−1) (Atkinson and Arey 2003). Atmospheric dynamic is another important factor affecting the variation of pollutant concentration. Diffusion conditions are poor at night with a lower planetary boundary layer (PBL) and stagnant flow, while the pollutants can be dispersed and diluted by the fast-growing PBL and higher wind speed in the daytime. Acetonitrile is an inert species with an atmospheric lifetime of approximately six months (Holzinger et al 2005). The mixing ratios increased at nighttime and remained stable in the daytime, which demonstrated well the influence of atmospheric mixing conditions (figure 1(l)). It is worth noting that although dominated by different factors, the diurnal variation of VOCs is driven by the combined influence of emission sources, atmospheric dynamics, as well as photochemical reaction rates.

Figure 1. Diurnal variations in mixing ratios of some reactive VOC species in Beijing on high- and low-O3 days.
Download figure:
Standard image High-resolution imageTake O3 pollution levels into consideration. First, all the species exhibited higher mixing ratios under high-O3 days, and the gap was more obvious late at night when the diffusion condition was poor. Methanol experienced the largest decrease with the concentration dropping from 4.04 ppbv during polluted days to 2.90 ppbv during clean days (figure 1(e)). From high- to low-O3 days, the mixing ratios of methanol decreased by 40.67 ± 2.92% during 0:00–6:00 LT, while the decline in other periods was 22.63 ± 0.40%. Second, the concentration peaks and the consumption rates in the daytime of VOCs increased significantly on high-O3 days, which reflects the stagnant weather conditions and active photochemical processes during polluted periods. The peak of methanol, acetaldehyde, MVK + MACR, MEK, acetic acid, ethanol, benzene and so on in the morning was apparently weakened on low-O3 days. In the case of toluene, the mean consumption rate of toluene during the polluted daytime was 0.017 ppbv h−1, which was far higher than that on clean days (0.004 ppbv h−1, figure 1(c)).
3.2. Source regions of VOCs in Beijing
Regional transport has a great impact on pollution levels. Based on the back-trajectory cluster analysis, the air masses arriving at Beijing are divided into cluster 1 (south, medium-distance), cluster 2 (north–west, short-distance), cluster 3 (north–west, long-distance), and cluster 4 (east, medium-distance), making up 39%, 21%, 6%, and 34% of the total trajectories (figure 2). And the corresponding VOC mixing ratios were 26.73, 25.90, 23.06, and 23.60 ppbv, respectively. Except for cluster 3 passing through Mongolia, the other paths could be attributed to the internal transport within the Beijing–Tianjin–Hebei region and surroundings. When affected by the short- and medium- distance air masses derived from the south and northwest, where the heavy industry cities are located (Liu et al 2020), the level of VOC concentration was slightly higher than other periods. Besides, in the case of relatively low VOC concentration during the observation period, long-distance transmission from the northwest could not be ignored. It has been reported that the high potential source regions stretched to the far northwest of Beijing in recent years (Ji et al 2019). Thus, to further mitigate VOC pollution in Beijing, the regional cooperative control should be conducted in the northwestern and southern areas instead of solely in southern cities.

Figure 2. Mean 48 h backward trajectories of clusters in Beijing in the summer.
Download figure:
Standard image High-resolution image3.3. Source apportionment of VOCs in Beijing
The PMF results given the chemical compositions and time profiles of the seven selected factors. The corresponding source factor distributions are reflected in figure 3 and the seven sources are proposed to be: (a) vehicle + fuel (12.41 ± 9.43%), (b) industrial process (9.40 ± 8.65%), (c) solvent usage (19.58 ± 13.46%), (d) OVOC 1 (26.14 ± 15.20%), (e) OVOC 2 (20.84 ± 14.0%), (f) biogenic (6.03 ± 5.40%), and (g) background + long-lived (5.62 ± 11.37%).

Figure 3. VOC fingerprint from PMF analysis. The color code is proportional to the factor fractions of the species.
Download figure:
Standard image High-resolution imageFactor 1 was identified as vehicle + fuel. This factor was dominated by a strong presence of butene (28.75%), propene (20.13%), butadiene (77.79%), benzene (20.99%), and toluene (12.58%). According to tunnel studies and emission-based measurements, high loads of aromatics coupled with C3–C5 alkane and alkene were typical characteristics for vehicle exhaust and fuel evaporation products (Yuan et al 2009, Zhang et al 2018). The characteristic ratios of toluene to benzene (T/B) can assist in identifying emission sources. A T/B ratio ⩽2–3 suggested the influence of traffic emissions on VOC concentration, while T/B ratio ⩾2–3 indicated the influence of sources that are independent of traffic (such as solvent evaporation or industrial sources) (Thera et al 2019). The T/B ratio was 0.71 for factor 1, which could be referred to as traffic-related sources. Besides, a relatively high load of methyl tert-butyl ether (MTBE) (21.01%), a widely used gasoline additive, was observed as well (Li et al 2019a). Thus, factor 1 could be concluded as vehicle + fuel. The contributions of vehicle + fuel increased in the morning and evening (figure 4(a)), due to the increased emissions from the morning and evening rush hours. The decline in the afternoon was likely due to decreased emissions, better mixing conditions and enhanced photochemical loss.

Figure 4. Diurnal variations of VOC source contributions in Beijing during partial lockdown and relaxed lockdown.
Download figure:
Standard image High-resolution imageIn factor 2, large values of ethylacetate (41.92%), methylacetate (20.19%), benzene (19.91%), and styrene (34.36%) were observed. Previous studies have reported that industrial processes were the most important source of esters in the megacities of China (Geng et al 2009, Li et al 2019a). And in addition to vehicle exhausts, industrial activities were also vital sources for aromatics (Zhao et al 2020a). Thus, factor 2 was identified as industrial process. The contribution increased at sunrise and reached its maximum between 7:00 and 9:00, which was a representative period of anthropogenic activities (figure 4(b)). And then the gradual decline reflected the dispersion and dilution processes in the daytime.
Factor 3 was distinguished by significant amounts of aromatic species, such as xylenes + ethylbenzene (76.66%), toluene (55.36%), styrene (33.46%), and benzene (26.05%), which were representative markers for solvent usage (Liao et al 2015). Yuan et al have explored that C8 aromatics and toluene were the most abundant species for solvent usage in urban Beijing (Yuan et al 2010). Although traffic-related sources and combustion of petroleum fuel also released aromatics, factor 3 did not correlate well with traffic tracer gases (R2 = −0.70 for NO2) and combustion trace gases (R2 = 0.45 for CO and 0.39 for SO2). Besides, the T/B ratio for factor 3 was 2.52 for factor 3, which fell in the range (⩾2–3) of the sources other than traffic (Thera et al 2019). Therefore, factor 3 was designated as solvent usage. The rapid decrease of the contribution of solvent usage after sunrise was affected by greater photochemical reactions and better mixing conditions (figure 4(c)).
The profiles of factors 4 and 5 were characterized by high concentrations of OVOCs. Factor 4 featured high fractions of phenol (19.28%), hexanal (19.62%), acetone + propanal (31.77%), formaldehyde (45.37%), ethanol (37.98%), propanol (22.87%), and formic acid (74.64%), and was named as OVOC 1. It was reported that phenol and hexanal could constitute suitable markers for cooking emissions in ambient air (Klein et al 2016, Karl et al 2018). Acetone is a ubiquitous ingredient in paint thinners and avoids regulation due to its low reactivity (Harley et al 1992, McDonald et al 2018). Ethanol and isopropanol are commonly found in personal care products, cleaning agents, and alcoholic beverages (McDonald et al 2018). It was found that more than 65% of the formaldehyde output in China was used to produce resins that are mainly found in wood products, which was the major source of indoor pollution in China (Tang et al 2009). Acids are known to be widely used as disinfectants and cleaning products (Karl et al 2018, Weschler and Carslaw 2018). Thus, we believed that factor 4 was mainly a primary source including cooking, cleaning agents, personal care products, and residential solvent usage. The factor contributed more in the daytime than nighttime, which matched the human activities (figure 4(d)).
Factor 5 was identified as OVOC 2 with a predominance of several OVOCs as well, including MVK + MACR (58.81%), acetic acid (40.09%), acetaldehyde (28.82%) and acrolein (29.20%), which can be derived from the oxidation of primary species. MVK + MACR is known to be the primary oxidation product of isoprene from photochemical reactions (Starn et al 1998). The emission of this factor had a significant increase after sunrise and remained at a high level. Besides, air mass back-trajectory cluster analysis showed that high contribution of OVOC 1 was related to specific clusters (cluster 2 and cluster 3), while the relative contribution of OVOC 2 remained similar under the control of different air masses (figure 2). Therefore, factors 4 and 5 might represent the OVOCs derived from primary emission and secondary formation, respectively.
Factor 6 had a high percentage of isoprene, the typical indicator for vegetation sources (Drewniak et al 2014, Wu et al 2016), with more than 70% of its concentration explained by this factor. The diurnal profile exhibited a broad peak between 9:00 LT and 15:00 LT (figure 4(f)), conforming to the emission pattern of plants (Guenther et al 1993), hence it was considered to be biogenic.
Factor 7 contained low reactive VOCs (<5%) and high inert species, such as acetonitrile (73.13%). Although acetonitrile is the marker for biomass burning, other species that are known to exist in biomass burning exhaust (acetone, acetaldehyde, acetic acid, methanol, isoprene, MEK, MVK + MACR) did not make great contributions in this factor (Li et al 2017). Thus, factor 7 was considered to be background + long-lived. The source contribution remained stable in the daytime and higher levels were observed at nighttime due to the poor dispersion and dilution conditions (figure 4(g)).
3.4. The impact of the Beijing resurgence of COVID-19
According to the evolution of the outbreak, the research period was divided into two subperiods: Beijing resurgence (11 June 2020–6 July 2020) and after Beijing resurgence (7–30 July 2020) (figure S1). Detailed dynamic variations of various emission sources based on high temporal-resolution source apportionment results were captured, as shown in figures 4 and S6. The averaged contributions of the VOC sources are presented in table S3. The VOC emission structure underwent a few changes due to the 'stay at home' tendency. The contribution of vehicle + fuel towards the VOC concentration in the Beijing resurgence period was 34.47 ± 1.90% lower than that afterwards. Besides, the morning peak was weakened due to limited traffic activities (figure 4(a)). Compared with that during the new outbreak, the contribution of vehicle + fuel at 9:00 am increased by 73.08% after the Beijing resurgence. In table S2, PMF-based source apportionment research carried out in Beijing recently are summarized. Decreasing trends in the relative contribution of vehicle-related sources in recent years have largely been attributed to the emission standard with more strict controls of exhaust and evaporation emissions from automobiles. And the relatively low contribution of vehicle + fuel for the current work was largely due to the pandemic. Our results proved that the reductions in traffic flow could effectively reduce VOC emission intensity and change the emission pattern in the transportation sectors as well, in addition to the implementation of more strict emission standards.
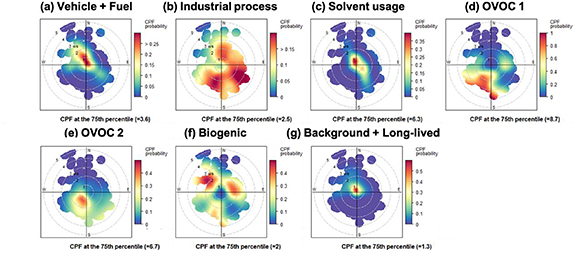
Furthermore, our study demonstrated that OVOC originated from both primary emission and secondary formation were the vital VOC sources in urban areas, with an average contribution of 46.98% in Beijing in the summer. The contribution of OVOC-related sources in the present study is slightly lower than that reported in Beijing in winter 2017 (54.6%) (Wang et al 2021). As discussed in section 3.3, OVOC 1 likely represented the primary OVOC emission, which were common in everyday household products (Harley et al 1992). The CBPF plots of OVOC 1 show a clear SW direction where Haidian, the busiest district with high population density in Beijing, were located (figure 5(d)). The relative contribution for OVOC 1 dropped from 30.83 ± 13.73% during the Beijing resurgence to 21.45 ± 14.70% afterwards, while the diurnal variation remained parallel (figure 4(d)). The possible explanation for the decline is that more disinfection practices, including hand washing and surface cleaning, were used to minimize virus transmission during the resurgence (Hora et al 2020). It was reported that multiple VOCs were emitted from pandemic products which were used frequently and extensively during COVID-19 (Steinemann et al 2021). According to the Diagnosis and Treatment Plan for Pneumonia Infected by New Coronavirus issued by National Health Commission of the People's Republic of China, 75% ethanol, chlorine-containing disinfectants, and peracetic acid can effectively inactivate viruses and were the main disinfection products used during the pandemic in China (NHC 2020). Besides, a retrospective cohort study conducted in Beijing families reported that ethanol or chlorine-based disinfectants are widely used for cleaning the house, including to disinfect the floor, door and window handles, indoor air, tables and toilets (Wang et al 2020a). In the current study, the emission ratios (ERs) of ethanol and acetic acid relative to CO, which are widely used as disinfectants (Weschler and Carslaw 2018), decreased by 1.08 ppb ppm−1 CO and 3.98 ppb ppm−1 CO, respectively, from partial lockdown to relaxed lockdown. Thus, we deduced that more disinfection practices during the Beijing resurgence might lead to the increased contribution of the primary OVOC source. As COVID-19 has become a persistent threat, routine and thorough disinfection will continue to evolve in daily life, which in turn poses challenges in mitigating VOC and related secondary pollution.
Figure 5. CBPF plots for the six factors resolved from PMF.
Download figure:
Standard image High-resolution image
The variation in the relative contribution of background + long-lived sources might relate to the poor mixing conditions after the Beijing resurgence with the mean wind speed decreased from 1.36 to 1.13 m s−1 (figure 4(g)). In addition, no significant changes were observed in the relative contributions and diurnal variations of other VOC emission sources.
4. Conclusion
Continuous VOC measurement was carried out in urban Beijing using PTR-ToF-MS. A second outbreak of COVID-19 occurred in Beijing during the observation period. The concentrations of anthropogenic VOCs were lower than during the same period in previous years due to the pandemic and active emission reduction management. O3 pollution episodes were frequently observed during the observation period, and VOCs presented higher mixing ratios and faster consumption rates in the daytime on high-O3 days. Refined dynamic source apportionment results based on the receptor model show that the growing emission of primary OVOCs, which might originate from disinfection activities, has counterbalanced the decreased emission from traffic activities due to the 'stay at home' tendency during the Beijing resurgence of COVID-19. Under the trends of regular epidemic prevention and control measures, the synergetic abatement of VOCs and NOx emission is still faced with grave challenges. To break through the bottleneck of VOC emission reduction, in addition to the traditional sources (e.g. vehicle and industry), the VOC emission embodied in volatile chemical products, especially pandemic products, should get more attention.
Acknowledgments
This work was supported by the National Natural Science Foundation of China (No. 41822505, 42061130213), the Royal Society of the United Kingdom through a Newton Advanced Fellowship (NAF\R1\201166), and the Tsinghua University Initiative Scientific Research Program. H M is supported by the National Natural Science Foundation of China (No. 52100117) and National Engineering Laboratory for Mobile Source Emission Control Technology (NELMS2019A08).
Data availability statement
All data that support the findings of this study are included within the article (and any supplementary files).