
Public Opinions on COVID-19 Vaccines—A Spatiotemporal Perspective on Races and Topics Using a Bayesian-Based Method

 , , , , , and
Abstract
:1. Introduction
2. Literature Review
2.1. Using Social Media to Analyze Opinions for Public Events
2.2. Public Opinions toward COVID-19 Vaccinations
2.3. Previous Studies on Public Opinion towards COVID-19 Vaccine
3. Data
3.1. Social Media Data
3.2. States Demographics
3.3. Race Distribution for the Last Names
3.4. COVID-19 Case Data
3.5. COVID-19 Vaccination Data
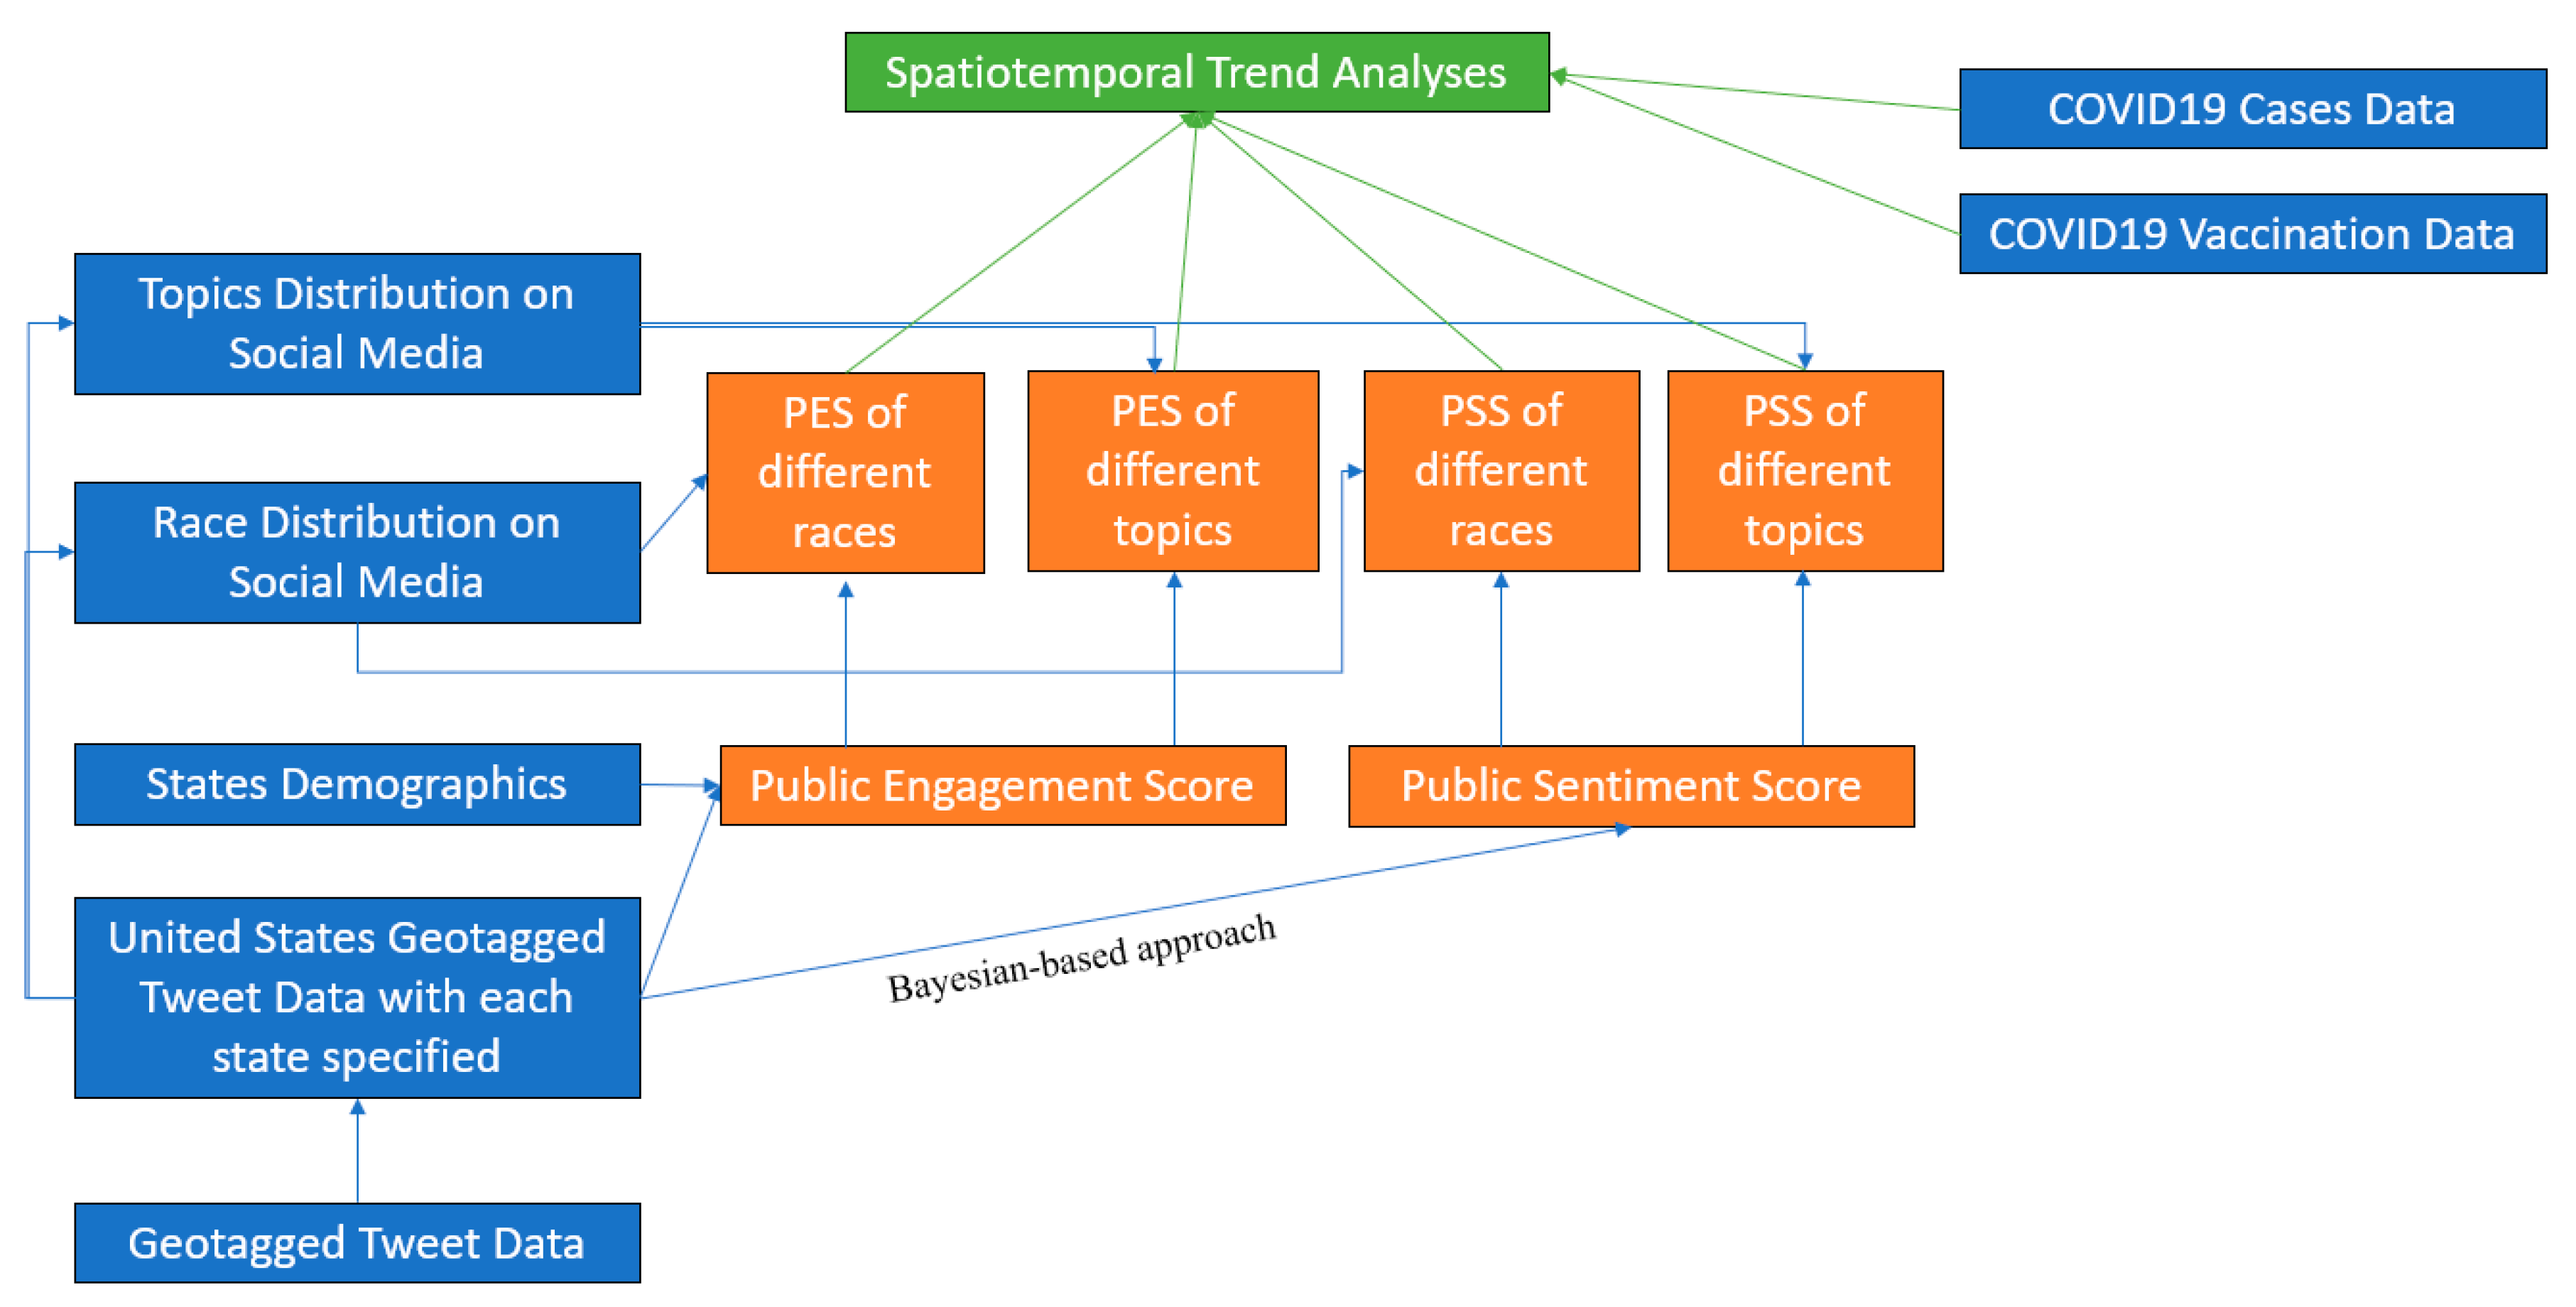
4. Methodology
4.1. Public Engagement Score
4.2. Public Sentiment Score
4.3. Topic Analysis
4.4. Race Analysis
5. Result and Discussion
5.1. National Analysis
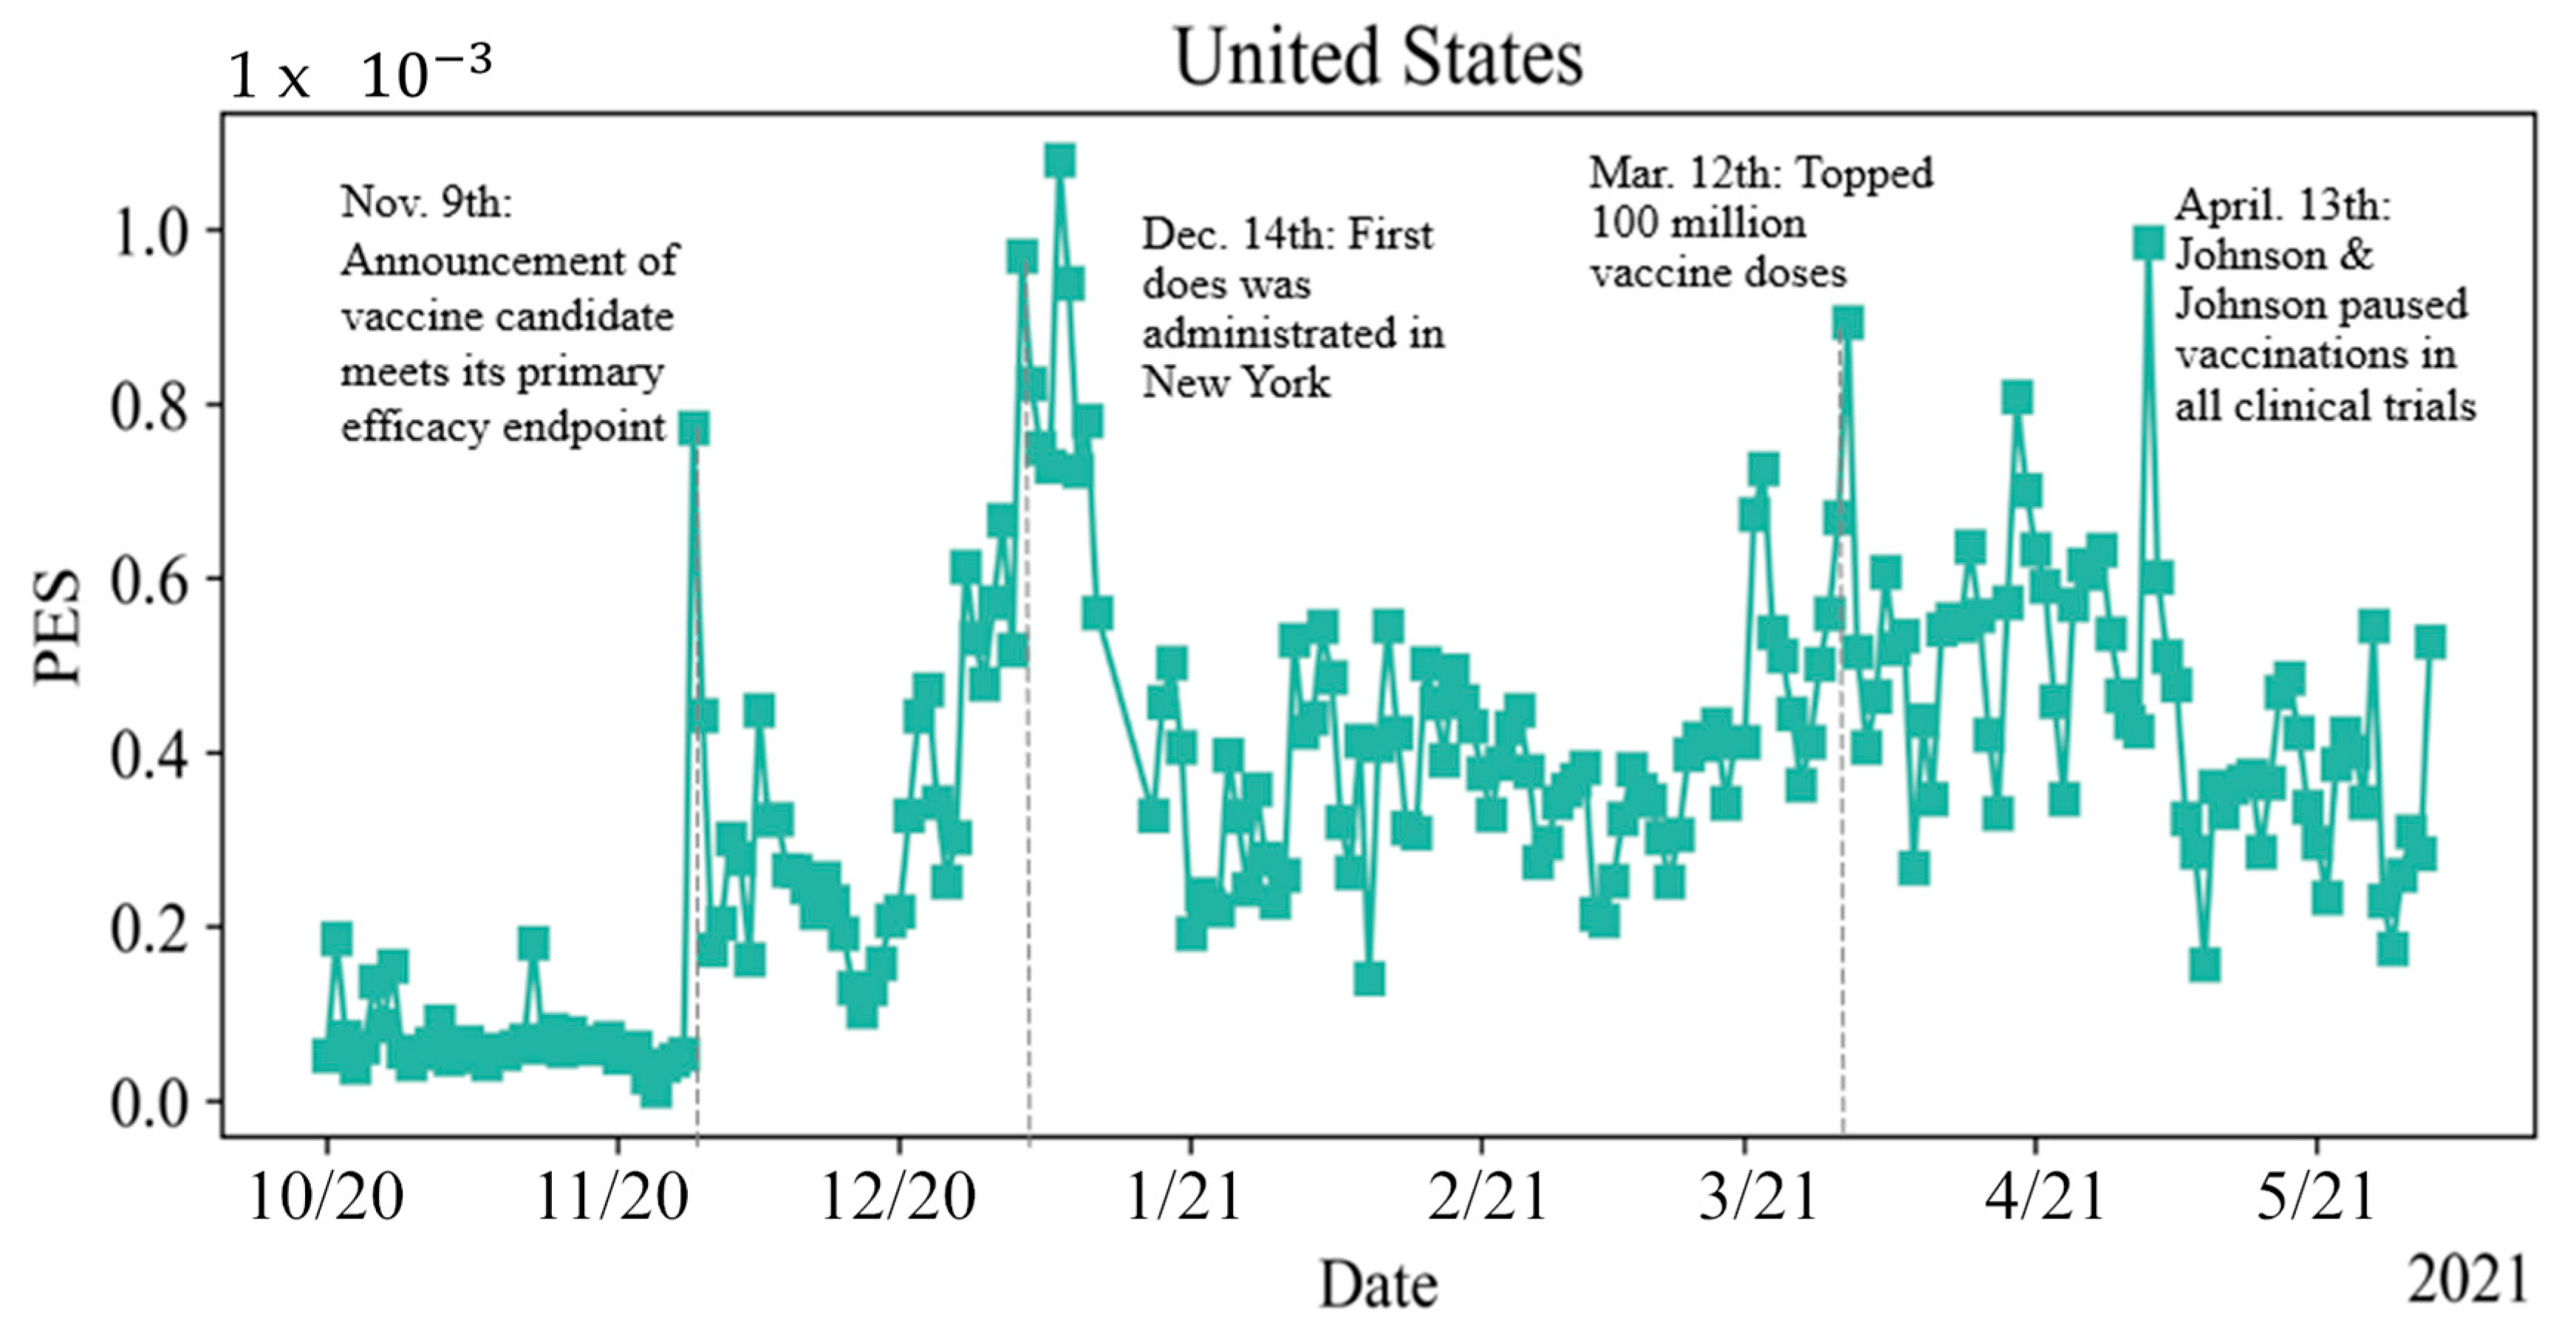
5.1.1. National PES
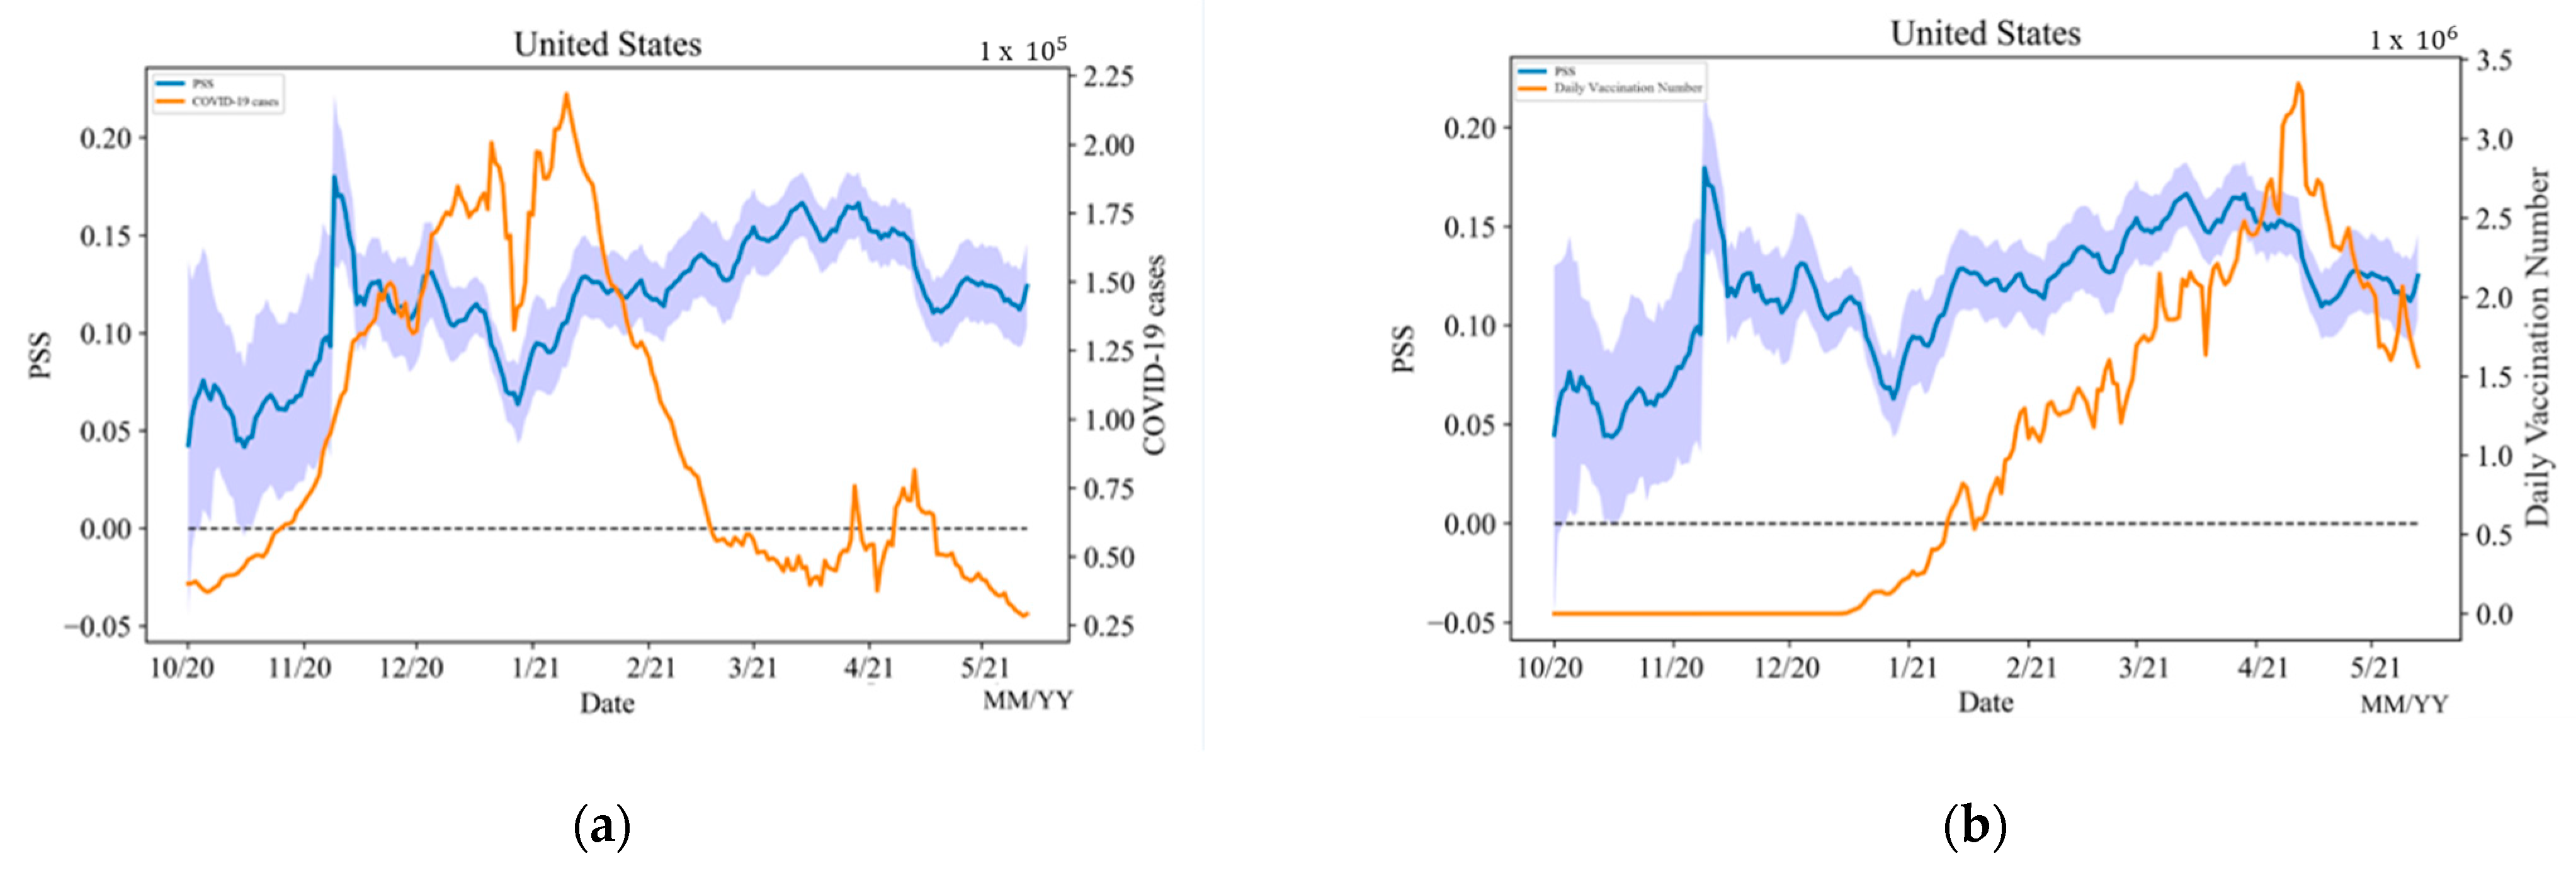
5.1.2. National PSS
5.2. State Analysis
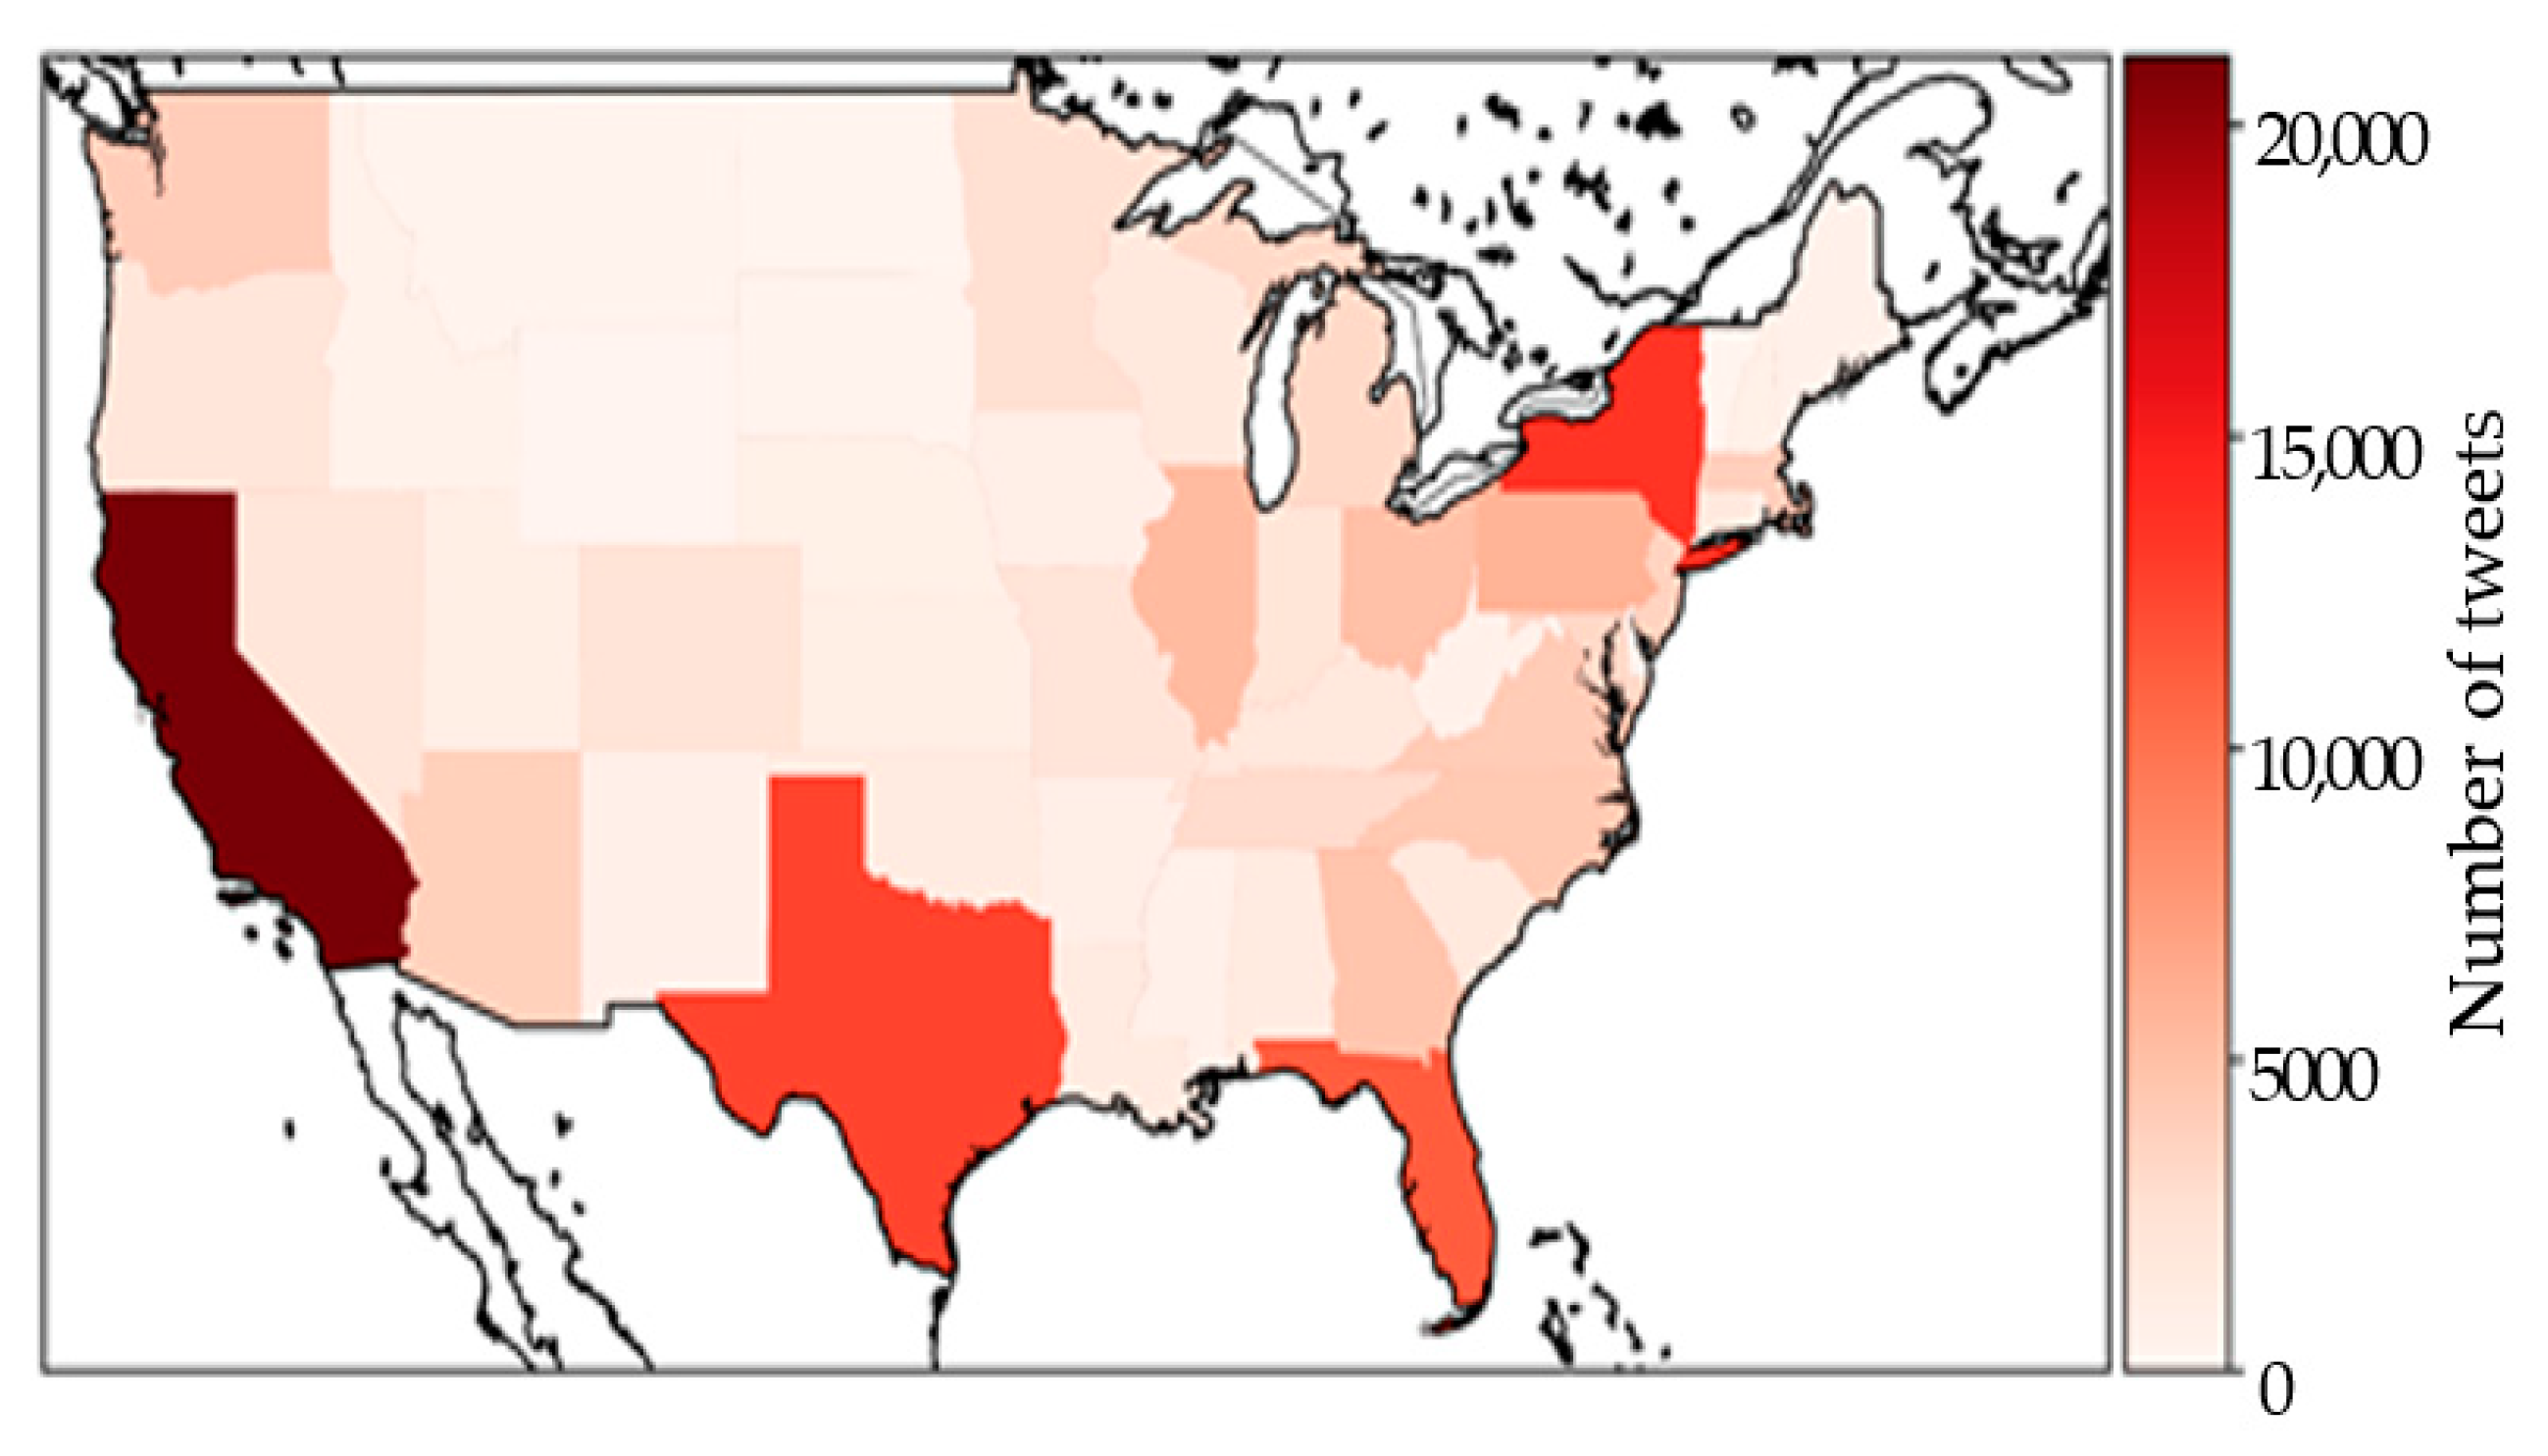
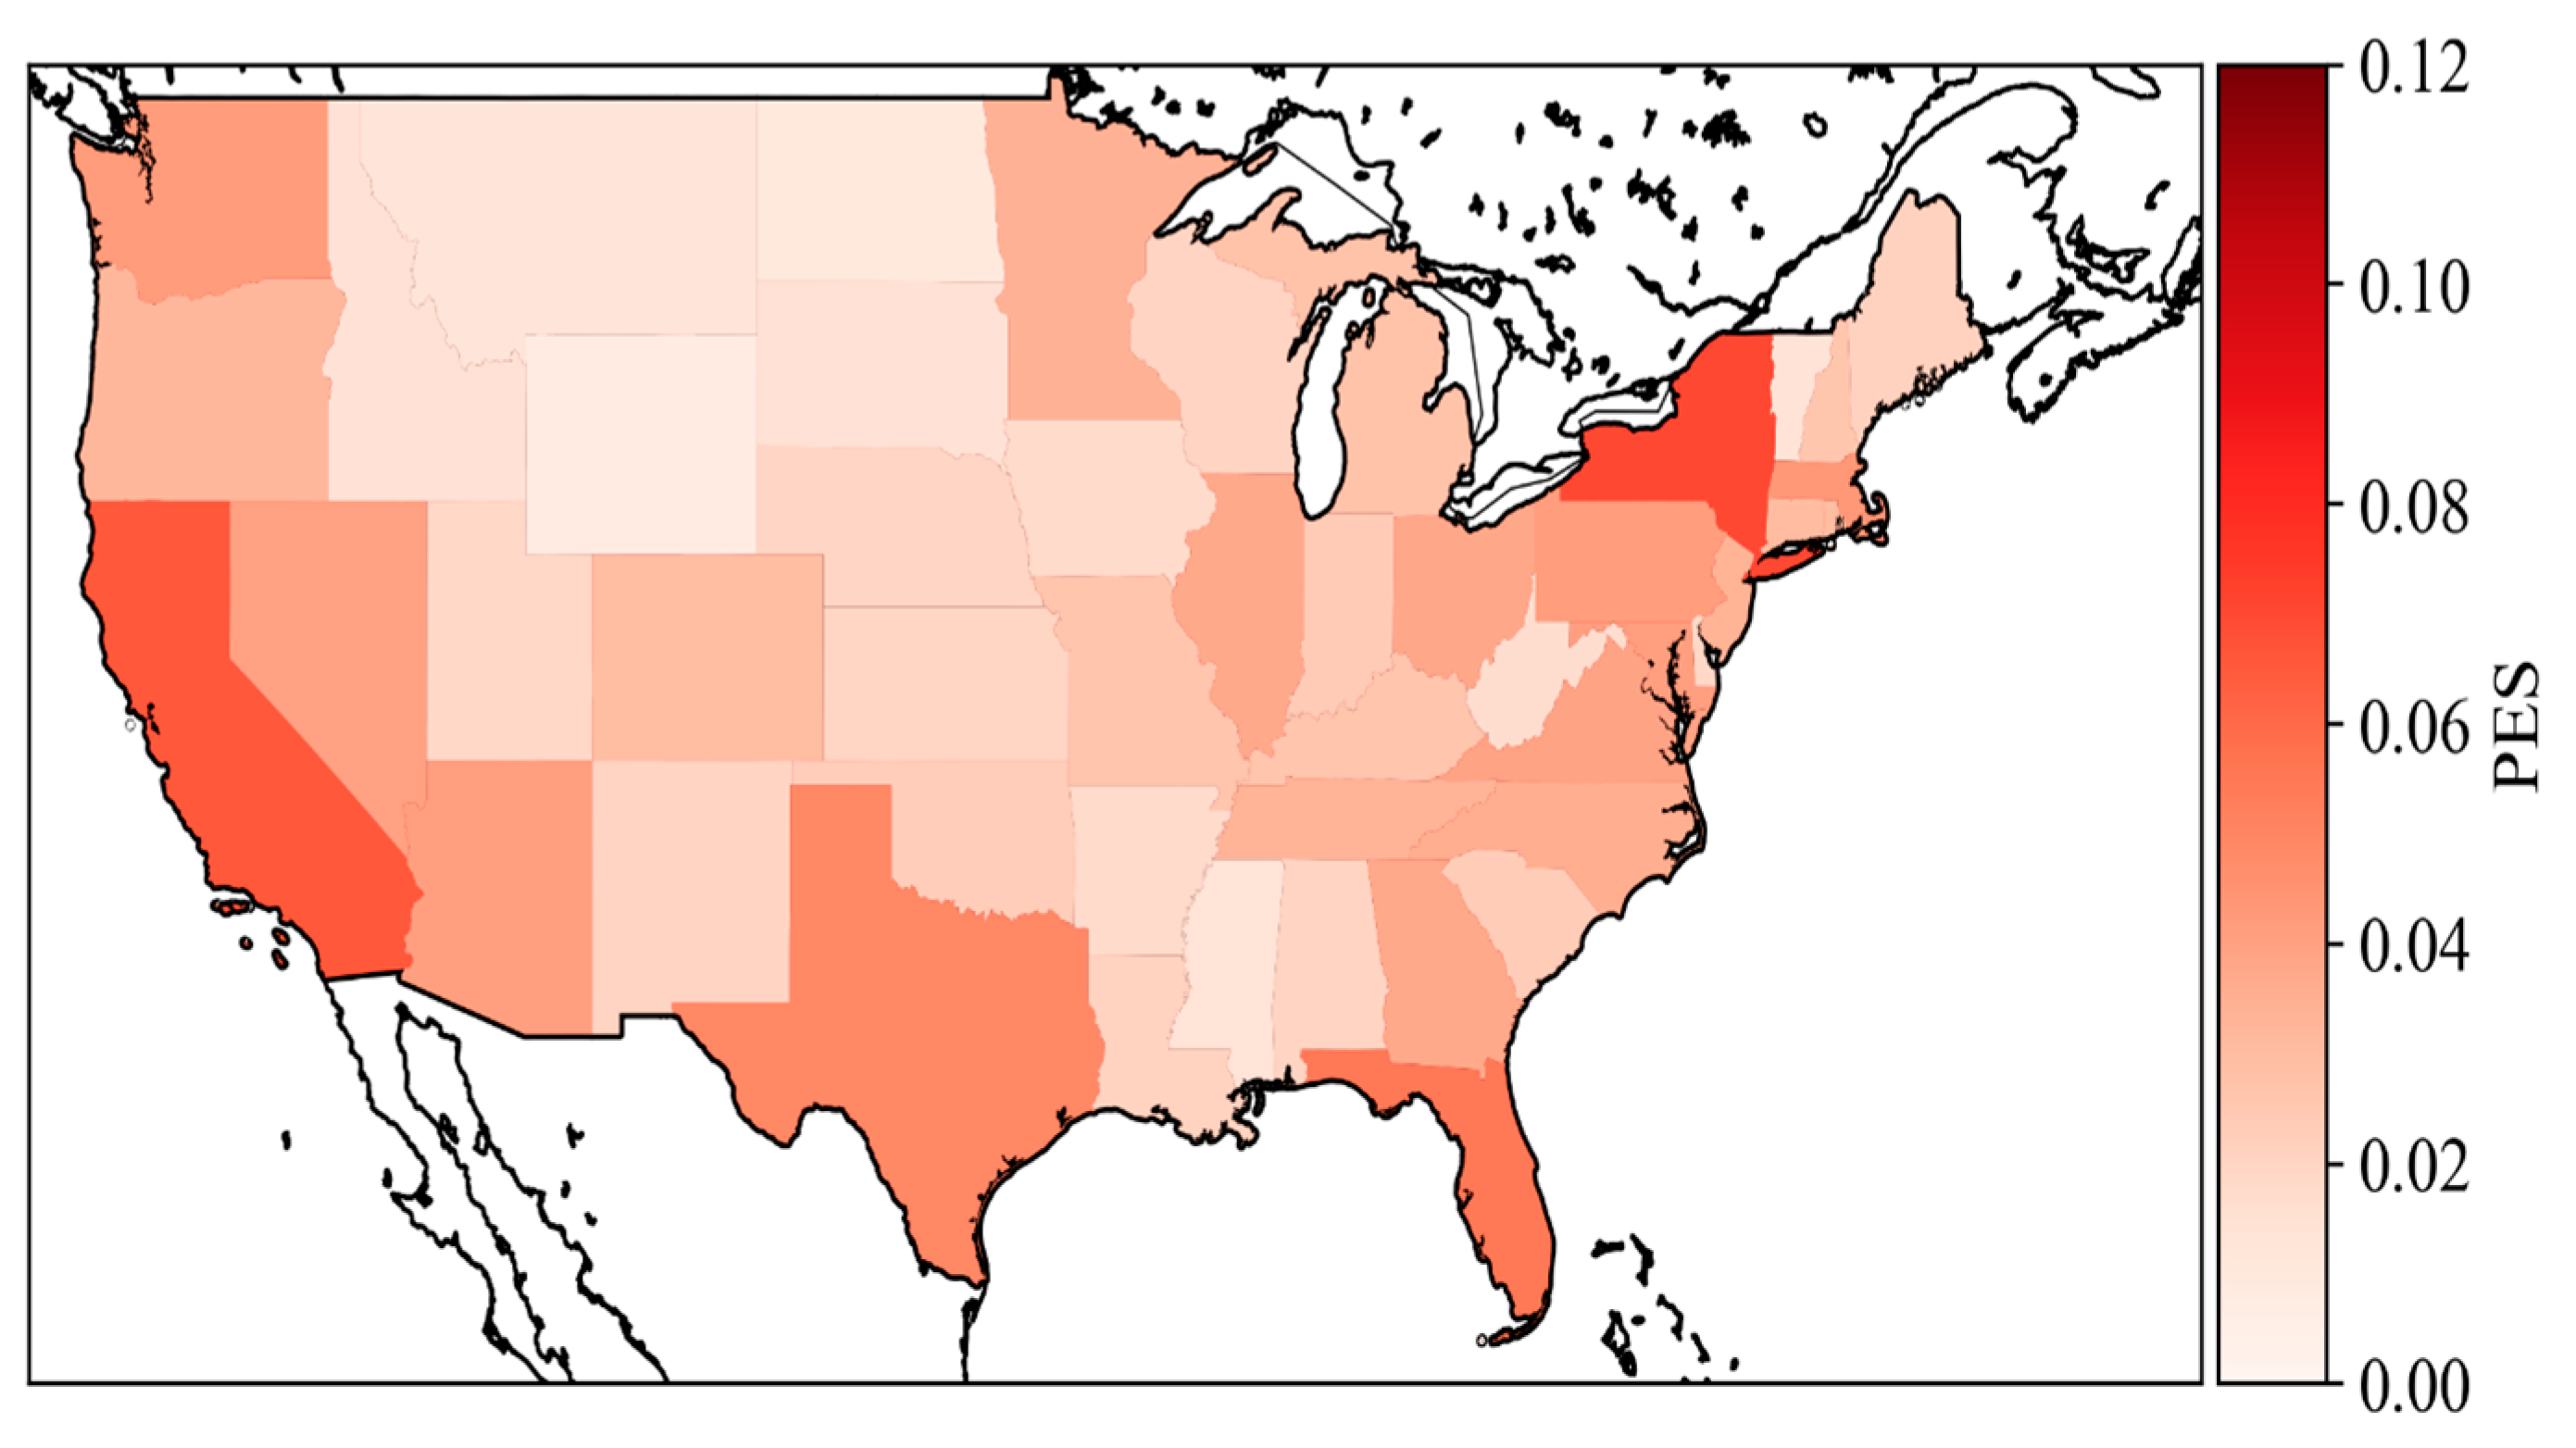
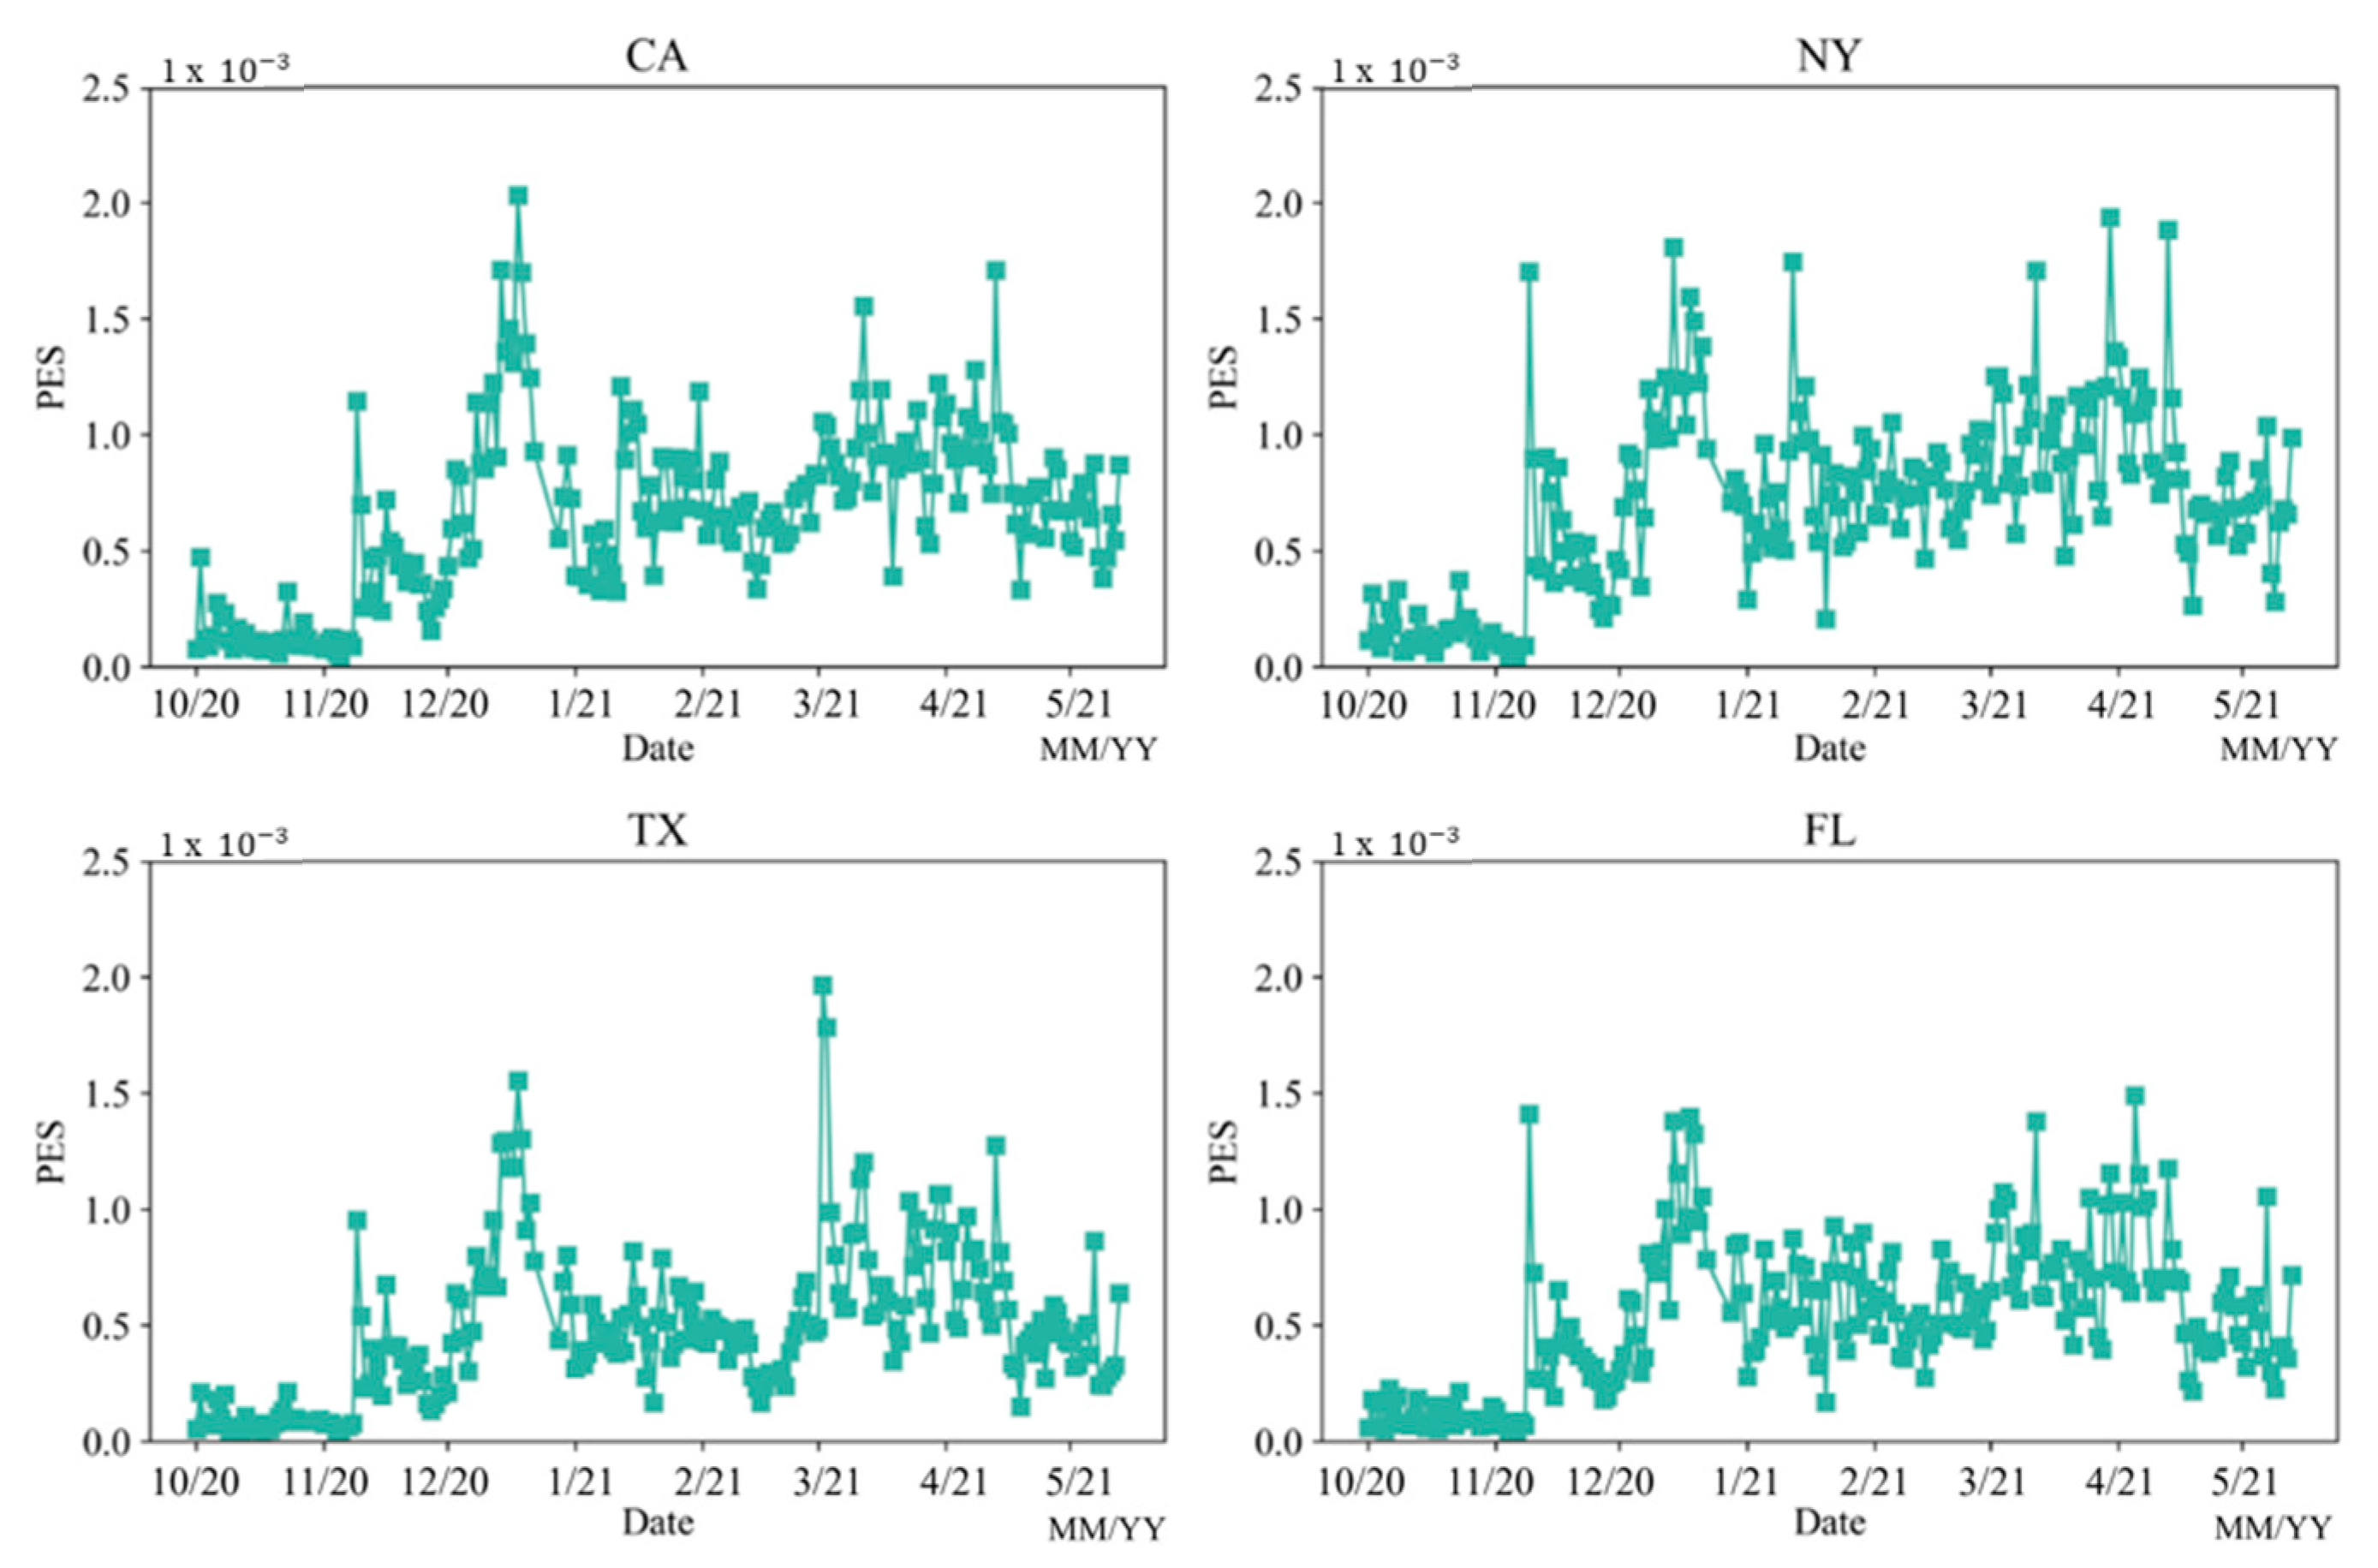
5.2.1. State PES
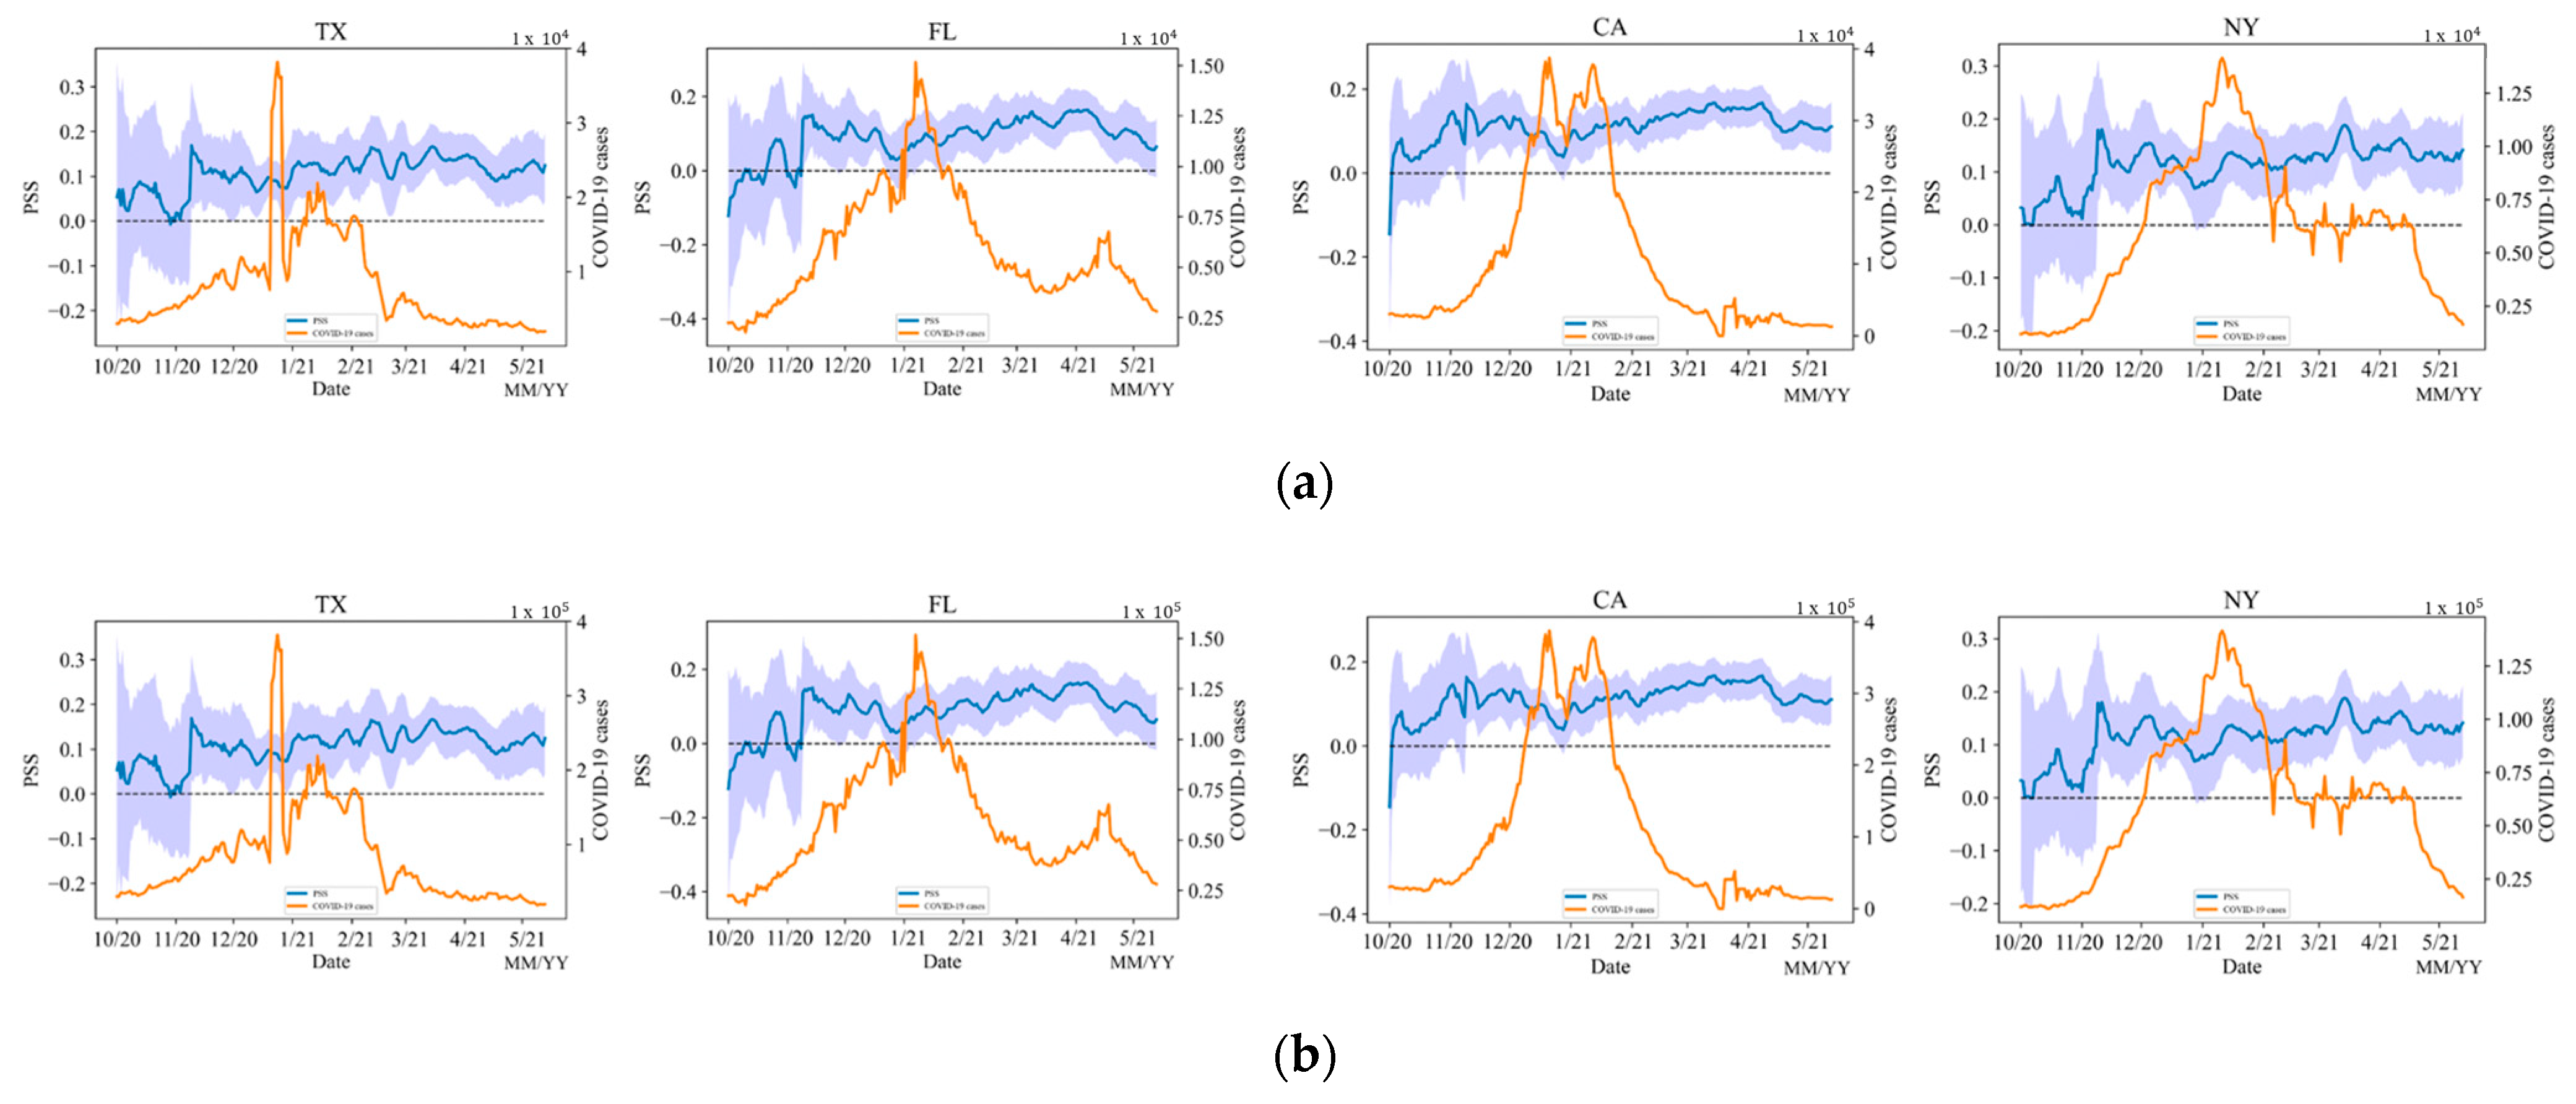
5.2.2. State PSS
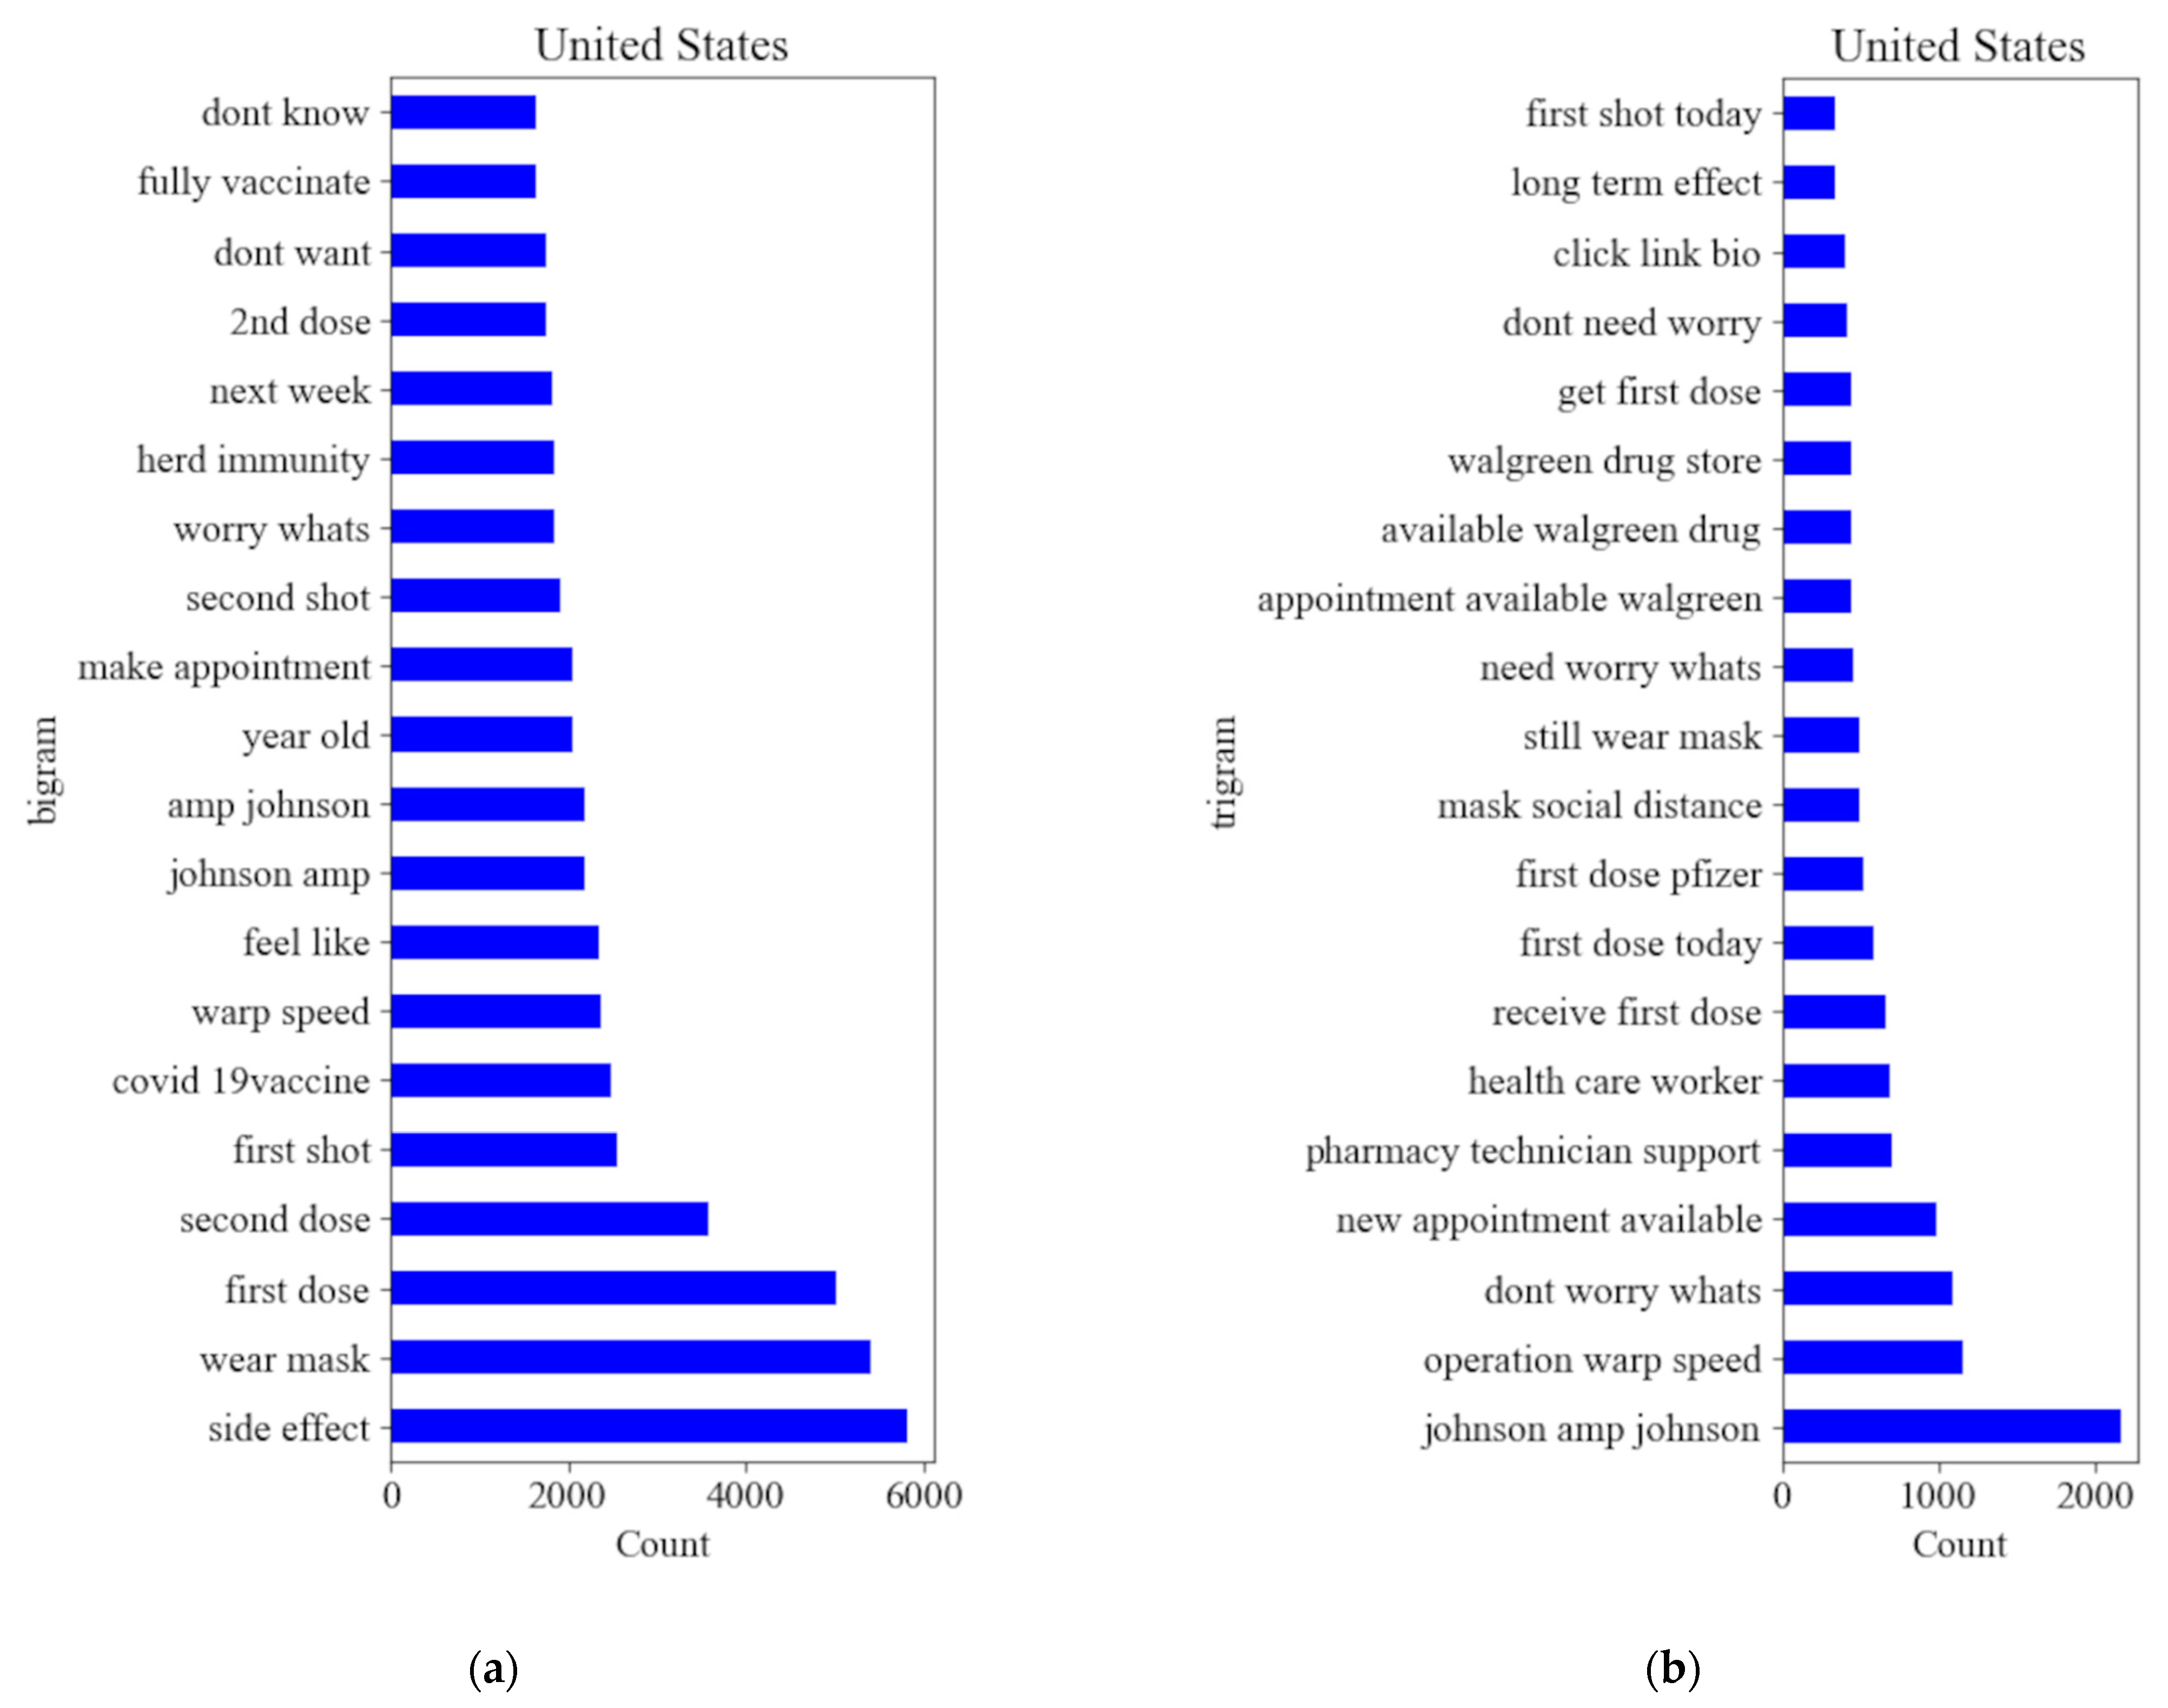
5.3. Selected Topics Analysis
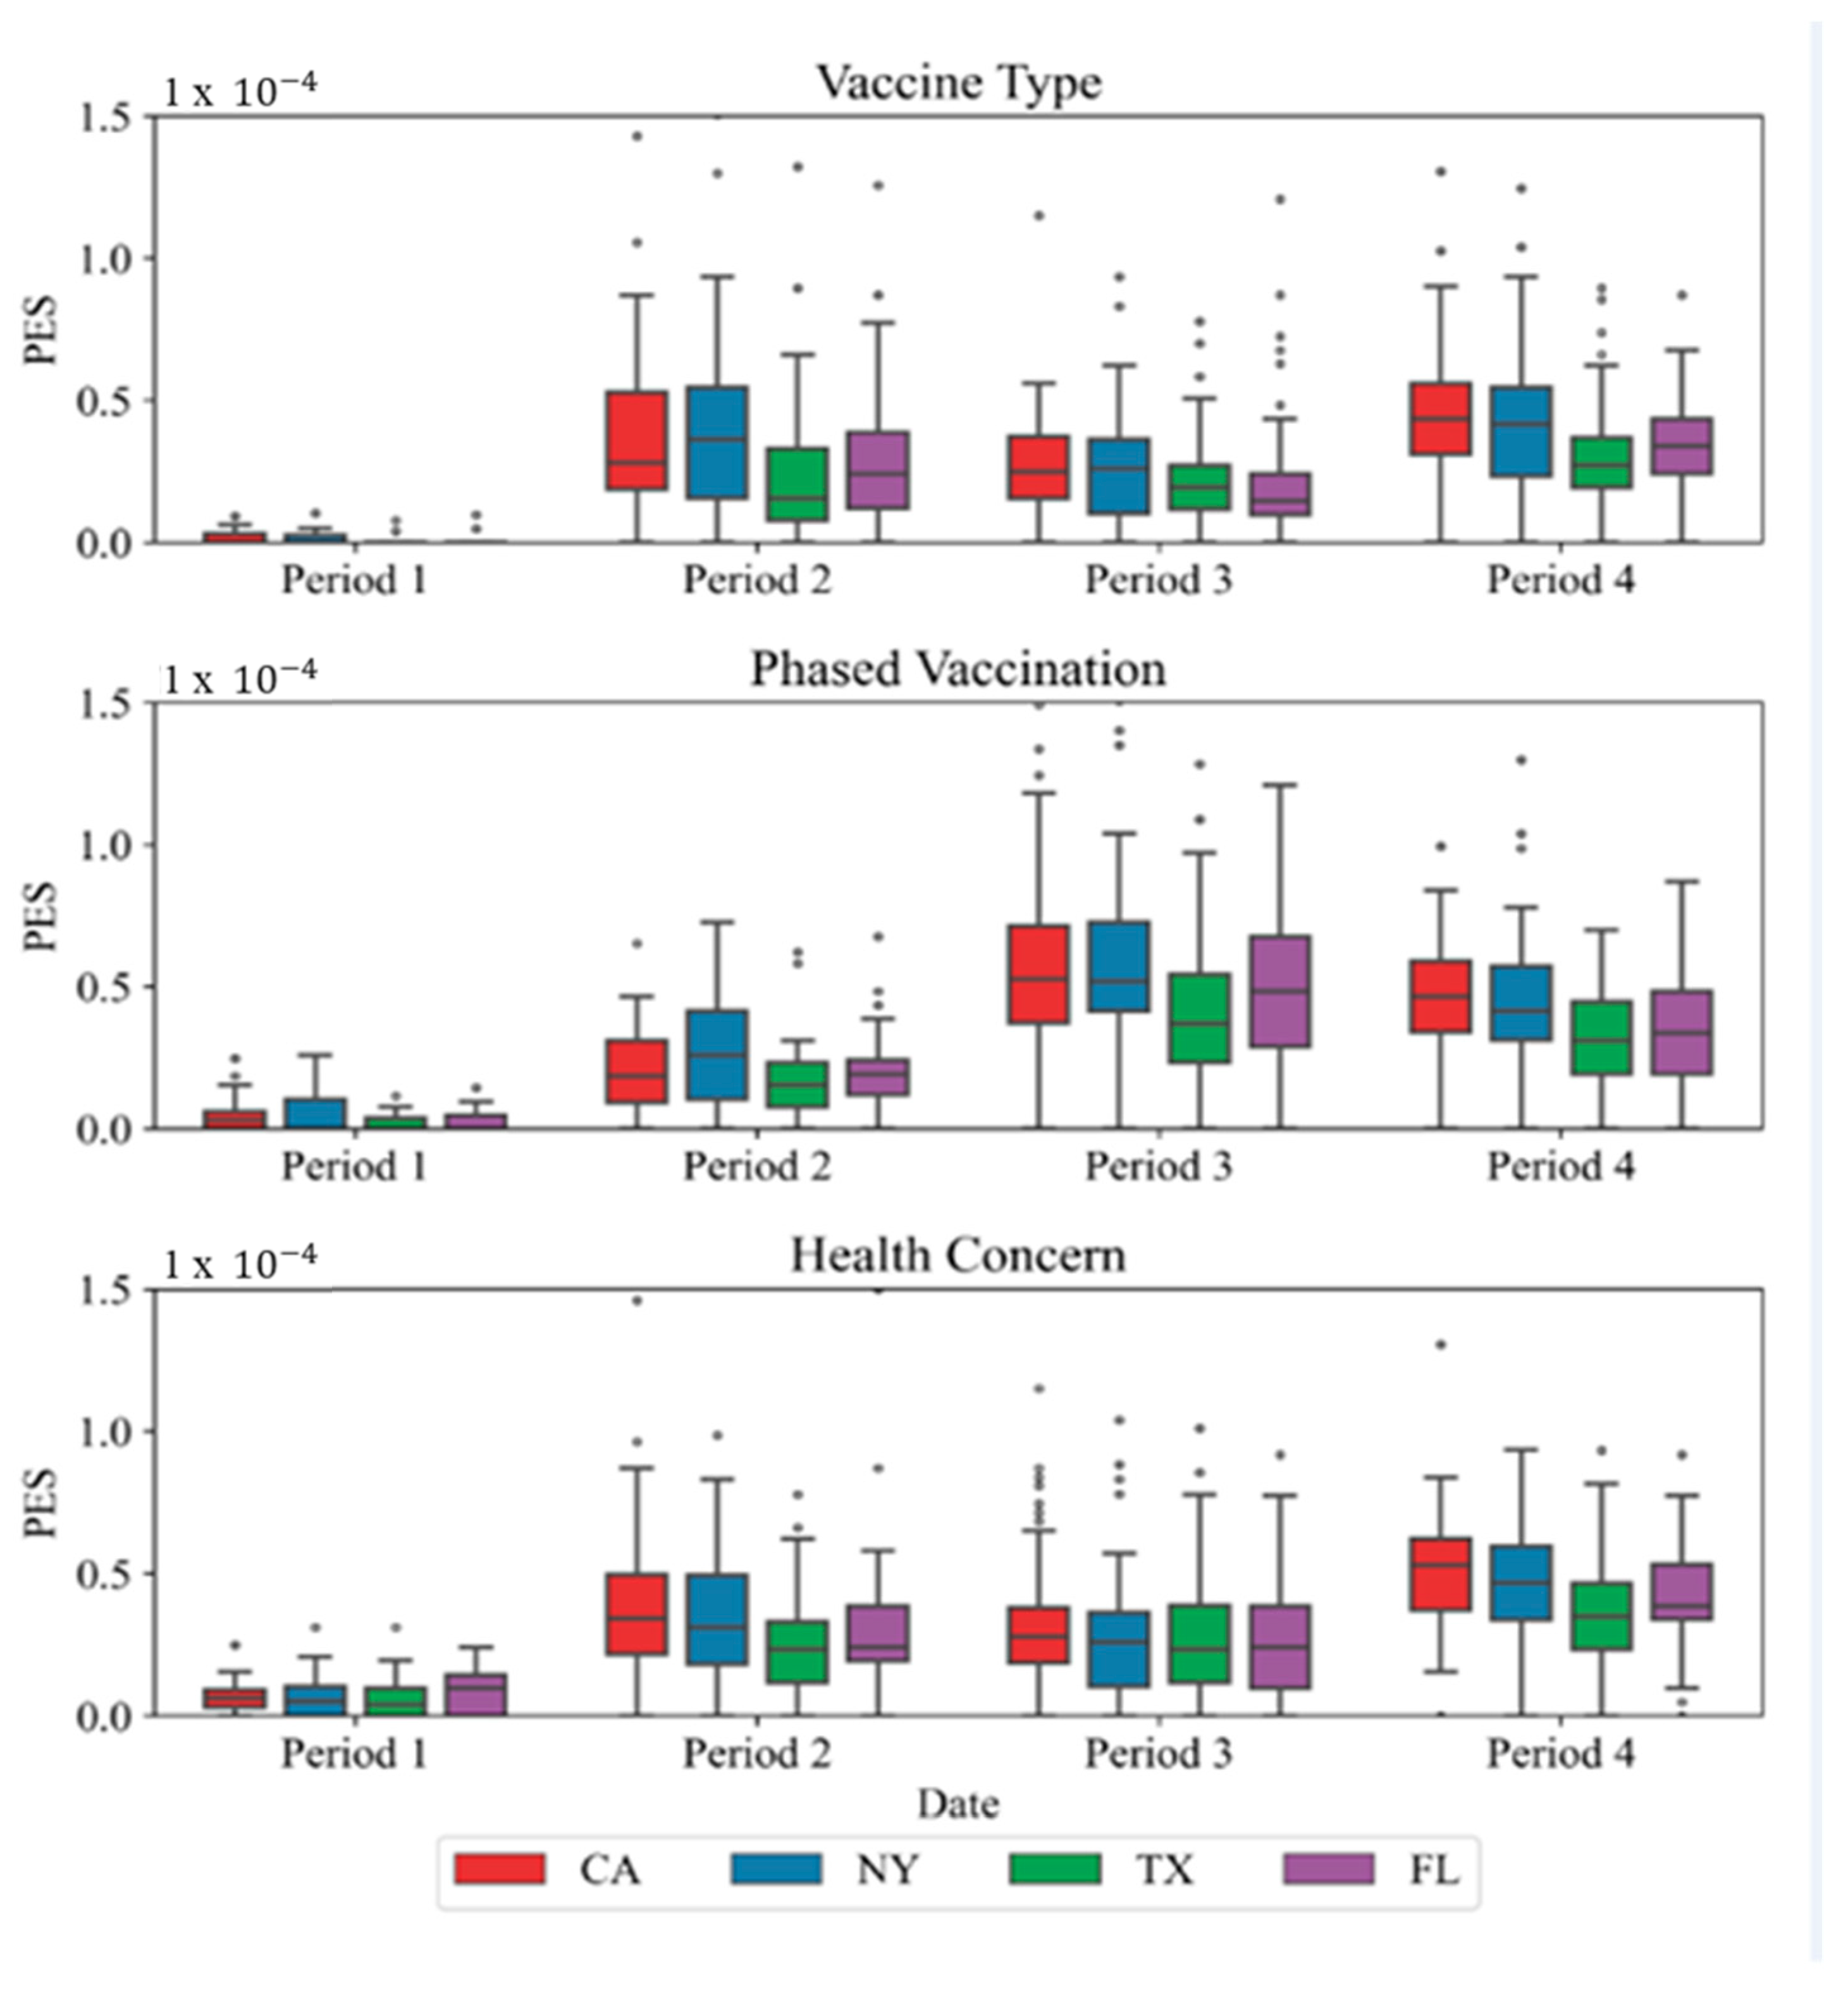
5.3.1. PES Analysis
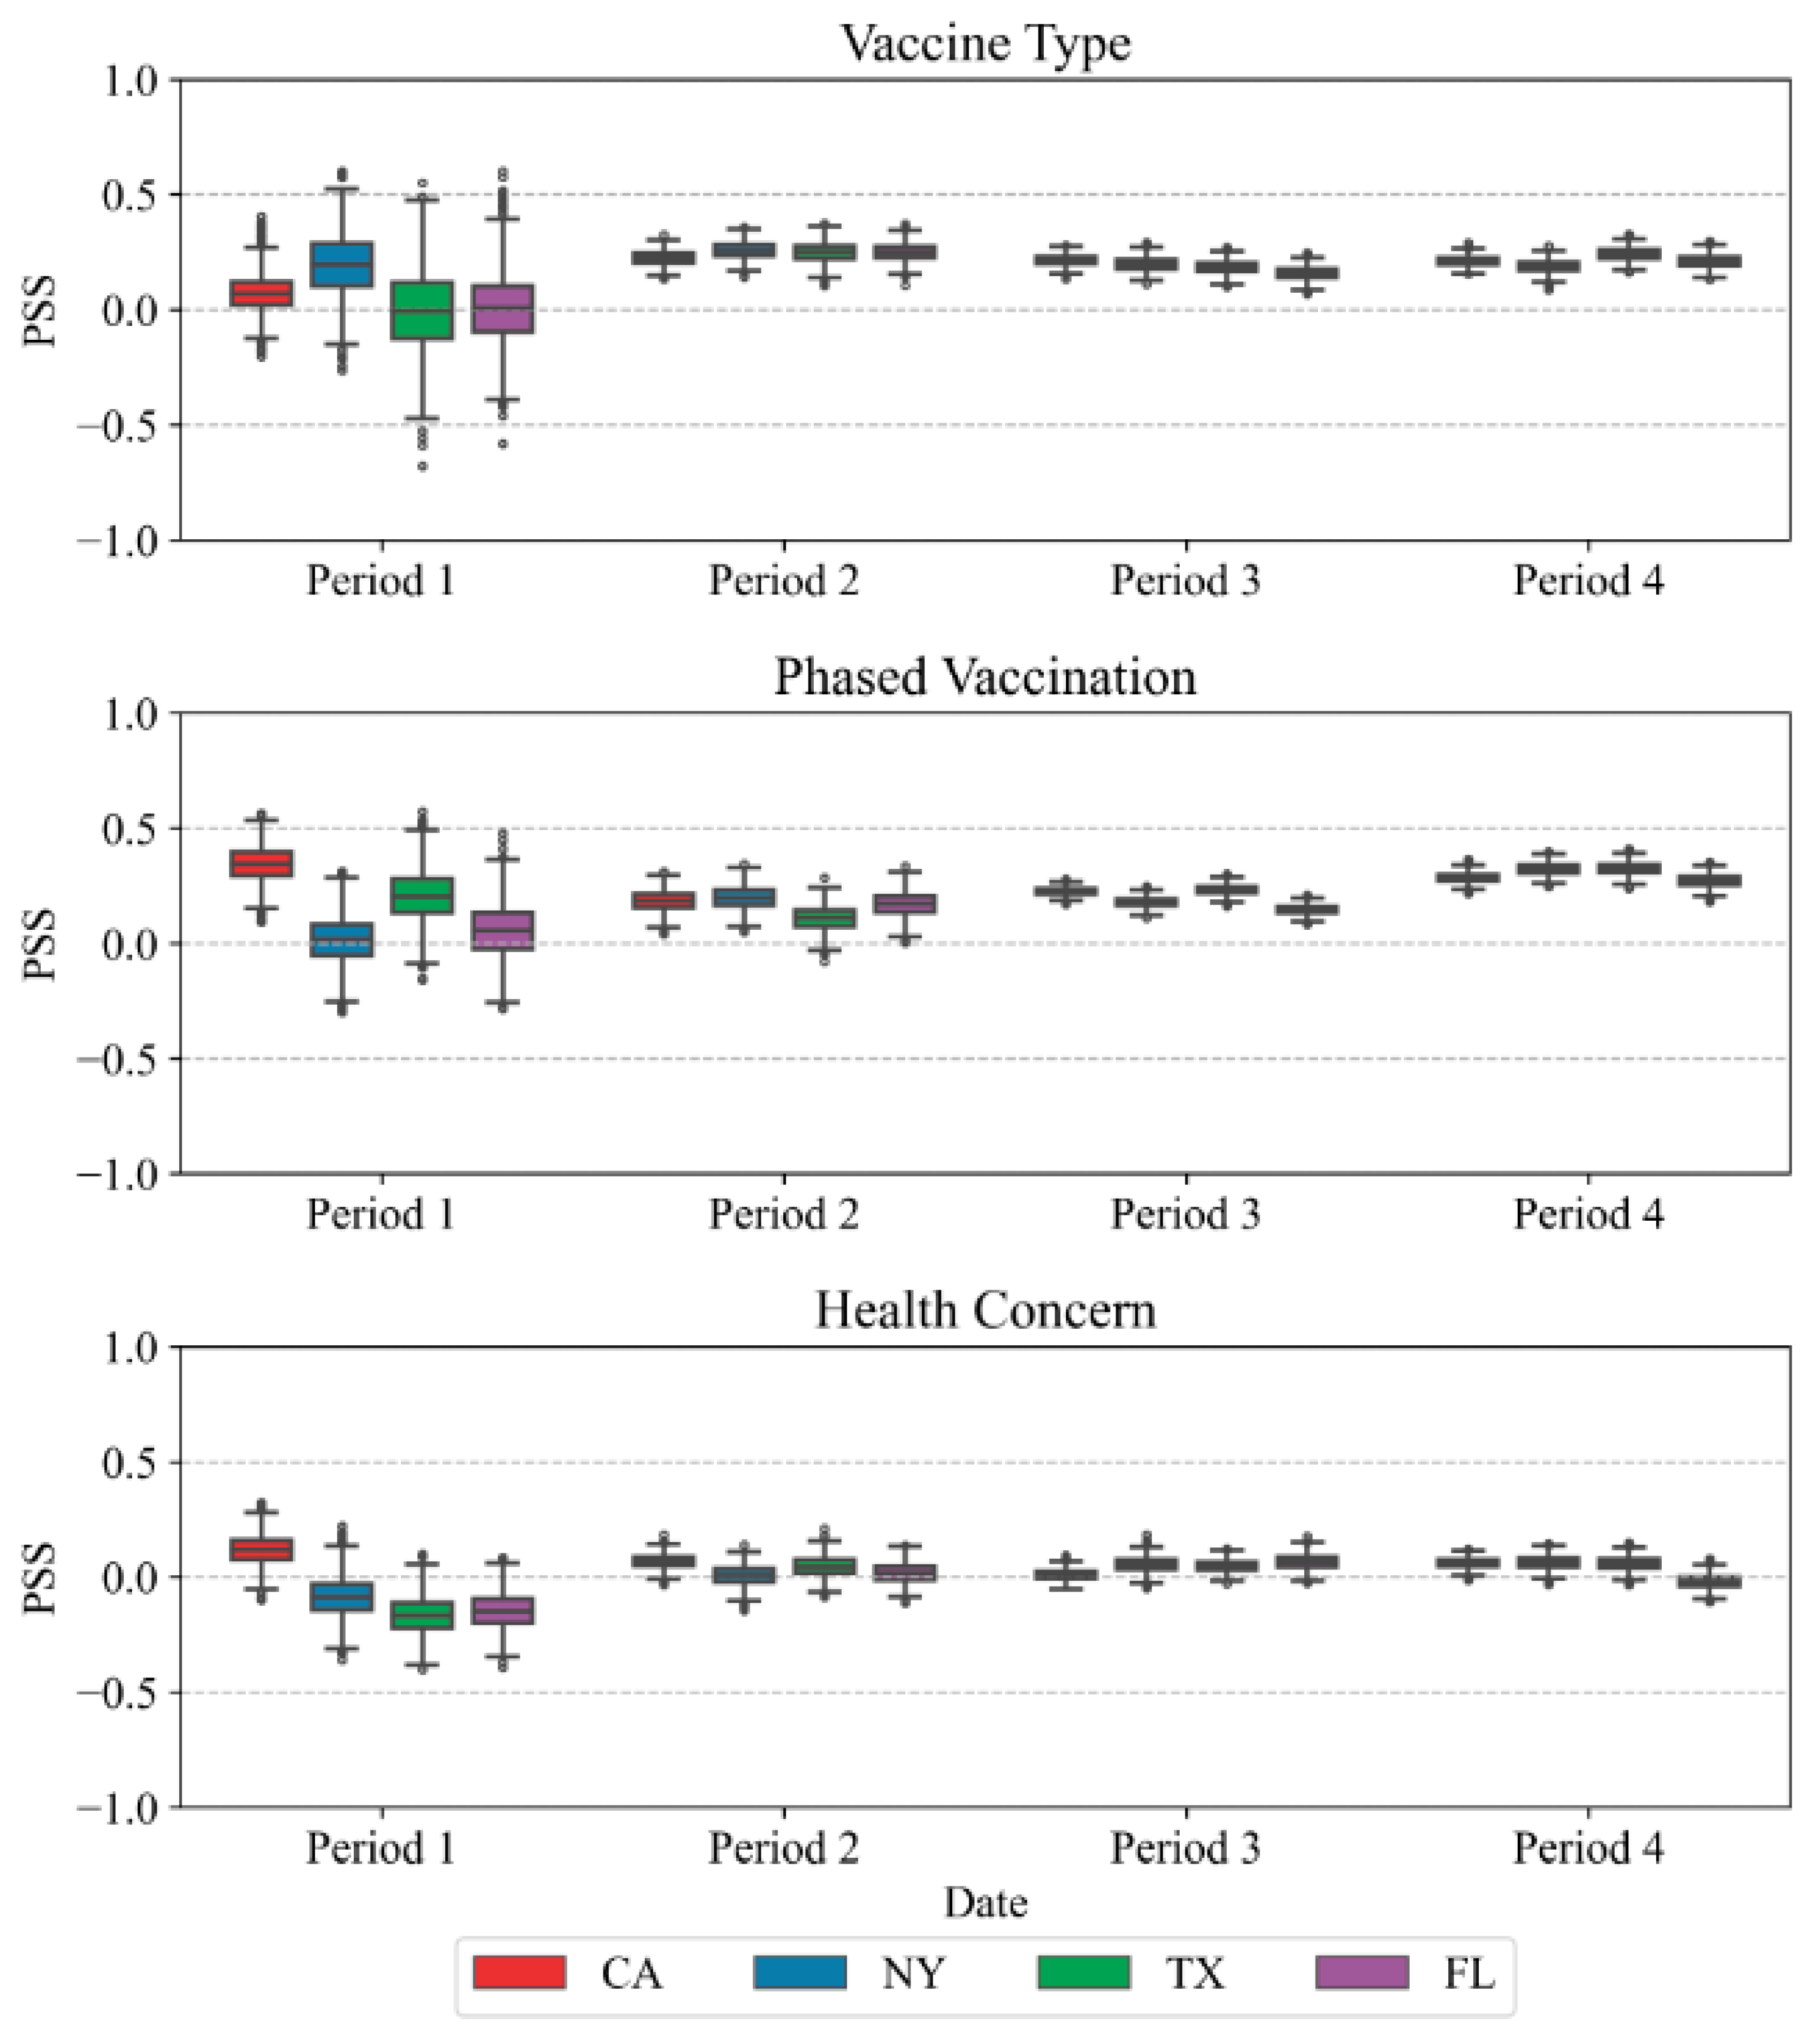
5.3.2. PSS Analysis
5.4. Race Distribution Analysis
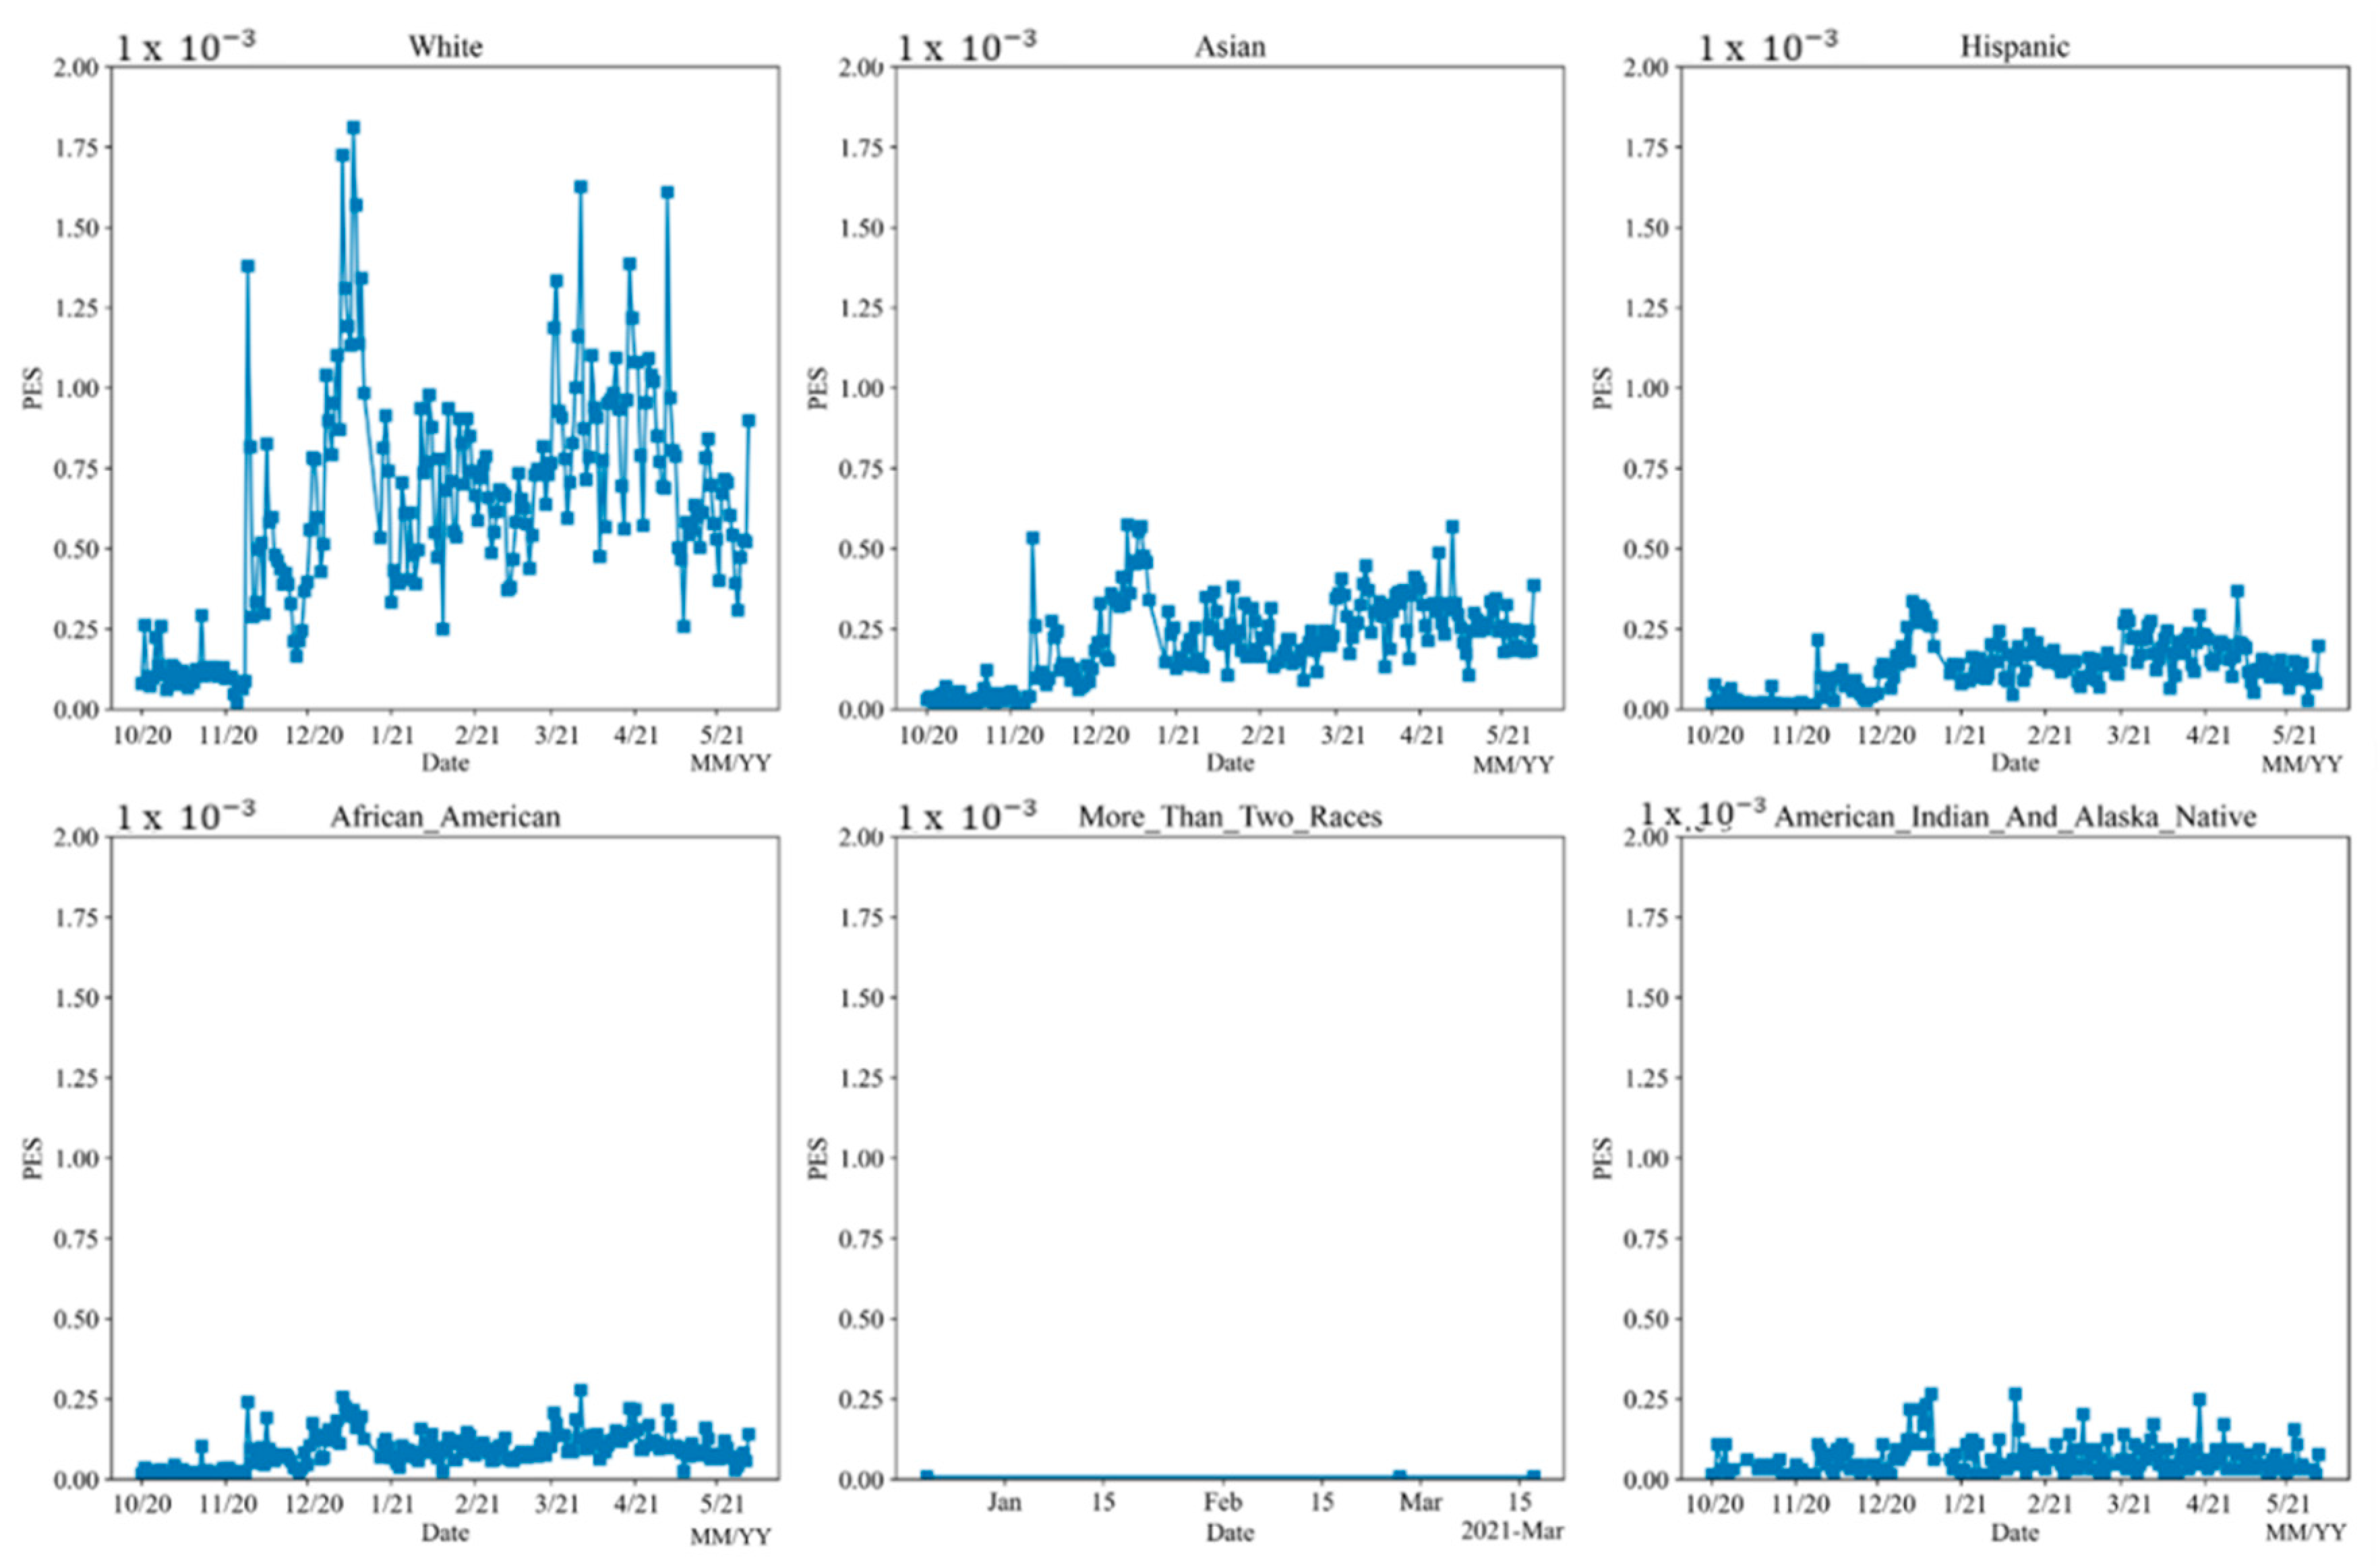
5.4.1. PES
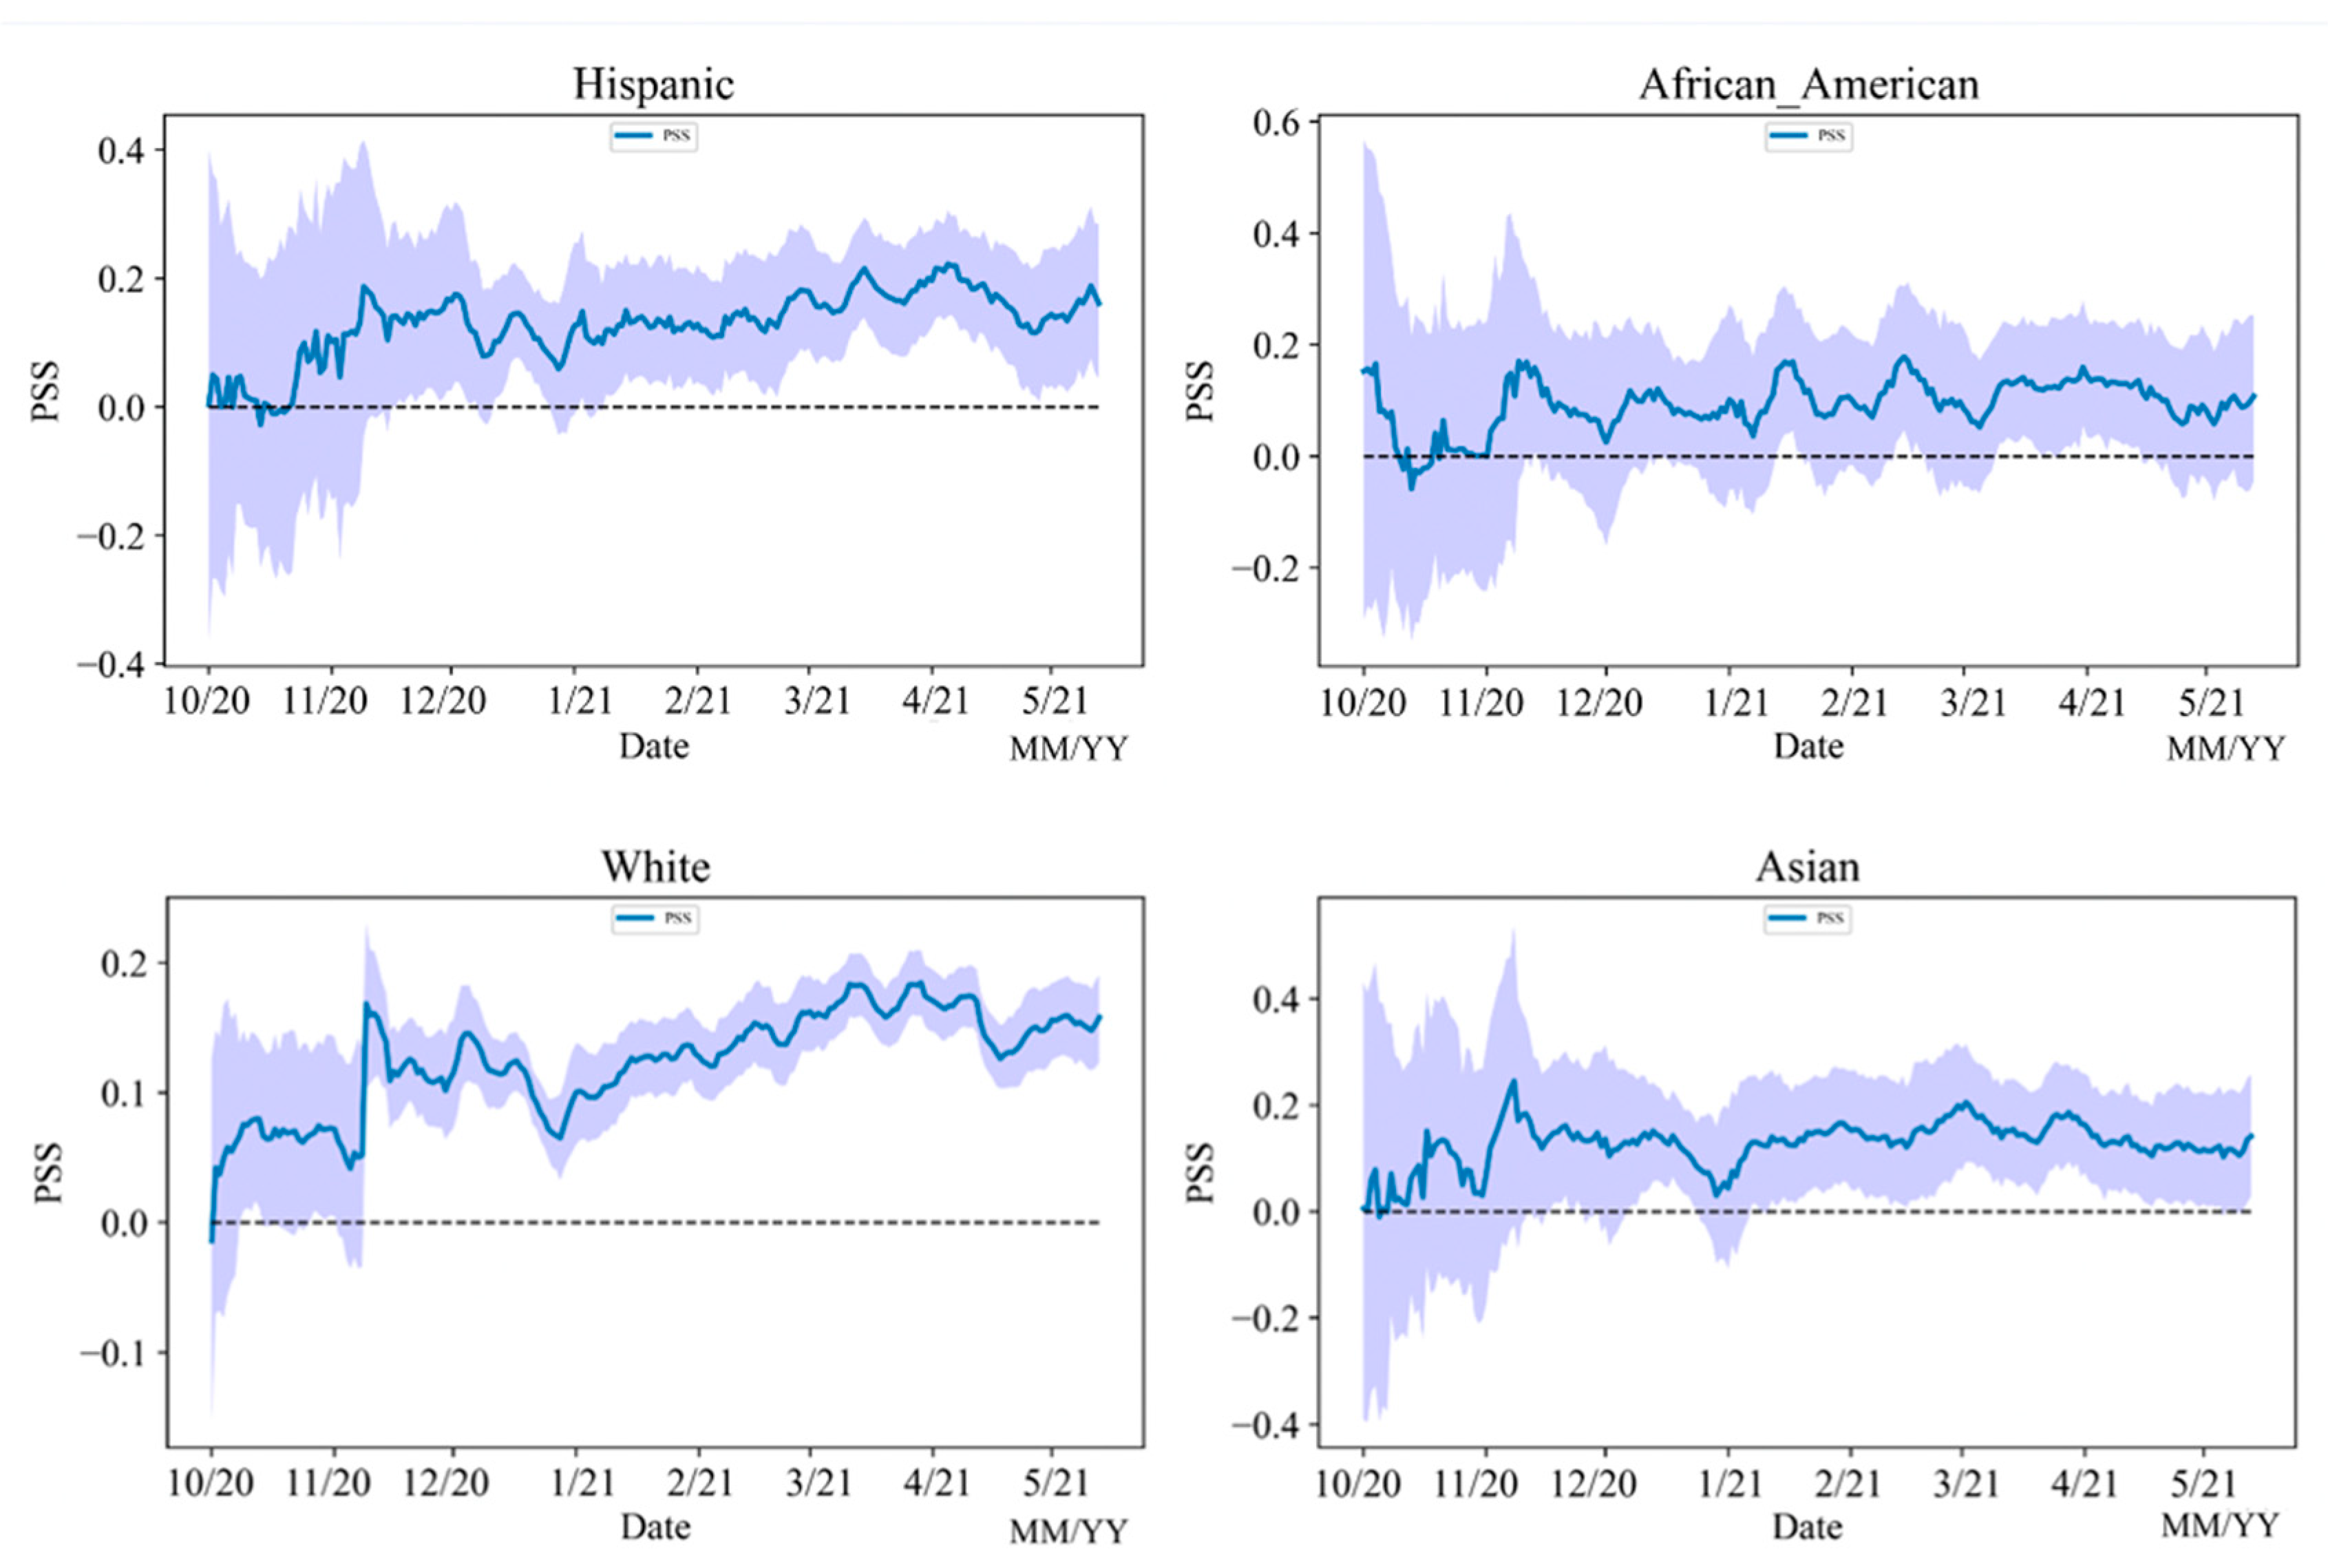
5.4.2. PSS
6. Conclusions
Author Contributions
Funding
Institutional Review Board Statement
Informed Consent Statement
Data Availability Statement
Conflicts of Interest
Abbreviations
| Abbreviations | Definition |
| CDC | Centers for Disease Control and Prevention |
| CGA | The Harvard Center for Geographic Analysis |
| COVID-19 | an infectious disease caused by the SARS-CoV-2 virus |
| FDA | U.S. Food and Drug Administration |
| HCW | Health Care Workers |
| NER | Name Entity Recognition |
| PES | Public Engagement Score: a score shows the level of public involvement for discussion of COVID-19 vaccines |
| PSS | Public Sentiment Score: a score shows the polarity of public attitude for discussion of COVID-19 vaccines |
References
- Coronavirus in the U.S.: Latest Map and Case Count. Available online: https://www.nytimes.com/interactive/2021/us/covid-cases.html (accessed on 15 July 2022).
- Yang, C.; Sha, D.; Liu, Q.; Li, Y.; Lan, H.; Guan, W.W.; Hu, T.; Li, Z.; Zhang, Z.; Thompson, J.H.; et al. Taking the pulse of COVID-19: A spatiotemporal perspective. Int. J. Digit. Earth 2020, 13, 1186–1211. [Google Scholar] [CrossRef]
- Courtemanche, C.; Garuccio, J.; Le, A.; Pinkston, J.; Yelowitz, A. Strong Social Distancing Measures In The United States Reduced The COVID-19 Growth Rate: Study evaluates the impact of social distancing measures on the growth rate of confirmed COVID-19 cases across the United States. Health Aff. 2020, 39, 1237–1246. [Google Scholar] [CrossRef] [PubMed]
- Li, Y.; Li, M.; Rice, M.; Su, Y.; Yang, C. Phased implementation of COVID-19 vaccination: Rapid assessment of policy adoption, reach and effectiveness to protect the most vulnerable in the US. Int. J. Environ. Res. Public Health 2021, 18, 7665. [Google Scholar] [CrossRef] [PubMed]
- Wong, S.H.; Lui, R.N.; Sung, J.J. COVID-19 and the digestive system. J. Gastroenterol. Hepatol. 2020, 35, 744–748. [Google Scholar] [CrossRef]
- HHS, FDA Approval and Authorization of COVID-19 Vaccines. Available online: https://www.hhs.gov/coronavirus/covid-19-vaccines/index.html (accessed on 11 November 2021).
- Silberner, J. Behind the Scenes of the Pfizer BioNTech COVID-19 Vaccine Trial. Available online: https://www.bmj.com/content/372/bmj.n271 (accessed on 10 July 2022).
- Coronavirus (COVID-19) Update: FDA Authorizes Moderna and Pfizer-BioNTech COVID-19 Vaccines for Children Down to 6 Months of Age. Available online: https://www.fda.gov/news-events/press-announcements/coronavirus-covid-19-update-fda-authorizes-moderna-and-pfizer-biontech-covid-19-vaccines-children (accessed on 22 June 2022).
- Yaqub, O.; Castle-Clarke, S.; Sevdalis, N.; Chataway, J. Attitudes to vaccination: A critical review. Soc. Sci. Med. 2014, 112, 1–11. [Google Scholar] [CrossRef] [PubMed]
- Luthi, S. Vaccine Opponents Rebrand as Rollout of COVID-19 Shots Looms. 2020. Available online: https://www.politico.com/news/2020/12/05/covid-19-anti-vaxxers-442984 (accessed on 16 November 2021).
- Ball, P. Anti-vaccine movement could undermine efforts to end coronavirus pandemic, researchers warn. Nature 2020, 581, 251–252. [Google Scholar] [CrossRef] [PubMed]
- Mfinanga, S.G.; Mnyambwa, N.P.; Minja, D.T.; Ntinginya, N.E.; Ngadaya, E.; Makani, J.; Makubi, A.N. Tanzania’s position on the COVID-19 pandemic. Lancet 2021, 397, 1542–1543. [Google Scholar] [CrossRef]
- Brooker, R.G.; Schaefer, T. Methods of measuring public opinion. In Public Opinion in the 21st Century; 2015; Available online: https://www.uky.edu/AS/PoliSci/Peffley/pdf/473Measuring%20Public%20Opinion.pdf (accessed on 3 September 2022).
- McGregor, S.C. Social media as public opinion: How journalists use social media to represent public opinion. Journalism 2019, 20, 1070–1086. [Google Scholar] [CrossRef]
- Allport, F.H. Toward a science of public opinion. Public Opin. Q. 1937, 1, 7–23. [Google Scholar] [CrossRef]
- Saris, W.E.; Gallhofer, I.N. Design, Evaluation, and Analysis of Questionnaires for Survey Research; John Wiley & Sons: Hoboken, NJ, USA, 2014. [Google Scholar]
- Han, X.; Wang, J.; Zhang, M.; Wang, X. Using social media to mine and analyze public opinion related to COVID-19 in China. Int. J. Environ. Res. Public Health 2020, 17, 2788. [Google Scholar] [CrossRef] [PubMed] [Green Version]
- Yu, M.; Huang, Q.; Qin, H.; Scheele, C.; Yang, C. Deep learning for real-time social media text classification for situation awareness–using Hurricanes Sandy, Harvey, and Irma as case studies. Int. J. Digit. Earth 2019, 12, 1230–1247. [Google Scholar] [CrossRef]
- Anstead, N.; O’Loughlin, B. Social media analysis and public opinion: The 2010 UK general election. J. Comput. Mediat. Commun. 2015, 20, 204–220. [Google Scholar] [CrossRef]
- Sasahara, K.; Hirata, Y.; Toyoda, M.; Kitsuregawa, M.; Aihara, K. Quantifying collective attention from tweet stream. PLoS ONE 2013, 8, e61823. [Google Scholar] [CrossRef]
- Windels, K.; Heo, J.; Jeong, Y.; Porter, L.; Jung, A.R.; Wang, R. My friend likes this brand: Do ads with social context attract more attention on social networking sites? Comput. Hum. Behav. 2018, 84, 420–429. [Google Scholar] [CrossRef]
- Arthur, R.; Williams, H.T. Scaling laws in geo-located Twitter data. PLoS ONE 2019, 14, e0218454. [Google Scholar] [CrossRef]
- Hargittai, E. Potential biases in big data: Omitted voices on social media. Soc. Sci. Comput. Rev. 2020, 38, 10–24. [Google Scholar] [CrossRef]
- Ragini, J.R.; Anand, P.R.; Bhaskar, V. Big data analytics for disaster response and recovery through sentiment analysis. Int. J. Inf. Manag. 2018, 42, 13–24. [Google Scholar] [CrossRef]
- Beigi, G.; Hu, X.; Maciejewski, R.; Liu, H. An overview of sentiment analysis in social media and its applications in disaster relief. Studies Comput. Intell. 2016, 639, 313–340. [Google Scholar]
- Zhu, B.; Zheng, X.; Liu, H.; Li, J.; Wang, P. Analysis of spatiotemporal characteristics of big data on social media sentiment with COVID-19 epidemic topics. Chaos Solitons Fractals 2020, 140, 110123. [Google Scholar] [CrossRef]
- Na, T.; Cheng, W.; Li, D.; Lu, W.; Li, H. Insight from NLP analysis: COVID-19 vaccines sentiments on social media. arXiv 2021, arXiv:2106.04081. 2021. [Google Scholar]
- Chen, Y.; Ji, W.; Wang, Q. A Bayesian-based approach for public sentiment modeling. In Proceedings of the 2019 Winter Simulation Conference (WSC), National Harbor, MD, USA, 8–11 December 2019; pp. 3053–3063. [Google Scholar]
- Chen, Y.; Li, Y.; Wang, Z.; Quintero, A.J.; Yang, C.; Ji, W. Rapid perception of public opinion in emergency events through social media. Nat. Hazards Rev. 2022, 23, 04021066. [Google Scholar] [CrossRef]
- Bishop, C.M.; Nasrabadi, N.M. Pattern Recognition and Machine Learning; Springer: New York City, NY, USA, 2006; Volume 4, p. 738. [Google Scholar]
- Vaccine in Merriam-Webster.com. Available online: https://www.merriam-webster.com/dictionary/vaccine (accessed on 15 July 2022).
- Luthy, K.E.; Beckstrand, R.L.; Callister, L.C.; Cahoon, S. Reasons parents exempt children from receiving immunizations. J. Sch. Nurs. 2012, 28, 153–160. [Google Scholar] [CrossRef]
- Centers for Disease Control and Prevention. The Tuskegee Timeline. Available online: https://www.cdc.gov/tuskegee/timeline.htm (accessed on 10 July 2022).
- Corbie-Smith, G.; Thomas, S.B.; Williams, M.V.; Moody-Ayers, S. Attitudes and beliefs of African Americans toward participation in medical research. J. Gen. Intern. Med. 1999, 14, 537–546. [Google Scholar] [CrossRef]
- Ala’a, B.; Tarhini, Z.; Akour, A. A swaying between successive pandemic waves and pandemic fatigue: Where does Jordan stand? Ann. Med. Surg. 2021, 65, 102298. [Google Scholar]
- Mose, A.; Yeshaneh, A. COVID-19 Vaccine Acceptance and Its Associated Factors Among Pregnant Women Attending Antenatal Care Clinic in Southwest Ethiopia: Institutional-Based Cross-Sectional Study. Int. J. Gen. Med. 2021, 14, 2385. [Google Scholar] [CrossRef]
- Walker, A.N.; Zhang, T.; Peng, X.Q.; Ge, J.J.; Gu, H.; You, H. Vaccine Acceptance and Its Influencing Factors: An Online Cross-Sectional Study among International College Students Studying in China. Vaccines 2021, 9, 585. [Google Scholar] [CrossRef]
- Hussain, A.; Tahir, A.; Hussain, Z.; Sheikh, Z.; Gogate, M.; Dashtipour, K.; Ali, A.; Sheikh, A. Artificial intelligence–enabled analysis of public attitudes on facebook and twitter toward COVID-19 vaccines in the united kingdom and the united states: Observational study. J. Med. Internet Res. 2021, 23, e26627. [Google Scholar] [CrossRef]
- Jang, H.; Rempel, E.; Roth, D.; Carenini, G.; Janjua, N.Z. Tracking COVID-19 discourse on twitter in North America: Infodemiology study using topic modeling and aspect-based sentiment analysis. J. Med. Internet Res. 2021, 23, e25431. [Google Scholar] [CrossRef]
- Coronavirus (COVID-19) Update: 9 November 2020. Available online: https://www.fda.gov/news-events/press-announcements/coronavirus-covid-19-update-november-9-2020 (accessed on 22 June 2022).
- ‘The Weapon That Will End the War’: First Coronavirus Vaccine Shots Given Outside Trials in U.S. Available online: https://www.washingtonpost.com/nation/2020/12/14/first-covid-vaccines-new-york/ (accessed on 15 July 2022).
- Artiga, S.; Kates, J.; Michaud, J.; Hill, L. Racial Diversity within COVID-19 Vaccine Clinical Trials: Key Questions and Answers. 2021. Available online: https://www.kff.org/racial-equity-and-health-policy/issue-brief/racial-diversity-within-covid-19-vaccine-clinical-trials-key-questions-and-answers/ (accessed on 21 July 2022).
- Ritonga, M.; Al Ihsan, M.A.; Anjar, A.; Rambe, F.H. Sentiment analysis of COVID-19 vaccine in Indonesia using Naïve Bayes Algorithm. IOP Conf. Ser. Mater. Sci. Eng. 2021, 1088, 012045. [Google Scholar]
- Yousefinaghani, S.; Dara, R.; Mubareka, S.; Papadopoulos, A.; Sharif, S. An analysis of COVID-19 vaccine sentiments and opinions on Twitter. Int. J. Infect. Dis. 2021, 108, 256–262. [Google Scholar] [CrossRef] [PubMed]
- See How Vaccinations Are Going in Your County and State. Available online: https://www.nytimes.com/interactive/2020/us/covid-19-vaccine-doses.html (accessed on 15 July 2022).
- Momplaisir, F.M.; Kuter, B.J.; Ghadimi, F.; Browne, S.; Nkwihoreze, H.; Feemster, K.A.; Frank, I.; Faig, W.; Shen, A.K.; Offit, P.A.; et al. Racial/ethnic differences in COVID-19 vaccine hesitancy among health care workers in 2 large academic hospitals. JAMA Netw. Open 2021, 4, e2121931. [Google Scholar] [CrossRef] [PubMed]
- Lewis, B.; Kakkar, D. Harvard CGA Geotweet Archive v2.0. Available online: https://doi.org/10.7910/DVN/3NCMB6 (accessed on 29 November 2021). [CrossRef]
- Frequently Occurring Surnames from the 2010 Census. Available online: https://www.census.gov/topics/population/genealogy/data/2010_surnames.html (accessed on 18 April 2022).
- NSF Spatiotemporal Innovation Center. STC COVID-19 Dataset. Available online: https://github.com/stccenter/COVID-19-Data/ (accessed on 29 November 2021).
- Coronavirus (COVID-19) Vaccinations. Available online: https://github.com/owid/covid-19-data/tree/master/public/data/vaccinations (accessed on 10 July 2022).
- Vaccines and Related Biological Products Advisory Committee December 10, 2020. Meeting Briefing Document-FDA. Available online: https://www.fda.gov/media/144245/download (accessed on 22 June 2022).
- Governor Cuomo Updates New Yorkers on State Vaccination Program. Available online: https://www.governor.ny.gov/news/governor-cuomo-updates-new-yorkers-state-vaccination-program-1 (accessed on 20 August 2022).
- Governor Cuomo Updates New Yorkers on State’s Progress During COVID-19 Pandemic. Available online: https://www.governor.ny.gov/news/governor-cuomo-updates-new-yorkers-states-progress-during-covid-19-pandemic-152 (accessed on 20 August 2022).
- Governor Ron DeSantis Signs Landmark Legislation to Ban Vaccine Passports and Stem Government Overreach. Available online: https://www.flgov.com/2021/05/03/governor-ron-desantis-signs-landmark-legislation-to-ban-vaccine-passports-and-stem-government-overreach/ (accessed on 20 August 2022).
- Governor Ron DeSantis Signs Legislation to Protect Florida Jobs. Available online: https://www.flgov.com/2021/11/18/governor-ron-desantis-signs-legislation-to-protect-florida-jobs/ (accessed on 20 August 2022).
- Governor Abbott Lifts Mask Mandate, Opens Texas 100 Percent. Available online: https://gov.texas.gov/news/post/governor-abbott-lifts-mask-mandate-opens-texas-100-percent (accessed on 20 August 2022).
- Centers for Disease Control and Prevention. What to Expect after Getting a COVID-19 Vaccine. Available online: https://www.cdc.gov/coronavirus/2019-ncov/vaccines/expect/after.html (accessed on 29 November 2021).
- Gonzalez-Barrera, A.; Lopez, M.H. Is Being Hispanic a Matter of Race, Ethnicity or Both? Available online: https://www.pewresearch.org/fact-tank/2015/06/15/is-being-hispanic-a-matter-of-race-ethnicity-or-both/ (accessed on 10 July 2022).
- Mizes-Tan, S. History Of Medical Testing Has Left Many African Americans Hesitant About The New COVID-19 Vaccine. Available online: https://www.capradio.org/articles/2020/12/17/history-of-medical-testing-has-left-many-african-americans-hesitant-about-the-new-covid-19-vaccine/ (accessed on 29 November 2021).
- Truman, B.I.; Chang, M.H.; Moonesinghe, R. Provisional COVID-19 age-adjusted death rates, by race and ethnicity—United States, 2020–2021. Morb. Mortal. Wkly. Rep. 2022, 71, 601. [Google Scholar] [CrossRef]
- Mislove, A.; Lehmann, S.; Ahn, Y.Y.; Onnela, J.P.; Rosenquist, J. Understanding the demographics of Twitter users. In Proceedings of the International AAAI Conference on Web and Social Media, Barcelona, Spain, 17–21 July 2011; Volume 5, pp. 554–557. [Google Scholar]
- Hecht, B.; Stephens, M. A tale of cities: Urban biases in volunteered geographic information. In Proceedings of the International AAAI Conference on Web and Social Media, Ann Arbor, MI, USA, 1–4 June 2014; Volume 8, pp. 197–205. [Google Scholar]
- Rus, H.M.; Cameron, L.D. Health communication in social media: Message features predicting user engagement on diabetes-related Facebook pages. Ann. Behav. Med. 2016, 50, 678–689. [Google Scholar] [CrossRef] [PubMed]


| Name | White | Black | API | AIAN | 2Prace | Hispanic |
|---|---|---|---|---|---|---|
| Smith | 70.9 | 23.11 | 0.5 | 0.89 | 2.19 | 2.4 |
| Washington | 5.17 | 87.53 | 0.3 | 0.68 | 3.78 | 2.54 |
| Chen | 1.4 | 0.3 | 96.12 | 0.02 | 1.64 | 0.52 |
| Beyale | 1.89 | 0 | 0 | 94.7 | 0 | 1.89 |
| KANEKOA | 10.28 | 0 | 25.23 | 0 | 58.88 | 5.61 |
| CEBALLOS | 3.97 | 0.33 | 1.13 | 0.24 | 0.32 | 94.01 |
| Aspect | Keywords |
|---|---|
| Vaccine type | Pfizer, Moderna, Johnson amp Johnson, Janssen, biotech |
| Phased Vaccination | frontline, phased, first dose, healthcare, old, second dose, operation, registration, CVS, pharmacy, administration, essential, medical condition, front line, health care |
| Health concern | side effect, mask, die, warp speed, warp, fever, tiredness. headache, muscle pain, fever, chills |
Publisher’s Note: MDPI stays neutral with regard to jurisdictional claims in published maps and institutional affiliations. |
© 2022 by the authors. Licensee MDPI, Basel, Switzerland. This article is an open access article distributed under the terms and conditions of the Creative Commons Attribution (CC BY) license (https://creativecommons.org/licenses/by/4.0/).
Share and Cite
Wang, Z.; Chen, Y.; Li, Y.; Kakkar, D.; Guan, W.; Ji, W.; Cain, J.; Lan, H.; Sha, D.; Liu, Q.; et al. Public Opinions on COVID-19 Vaccines—A Spatiotemporal Perspective on Races and Topics Using a Bayesian-Based Method. Vaccines 2022, 10, 1486. https://doi.org/10.3390/vaccines10091486
Wang Z, Chen Y, Li Y, Kakkar D, Guan W, Ji W, Cain J, Lan H, Sha D, Liu Q, et al. Public Opinions on COVID-19 Vaccines—A Spatiotemporal Perspective on Races and Topics Using a Bayesian-Based Method. Vaccines. 2022; 10(9):1486. https://doi.org/10.3390/vaccines10091486
Chicago/Turabian StyleWang, Zifu, Yudi Chen, Yun Li, Devika Kakkar, Wendy Guan, Wenying Ji, Jacob Cain, Hai Lan, Dexuan Sha, Qian Liu, and et al. 2022. "Public Opinions on COVID-19 Vaccines—A Spatiotemporal Perspective on Races and Topics Using a Bayesian-Based Method" Vaccines 10, no. 9: 1486. https://doi.org/10.3390/vaccines10091486