
Research Questions and Hypotheses
The spread of the COVID-19 pandemic has led to limitations to movement in many countries and regions, either because of lock-down policies or self-censoring by segments of the public. The magnitude of changes in mobility has been studied by recent research, including DeWeese et al. (2020) and Molloy et al. (2020). While the evidence available indicates that although the overall mobility has reduced in much of the world, the changes were uneven depending on the mode of transportation or the purpose of the trip (see Lock 2020; Paez 2020). Unfortunately, with few exceptions, evidence remains more spotty for developing countries, most of which have large population segments that are less able to absorb losses in mobility (e.g., Astroza et al. 2020; Huynh 2020; Saha, Barman, and Chouhan 2020).
The objective of this paper is to investigate changes in the trip-making frequency by different modes of transportation during the COVID-19 emergency in Bangladesh. Using data from a recent online survey that asked respondents to report mobility levels before and during the pandemic, we pose the following questions:
-
Was there a reduction of mobility in Bangladesh during COVID-19?
-
And if so, what forms of transportation were more affected?
This paper is a reproducible research document (see Brunsdon and Comber 2020); the code and data necessary to reproduce the tables and figures are available in a public repository[1]
Methods and Data
Data used for this paper come from an online survey, “Exploring the potential of travel mode change behavior in the post-lock-down and post-pandemic (COVID-19) period”, conducted during July - August 2020 in Bangladesh The survey was disseminated through various electronic means along with a widespread social media campaign and promotion in various social media sites and groups. In addition to the respondents’ socio-demographic information, the survey covered different aspects of travel such as travel behavior before and during COVID-19, knowledge related to COVID-19, and opinions and perceptions regarding travel behavior after lock-down and post-pandemic situation.
Like other surveys conducted during COVID-19 (e.g., Astroza et al. 2020), this is a convenience sample. Convenience samples have the advantage of being quick and cost-efficient and, despite their lower generalizability, when they are homogeneous they are useful to address rapidly emerging questions (Fricker and Schonlau 2002; Jager, Putnick, and Bornstein 2017). This particular data set has an over-representation of the 16-30 years age group, whereas 37% of the country’s population belongs to this group (Bangladesh Bureau of Statistics 2015). Also, 66% of the respondents are male and 32% are female compared to country’s 49:51 male-female ratio (Bangladesh Bureau of Statistics 2015). These characteristics of the sample are expected in terms of online surveys as young adults are more familiar with online platforms, especially in the context of a developing country. Also, in the case of Bangladesh, collecting a representative sample remains difficult because of overall public reluctance to participate, with women’s strong unwillingness to share their information to unknown parties in particular in face-to-face interviews (see Jamal, Mohiuddin, and Paez 2020). In fact, compared to Jamal, Mohiuddin, and Paez (2020); Table 1], who had only 15% of responses from females, the online survey used in the present research achieved greater penetration among women.
In terms of geography, respondents were asked to identify the name of the district where they reside. The resulting sample has 48% of respondents who live in Dhaka. Although, there are some differences in availability of transportation services between cities, especially between Dhaka and cities outside Dhaka, the mode use frequency indicates that only 15% never used buses and 32% never used ride-hailing services before COVID-19, which means these modes were available to most of the respondents and a vast majority has used them to some extent before the lock-down.
Given the above characteristics, the sample cannot be said to be a probabilistic random sample, but is rather homogeneous for urban, younger respondents, and has greater representation from females than comparable samples obtained from face-to-face interviews in Bangladesh.
The context for the study was the country-wide emergency situation during COVID-19, with required physical distancing recommendations and relevant health regulations in place. Bangladesh was under partial lock-down during the survey period, with only essential services open, offices running on a rotation basis, all educational institutes closed, and public transport services running at 50% capacity. For the purpose of this paper, we use two questions that provide information about trip-making frequency by eight modes of transportation. The modes are car, ride-hailing (e.g., Uber, Pathao), rickshaw, CNG auto-rickshaw (a rickshaw-like vehicle powered by compressed natural gas), bus, motorcycle/scooter (hereafter just motorcycle), walking, and bicycle (there was an additional catch-all category other which we ignore here). Participants in the survey used the following levels to report their frequency of traveling by each mode both before and during COVID-19: Never, Rarely, Once a week, 2-3 trips per week, 4-5 trips per week, Almost daily.
To describe changes in travel frequency by mode in the transition to the pandemic, we use well-established exploratory data analysis (EDA) techniques.
Findings
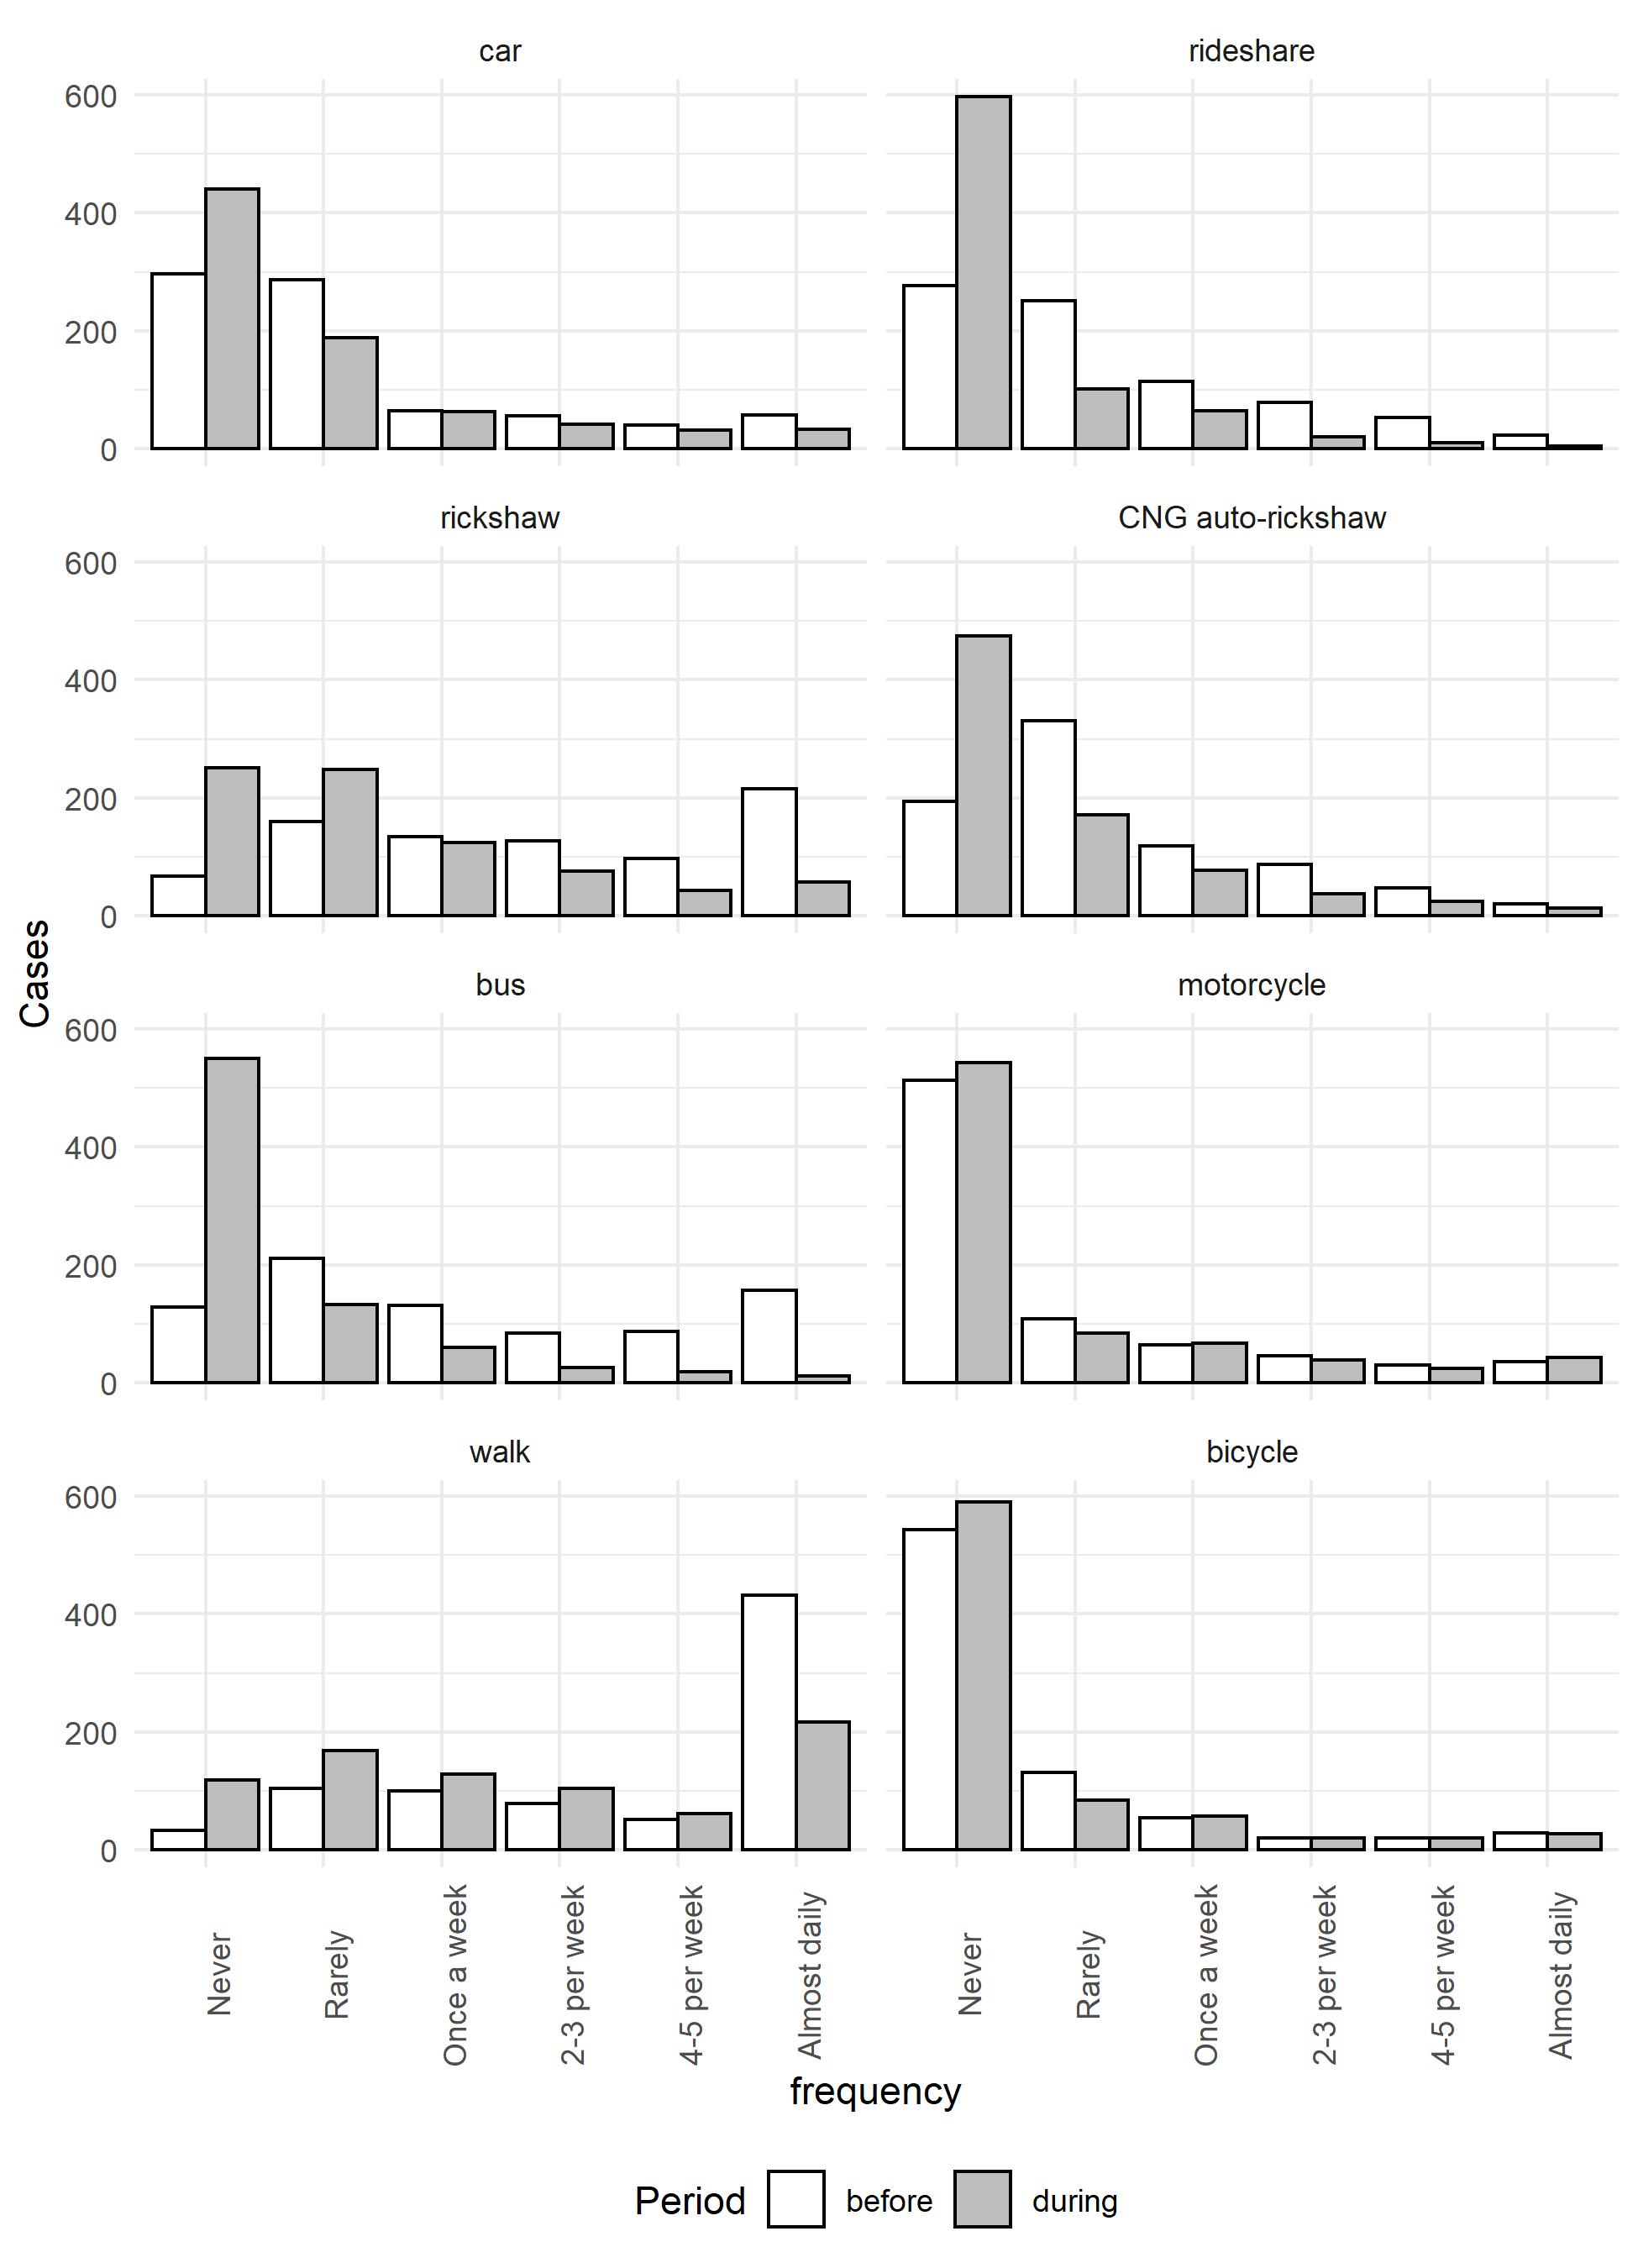
Figure 1 shows the number of responses (out of 800) in each trip-making frequency class by mode of transportation. The white bars and gray bars are for travel before and during the pandemic, respectively. Considering travel before the pandemic, travel by rickshaw, and bus were relatively common for many respondents (few respondents reported never using these modes). The mode most commonly used on a quotidian basis was walk. In contrast, respondents reported less frequent travel by car, ride-hailing services, CNG auto-rickshaw, motorcycle, and bicycle. During the pandemic, we see that while there were reductions in mobility by car, motorcycle, and bicycle (with more respondents reporting never traveling by these modes), the changes were relatively minor.

The frequency of trip-making by other modes changed more noticeably: the frequency of travel by ride-hailing services, rickshaw, CNG auto-rickshaw, and bus collapsed, with vastly more respondents reporting never using these modes during the pandemic than before. The frequency of walking trips also decreased (fewer respondents report walking almost daily), but the reductions in mobility were not so heavily concentrated at the bottom of the scale.
Table 1 is a cross-tabulation of the number of cases in each trip-making frequency class before and during the pandemic. If no changes had occurred, all values would be concentrated on the main diagonal of the matrices. Values in the lower triangular matrix represent a loss of mobility (lower travel frequency), whereas values in the upper triangular matrix are gains (higher travel frequency). The further away a value is from the main diagonal, the greater the loss or gain.

Despite across-the-board losses of mobility, there appears to have been some adaptation that varied by mode of transportation. To illustrate, 103 respondents, or 65.61% of those who traveled by bus almost daily before, reported never using it during the pandemic. In contrast, only 12 respondents, or 1.5% of those who never used buses before started doing so during the pandemic. By way of comparison, 24.14% of respondents who cycled almost daily before the pandemic stopped doing so - but 4.88% who never cycled before started doing so during the pandemic.
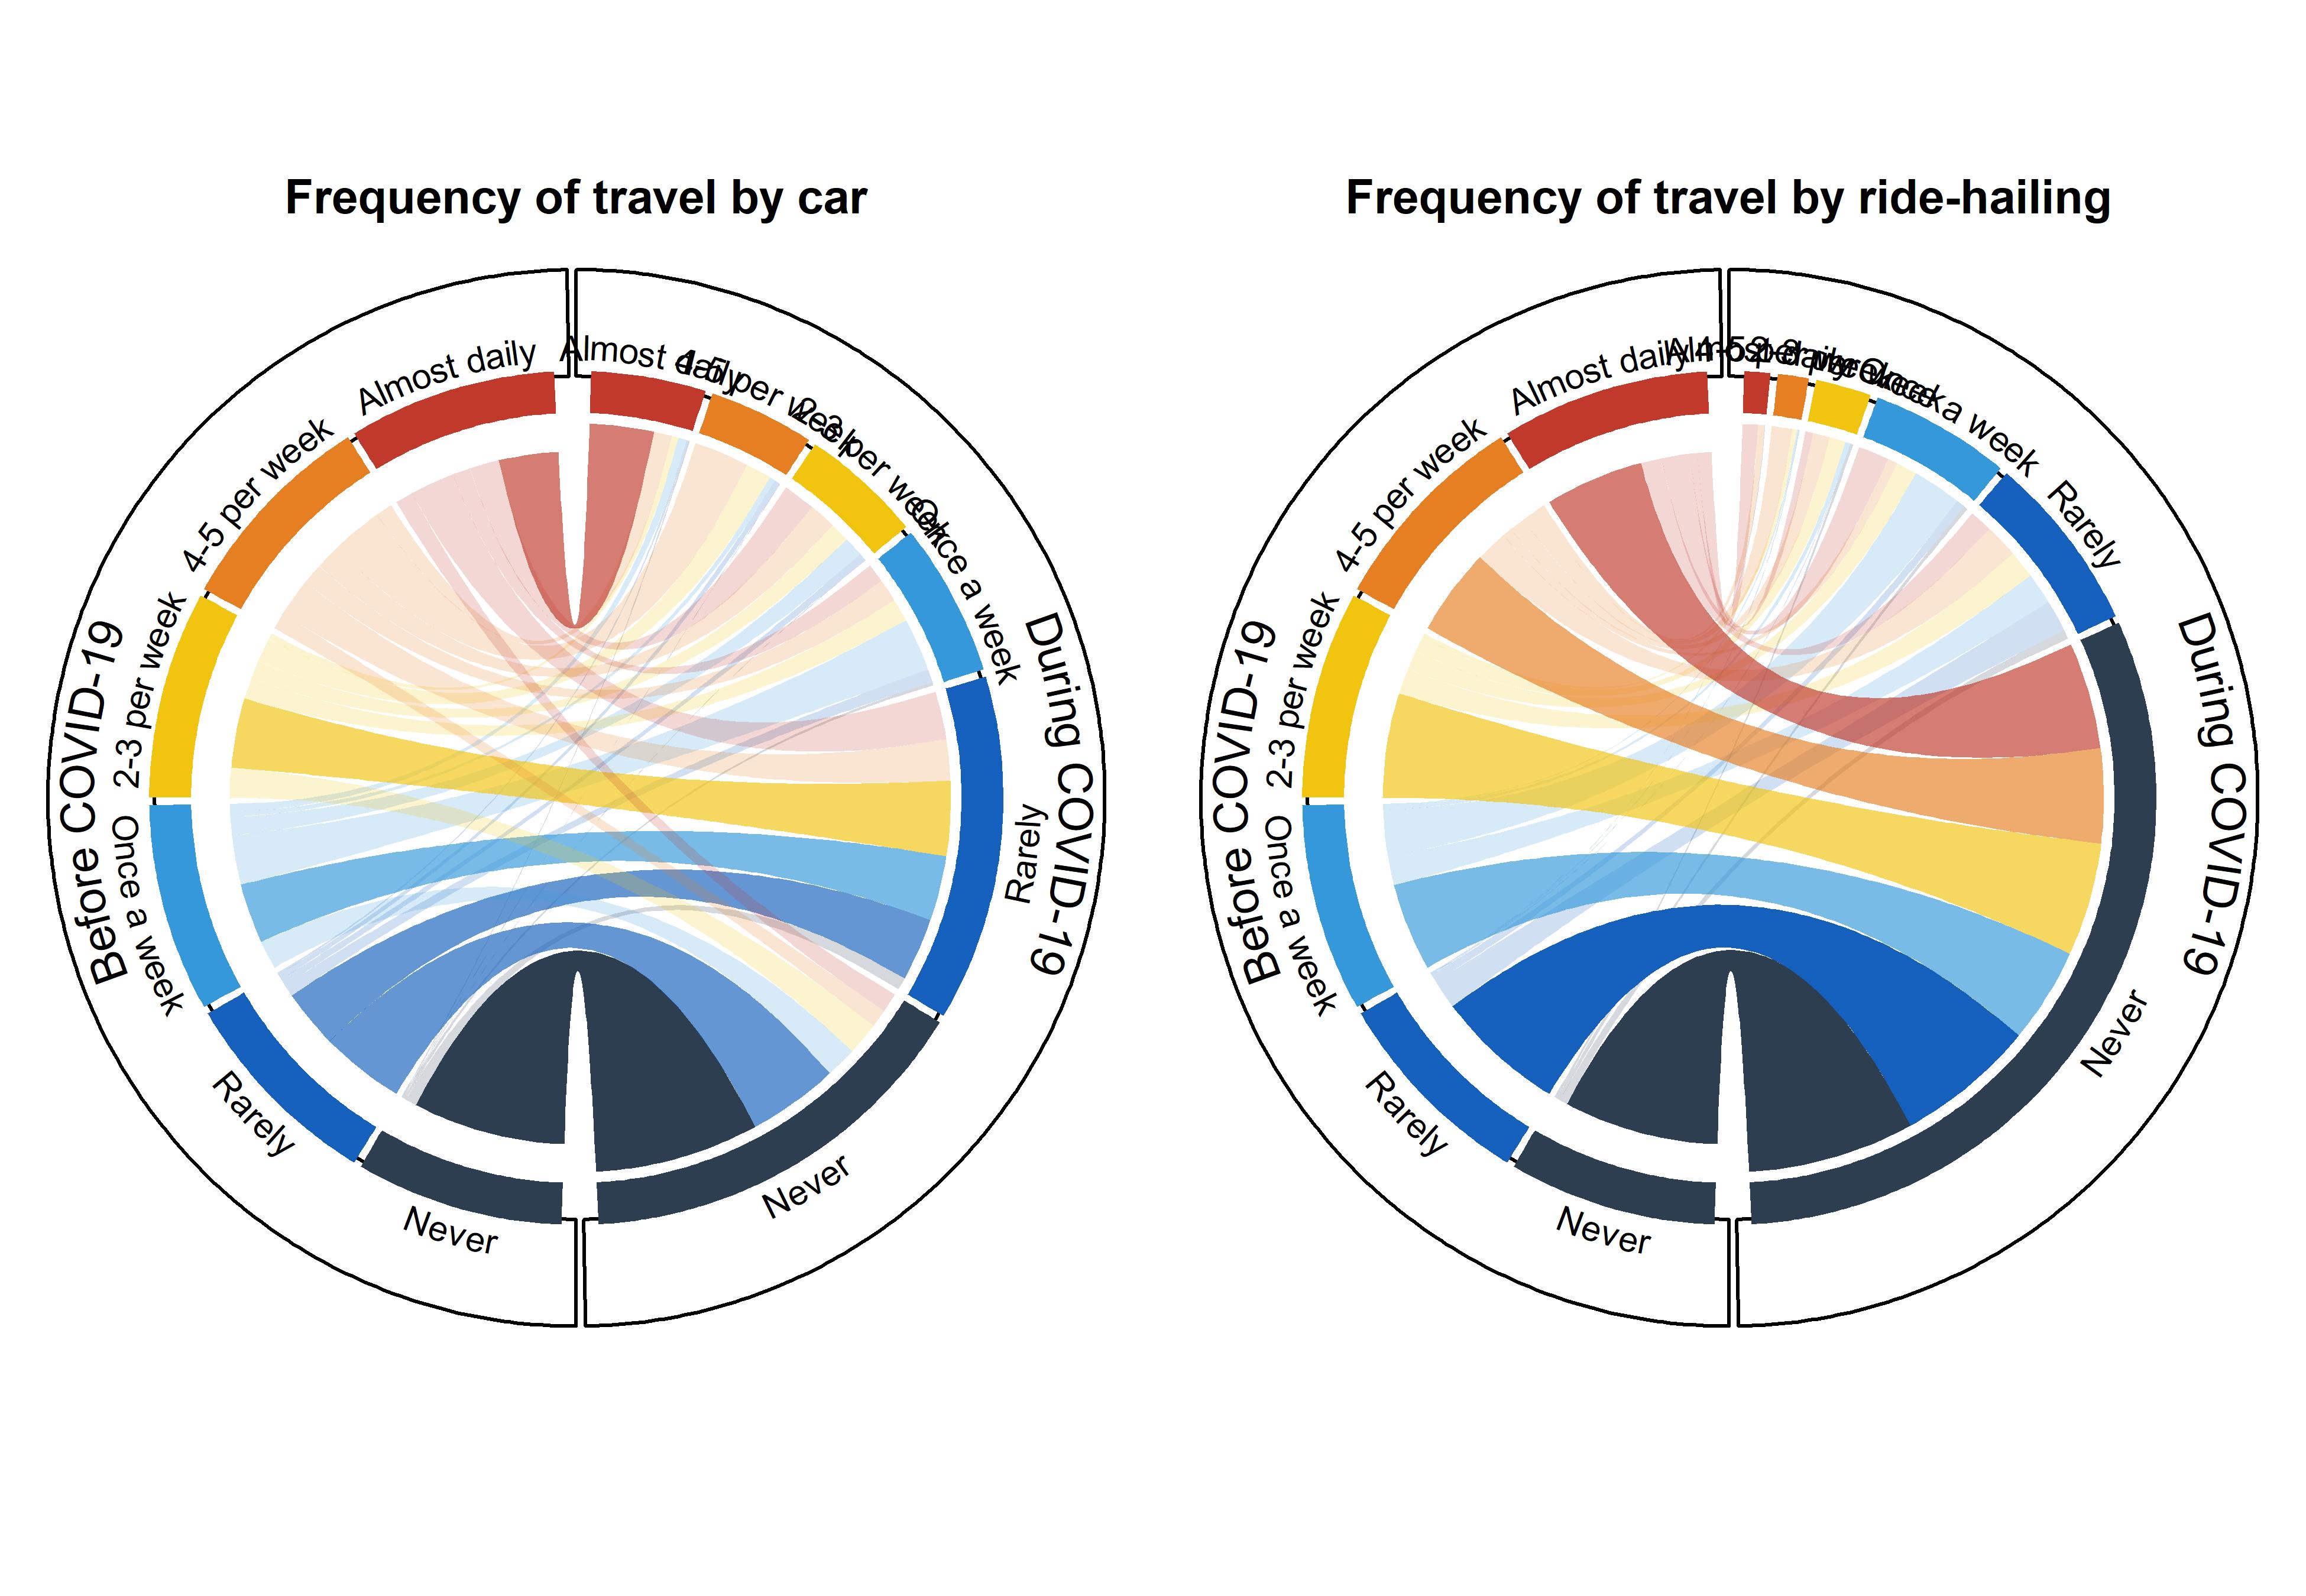
To more clearly understand the transitions towards different trip-making frequencies, including possible adaptations, we convert the cross-tabulations to probability transition matrices, which we then visualize using circular plots.
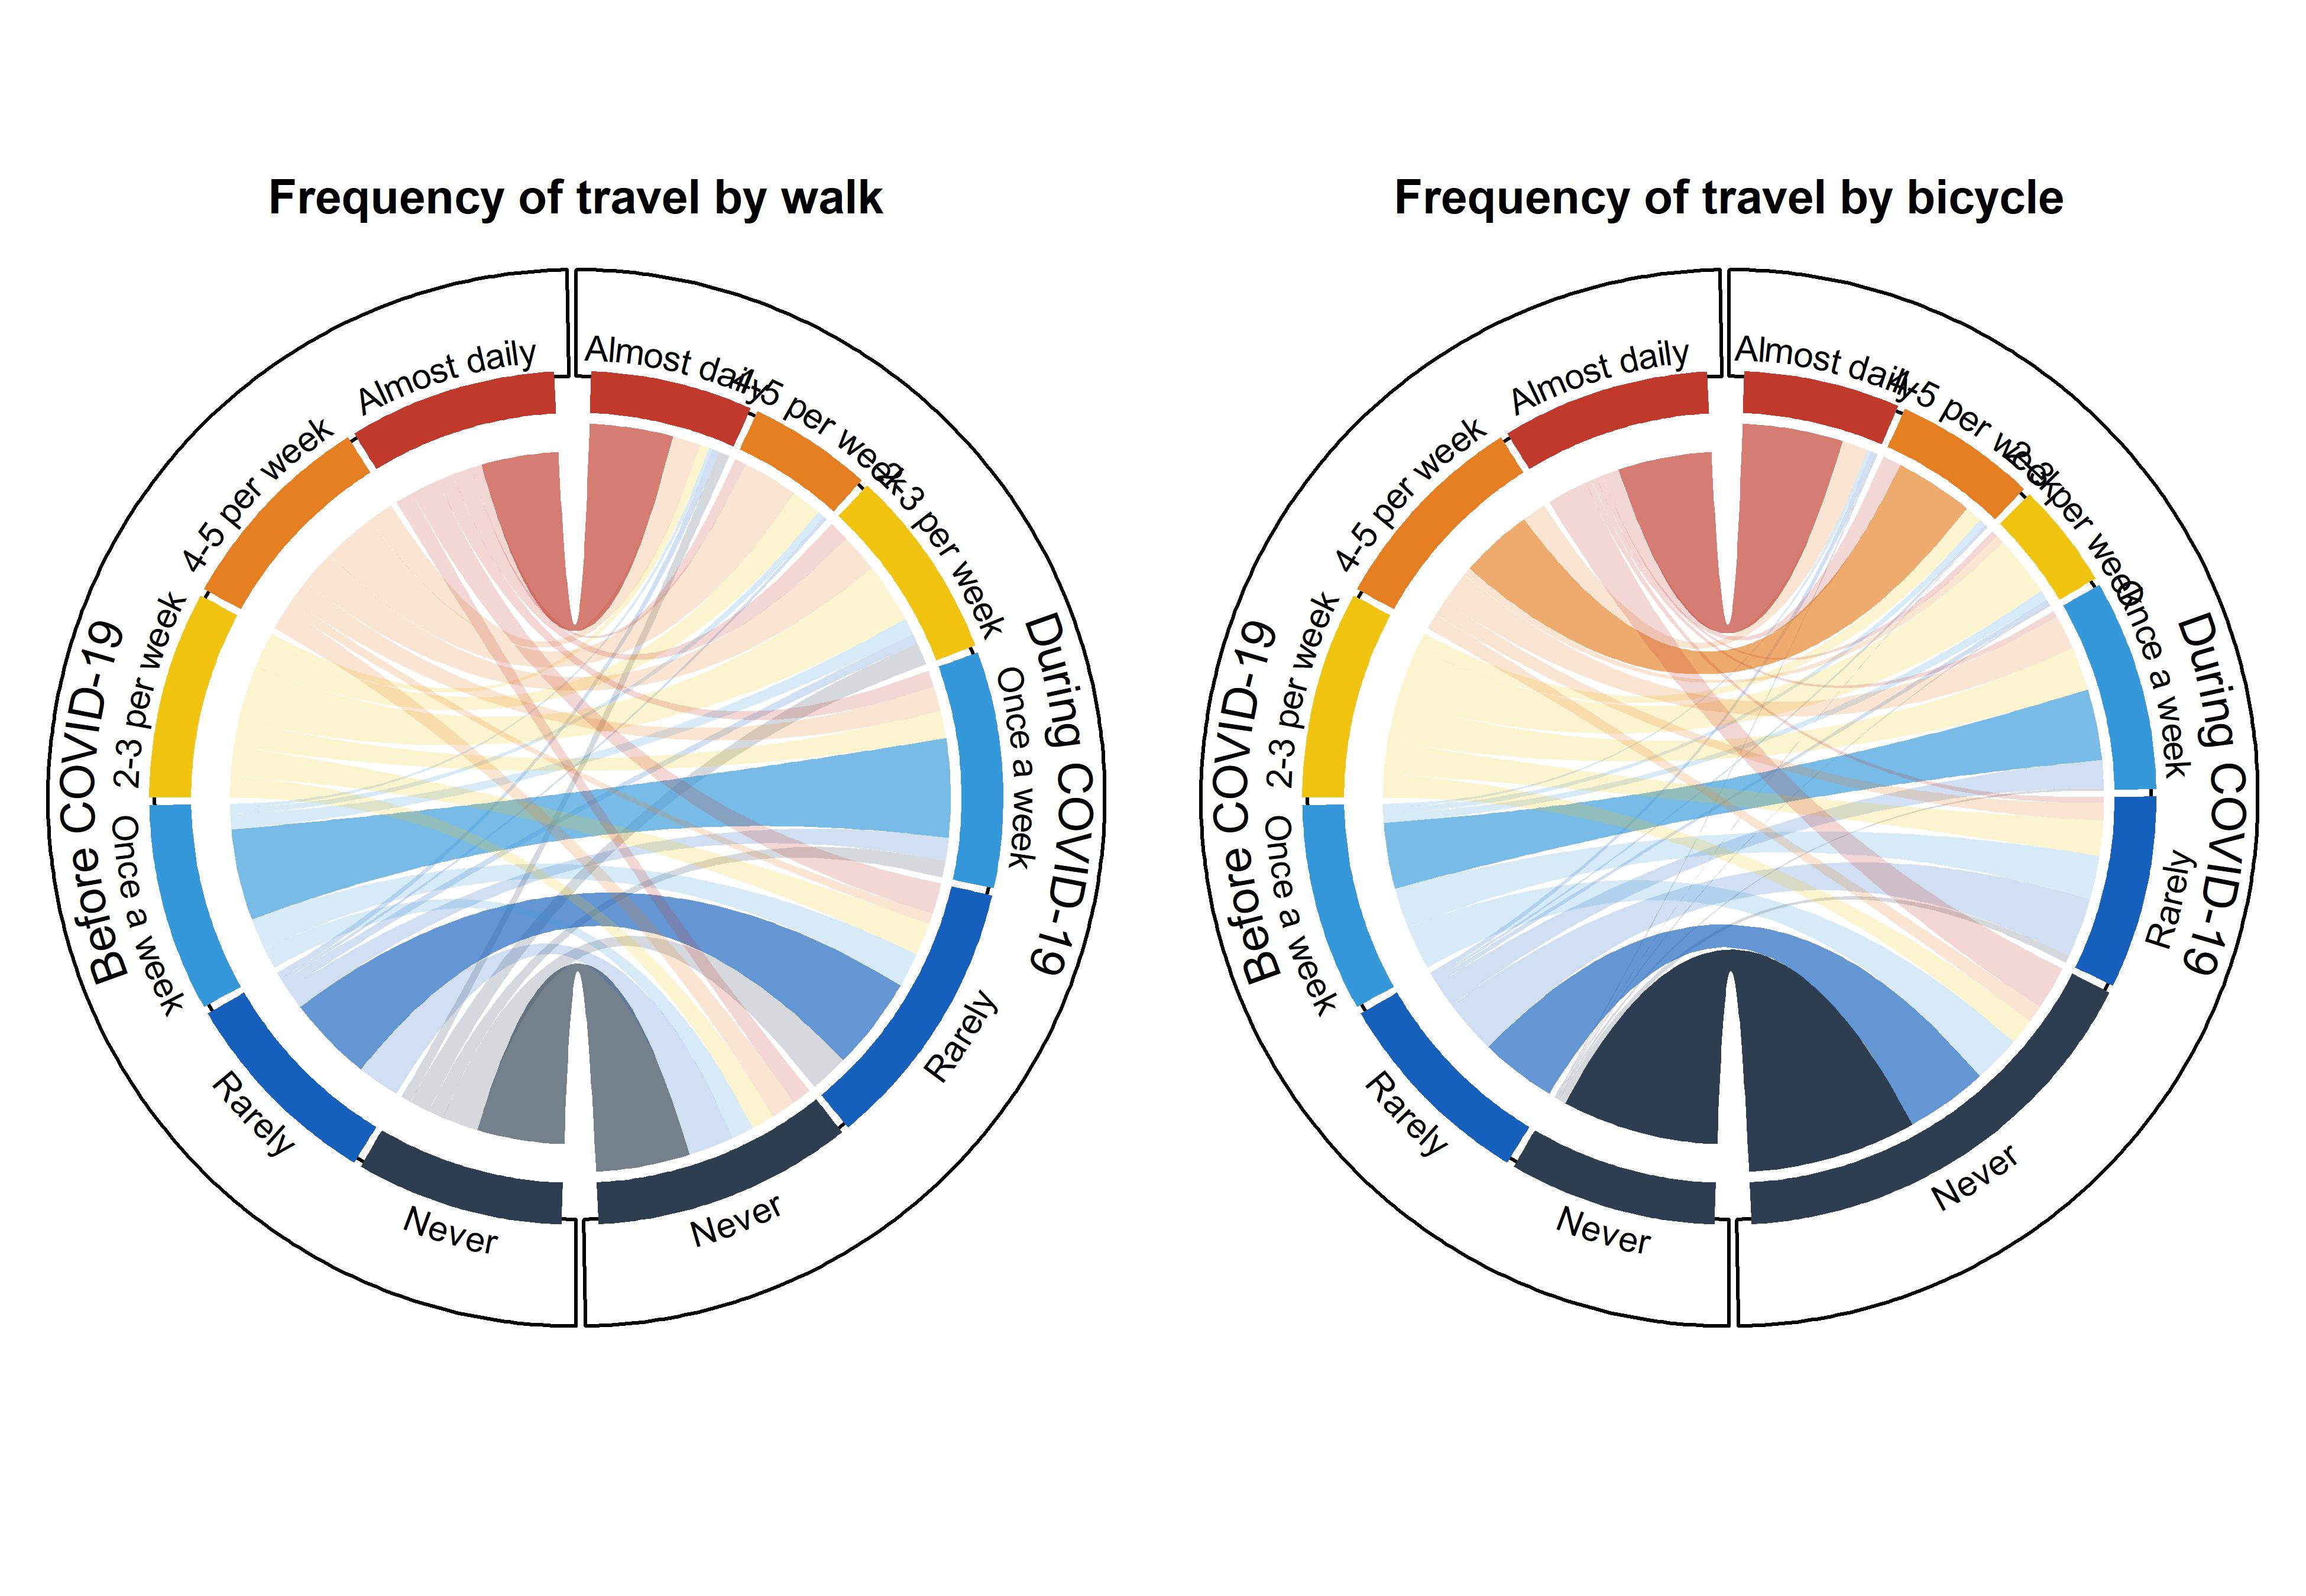
Figures 2 to 5 present these plots. Each of the trip-making frequency sectors on the left hemisphere of the circle represents 100% of responses before the pandemic. A link’s size is proportional to the probability of transitioning from frequency class before the pandemic to frequency class during the pandemic. There are three transparency levels for the links: solid colors are for intermediate transparency is for and the more transparent links are for

From Figure 2, we see that the probability of traveling less by car for those who initially used this mode frequently is high, but their probability of not using this mode at all during the pandemic is quite small. In other words, there was a decline in use, but not complete discontinuation of this mode. The probability of traveling more frequently by car for those who originally never or rarely used this mode remained low. In contrast, we see that the probabilities of never ride-hailing during the pandemic are high irrespective of the initial level of use of this mode of transportation, and the probability of using this mode more is fairly small.
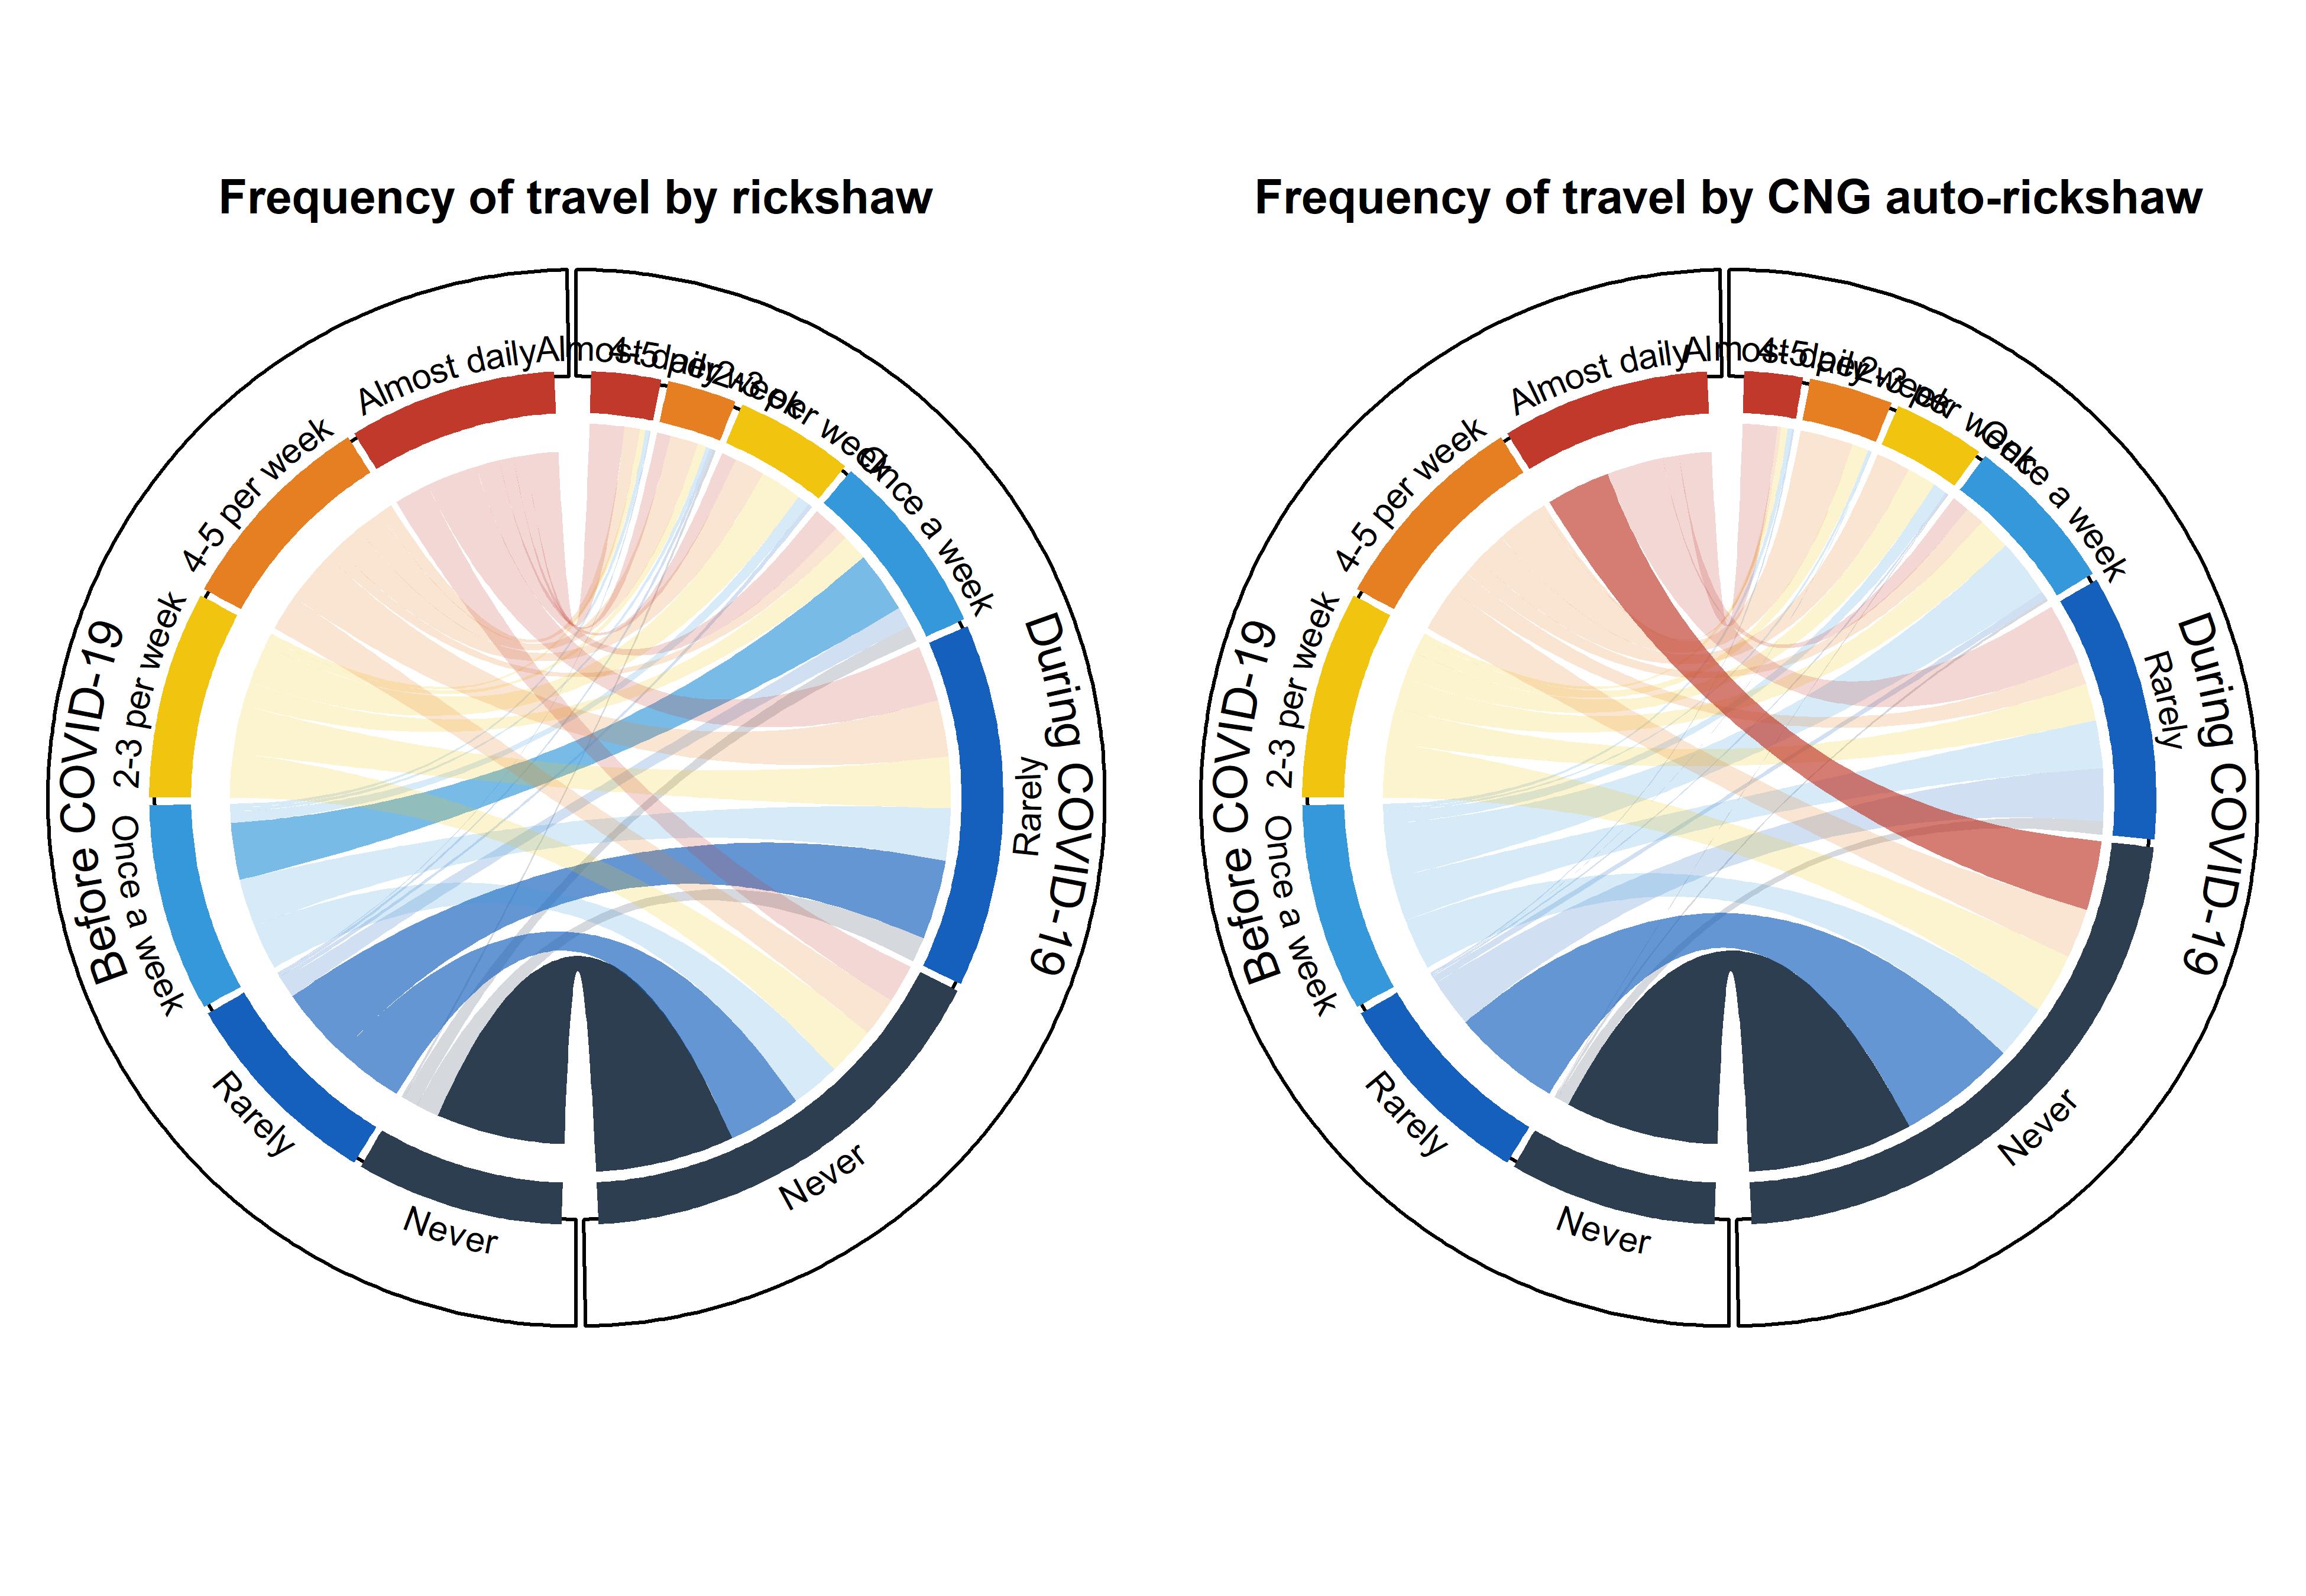
The probabilities of change in trip frequency by rickshaw and CNG auto-rickshaw are similar (see Figure 3), although the probabilities of being less mobile by CNG auto-rickshaw are greater: between 1/3 and 2/3 of respondents who used this mode almost daily, stopped using it during the pandemic. Very rarely there were increases in mobility by these modes.

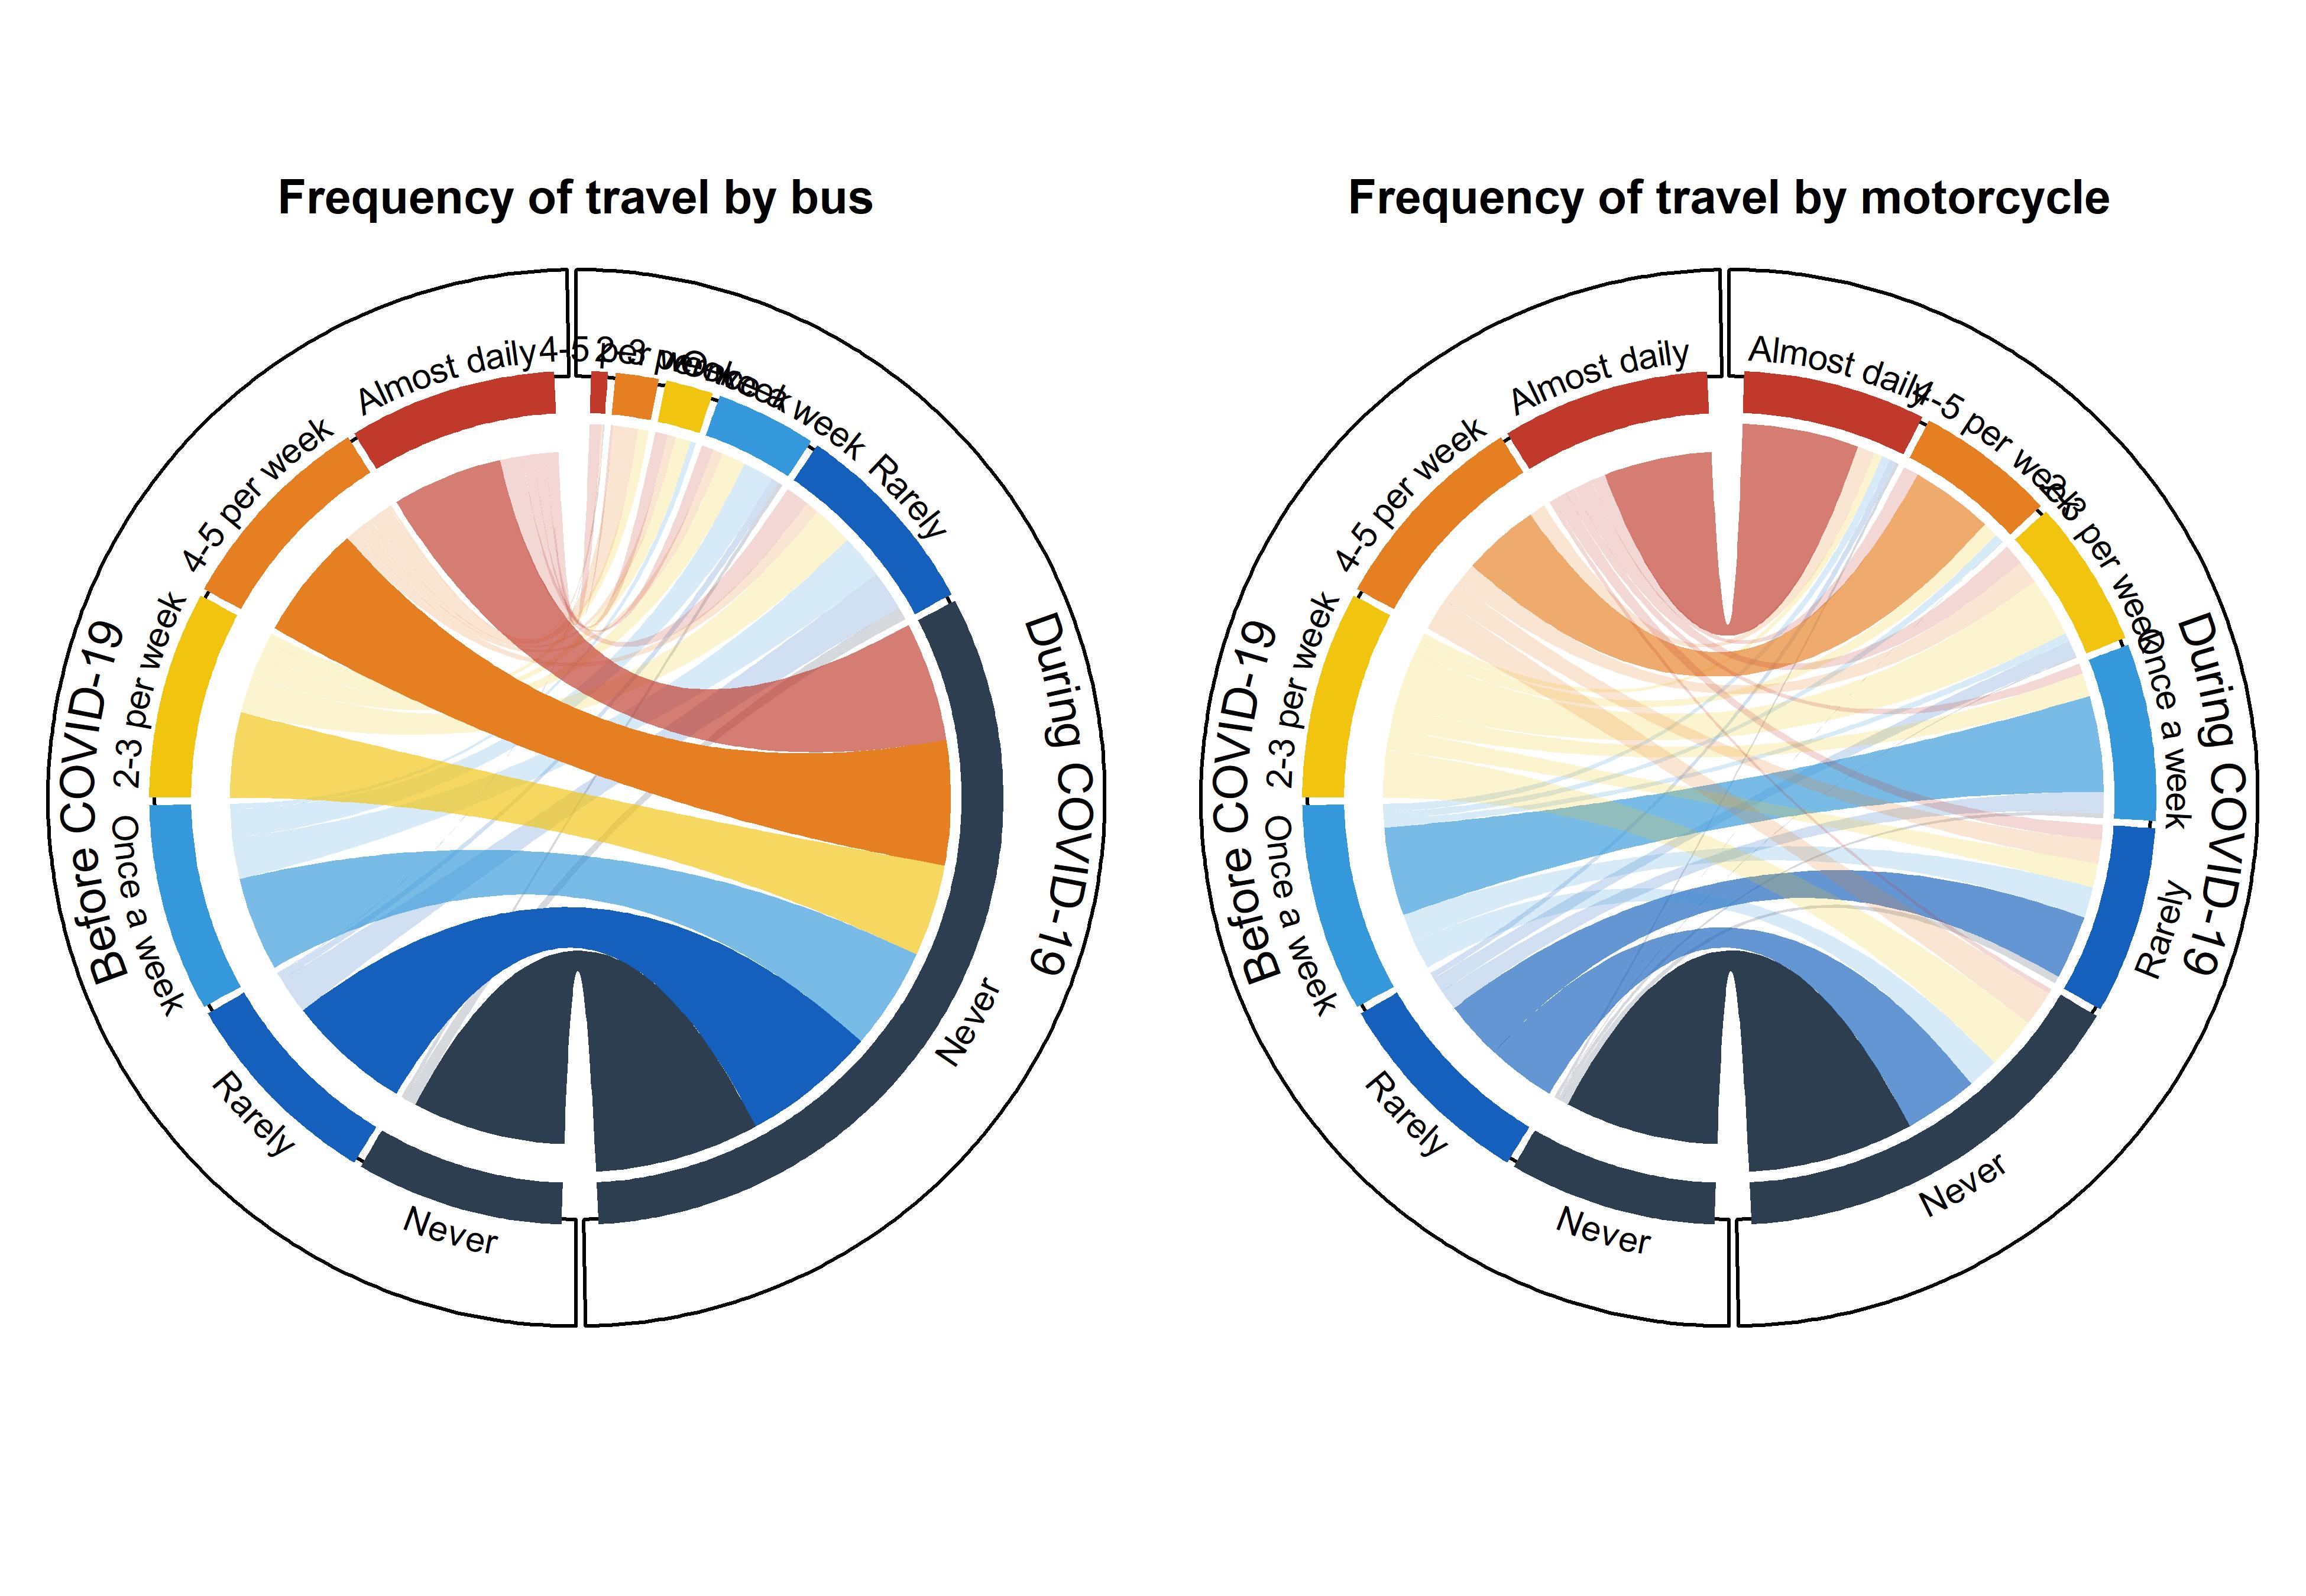
After ride-hailing, the use of bus had the largest probabilities of discontinuation (Figure 4). We see that even respondents who used this mode almost daily before the pandemic had close to 66% chances of never using it during the contingency. Similarly large losses of mobility by bus were observed for travelers who used this mode less frequently before the pandemic. These losses were not offset to any appreciable degree by the probability of some users turning to this mode during the pandemic.

Trip-making by motorcycle (Figure 4) also declined for all but the most frequent users pre-COVID-19, and the probability of adopting this mode during COVID-19 was almost null. Contrast this to the case of walking (Figure 5), where a sizable number of respondents started walking during the pandemic, even if only rarely. Close to 50% of respondents who report walking almost daily during the pandemic walked less frequently before the contingency. Bicycle (Figure 5), like motorcycle, saw relatively fewer respondents adopting it during the pandemic, and many travelers who did use the mode rarely, once a week, or even 2-3 times per week stopped cycling during the pandemic.

The findings reported here suggest important changes in mobility in a developing country during COVID-19, which (given the characteristics of the convenience sample) may be more representative of younger, urban residents in Bangladesh. In general there was a loss of mobility across-the-board, but modes that require interaction with strangers (ride-hailing, bus, rickshaw, and CNG auto-rickshaw) were more affected. Travel by car, motorcycle, and bicycle were somewhat less affected, and there is evidence of some adoption of walking during the pandemic.