
Modulation of NBAS-Related Functions in the Early Response to SARS-CoV-2 Infection

 , , and
Abstract
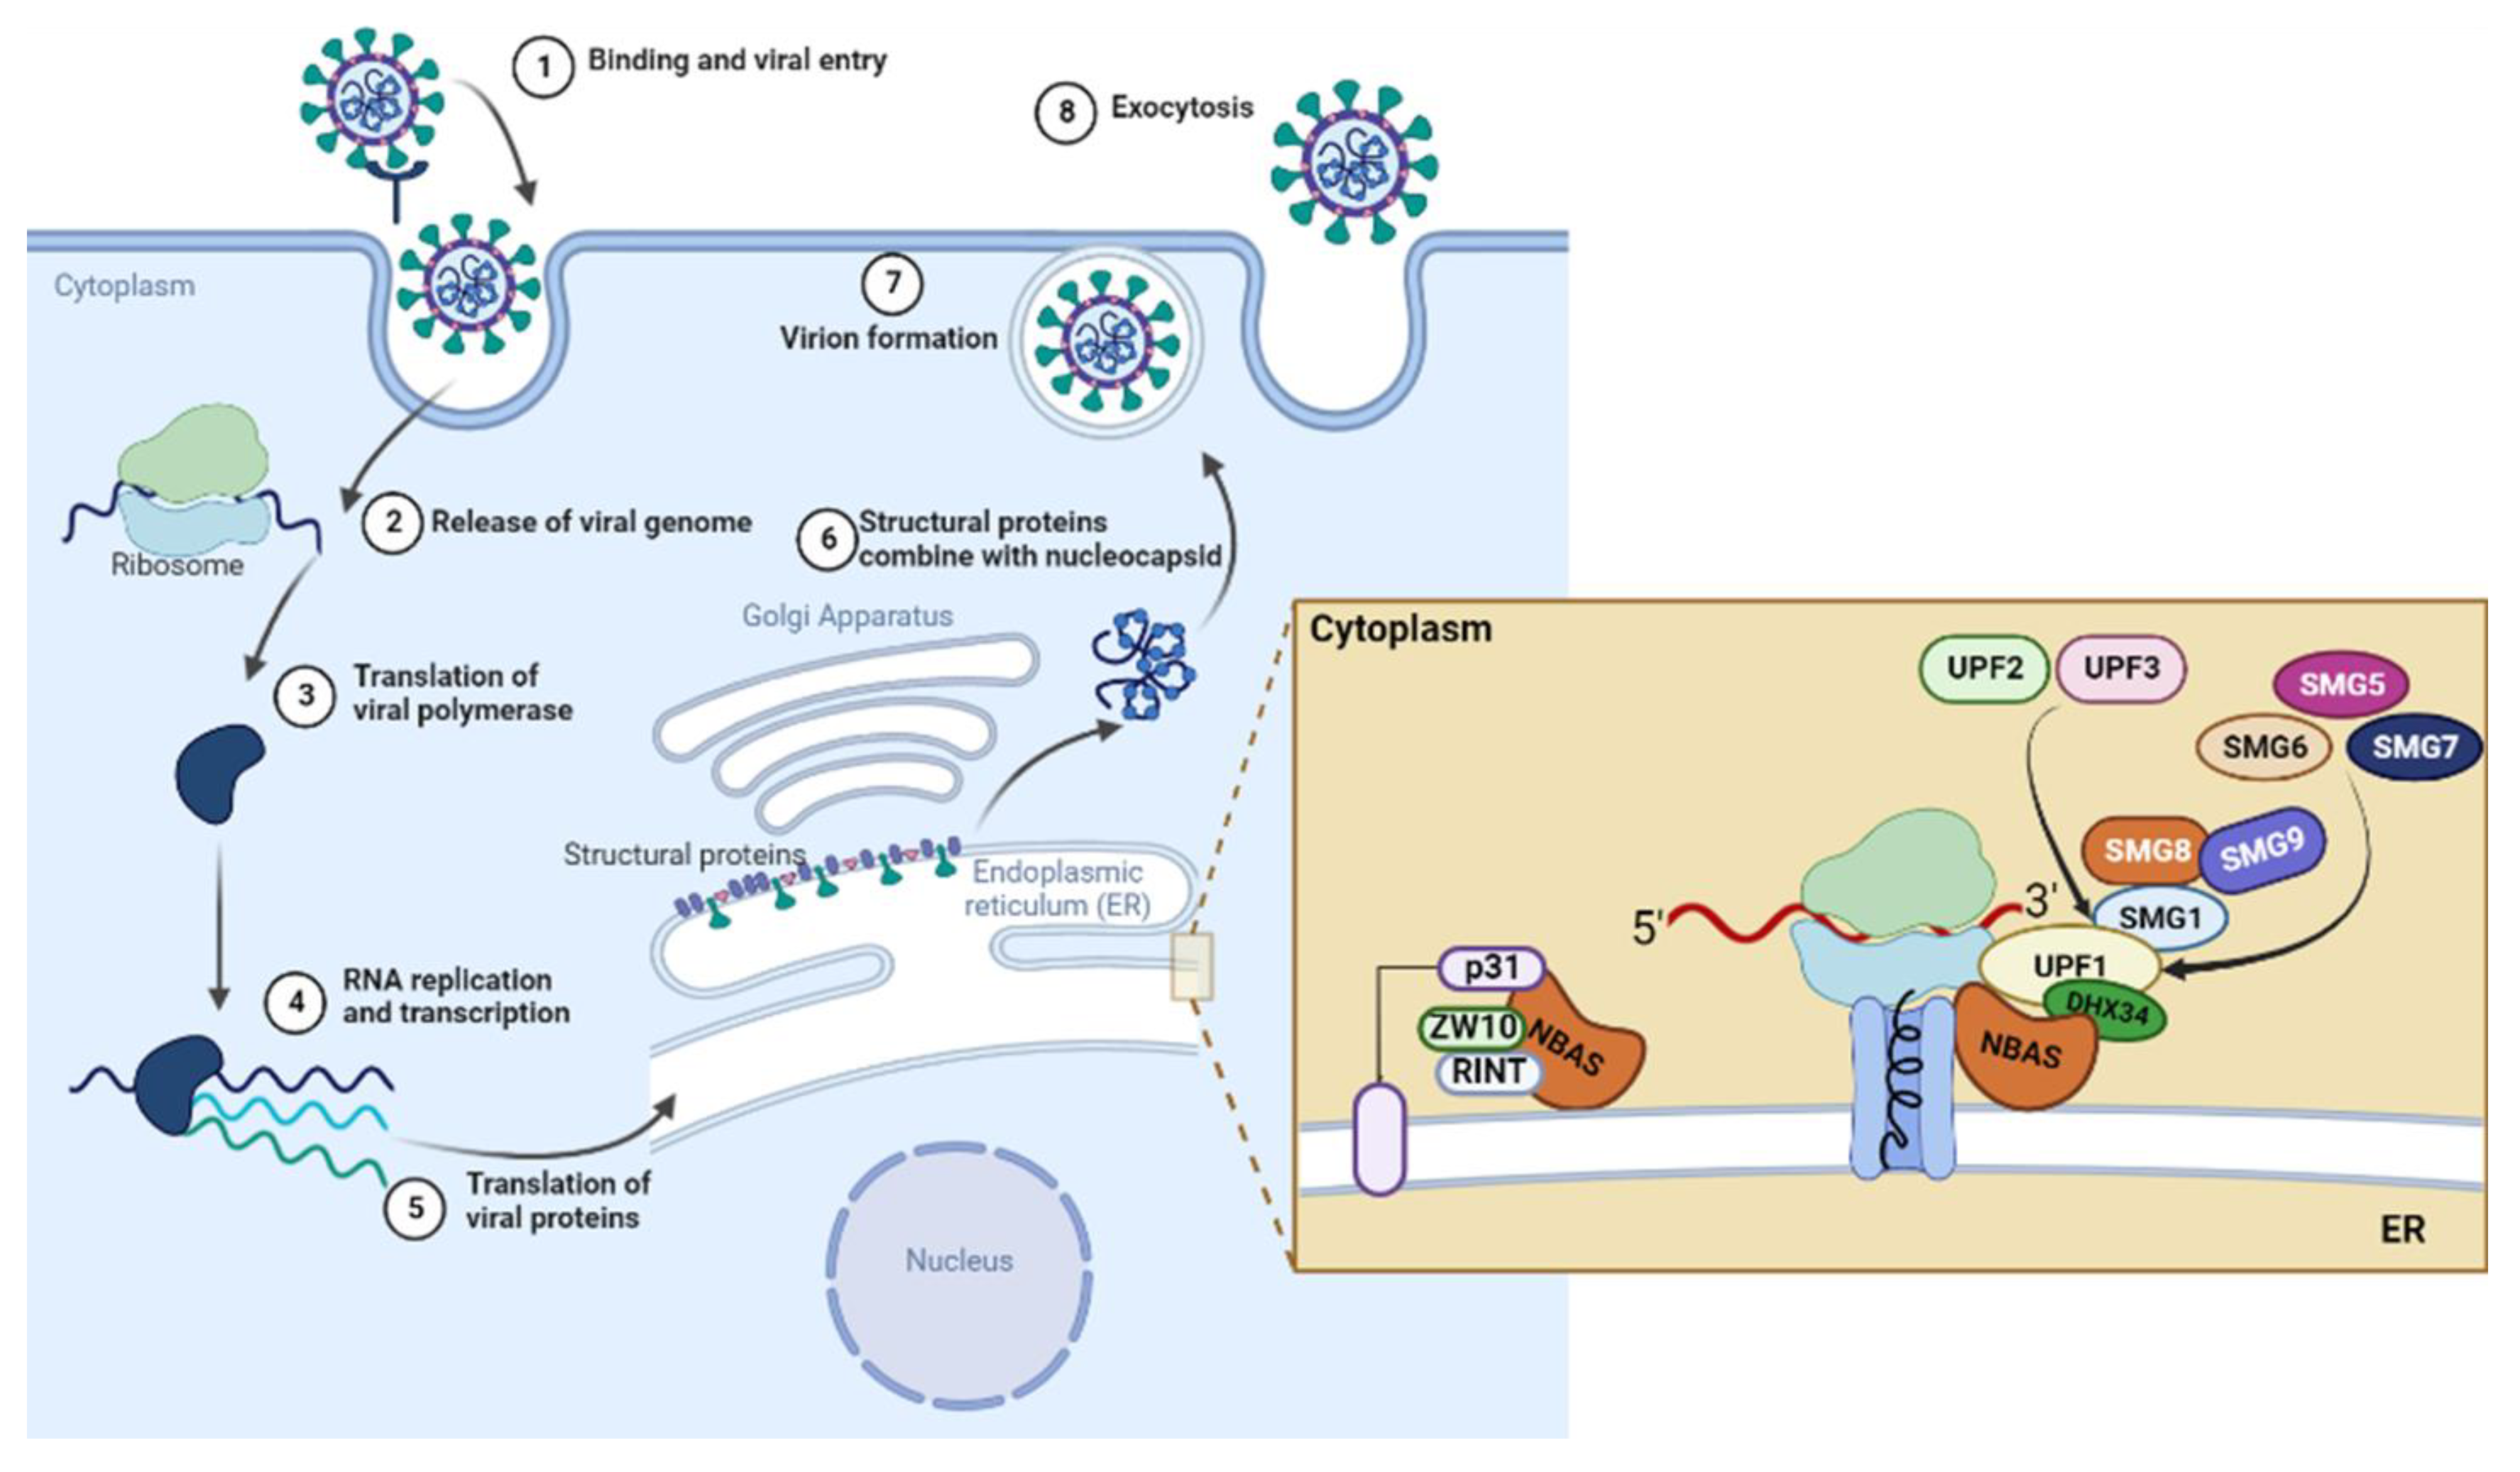
:1. Introduction
2. Results
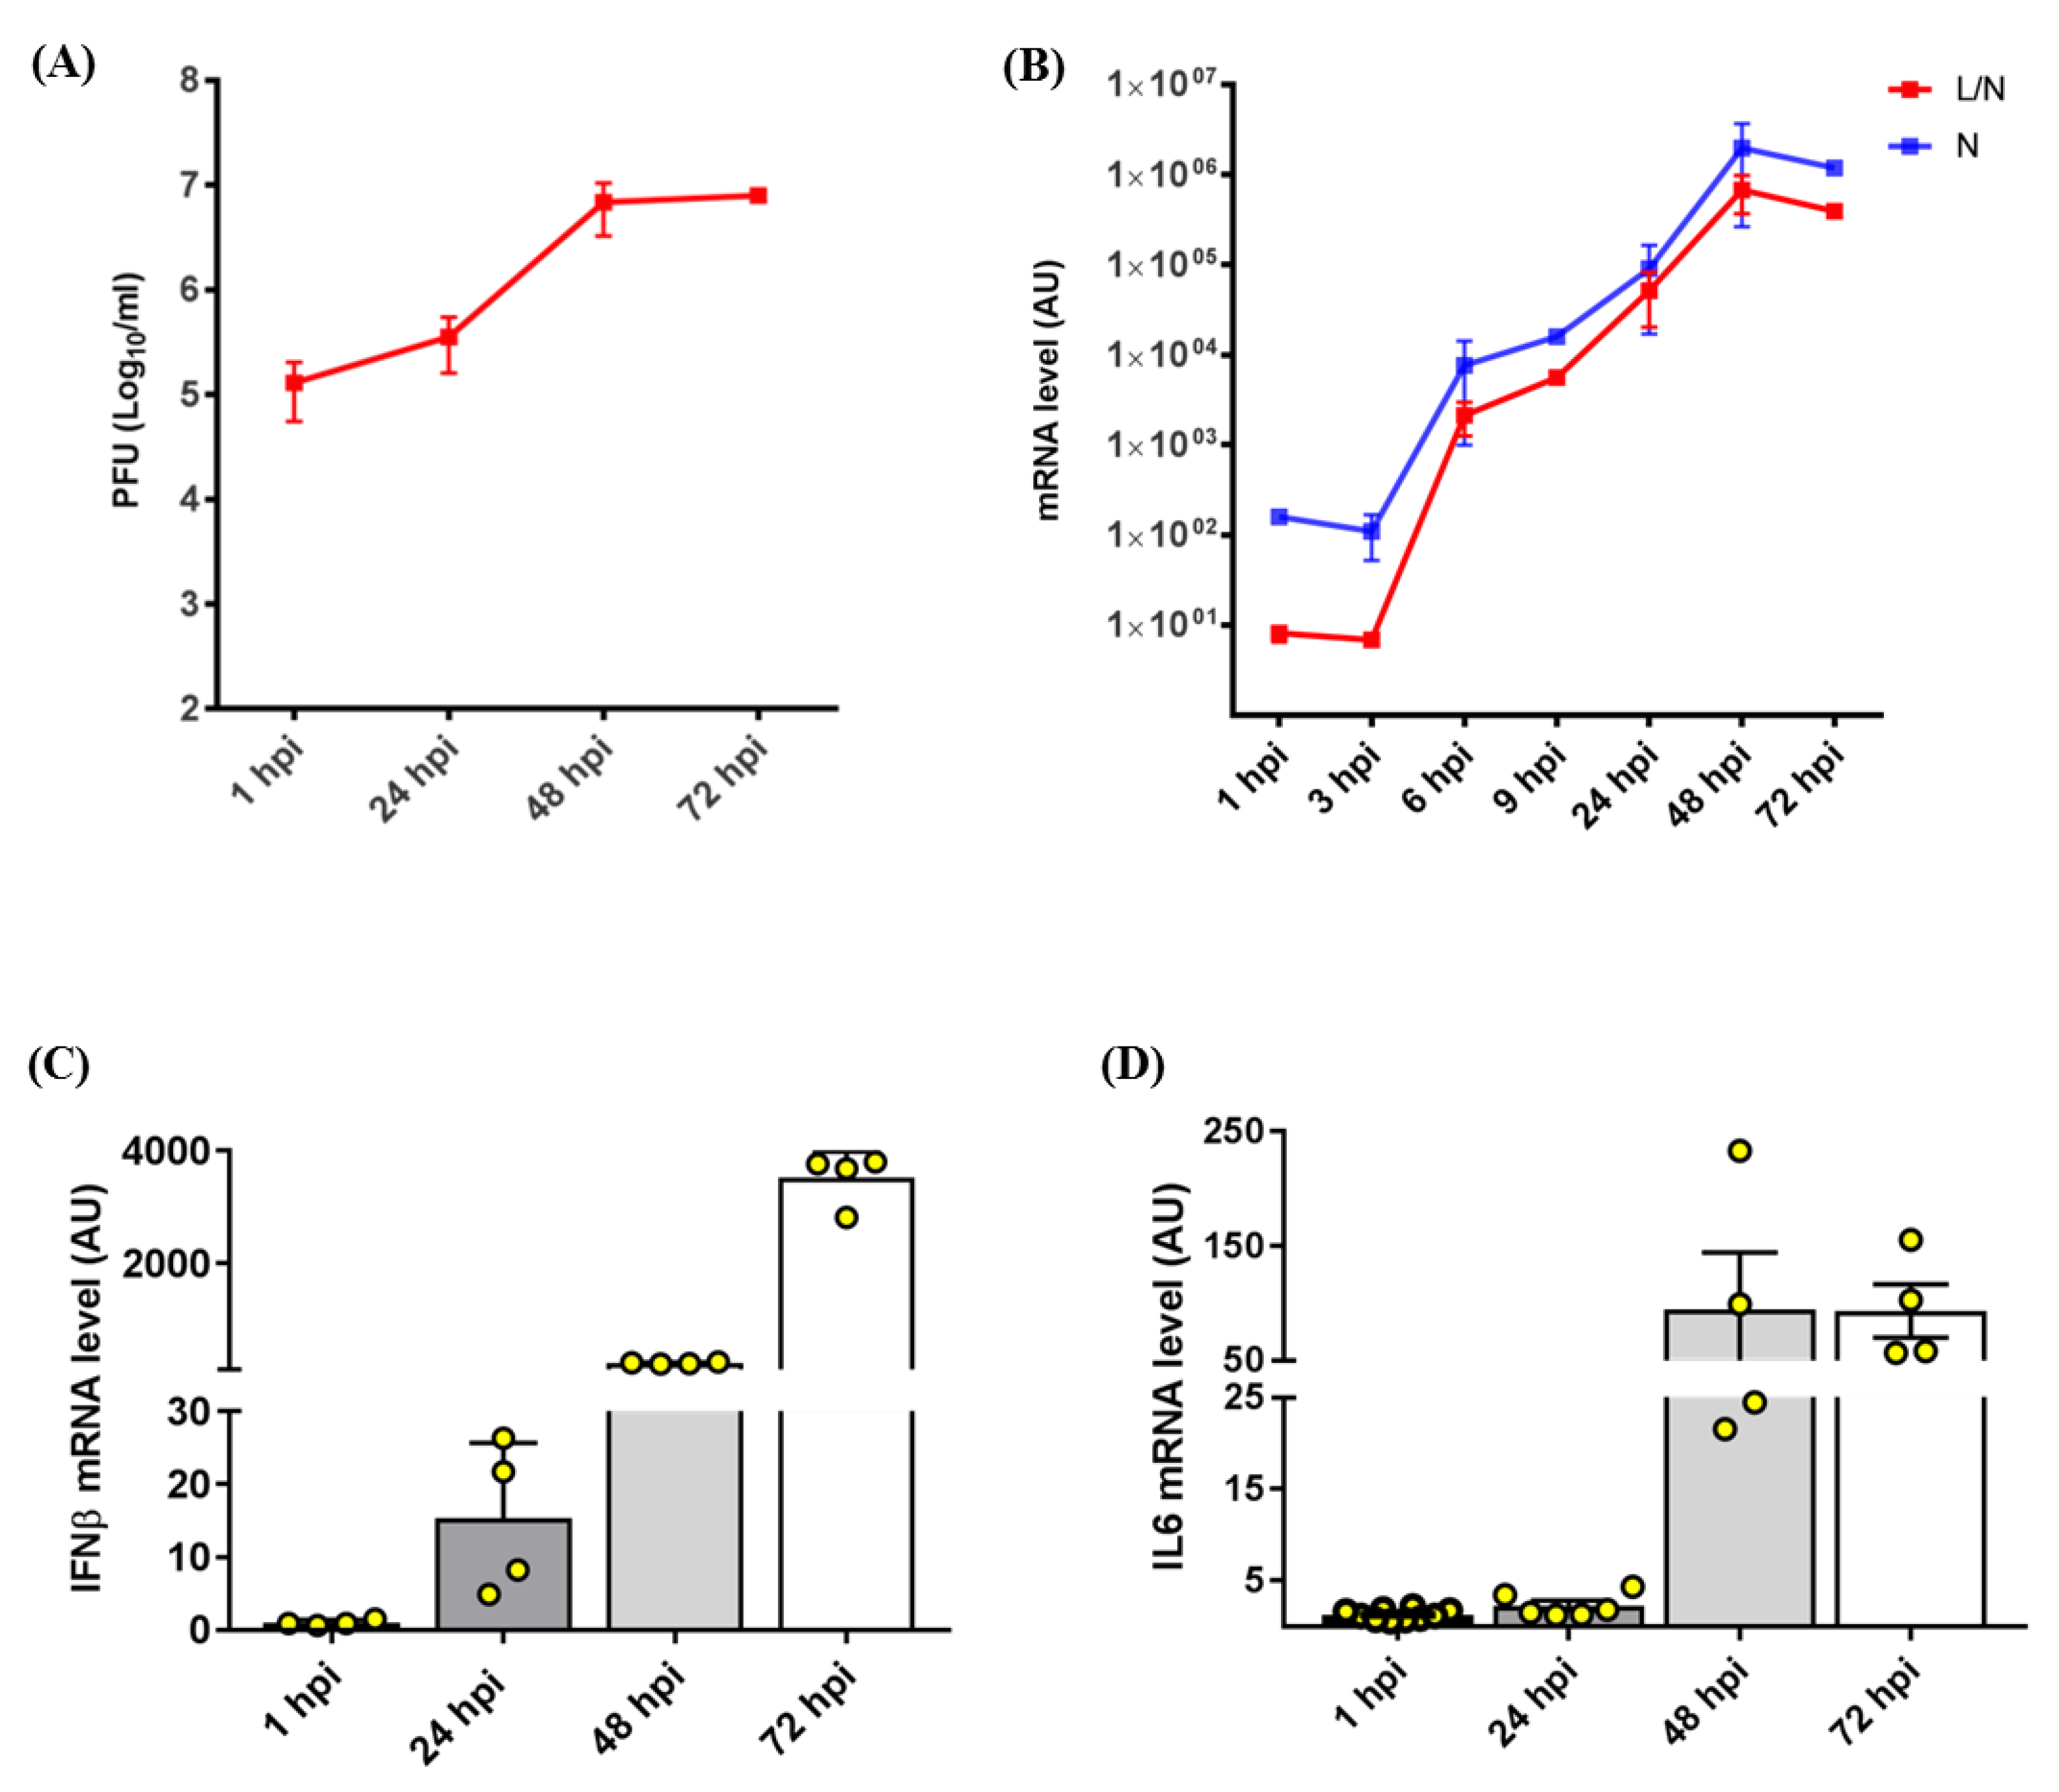
2.1. Establishment of the SARS-CoV-2 Infection Model in the Calu3 Cell Line
2.2. Gene Expression Analysis in SARS-CoV-2-Infected Calu3 Cells
2.2.1. NBAS and NMD Key Factors
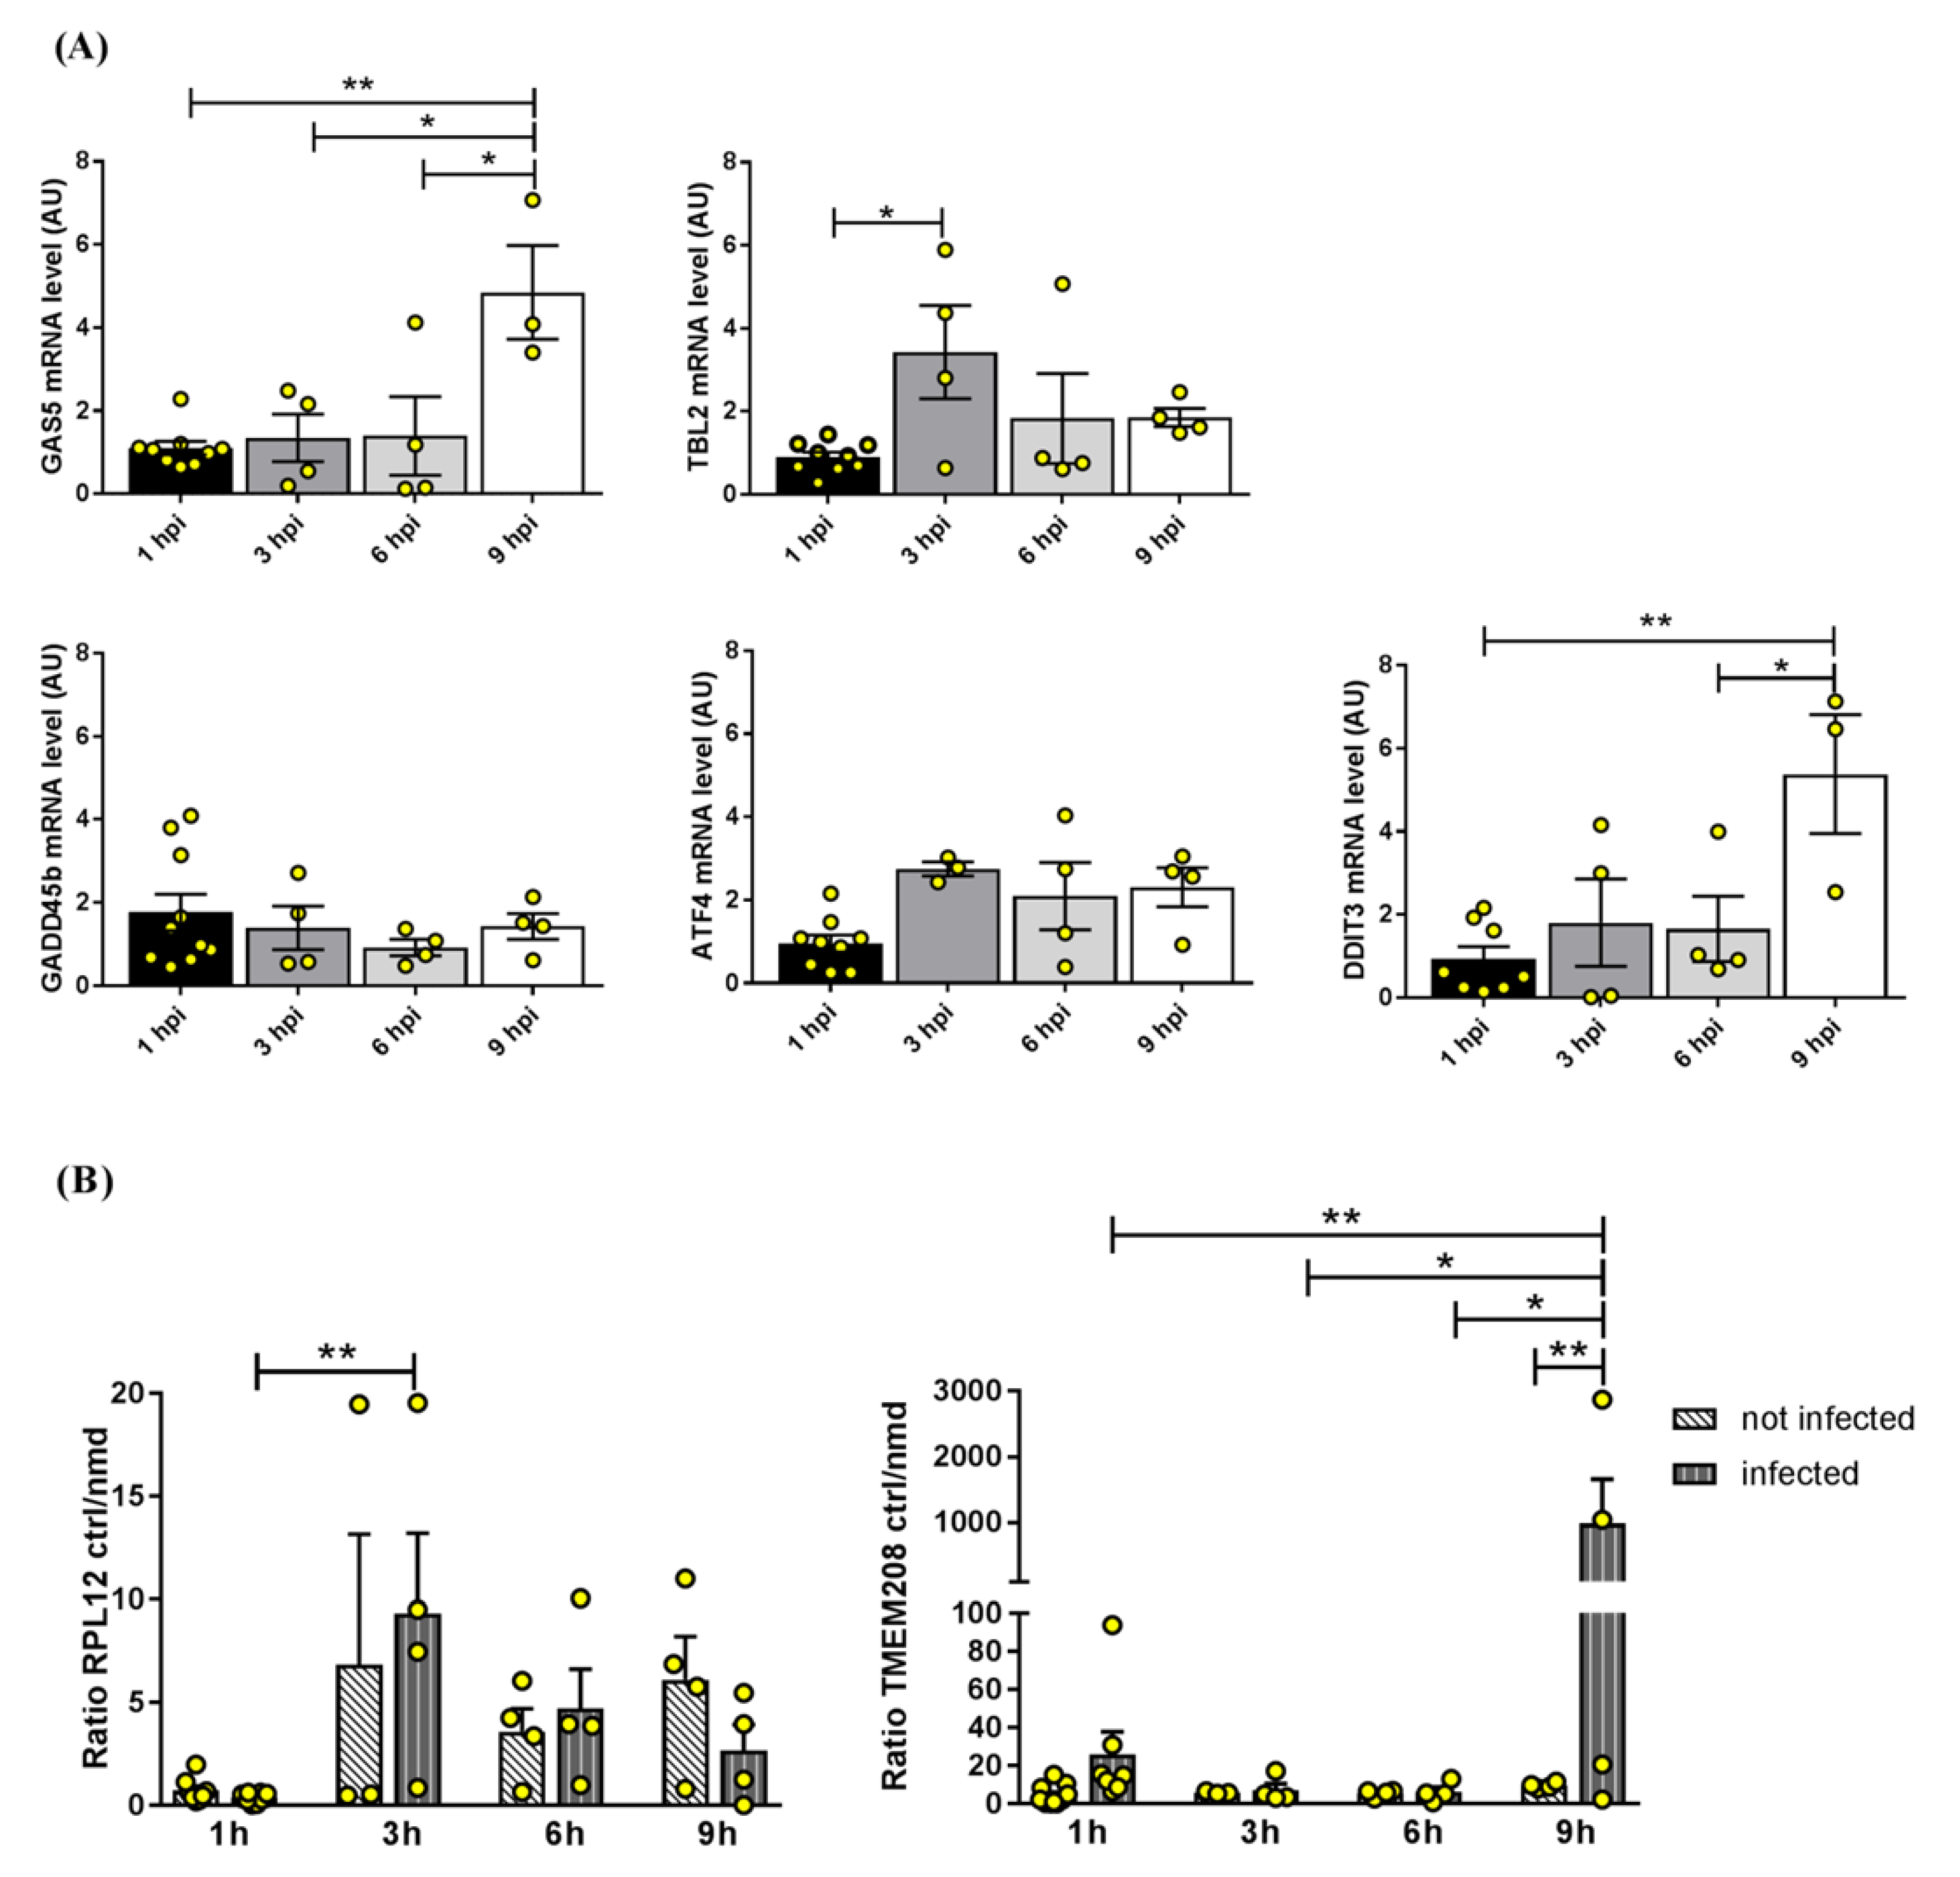
2.2.2. NMD Targets
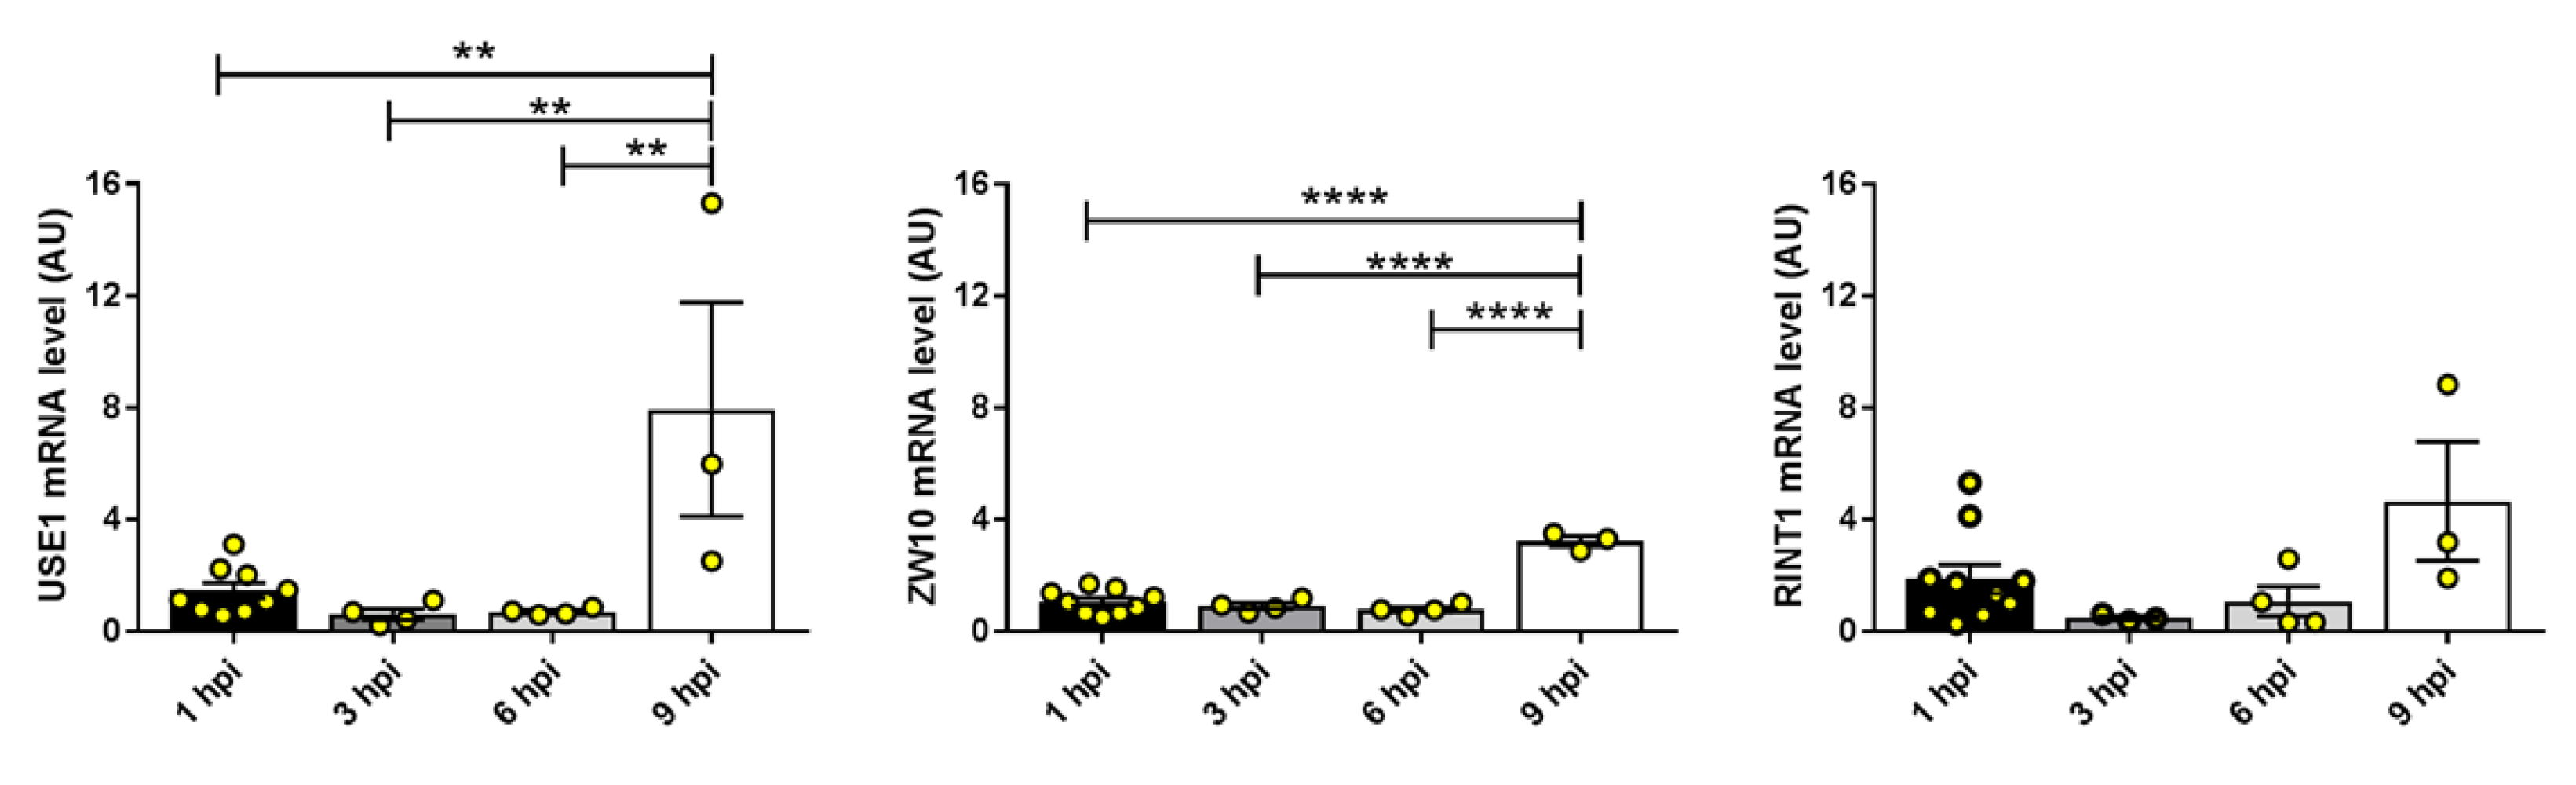
2.2.3. Components of the Syntaxin 18 Complex
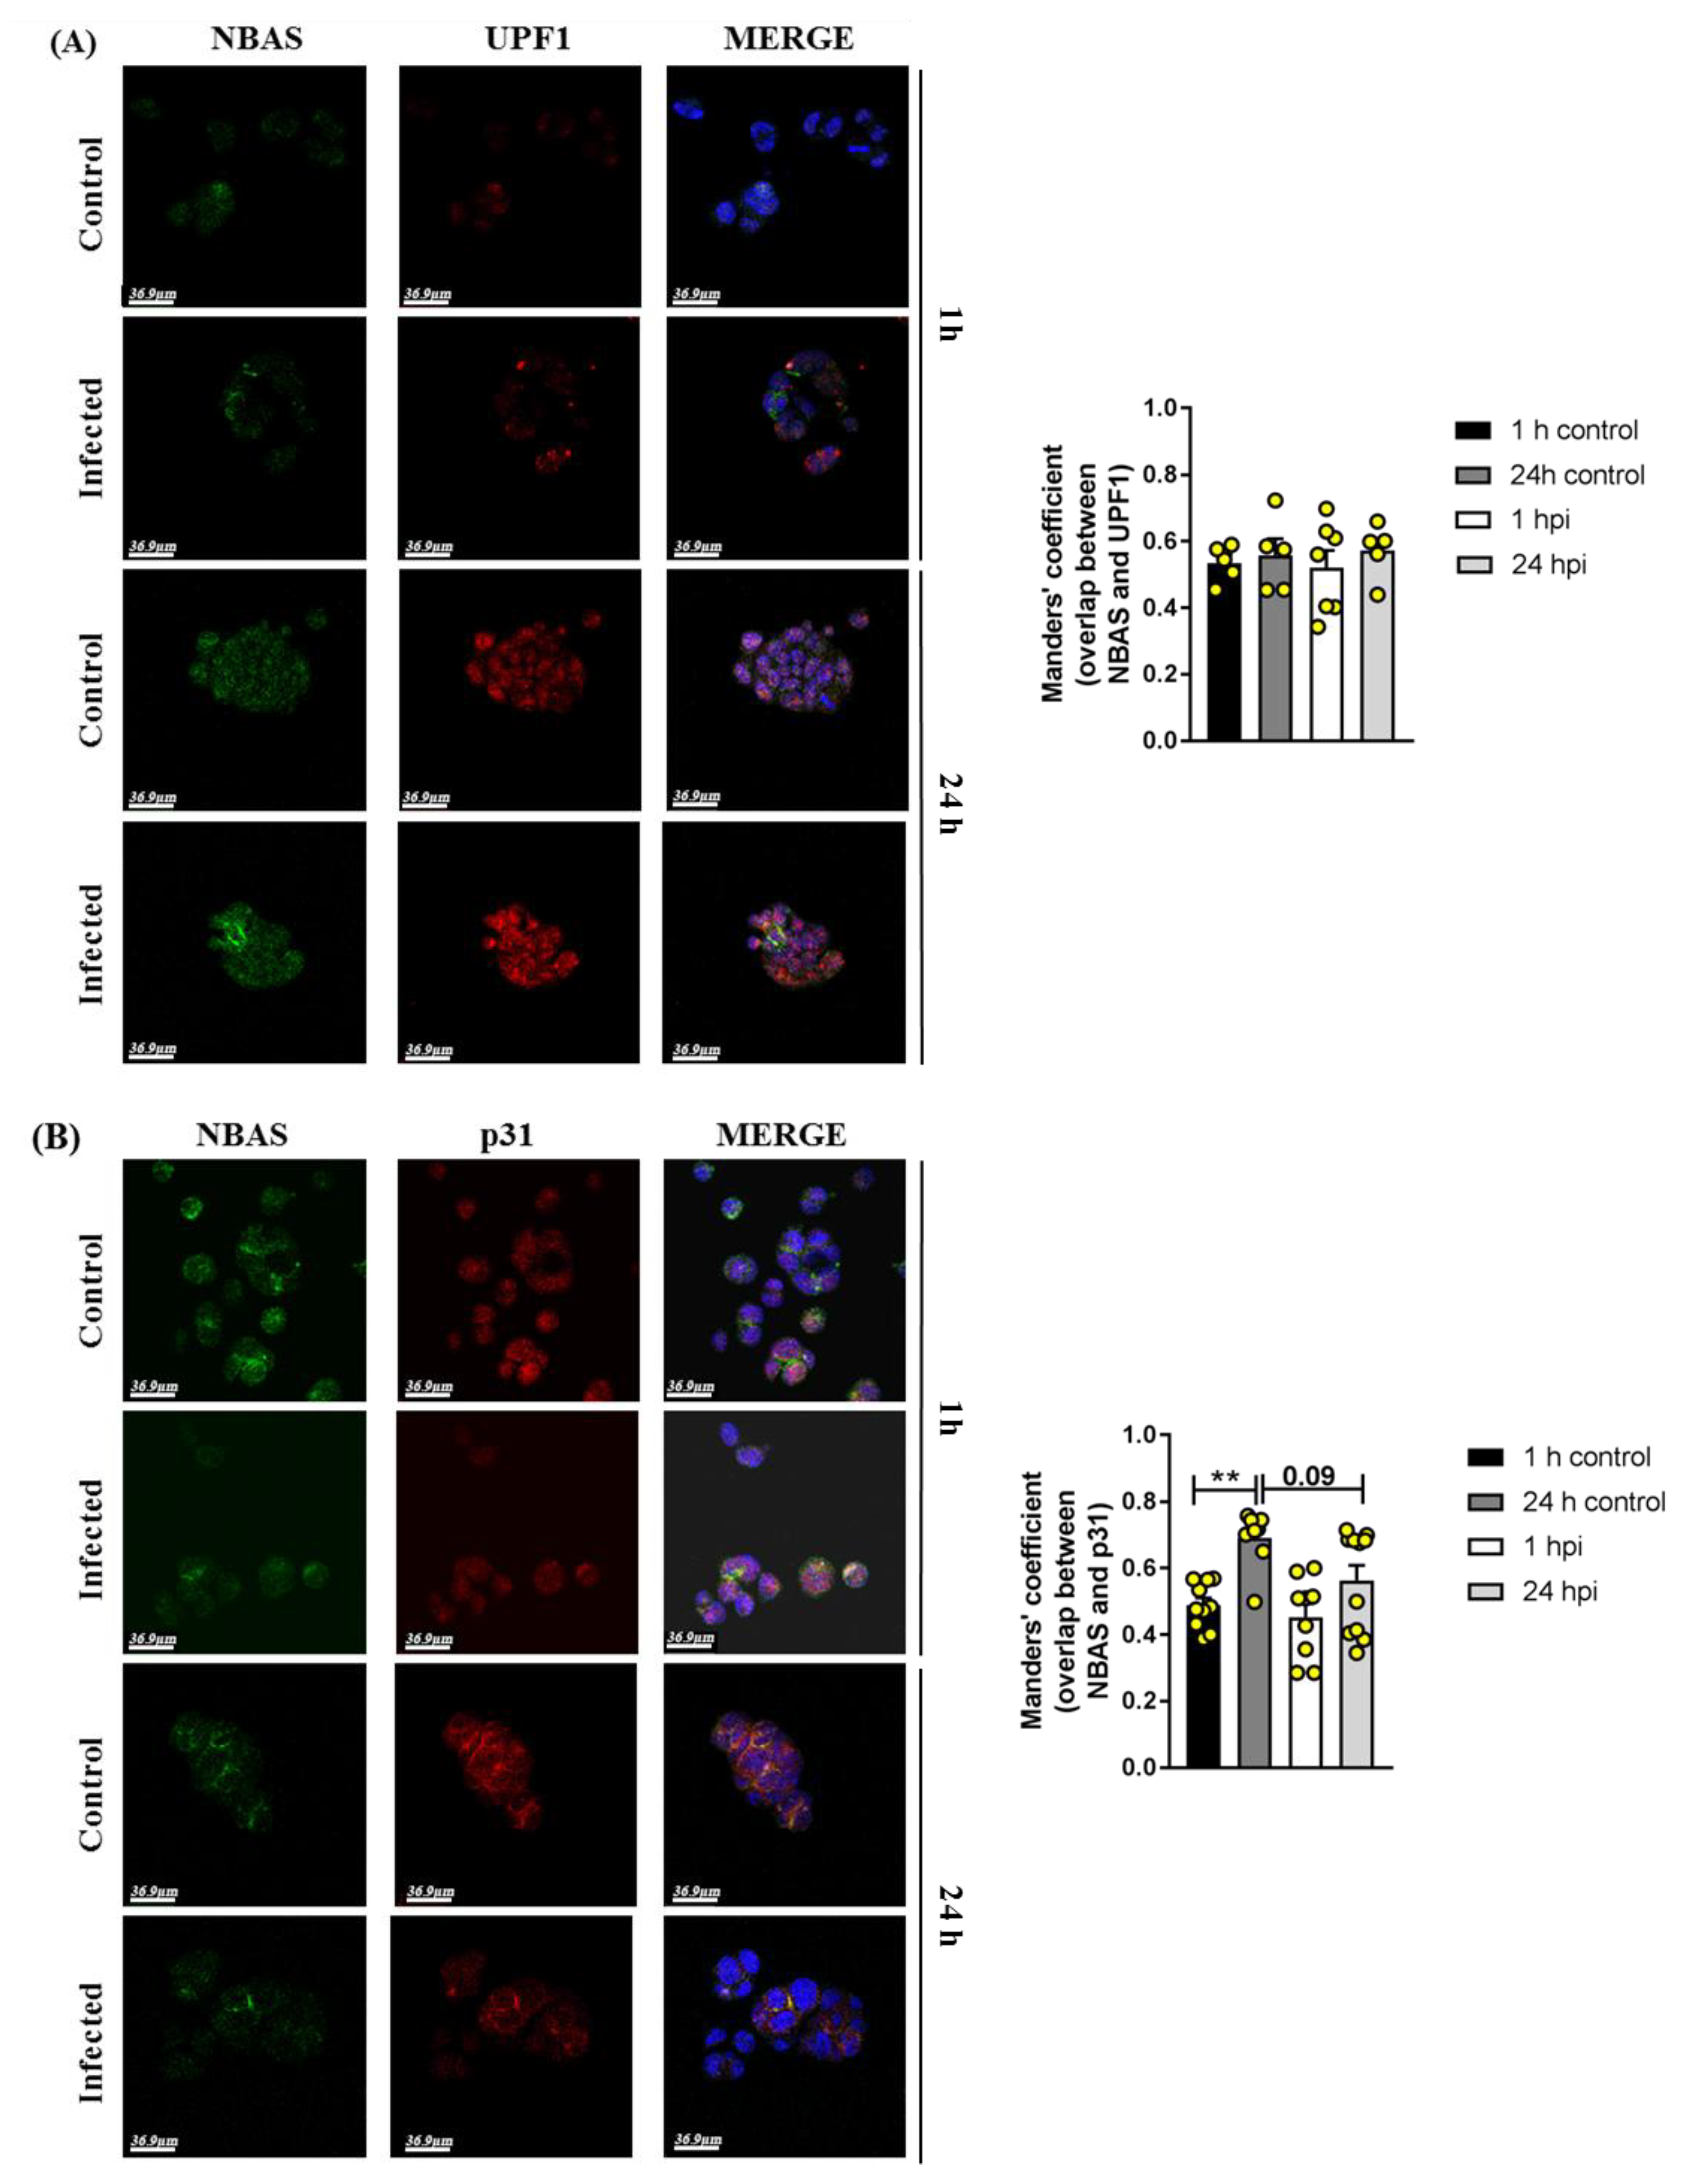
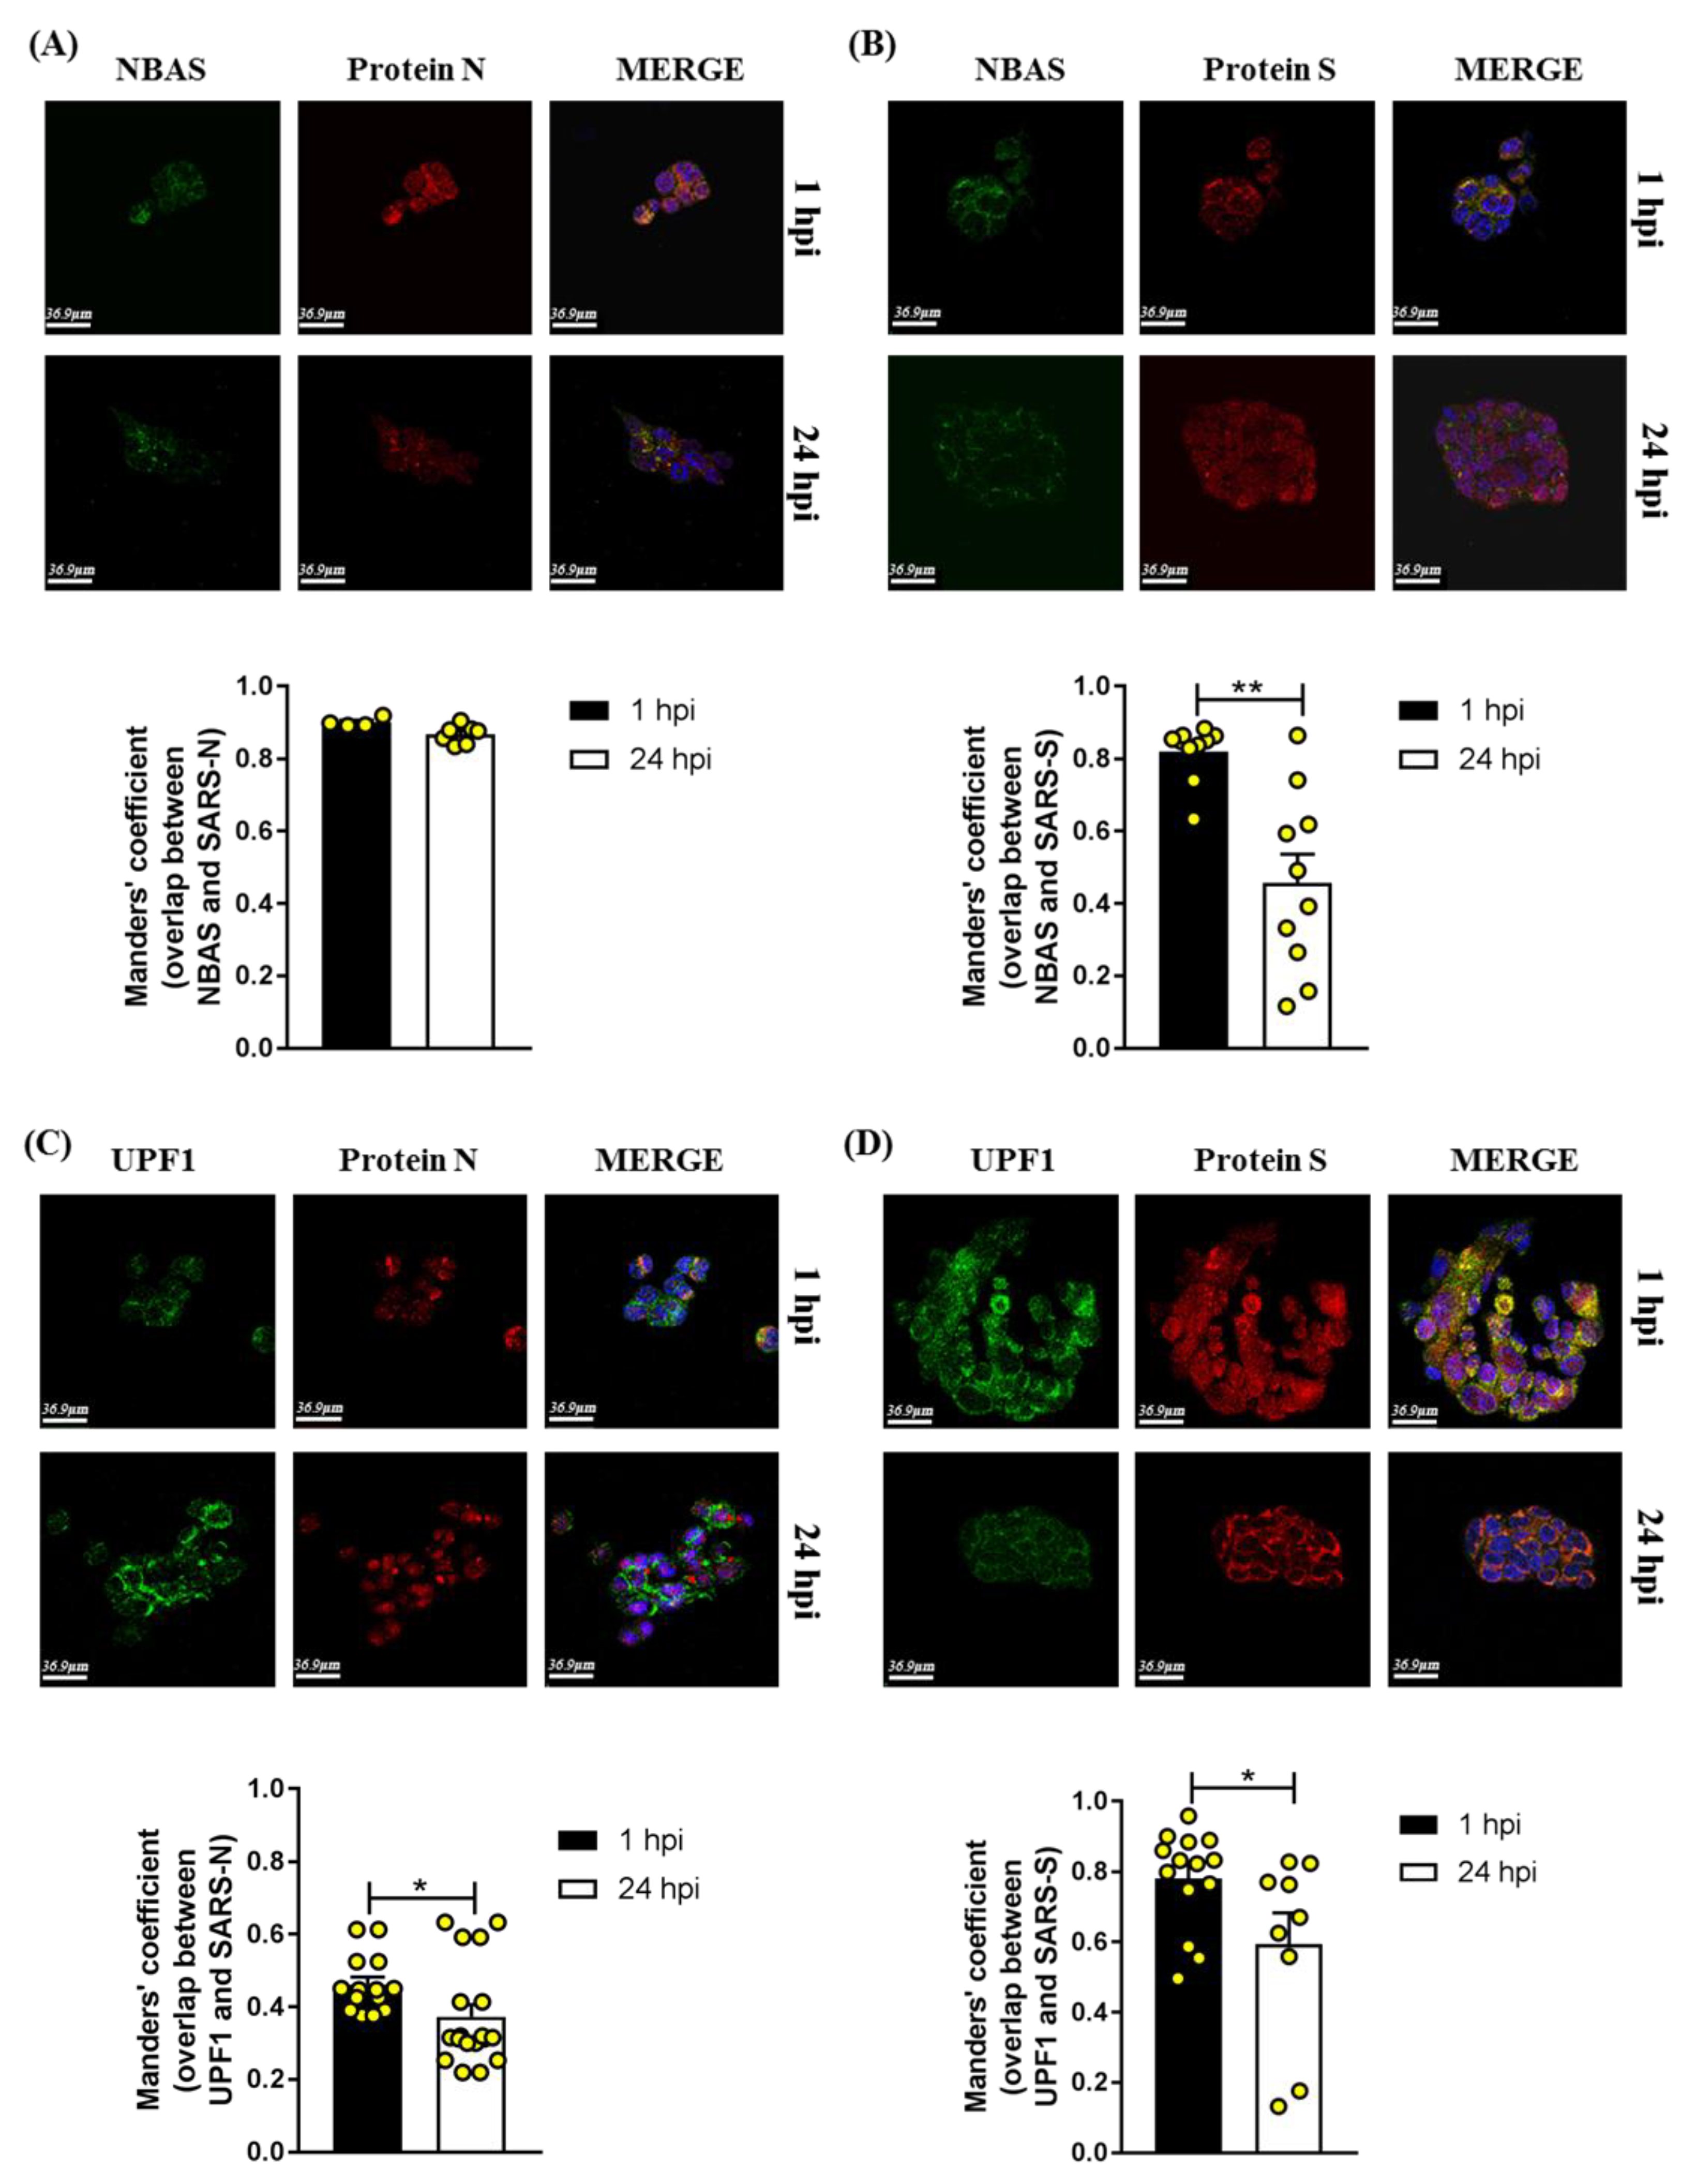
2.3. Immunofluorescence Analysis in SARS-CoV-2-Infected Calu3 Cells
3. Discussion
4. Materials and Methods
4.1. Cells and Viral Isolate
4.2. Viral Infection
4.3. Plaque-Forming Unit Assay
4.4. Real-Time PCR
4.5. Coimmunofluorescence Analysis
4.6. Statistical Analysis
Supplementary Materials
Author Contributions
Funding
Institutional Review Board Statement
Informed Consent Statement
Data Availability Statement
Acknowledgments
Conflicts of Interest
References
- Maranon, D.G.; Anderson, J.R.; Maranon, A.G.; Wilusz, J. The interface between coronaviruses and host cell RNA biology: Novel potential insights for future therapeutic intervention. Wiley Interdiscip. Rev. RNA 2020, 11, e1614. [Google Scholar] [CrossRef]
- V’Kovski, P.; Kratzel, A.; Steiner, S.; Stalder, H.; Thiel, V. Coronavirus biology and replication: Implications for SARS-CoV-2. Nat. Rev. Microbiol. 2021, 19, 155–170. [Google Scholar] [CrossRef]
- Empson, S.; Rogers, A.J.; Wilson, J.G. COVID-19 Acute Respiratory Distress Syndrome: One Pathogen, Multiple Phenotypes. Crit. Care Clin. 2022, 38, 505–519. [Google Scholar] [CrossRef]
- Wada, M.; Lokugamage, K.G.; Nakagawa, K.; Narayanan, K.; Makino, S. Interplay between coronavirus, a cytoplasmic RNA virus, and nonsense-mediated mRNA decay pathway. Proc. Natl. Acad. Sci. USA 2018, 115, E10157–E10166. [Google Scholar] [CrossRef] [Green Version]
- Hoffmann, M.; Kleine-Weber, H.; Schroeder, S.; Kruger, N.; Herrler, T.; Erichsen, S.; Schiergens, T.S.; Herrler, G.; Wu, N.H.; Nitsche, A.; et al. SARS-CoV-2 Cell Entry Depends on ACE2 and TMPRSS2 and Is Blocked by a Clinically Proven Protease Inhibitor. Cell 2020, 181, 271–280.e8. [Google Scholar] [CrossRef]
- Kuba, K.; Yamaguchi, T.; Penninger, J.M. Angiotensin-Converting Enzyme 2 (ACE2) in the Pathogenesis of ARDS in COVID-19. Front. Immunol. 2021, 12, 732690. [Google Scholar] [CrossRef]
- Harrison, A.G.; Lin, T.; Wang, P. Mechanisms of SARS-CoV-2 Transmission and Pathogenesis. Trends Immunol. 2020, 41, 1100–1115. [Google Scholar] [CrossRef]
- Baggen, J.; Vanstreels, E.; Jansen, S.; Daelemans, D. Cellular host factors for SARS-CoV-2 infection. Nat. Microbiol. 2021, 6, 1219–1232. [Google Scholar] [CrossRef]
- Popp, M.W.L.; Cho, H.; Maquat, L.E. Viral subversion of nonsense-mediated mRNA decay. RNA 2020, 26, 1509–1518. [Google Scholar] [CrossRef]
- Karousis, E.D.; Mühlemann, O. The broader sense of nonsense. Trends Biochem. Sci. 2022, 47, 921–935. [Google Scholar] [CrossRef]
- Sirpilla, O.; Bauss, J.; Gupta, R.; Underwood, A.; Qutob, D.; Freeland, T.; Bupp, C.; Carcillo, J.; Hartog, N.; Rajasekaran, S.; et al. SARS-CoV-2-Encoded Proteome and Human Genetics: From Interaction-Based to Ribosomal Biology Impact on Disease and Risk Processes. J. Proteome Res. 2020, 19, 4275–4290. [Google Scholar] [CrossRef]
- Longman, D.; Hug, N.; Keith, M.; Anastasaki, C.; Patton, E.E.; Grimes, G.; Caceres, J.F. DHX34 and NBAS form part of an autoregulatory NMD circuit that regulates endogenous RNA targets in human cells, zebrafish and Caenorhabditis elegans. Nucleic Acids Res. 2013, 41, 8319–8331. [Google Scholar] [CrossRef] [Green Version]
- Anastasaki, C.; Longman, D.; Capper, A.; Patton, E.E.; Caceres, J.F. Dhx34 and Nbas function in the NMD pathway and are required for embryonic development in zebrafish. Nucleic Acids Res. 2011, 39, 3686–3694. [Google Scholar] [CrossRef] [Green Version]
- Aoki, T.; Ichimura, S.; Itoh, A.; Kuramoto, M.; Shinkawa, T.; Isobe, T.; Tagaya, M. Identification of the neuroblastoma-amplified gene product as a component of the syntaxin 18 complex implicated in Golgi-to-endoplasmic reticulum retrograde transport. Mol. Biol. Cell 2009, 20, 2639–2649. [Google Scholar] [CrossRef] [Green Version]
- Ishier, R.O.-B.M.; Santos, J.M.A.; Foresti, O.; Zhang, C.; Garcia-Parajo, M.F.; Campelo, F.; Malhotra, V. TANGO1 builds a machine for collagen export by recruiting and spatially organizing COPII, tethers and membranes. eLife 2018, 7, e32723. [Google Scholar] [CrossRef]
- Palagano, E.; Zuccarini, G.; Prontera, P.; Borgatti, R.; Stangoni, G.; Elisei, S.; Mantero, S.; Menale, C.; Forlino, A.; Uva, P.; et al. Mutations in the Neuroblastoma Amplified Sequence gene in a family affected by Acrofrontofacionasal Dysostosis type 1. Bone 2018, 114, 125–136. [Google Scholar] [CrossRef]
- Ritelli, M.; Palagano, E.; Cinquina, V.; Beccagutti, F.; Chiarelli, N.; Strina, D.; Hall, I.F.; Villa, A.; Sobacchi, C.; Colombi, M. Genome-first approach for the characterization of a complex phenotype with combined NBAS and CUL4B deficiency. Bone 2020, 140, 115571. [Google Scholar] [CrossRef] [PubMed]
- Lenz, D.; Pahl, J.; Hauck, F.; Alameer, S.; Balasubramanian, M.; Baric, I.; Boy, N.; Church, J.A.; Crushell, E.; Dick, A.; et al. NBAS Variants Are Associated with Quantitative and Qualitative NK and B Cell Deficiency. J. Clin. Immunol. 2021, 41, 1781–1793. [Google Scholar] [CrossRef]
- Lacassie, Y.; Johnson, B.; Lay-Son, G.; Quintana, R.; King, A.; Cortes, F.; Alvarez, C.; Gomez, R.; Vargas, A.; Chalew, S.; et al. Severe SOPH syndrome due to a novel NBAS mutation in a 27-year-old woman—Review of this pleiotropic, autosomal recessive disorder: Mystery solved after two decades. Am. J. Med. Genet. Part A 2020, 182, 1767–1775. [Google Scholar] [CrossRef] [PubMed]
- Bi, X.; Zhang, Q.; Chen, L.; Liu, D.; Li, Y.; Zhao, X.; Zhang, Y.; Zhang, L.; Liu, J.; Wu, C.; et al. NBAS, a gene involved in cytotoxic degranulation, is recurrently mutated in pediatric hemophagocytic lymphohistiocytosis. J. Hematol. Oncol. 2022, 15, 101. [Google Scholar] [CrossRef]
- Clementi, N.; Scagnolari, C.; D’Amore, A.; Palombi, F.; Criscuolo, E.; Frasca, F.; Pierangeli, A.; Mancini, N.; Antonelli, G.; Clementi, M.; et al. Naringenin is a powerful inhibitor of SARS-CoV-2 infection in vitro. Pharmacol. Res. 2021, 163, 105255. [Google Scholar] [CrossRef] [PubMed]
- Mycroft-West, C.J.; Su, D.; Pagani, I.; Rudd, T.R.; Elli, S.; Gandhi, N.S.; Guimond, S.E.; Miller, G.J.; Meneghetti, M.C.Z.; Nader, H.B.; et al. Heparin Inhibits Cellular Invasion by SARS-CoV-2: Structural Dependence of the Interaction of the Spike S1 Receptor-Binding Domain with Heparin. Thromb. Haemost. 2020, 120, 1700–1715. [Google Scholar] [CrossRef] [PubMed]
- Yi, Z.; Sanjeev, M.; Singh, G. The Branched Nature of the Nonsense-Mediated mRNA Decay Pathway. Trends Genet. TIG 2021, 37, 143–159. [Google Scholar] [CrossRef] [PubMed]
- Finkel, Y.; Gluck, A.; Nachshon, A.; Winkler, R.; Fisher, T.; Rozman, B.; Mizrahi, O.; Lubelsky, Y.; Zuckerman, B.; Slobodin, B.; et al. SARS-CoV-2 uses a multipronged strategy to impede host protein synthesis. Nature 2021, 594, 240–245. [Google Scholar] [CrossRef]
- Gowravaram, M.; Schwarz, J.; Khilji, S.K.; Urlaub, H.; Chakrabarti, S. Insights into the assembly and architecture of a Staufen-mediated mRNA decay (SMD)-competent mRNP. Nat. Commun. 2019, 10, 5054. [Google Scholar] [CrossRef] [PubMed] [Green Version]
- May, J.P.; Simon, A.E. Targeting of viral RNAs by Upf1-mediated RNA decay pathways. Curr. Opin. Virol. 2021, 47, 1–8. [Google Scholar] [CrossRef]
- Pawlicka, K.; Kalathiya, U.; Alfaro, J. Nonsense-Mediated mRNA Decay: Pathologies and the Potential for Novel Therapeutics. Cancers 2020, 12, 765. [Google Scholar] [CrossRef] [Green Version]
- Mourtada-Maarabouni, M.; Williams, G.T. Growth Arrest on Inhibition of Nonsense-Mediated Decay Is Mediated by Noncoding RNA GAS5. BioMed Res. Int. 2013, 2013, 358015. [Google Scholar] [CrossRef] [Green Version]
- Tsukumo, Y.; Tsukahara, S.; Furuno, A.; Iemura, S.-i.; Natsume, T.; Tomida, A. TBL2 Is a Novel PERK-Binding Protein that Modulates Stress-Signaling and Cell Survival during Endoplasmic Reticulum Stress. PLoS ONE 2014, 9, e112761. [Google Scholar] [CrossRef]
- Humayun, A.; Fornace, A.J., Jr. GADD45 in Stress Signaling, Cell Cycle Control, and Apoptosis. Adv. Exp. Med. Biol. 2022, 1360, 1–22. [Google Scholar] [CrossRef]
- Wengrod, J.; Martin, L.; Wang, D.; Frischmeyer-Guerrerio, P.; Dietz, H.C.; Gardner, L.B. Inhibition of Nonsense-Mediated RNA Decay Activates Autophagy. Mol. Cell. Biol. 2013, 33, 2128–2135. [Google Scholar] [CrossRef] [Green Version]
- Márton, M.; Bánhegyi, G.; Gyöngyösi, N.; Kálmán, E.É.; Pettkó-Szandtner, A.; Káldi, K.; Kapuy, O. A systems biological analysis of the ATF4-GADD34-CHOP regulatory triangle upon endoplasmic reticulum stress. FEBS Open Bio 2022, 12, 2065–2082. [Google Scholar] [CrossRef] [PubMed]
- Hauer, C.; Sieber, J.; Schwarzl, T.; Hollerer, I.; Curk, T.; Alleaume, A.-M.; Hentze, M.W.; Kulozik, A.E. Exon Junction Complexes Show a Distributional Bias toward Alternatively Spliced mRNAs and against mRNAs Coding for Ribosomal Proteins. Cell Rep. 2016, 16, 1588–1603. [Google Scholar] [CrossRef] [Green Version]
- Li, Y.; Wan, L.; Zhang, L.; Zhuo, Z.; Luo, X.; Cui, J.; Liu, Y.; Su, F.; Tang, M.; Xiao, F. Evaluating the activity of nonsense-mediated RNA decay via Nanopore direct RNA sequencing. Biochem. Biophys. Res. Commun. 2022, 621, 67–73. [Google Scholar] [CrossRef]
- Banday, A.R.; Stanifer, M.L.; Florez-Vargas, O.; Onabajo, O.O.; Zahoor, M.A.; Papenberg, B.W.; Ring, T.J.; Lee, C.-H.; Andreakos, E.; Arons, E.; et al. Genetic regulation of OAS1 nonsense-mediated decay underlies association with risk of severe COVID-19. medRxiv 2021. [Google Scholar] [CrossRef]
- Longman, D.; Jackson-Jones, K.A.; Maslon, M.M.; Murphy, L.C.; Young, R.S.; Stoddart, J.J.; Hug, N.; Taylor, M.S.; Papadopoulos, D.K.; Caceres, J.F. Identification of a localized nonsense-mediated decay pathway at the endoplasmic reticulum. Genes Dev. 2020, 34, 1075–1088. [Google Scholar] [CrossRef] [PubMed]
- Lejeune, F. Nonsense-Mediated mRNA Decay, a Finely Regulated Mechanism. Biomedicines 2022, 10, 141. [Google Scholar] [CrossRef] [PubMed]
- Park, B.K.; Kim, D.; Park, S.; Maharjan, S.; Kim, J.; Choi, J.K.; Akauliya, M.; Lee, Y.; Kwon, H.J. Differential Signaling and Virus Production in Calu-3 Cells and Vero Cells upon SARS-CoV-2 Infection. Biomol. Ther. 2021, 29, 273–281. [Google Scholar] [CrossRef]
- Balistreri, G.; Bognanni, C.; Muhlemann, O. Virus Escape and Manipulation of Cellular Nonsense-Mediated mRNA Decay. Viruses 2017, 9, 24. [Google Scholar] [CrossRef]
- Nasif, S.; Contu, L.; Muhlemann, O. Beyond quality control: The role of nonsense-mediated mRNA decay (NMD) in regulating gene expression. Semin. Cell Dev. Biol. 2018, 75, 78–87. [Google Scholar] [CrossRef]
- O’Donoghue, S.I.; Schafferhans, A.; Sikta, N.; Stolte, C.; Kaur, S.; Ho, B.K.; Anderson, S.; Procter, J.B.; Dallago, C.; Bordin, N.; et al. SARS-CoV-2 structural coverage map reveals viral protein assembly, mimicry, and hijacking mechanisms. Mol. Syst. Biol. 2021, 17, e10079. [Google Scholar] [CrossRef]
- Cortese, M.; Lee, J.Y.; Cerikan, B.; Neufeldt, C.J.; Oorschot, V.M.J.; Kohrer, S.; Hennies, J.; Schieber, N.L.; Ronchi, P.; Mizzon, G.; et al. Integrative Imaging Reveals SARS-CoV-2-Induced Reshaping of Subcellular Morphologies. Cell Host Microbe 2020, 28, 853–866.e5. [Google Scholar] [CrossRef] [PubMed]
- Sato, H.; Singer, R.H. Cellular variability of nonsense-mediated mRNA decay. Nat. Commun. 2021, 12, 7203. [Google Scholar] [CrossRef] [PubMed]
- Robinson, M.; Schor, S.; Barouch-Bentov, R.; Einav, S. Viral journeys on the intracellular highways. Cell. Mol. Life Sci. CMLS 2018, 75, 3693–3714. [Google Scholar] [CrossRef] [PubMed]
- Lontok, E.; Corse, E.; Machamer, C.E. Intracellular targeting signals contribute to localization of coronavirus spike proteins near the virus assembly site. J. Virol. 2004, 78, 5913–5922. [Google Scholar] [CrossRef] [PubMed] [Green Version]
- Hackstadt, T.; Chiramel, A.I.; Hoyt, F.H.; Williamson, B.N.; Dooley, C.A.; Beare, P.A.; de Wit, E.; Best, S.M.; Fischer, E.R. Disruption of the Golgi Apparatus and Contribution of the Endoplasmic Reticulum to the SARS-CoV-2 Replication Complex. Viruses 2021, 13, 1798. [Google Scholar] [CrossRef] [PubMed]
- Ricciardi, S.; Guarino, A.M.; Giaquinto, L.; Polishchuk, E.V.; Santoro, M.; Di Tullio, G.; Wilson, C.; Panariello, F.; Soares, V.C.; Dias, S.S.G.; et al. The role of NSP6 in the biogenesis of the SARS-CoV-2 replication organelle. Nature 2022, 606, 761–768. [Google Scholar] [CrossRef]
- Rovere-Querini, P.; Tresoldi, C.; Conte, C.; Ruggeri, A.; Ghezzi, S.; De Lorenzo, R.; Di Filippo, L.; Farina, N.; Ramirez, G.A.; Ripa, M.; et al. Biobanking for COVID-19 research. Panminerva Med. 2020, 64, 244–252. [Google Scholar] [CrossRef]
- Stravalaci, M.; Pagani, I.; Paraboschi, E.M.; Pedotti, M.; Doni, A.; Scavello, F.; Mapelli, S.N.; Sironi, M.; Perucchini, C.; Varani, L.; et al. Recognition and inhibition of SARS-CoV-2 by humoral innate immunity pattern recognition molecules. Nat. Immunol. 2022, 23, 275–286. [Google Scholar] [CrossRef] [PubMed]


| Genes | Forward Primer Sequences (5′-3′) | Reverse Primer Sequences (5′-3′) |
|---|---|---|
| NBAS | GCAGTACAAGAGGATGAAGTAGG | AGGACTTTCATGGTGGTAGC |
| DHX34 | TGGGATGGACACAAGTTCATT | GACCGGAAGTTAAGGCGTTC |
| UPF1 | CAACGAGCACCAAGGCATT | ATGACGCCATACCTTGCTCT |
| UPF2 | AATTCTCAATCCTTAGCAGACCT | CAGGCCCATGTTCTTCTGGT |
| UPF3 | CCCGGTGCAGTCGTAAAA | TTATCACTGCCGCTGTGTG |
| UPF3B | AAGAAGCGCTGAGCAAGGT | CATGCTCAGGCATAGGTTGA |
| SMG1 | GCACCTGAAGTAGCCAAATCT | TTCTCCCTGACTGGCATTGT |
| SMG5 | CCAGGCACAGTTCCGAAT | ATGTCTCTCATGAGCCTGTTCC |
| SMG6 | CGGGATCCTGGCTACTCTG | CCTGGCCTCCTTTAATTCCT |
| SMG7 | GAAAGCAGAATGTGGCAGTG | TGGGGTTTGAGTTACAGGTGTT |
| SMG8 | CCATCAGCTCTGTGAGGAGA | AGCACAGGCGGATTTCTATC |
| SMG9 | TTGCACCATGGGAAAGAGA | GAGGTGGTGGCTGTTTTGAC |
| ATF4 | TCTCCAGCGACAAGGCTAA | CCAATCTGTCCCGGAGAA |
| GAS5 | GCATTAGACAGAAACTGGAAGT | CATGGATAAAAACGTTACCAGGA |
| GADD45B | CATTGTCTCCTGGTCACGAA | TAGGGGACCCACTGGTTGT |
| TBL2 | TTCAGCCCTGACTGCAGAG | TTGAAGACACGGAGGGTGT |
| STAU1 | TGCCAAAGCGTTGAGGAT | TCTTCTTCGGATTCTCTTCCAT |
| IL6 | AAATTCGGTACATCCTCGACG | GGAAGGTTCAGGTTGTTTTCTGC |
| DDIT3 | TGGAAGCCTGGTATGAGGAC | TGTGACCTCTGCTGGTTCTG |
| 18S | CGCAGCTAGGAATAATGGAATAGG | CATGGCCTCAGTTCCGAAA |
| IFN-B | CCAACAAGTGTCTCCTCCAAATT | GTAGGAATCCAAGCAAGTTGTAGCT |
| GAPDH | CCACCCATGGCAAATTCC | TGGGATTTCCATTGATGACAAG |
| USE1 | GAAGGACAACCAGACCCTGTC | GACGCTCTGACTCCGTCTTC |
| RINT1 | CAGTGCCCCGGAGATATACA | TGCTTTGGCTCAGTAAGTAATTCA |
| ZW10 | TGTTGTACCAACATATCACAAGGA | CATACAGTTGTTGTGATGAATAGCAG |
| RPL12-CTRL | GTGCAACTTCCTTCGGTCGT | CGTTGCCTTGGCAATGTCAT |
| RPL12-NMD | GAGGACTGGACCACCTGTGG | CGTTGCCTTGGCAATGTCAT |
| TMEM208-CTRL | GTTGGCCCTGGGCTTTAGTC | GAGAAGCAGCTGAGCACCTG |
| TMEM208-NMD | GTTGGCCCTGGGCTTTAGTC | CGGTGGGGGACACTCA |
Disclaimer/Publisher’s Note: The statements, opinions and data contained in all publications are solely those of the individual author(s) and contributor(s) and not of MDPI and/or the editor(s). MDPI and/or the editor(s) disclaim responsibility for any injury to people or property resulting from any ideas, methods, instructions or products referred to in the content. |
© 2023 by the authors. Licensee MDPI, Basel, Switzerland. This article is an open access article distributed under the terms and conditions of the Creative Commons Attribution (CC BY) license (https://creativecommons.org/licenses/by/4.0/).
Share and Cite
Granata, V.; Pagani, I.; Morenghi, E.; Schiavone, M.L.; Lezzi, A.; Ghezzi, S.; Vicenzi, E.; Poli, G.; Sobacchi, C. Modulation of NBAS-Related Functions in the Early Response to SARS-CoV-2 Infection. Int. J. Mol. Sci. 2023, 24, 2634. https://doi.org/10.3390/ijms24032634
Granata V, Pagani I, Morenghi E, Schiavone ML, Lezzi A, Ghezzi S, Vicenzi E, Poli G, Sobacchi C. Modulation of NBAS-Related Functions in the Early Response to SARS-CoV-2 Infection. International Journal of Molecular Sciences. 2023; 24(3):2634. https://doi.org/10.3390/ijms24032634
Chicago/Turabian StyleGranata, Valentina, Isabel Pagani, Emanuela Morenghi, Maria Lucia Schiavone, Alessandra Lezzi, Silvia Ghezzi, Elisa Vicenzi, Guido Poli, and Cristina Sobacchi. 2023. "Modulation of NBAS-Related Functions in the Early Response to SARS-CoV-2 Infection" International Journal of Molecular Sciences 24, no. 3: 2634. https://doi.org/10.3390/ijms24032634