
1. Questions
Numerous studies have reported the negative impact of the COVID-19 pandemic on transit ridership in North America (Kapatsila and Grise 2021; Liu, Miller, and Scheff 2020), with more recent research efforts focusing on the changes that happened during the pandemic. For example, using convenience sampling, Palm et al. (2021) documented that among respondents who stopped riding transit in May 2020, 73% returned to it at least occasionally by March 2021, and 14% acquired a car during the pandemic in Vancouver, Canada. Understanding the ripple effects of these trends on the operational feasibility of public transit, this study utilizes a rich panel-based dataset to investigate whether changes in ridership and car ownership through the pandemic can be observed at an individual level.
Similarly, despite the low risk of surface transmission of COVID-19 on public transit (Green, Zhou, and Desouza 2021), the official guidance has largely focused on the importance of keeping physical distance to prevent viral transmission (World Health Organization 2020), which implies effective management of crowding. While the expectation of discomfort and negative attitudes towards public transit prevailed during the pandemic (Ozbilen, Slagle, and Akar 2021), Metro Vancouver experienced slow growth of ridership that reached 50% of pre-pandemic levels in July 2021 (Chan 2021). To sustain this trend, it is necessary to maintain the station and in-vehicle occupancy levels that are both safe and acceptable for riders. Accordingly, this study examines how individuals’ perceptions of transit crowding changed throughout the pandemic.
2. Methods
We contracted a polling and market research company, Leger, to distribute two waves of a transit ridership survey using hard age and gender quotas in December 2020 and May 2021. With more than a thousand respondents per wave, the comparison between sample moments did not show significant changes in long-term travel behavior and perceptions, which we assumed to be the result of the cross-sectional nature of the data (participants were invited randomly from the pool of Leger’s contacts). The relatively short time between the waves (5 months) can be another reason for the very small difference between the December 2020 and May 2021 responses. Looking back, we recognize that there have been no major changes in restrictions between the two periods and conducting the second wave of the survey in mid or late summer of 2021 might have provided more insights into the effects of the COVID-19 measures on public transit. However, we believe that there has been a change to transport behavior and looking at the period of relative stability during the pandemic increases our understanding of its potential effects on public transit riders once no more restrictions will be in place. We focus on the 317 participants who provided answers in both waves of the survey, allowing us to form a sample of panel responses for examination of the change at the individual level. The findings are organized around the two main topics for the three main groups of respondents. The first section discusses the changes in transportation modes use of all 317 survey participants and the shift in the travel behavior of a separate group of 211 respondents who traveled for work or education purposes regularly pre-pandemic. The other part of the paper discusses the changes in attitudes in the full panel sample as well as the shift in perspectives of 155 participants who have never stopped using transit. For the general analysis presented in table 2, we considered a respondent to be a transit rider if they answered yes to the question: “Have you used public transit in Metro Vancouver (Bus, SkyTrain, West Coast Express, and/or SeaBus) before March 2020 (preCOVID-19 pandemic)?” while for work/education commuters discussed in table 3, we considered as transit riders those who selected public transportation in the question “Please think of the trip that you most often take (for example, your trip to work). Before the COVID-19 pandemic, what was the primary mode of transportation you used for this trip? For round trips, please consider the outward trip only.” Finally, we conducted a two-proportion test on the change in transit use and vehicle ownership between the waves and found them insignificant, while the chi-square test for the change in modes for commuters indicated a statistical significance of those findings.
We present the summary of demographics for that sample in Table 1 and compare it to the Vancouver census metropolitan area 2016 Census Profile. As the table shows, the sample roughly represents the population of the region in terms of age and gender, with only the 55-64 age group being significantly larger than in Metro Vancouver, while it is less reflective of the region’s demographics in terms of income, except for the $100,000 - $199,999 income group.
3. Findings
A summary of general transit use (for any travel purpose) among our panel respondents is provided in Table 2. In May 2021, 59% of respondents used transit, which was a 3.9% increase compared to December 2020. Women are slightly overrepresented in this sub-sample, so the observed difference in shares of riders and non-riders between genders is not significant, as they are comparable to the size of gender groups in the sub-sample.
Change in transport modes use
The medium income group ($50,000 - $79,999) accounted for the largest share of transit users in May 2021, and it also saw an increase of 11.1% compared to December 2020. With regard to employment, the continued predominance of remote work and education during both waves of the survey resulted in no dramatic change in transit use between December 2020 and May 2021. Full-time employed workers were still the major group of transit users (40.6% in May 2021), followed by retired residents (21.4% in May 2021). Finally, 55.1% of those who used transit at the end of the Spring had access to a vehicle (32.5% of the full sample), while car access was at 83.1% for those who did not use transit in May 2021 (34.1% of the full sample). Overall, car access in our sample has increased by 2% between the two waves.
Focusing specifically on those 211 respondents who traveled regularly for work or education purposes pre-pandemic (Table 3), the number of commuters plummeted by 43.6% between March 2020 (before the COVID-19 restrictions) and May 2021, which is to be expected due to the prevalence of stay-at-home orders and remote work arrangements. The share of transit riders in this sub-sample decreased by 69.2% from the pre-pandemic level, which resembles the trend that TransLink observed in the first quarter of 2021 when boardings were 52.1% lower than in Q1 of 2020 (TransLink 2021). At the end of May, private vehicle drivers became the dominant group among work/education commuters, accounting for 39.5% of respondents.
Change in attitudes of transit riders
Almost one-half of the respondents used transit both in December 2020 and in May 2021 (155 users). Masks have been mandatory on TransLink service since August 2020 (Zussman 2020), and in Figure 1 it is visible that 67% of current riders agreed that they have felt safe on transit when everyone around has been wearing a mask. At the same time, more people decreased than increased their agreement with the statements regarding concerns for safety and nervousness due to crowding, indicating that the overall sentiment for safety on transit in our sub-sample changed to a more favorable view. Regarding general passengers’ experience with crowding, we observed an increase of 35% in respondents who either agreed or strongly agreed that they experienced crowding on transit.

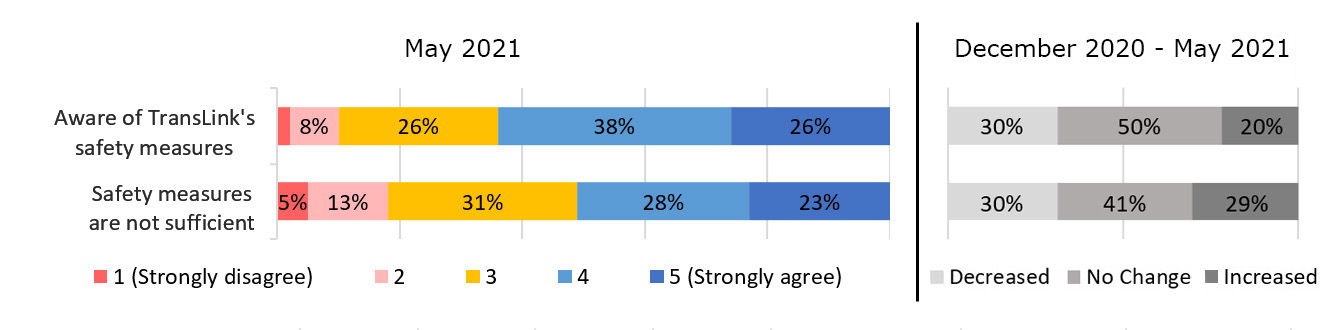
Figure 2 shows that almost two-thirds of the full sample (317 respondents) were aware of TransLink’s safety measures at the end of Spring 2021, however, it seems that more people became less informed between December 2020 and May 2021 (30% decreased their agreement with the awareness statement, while only 20% increased it). At the same time, almost half of the sample agreed that the safety measures on transit remained insufficient.

There is no information on the vaccination status of the transit riders, but it is worth noting that the second wave of the survey ran in May 2021, when at least 60% of adults in Metro Vancouver were vaccinated against COVID-19 with the first dose (Government of British Columbia 2021). At that moment, 105 respondents had not used transit since the beginning of the pandemic, and 73% of those still agreed that they would return to transit only with the prevalence of vaccination, community immunity, or broad successful treatments.
Discussion
Overall, the review of our panel data confirmed that 3.9% of respondents returned to transit during the pandemic, while 2% of the sample obtained new access to a vehicle between December 2020 and May 2021. A more dramatic shift could be observed among commuters, as the share of public transit dropped by 69.2% from the pre-pandemic level while driving grew by 11.9% in that group. Moreover, the majority of respondents who stopped using transit since the onset of the pandemic are not expected to return until the ubiquity of vaccination or advancements in COVID-19 treatment is achieved. At the same time, fewer people are aware of TransLink’s safety measures or consider them to be sufficient. These findings suggest that the agency will have to go above and beyond to welcome those riders back, including management of the station and in-vehicle crowding levels, active communication of its cleaning practices and safety protocols, as well as assessment of riders satisfaction, though the latter has already been found to be less relevant in the context of the COVID-19 pandemic (Rauws and van Lierop 2020). Strategies like these can also help to retain existing riders, as some of those already started experiencing crowding and are still concerned for their safety onboard. On the other hand, the effect of the pandemic on traditional work arrangements can not be underestimated. The existing prevalence of work from home in the region, as well as increased flexibility introduced by employers that reduces the need for employees to travel regularly for work, are among the factors that will continue affecting the transport behavior of Metro Vancouver residents beyond the safety concerns.
Acknowledgements
The authors are grateful for the financial support and cooperation provided by TransLink’s New Mobility Lab that made this research possible. We are also thankful to professor Dick Ettema for his thoughtful review of and feedback on the survey design.